Back to Journals » Drug Design, Development and Therapy » Volume 20
Identification of Antibacterial Hits Associated with Penicillin-Binding Protein 2 in Escherichia coli Using a Comprehensive Property Spectrum and Fivefold Maximum Drug-Likeness Strategy
Authors Zhu H ![]() , Du S, Yang Q, Xu L
, Du S, Yang Q, Xu L ![]() , Shi W
, Shi W
Received 21 March 2026
Accepted for publication 3 June 2026
Published 9 June 2026 Volume 2026:20 595430
DOI https://doi.org/10.2147/DDDT.S595430
Checked for plagiarism Yes
Review by Single anonymous peer review
Peer reviewer comments 2
Editor who approved publication: Professor Anastasios Lymperopoulos
Haoyu Zhu,1 Shijie Du,1 Qin Yang,2 Lu Xu,1,3 Wei Shi1
1College of Material and Chemical Engineering, Tongren University, Tongren, Guizhou, People’s Republic of China; 2School of Physics and Optoelectronic Engineering, Yangtze University, Jingzhou, Hubei, People’s Republic of China; 3School of Sports and Health Science, Tongren University, Tongren, Guizhou, People’s Republic of China
Correspondence: Lu Xu, College of Material and Chemical Engineering & School of Sports and Health Science, Tongren University, Chuandong Education Park, Bijiang District, Tongren, 554300, People’s Republic of China, Email [email protected] Wei Shi, College of Material and Chemical Engineering, Tongren University, Chuandong Education Park, Bijiang District, Tongren, 554300, People’s Republic of China, Email [email protected]
Purpose: Early-stage antibacterial candidate selection requires balancing antibacterial activity with broader developability-related properties. This study developed and applied a Fivefold Maximum Drug-Likeness strategy (5F-MDL) for prioritizing antibacterial candidates against Escherichia coli.
Methods: An ensemble of deep learning models generated a 33-dimensional property spectrum covering physicochemical, pharmacokinetic, efficacy-related, safety, and stability endpoints. Approximately 16 million commercial molecules were screened, and fifteen candidates were experimentally evaluated by disk diffusion and broth microdilution. Molecular docking, molecular dynamics simulations, and a Bocillin-FL competition assay examined potential PBP2-associated interactions.
Results: The fifteen prioritized candidates showed high property-spectrum similarity to reference antibiotics, with scores ranging from 0.929 to 0.971. Broth microdilution identified several molecules with measurable antibacterial activity, among which M2 showed the most balanced overall profile, including an MIC of 25.6 μg/mL and the largest inhibition zone among the candidates. Docking in the 549 Å3 active-site-associated cavity of PBP2 supported a plausible M2–PBP2 binding pose, and 200 ns molecular dynamics simulations supported the stability of the modeled complex. The Bocillin-FL assay further suggested that M2 could interfere with probe labeling of PBP2 in vitro.
Conclusion: The 5F-MDL workflow provides a multidimensional property-spectrum-based approach for early-stage antibacterial candidate prioritization. M2 was identified as a preliminary lead-like hit, although its mechanism, safety profile, and broader applicability require further validation.
Keywords: fivefold maximum drug-likeness, deep learning, virtual screening, antibacterial discovery, Escherichia coli, penicillin-binding protein 2
Introduction
Drug discovery remains central to the fight against major diseases. For high-burden conditions such as cancer, human immunodeficiency virus/acquired immunodeficiency syndrome (HIV/AIDS), and tuberculosis, each advance in pharmaceutical research and development can improve treatment for tens of millions of patients.1–6 Nevertheless, the enterprise is marked by persistent inefficiency, protracted timelines, and high attrition. Of the tens of thousands of synthesized and tested compounds, approximately 100 are advanced for development consideration, about 10 enter clinical trials, and only 1 is ultimately approved; the entire process often exceeds a decade.7–9 The tension between urgent medical need and high failure rates is driving the emergence and refinement of more efficient and systematic discovery paradigms.
Drug research and development has progressed from empirical practice to systematic, rational design. Early trial-and-error work in lead optimization and activity screening laid the foundation.10–13 Later, high-throughput screening (HTS) and rational drug design (RDD) became mainstream. HTS enables rapid testing of very large libraries,14,15 but it often yields many false positives, shows limited clinical translatability, and entails high costs and technical barriers.16–20 RDD uses three-dimensional target structures and mechanism-of-action models to improve specificity and efficiency,21–23 but it depends on reliable structural data and well-understood mechanisms.24–26 Computer-aided drug design (CADD) integrates molecular docking, quantitative structure-activity relationship (QSAR) modeling, molecular dynamics (MD) simulations, and pharmacophore methods.27,28 In this toolkit, molecular docking predicts binding modes and affinities;29,30 QSAR builds quantitative models of structure-activity relationships;31,32 MD probes interaction stability and allosteric effects;33,34 and pharmacophore modeling captures three-dimensional activity features and guides virtual screening.35–37 These methods have also been valuable in public health emergencies.38,39 However, current CADD practice has long focused on efficacy (activity and affinity), with limited attention to key dimensions of druggability, including physicochemical developability, absorption, distribution, metabolism, and excretion (ADME), safety, and molecular stability. This imbalance has contributed to failures during the transition from lead to candidate and to rising development costs.16–20,24–26,29–37 Therefore, a systematic framework that centers on multidimensional developability, while balancing efficiency and translatability, is needed.
Deep learning is particularly suitable for this objective because multidimensional drug-likeness modeling requires the simultaneous approximation of heterogeneous and nonlinear relationships between molecular structure and diverse endpoints. Compared with traditional single-endpoint QSAR or shallow machine-learning models, deep neural networks can learn hierarchical representations from high-dimensional molecular descriptors and capture complex structure–property relationships across physicochemical, pharmacokinetic, efficacy-related, safety, and stability dimensions.31,32 Therefore, in this study, deep learning was used not merely as an activity-prediction tool but as a representation-learning strategy to construct a unified 33-dimensional property spectrum for multidimensional candidate prioritization.
In response to these gaps, we propose Maximum Drug-Likeness (MDL) and formulate the Fivefold MDL (5F-MDL) paradigm. In this paradigm, the screening objective is integrated similarity to approved drugs across five dimensions: physicochemical properties, pharmacokinetics, efficacy, safety, and stability. Candidate molecules were prioritized according to their integrated similarity to approved drugs across the five dimensions. To realize this objective, we used large-scale molecular structure and activity data to build, within an ensemble deep learning framework, a set of QSAR models for predicting properties across the five dimensions. We then prioritized molecules with favorable integrated profiles under the 5F-MDL criteria from large screening libraries. We further used experimental validation together with molecular docking and molecular dynamics analyses to examine whether prioritized compounds showed activity and target-relevant interaction patterns consistent with the screening predictions.27–34 This approach is intended to support early-stage candidate prioritization by reducing reliance on single-dimension optimization and by incorporating multidimensional developability-related features.
Within this framework, we adopted Escherichia coli (E. coli) as the reference pathogen for molecular selection and evaluated the 5F-MDL method in a Gram-negative antibacterial candidate prioritization setting. E. coli is a common Gram-negative opportunistic pathogen and a major public health threat.40–43 In 2024, the World Health Organization (WHO) continued to classify carbapenem-resistant Enterobacteriaceae (CRE) as critical priority pathogens.44 E. coli is a leading cause of urinary tract infections and is associated with multiple hospital-acquired infections.45,46 Clinical treatment has relied primarily on β-lactam antibiotics that target penicillin-binding proteins (PBPs), with penicillin-binding protein 2 (PBP2) playing a pivotal role.47–49 However, enzyme-mediated hydrolysis, reduced membrane permeability, target-site mutations, and bypass pathways limit drug affinity and exposure, leading to therapeutic failure.50–60 The global burden of resistance continues to rise, with high isolation rates reported in some regions,61,62 while innovation in new scaffolds for Gram-negative pathogens remains limited.63–65 Against this backdrop, the 5F-MDL paradigm is intended to prioritize molecules with balanced predicted profiles across physicochemical, pharmacokinetic, efficacy-related, safety, and stability dimensions, while retaining relevance to antibacterial target engagement such as PBP2-related activity.47–49,53–56
In summary, we developed a 5F-MDL strategy and an ensemble deep learning-based screening workflow for E. coli-related molecular prioritization. Molecular docking, molecular dynamics analysis, and experimental evaluation provided preliminary case-based support for the feasibility of this workflow.65 We suggest that this framework may serve as a useful approach for early-stage candidate prioritization in antibacterial drug discovery, although its broader applicability and practical value remain to be further investigated.
Materials and Methods
MDL and 5F-MDL
To improve efficiency in early-stage drug screening, we introduced MDL, defined as the highest attainable similarity between candidate molecules and clinically approved drugs across the broadest practical chemical space. Based on this concept, an operational implementation termed 5F-MDL was developed and implemented in the commercial 5FMDL Screener (Real-Drug Technology Co., Ltd., Shanghai, China). Five dimensions are evaluated: physicochemical properties, pharmacokinetics, efficacy, safety, and stability. Each dimension is represented by a defined set of deep-learning submodels (Figure 1). Under the 5F-MDL paradigm, candidate molecules are prioritized according to their integrated similarity to approved drugs across all five dimensions.
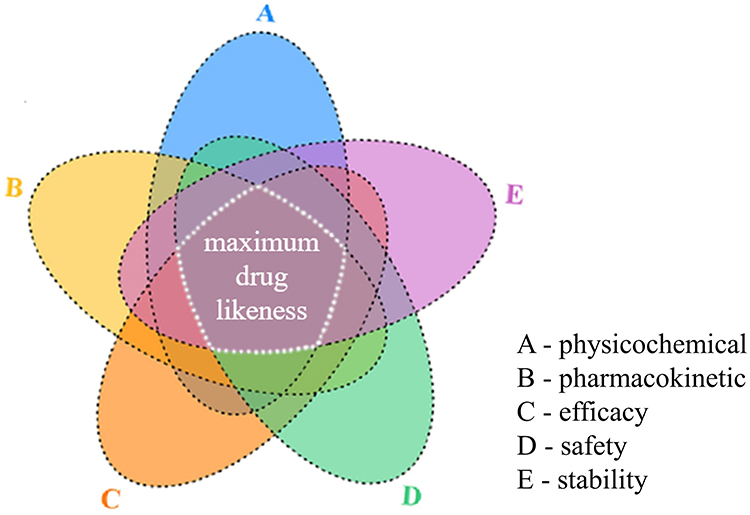 |
Figure 1 Conceptual framework of the 5F-MDL strategy. The 5F-MDL quantifies overall drug-likeness by integrating five complementary dimensions: physicochemical properties, pharmacokinetics, efficacy, safety, and stability. |
Physicochemical properties are the fundamental physical and chemical attributes of a molecule and define its developability window. We consider molecular weight; calculated partition coefficient (cLogP); distribution coefficient (logD); acid dissociation constant (pKa); hydrogen bond donor and acceptor counts; topological polar surface area (tPSA); and aqueous solubility. These values are expected to fall within distributions typical of approved drugs to maintain solubility, permeability, and formulation feasibility.
Pharmacokinetics describes whole-body disposition, namely ADME. It includes absorption and bioavailability; distribution (volume of distribution, Vd; tissue penetration; and plasma protein binding); metabolic pathways and clearance; and terminal half-life.
Efficacy refers to the pharmacological effect observed in relevant experimental systems. Emphasis is placed on potency-related metrics (half-maximal inhibitory concentration, IC50; half-maximal effective concentration, EC50; and minimum inhibitory concentration, MIC), supportive target-relevant evidence when available, and the effective range for the intended indication, so that the desired biological effect can be achieved under practically relevant conditions.
Safety covers tolerability and risk boundaries. It includes cellular and organ toxicities, genotoxicity, cardiovascular liabilities (for example, inhibition of the human ether-a-go-go-related gene channel, hERG), hepatic and renal risks, immunological and endocrine effects, drug-drug interaction liability, and therapeutic index. The objective is to achieve risk profiles comparable to or better than those of approved drugs.
Stability refers to the preservation of structure and activity from research through clinical use. It includes chemical and physical stability (thermal, photolytic, oxidative, and hydrolytic), solid-state and solution stability, plasma and metabolic stability, and compatibility with shelf-life, transport, and storage requirements, thereby ensuring quality control and clinical usability.
Given the availability of QSAR data, 33 specific properties spanning these five dimensions were selected as feature dimensions (see Table S1).
Data
Clinically Approved Anti-Escherichia coli Drug Set
This dataset includes three clinically approved drugs with activity against E. coli. The agents are cephalosporin antibiotics within the β-lactam class. Their principal molecular target is PBP2, a key enzyme in bacterial cell wall biosynthesis. These agents are important options for treating infections caused by susceptible E. coli, with primary indications that include urinary tract infections, intra-abdominal infections, bacteremia, and pelvic inflammatory disease. The names and chemical structures of the three drugs are shown in Figure 2.
 |
Figure 2 Chemical structures of the three reference PBP2 inhibitors used to define the 5F-MDL similarity space. Cefradine, cefuroxime, and ceftriaxone were selected as reference compounds for calibrating multidimensional drug-likeness and guiding similarity-based prioritization. |
Candidate Molecule Set
Screening libraries were obtained from eMolecules (San Diego, California, United States), TargetMol Chemicals Inc. (Shanghai, China), and MedChemExpress (Shanghai, China). In total, approximately 16 million commercially available small molecules with diverse chemical structures and well-characterized physicochemical properties were included in the screening set. Most compounds conformed to Lipinski’s Rule of Five.
Drug Screening Guided by Fivefold Maximum Drug-Likeness
To enable screening guided by 5F-MDL, a QSAR framework based on an ensemble of deep neural networks was developed. The framework was organized into three modules (Figure 3): (i) supervised pretraining of ensemble deep learning models on 33 molecular properties; (ii) maximum-similarity (Max-Sim) transfer scoring relative to reference drugs; and (iii) generation of the final drug-likeness score,  . A transfer learning paradigm was adopted. Design details, mathematical formulations, training protocols, and robustness control measures are provided below.
 |
Figure 3 Overall architecture of the 5F-MDL screening workflow. An ensemble of 33 deep learning submodels is used to construct a 33-dimensional property spectrum for evaluating similarity to clinically approved drugs across five dimensions: physicochemical properties, pharmacokinetics, efficacy, safety, and stability. |
Data Curation and Standardization for Property-Specific Submodels
The training data for the 33 property-specific submodels were compiled from publicly available labeled sources, including ChEMBL, PubChem, ToxCast, the United States Environmental Protection Agency Distributed Structure-Searchable Toxicity (EPA DSSTox) database, and previously reported QSAR datasets. Because the availability, assay format, and label type differed substantially among endpoints, data curation was performed independently for each property rather than by constructing a single universal dataset shared by all 33 submodels.
For each endpoint, molecular structures were first standardized before descriptor calculation. Salt fragments, solvent molecules, counterions, inorganic species, mixtures, and records with invalid or incomplete structural information were removed. When multiple fragments were present, the largest organic fragment was retained. Molecular structures were then normalized to a consistent representation by standardizing aromaticity, valence states, and common functional-group formats, followed by generation of canonical structure identifiers. Molecules that failed descriptor calculation or contained unsupported atoms for descriptor generation were excluded.
Duplicate structures were handled at the endpoint level. For regression endpoints, all activity or property values were converted to consistent units before merging. When duplicate records for the same molecule and endpoint showed comparable values, the median value was retained to reduce the influence of assay-to-assay variation. When duplicate records showed conflicting values beyond an endpoint-specific acceptable range, or when the assay condition was insufficiently defined, the corresponding record was removed. For classification endpoints, duplicate records with consistent labels were merged, whereas molecules with contradictory positive and negative labels for the same endpoint were excluded from model training. These procedures were applied to reduce label noise and avoid over-representation of repeatedly reported compounds.
After curation, the final dataset size remained endpoint-specific. The detailed numbers of training, validation, and testing samples for each of the 33 submodels are provided in Table S1. In total, 7,827,918 endpoint-specific labeled records were retained across the 33 property datasets, including 5,478,812 records for training, 1,173,498 records for validation, and 1,175,608 records for testing. These numbers represent labeled endpoint records rather than unique chemical entities, because the same molecule may have available labels for more than one property. The curated datasets covered physicochemical, pharmacokinetic, efficacy-related, safety, and stability endpoints, thereby providing a chemically and biologically heterogeneous basis for constructing the 33-dimensional property spectrum.
To minimize data leakage, model splitting was performed after structure standardization and duplicate removal. For each endpoint, the curated molecules were randomly divided into training, validation, and independent test sets at an approximate ratio of 70%:15%:15%. The downstream commercial screening libraries, including eMolecules, TargetMol, and MedChemExpress, were not intentionally included as training sources. However, because some vendor compounds may also appear in public chemical databases, limited molecule-level overlap could not be completely excluded. This point was considered when interpreting the screening results, and the present study was therefore positioned as a proof-of-concept prioritization workflow rather than a definitive prospective validation of model generalizability.
Molecular Input and Representation
Each molecule was represented by 3,599 two-dimensional molecular descriptors computed with Dragon 7. These descriptors span atom-level, bond-level, and whole‑molecule features. They were used to build QSAR models for 33 properties across five domains: physicochemical properties, pharmacokinetics, efficacy, safety, and stability (see Table S1). Together, these 33 properties provide a multidimensional view of molecular characteristics from five complementary perspectives, with the goal of closely approximating the MDL feature space relevant to biological activity and developability-related safety.
Supervised Pretraining of the Deep Ensemble
Independent predictor submodels were trained for each of the 33 key molecular properties listed in Table S1. After endpoint-specific data curation and structure standardization, each property dataset was divided into training, validation, and independent test sets at an approximate ratio of 70%:15%:15%. Feature selection was then performed using the scikit-learn feature_selection module (Python 3.6) with random forest models. Feature importances were estimated, and features exceeding a predefined importance threshold were retained via the SelectFromModel procedure, in order to improve the performance of the subsequent deep learning models on both regression and classification tasks.
All 33 submodels adopted a deep neural network architecture with three fully connected hidden layers of 2048, 1024, and 128 units (Figure S1). All hidden layers used ReLU activation and were regularized with dropout (rate  0.2) and weight decay (
 ) to mitigate overfitting. The third hidden layer served as a 128-dimensional bottleneck representation. The output layer depended on task type: a linear node for regression tasks and a sigmoid node for classification tasks. Models were trained using the AdamW optimizer (learning rate
  ; batch size
  128) with early stopping (patience
  10).
10).
For regression tasks, the mean squared error (MSE) loss was used:
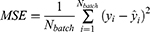
where  denotes the batch size,
  is the reference value, and
  is the prediction, respectively.
For classification tasks, the binary cross-entropy loss was used:
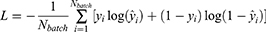
where  denotes the reference label and
  denotes the predicted probability.
Evaluation on the test sets used the coefficient of determination ( ) for regression tasks and the area under the receiver operating characteristic curve (AUC) for classification tasks. Performance on the independent test sets is summarized in Table S2.
Applicability Domain Control and  Scoring
To reduce the risk of unreliable extrapolation during large-scale virtual screening, applicability-domain and prediction-reliability controls were applied before final  -based ranking. Because the 33 property-specific submodels were trained using Dragon molecular descriptors, the applicability domain was evaluated in the same descriptor space used for model construction. Molecules with invalid structures, failed descriptor calculation, unsupported atom types, or missing descriptor values were excluded before property prediction. In addition, molecules with descriptor profiles far outside the distribution of the corresponding training data were flagged as potentially out of domain.
Prediction-range monitoring was also performed before construction of the final 33-dimensional property spectrum. For regression endpoints, predictions substantially outside the range of the corresponding training labels were considered less reliable. During min–max normalization, property components requiring clipping to the  interval were recorded as potential extrapolation signals. Molecules showing extensive out-of-domain descriptor profiles or frequent prediction-range clipping across the 33 property dimensions were not prioritized for final
  -based ranking. The applicability-domain assessment was based on descriptor-range consistency with the corresponding training-set distributions and prediction-range monitoring after model inference. These controls were intended to reduce the influence of out-of-distribution predictions before maximum-similarity scoring, although they cannot completely eliminate prediction uncertainty for structurally novel chemotypes.
After these applicability-domain and prediction-reliability controls, candidate–reference similarity was quantified in a common mathematical space. A fivefold property spectrum was generated using the 33 trained submodels. For any molecule, this spectrum was represented as a vector  . Because the raw properties span heterogeneous physical scales (for example, boiling point on the order of 300–600 K versus toxicity probabilities in
  ), direct comparisons would be dominated by large-magnitude quantities. Accordingly, normalization procedures were applied. For regression-type properties that span orders of magnitude (for example, MIC, inhibition constant (Ki), and median lethal dose (LD50)), log transformations were applied during model training. At prediction time, outputs were min-max normalized using the training-set statistics, with clipping to the unit interval to guard against out-of-distribution values:
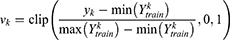
where is the raw prediction for property k,  is the set of training labels for property k, and
  . This ensured that each normalized component
  lies in
  . For classification properties (for example, human Ether-à-go-go-Related Gene (hERG) risk and chemical stability), the model’s positive-class probability was used directly, which naturally lies in
  and preserves confidence information.
Through these steps, each molecular property spectrum  was mapped to the 33-dimensional unit hypercube
  . Because the values in
  carry absolute biological meaning, that is, the magnitude of each component reflects the predicted strength or probability of the corresponding property, direction-only similarity measures such as cosine similarity may underweight absolute differences between candidates and reference drugs. A Euclidean distance-based measure was therefore used to compute the initial composite score
  :
:
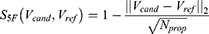
where  and
and  are the normalized property vectors of the candidate and reference molecules, respectively,
  is the dimensionality, and
  denotes the Euclidean norm. The denominator
  is the maximum theoretical distance in this unit hypercube, ensuring that
  , with values approaching 1.0 only when the candidate and reference molecules are very close across all 33 property dimensions. The final score for a candidate molecule was defined as the maximum
  across all reference drugs.
In the present proof-of-concept implementation, all 33 properties were assigned equal weight after normalization. This unweighted formulation was selected as a transparent baseline to avoid introducing subjective or indication-specific weighting factors before systematic prospective validation. It also allows the contribution of each property dimension to be inspected directly without imposing prior assumptions regarding the relative importance of physicochemical, pharmacokinetic, efficacy-related, safety, or stability endpoints. Therefore, the unweighted  score should be interpreted as a global property-spectrum similarity measure rather than as a clinical developability index or as a replacement for endpoint-specific safety and efficacy thresholds.
Nevertheless, different properties may not contribute equally to practical drug development. For example, a severe toxicity liability may represent a hard developmental barrier, whereas a moderate deviation in molecular weight or lipophilicity may be acceptable if other properties are favorable. The 5F-MDL framework is therefore compatible with a weighted scoring strategy, which can be expressed as:
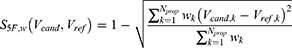
where  denotes the weight assigned to the
  -th property. In future indication-specific applications, critical endpoints such as severe toxicity risk, antibacterial potency, aqueous solubility, and membrane permeability could be assigned higher weights or used as hard filters. However, because robust weighting requires disease context, endpoint reliability assessment, and prospective validation, the unweighted
  score was retained as the primary ranking metric in the present study.
External Validation and Evaluation Metrics
On the basis of the computed composite score  , a ranking-based prioritization strategy was implemented. To comprehensively cover the bioactivity profiles of distinct reference drugs, candidate molecules were separately matched against three reference drugs, ranked in descending order of score within each group, and the top five per group were retained. This stratified selection ensured close alignment with the reference profiles in the high-dimensional property space while preserving scaffold diversity. In total, fifteen top-ranked candidate small molecules were selected for experimental validation. Validation was conducted through antibacterial activity testing, structure-based molecular docking, molecular dynamics simulations, MM-PBSA analysis, and a Bocillin-FL competition assay.
Antibacterial Activity Testing
An adapted Kirby–Bauer disk diffusion assay was employed for preliminary antibacterial screening of the fifteen candidates. E. coli ATCC 25922 was inoculated into Mueller–Hinton broth (MHB), cultured at 37 °C to the logarithmic phase, and adjusted with sterile normal saline to a turbidity equivalent to a 0.5 McFarland standard (approximately  colony-forming units per milliliter, CFU/mL). The bacterial suspension was then uniformly spread onto Mueller–Hinton agar (MHA) plates.
Candidate molecules and positive control antibiotics (cefradine, cefuroxime, and ceftriaxone) were dissolved in dimethyl sulfoxide (DMSO), and drug-impregnated disks were prepared (30 µg per disk; DMSO content maintained below 1% to exclude solvent effects). Disks were placed on the inoculated plates, which were incubated inverted at 37 °C for 16–18 hours. Inhibition zone diameters (millimeters) were measured and recorded. The disk diffusion assay was used as an initial diffusion-dependent phenotypic screen, and all fifteen prioritized candidates were further evaluated by broth microdilution.
Determination of MIC and Minimum Bactericidal Concentration (MBC)
To avoid potential false-negative results caused by limited agar diffusion or poor aqueous dispersion in the disk diffusion assay, all fifteen prioritized candidate molecules were further evaluated by broth microdilution, regardless of their disk diffusion performance. The assay was performed in accordance with the Clinical and Laboratory Standards Institute (CLSI) guideline M07-A9. Stock solutions were prepared in dimethyl sulfoxide and serially twofold diluted in cation-adjusted Mueller–Hinton broth (CA-MHB) to yield final well concentrations spanning 1.6–204.8 µg/mL. The final DMSO concentration was maintained below 1%. An inoculum adjusted to  colony-forming units per milliliter was added to compound-containing microplates, which were incubated at 37 °C for 24 h. The MIC was defined as the lowest concentration at which no visible bacterial growth was observed by the unaided eye.
Following MIC determination, 10 µL from each well without visible growth was plated onto Mueller–Hinton agar and incubated at 37 °C for 24 h. The MBC was defined as the lowest concentration resulting in a reduction in colony count of ≥99.9% compared with the initial inoculum. Cefuroxime was used as the positive reference antibiotic, and DMSO and growth controls were included. All measurements were performed in three independent biological replicates.
Molecular Docking Validation
In accordance with published procedures,66 PBP2 (Protein Data Bank (PDB) ID: 6G9P) was selected as the receptor. The protein structure was downloaded from the Research Collaboratory for Structural Bioinformatics Protein Data Bank (RCSB PDB), and the co-crystallized ligand and water molecules were removed. Three-dimensional structures of the candidate molecules and the reference drug (cefuroxime) were constructed using ChemDraw Professional 15.0 and saved in Structure Data File (SDF) format.
Blind docking was conducted using the CB-Dock2 platform.67 Five ligand-accessible cavities were automatically detected, with volumes of 517, 549, 286, 635, and 510 Å3, respectively. To improve the reproducibility of the docking analysis, the center coordinates and docking box sizes of all predicted cavities were recorded. The corresponding cavity information was as follows: 517 Å3 cavity, center 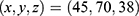 , docking size
  ; 549 Å3 cavity, center
 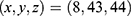 , docking size
  ; 286 Å3 cavity, center
  , docking size
  ; 635 Å3 cavity, center
  , docking size
  ; and 510 Å3 cavity, center
  , docking size
  .
.
The 549 Å3 cavity was selected for detailed target-oriented structural interpretation because it spatially corresponded to the reported penicillin-binding region of E. coli PBP2. This cavity contains residues associated with β-lactam recognition and PBP2 inhibition, including Ser330 and Trp370. Ser330 has been identified as the penicillin-binding active-site residue of E. coli PBP2, and Trp370 has been reported to participate in inhibitor recognition within the PBP2 active site. Therefore, the 549 Å3 cavity was considered suitable for evaluating potential PBP2-associated binding. Protein–ligand complexes and interaction patterns were visualized using PyMOL 3.1.0 and BIOVIA Discovery Studio 2021.
Molecular Dynamics Simulation Validation
To assess the dynamic stability and binding persistence of the ligand–PBP2 complexes, molecular dynamics simulations were performed for the M2–PBP2 complex and the cefuroxime–PBP2 complex using the AMBER 22 software suite. The initial ligand–protein complexes were generated from the docking poses in the 549 Å3 active-site-associated cavity described above, which spatially corresponded to the reported penicillin-binding region of E. coli PBP2. Cefuroxime was modeled in a non-covalent pre-acylation state to provide a reference for comparison of the simulated recognition complex.
Protein parameters were assigned using the ff14SB force field. Ligand parameters were generated using the General AMBER Force Field 2 (GAFF2), and restrained electrostatic potential charges were derived using Gaussian 16. Each system was solvated in a TIP3P water box with a 10 Å buffer, and counterions were added to neutralize the total charge. A standard equilibration protocol was applied before production simulation. Each system was subjected to two-stage energy minimization, first with positional restraints on the solute to relax the solvent and then without restraints for the entire system. The systems were heated from 0 K to 300 K over 50 ps under the constant-volume ensemble, followed by 200 ps equilibration under the constant-pressure ensemble at 1.0 atm and 300 K. Production simulations were then performed for 200 ns under constant-pressure conditions with all restraints removed. A 2 fs time step was used for a total of  steps, and trajectories and energies were saved every 5000 steps. Three independent simulation runs were performed for each complex using different random seeds.
Simulation trajectories were analyzed using the cpptraj module. Backbone root-mean-square deviation (RMSD) was calculated to evaluate overall complex stability, and per-residue root-mean-square fluctuation (RMSF) was calculated to assess local flexibility. The PBP2 structure used in the simulation contained 538 resolved residues, corresponding to PDB residue numbering 57–613 with residues 550–568 absent. Therefore, RMSF values were plotted according to the sequential indices of the resolved residues rather than the original PDB residue numbers. Binding free energies ( ) were estimated using the Molecular Mechanics Poisson–Boltzmann Surface Area (MM-PBSA) method based on the final 10 ns of the 200 ns production trajectories. A total of 1000 frames were extracted for each complex to calculate the binding free energy and its major energetic components, including van der Waals energy, electrostatic energy, polar solvation energy, and non-polar solvation energy.
Bocillin-FL-Based PBP2 Competition Binding Assay
Expression and purification of recombinant E. coli PBP2 were carried out with reference to the methods reported by Levy, Nygaard, and co-workers, with appropriate modifications made to suit the needs of the present study.68,69 A Bocillin-FL-based competition binding assay was used to evaluate whether M2 could interfere with Bocillin-FL labeling of PBP2 within a defined short-time reaction window. Purified PBP2 was added to the reaction mixture at a final concentration of 50 µg/mL and was first preincubated with different concentrations of M2 (25, 50, and 100 µM) in reaction buffer at 37 °C for 10 min. Bocillin-FL was then added to a final concentration of 5 µM, followed by incubation at 37 °C for an additional 10 min. The 10 min post-probe incubation was used to capture the early competitive labeling stage before complete probe saturation. This design was adopted because Bocillin-FL irreversibly labels PBPs through a β-lactam-mediated covalent reaction, whereas the binding mode of M2 has not yet been definitively established. In the present computational workflow, M2 was evaluated using non-covalent docking and molecular dynamics models; therefore, prolonged incubation with Bocillin-FL could potentially reduce the apparent competitive effect if M2 binds reversibly or has a shorter residence time than the irreversible probe. Accordingly, the assay was interpreted as a short-time competition experiment reflecting the ability of M2 to interfere with Bocillin-FL access to or labeling of PBP2, rather than as a direct determination of the covalent or reversible binding mechanism of M2. Cefuroxime (50 µM) was used as the positive control, and DMSO served as the negative solvent control (final concentration <1%). The total reaction volume was 20 µL.
Reactions were terminated by addition of 5× SDS loading buffer followed by heating at 95 °C for 5 min. Samples were separated by 4–12% SDS–PAGE, after which Bocillin-FL fluorescence signals were acquired using a Tanon 5200 multifunctional gel imaging system (Shanghai Tianneng Technology Co., Ltd., Shanghai, China). The same gel was subsequently stained with Coomassie Brilliant Blue to verify consistency of total protein loading. Fluorescence band intensities were quantified using ImageJ software, normalized to the corresponding total protein band intensities, and expressed relative to the DMSO control group. All assays were performed in three independent experiments. Data are presented as mean ± SD, and statistical differences among groups were analyzed using one-way ANOVA followed by Dunnett’s multiple comparison test versus the DMSO control, with p < 0.05 considered statistically significant.
Results
Performance Evaluation of Predictor Submodels
To ensure that the generated property spectrum accurately characterizes molecular bioactivity, the 33 independently constructed submodels were subjected to rigorous performance validation. All models were evaluated on independent test sets, and the results are summarized in Table S2.
Strong predictive performance was observed across both regression and classification tasks. For the 27 regression models (S1–S27), a mean coefficient of determination ( ) of 0.90 was obtained. Models targeting physicochemical properties (S1–S11) exhibited the most robust performance, with a mean exceeding 0.91. Notably, high predictive accuracy was maintained for pharmacokinetic parameters that are typically difficult to model, including bioavailability (S12,
  ) and clearance (S16,
  ), indicating that deep neural networks have a clear advantage in capturing complex structure–activity relationships (SARs).
For the six classification models (S28–S33) related to safety and stability, the mean area under the receiver operating characteristic curve (ROC AUC) reached 0.94. In particular, Ames mutagenicity (S29) and human Ether-à-go-go-Related Gene (hERG) toxicity risk (S30) achieved AUC values of 0.96 and 0.95, respectively. These findings indicate that the ensemble of 33 submodels is sufficiently robust to provide a reliable basis for constructing the high-dimensional property spectrum and for computing the  similarity (Table S2).
Virtual Screening and Property-Spectrum Analysis
Before final  -based ranking, screening molecules were subjected to applicability-domain and prediction-reliability checks to reduce the risk of out-of-distribution extrapolation. Molecules with invalid descriptor calculation, extreme descriptor profiles, or extensive prediction-range clipping across the 33 property dimensions were excluded from final prioritization. The remaining molecules were then ranked according to the unweighted
  score. For each of the three reference antibiotics, namely cefradine, cefuroxime, and ceftriaxone, the five nearest candidate molecules were retained, yielding fifteen prioritized candidates in total (Table 1).
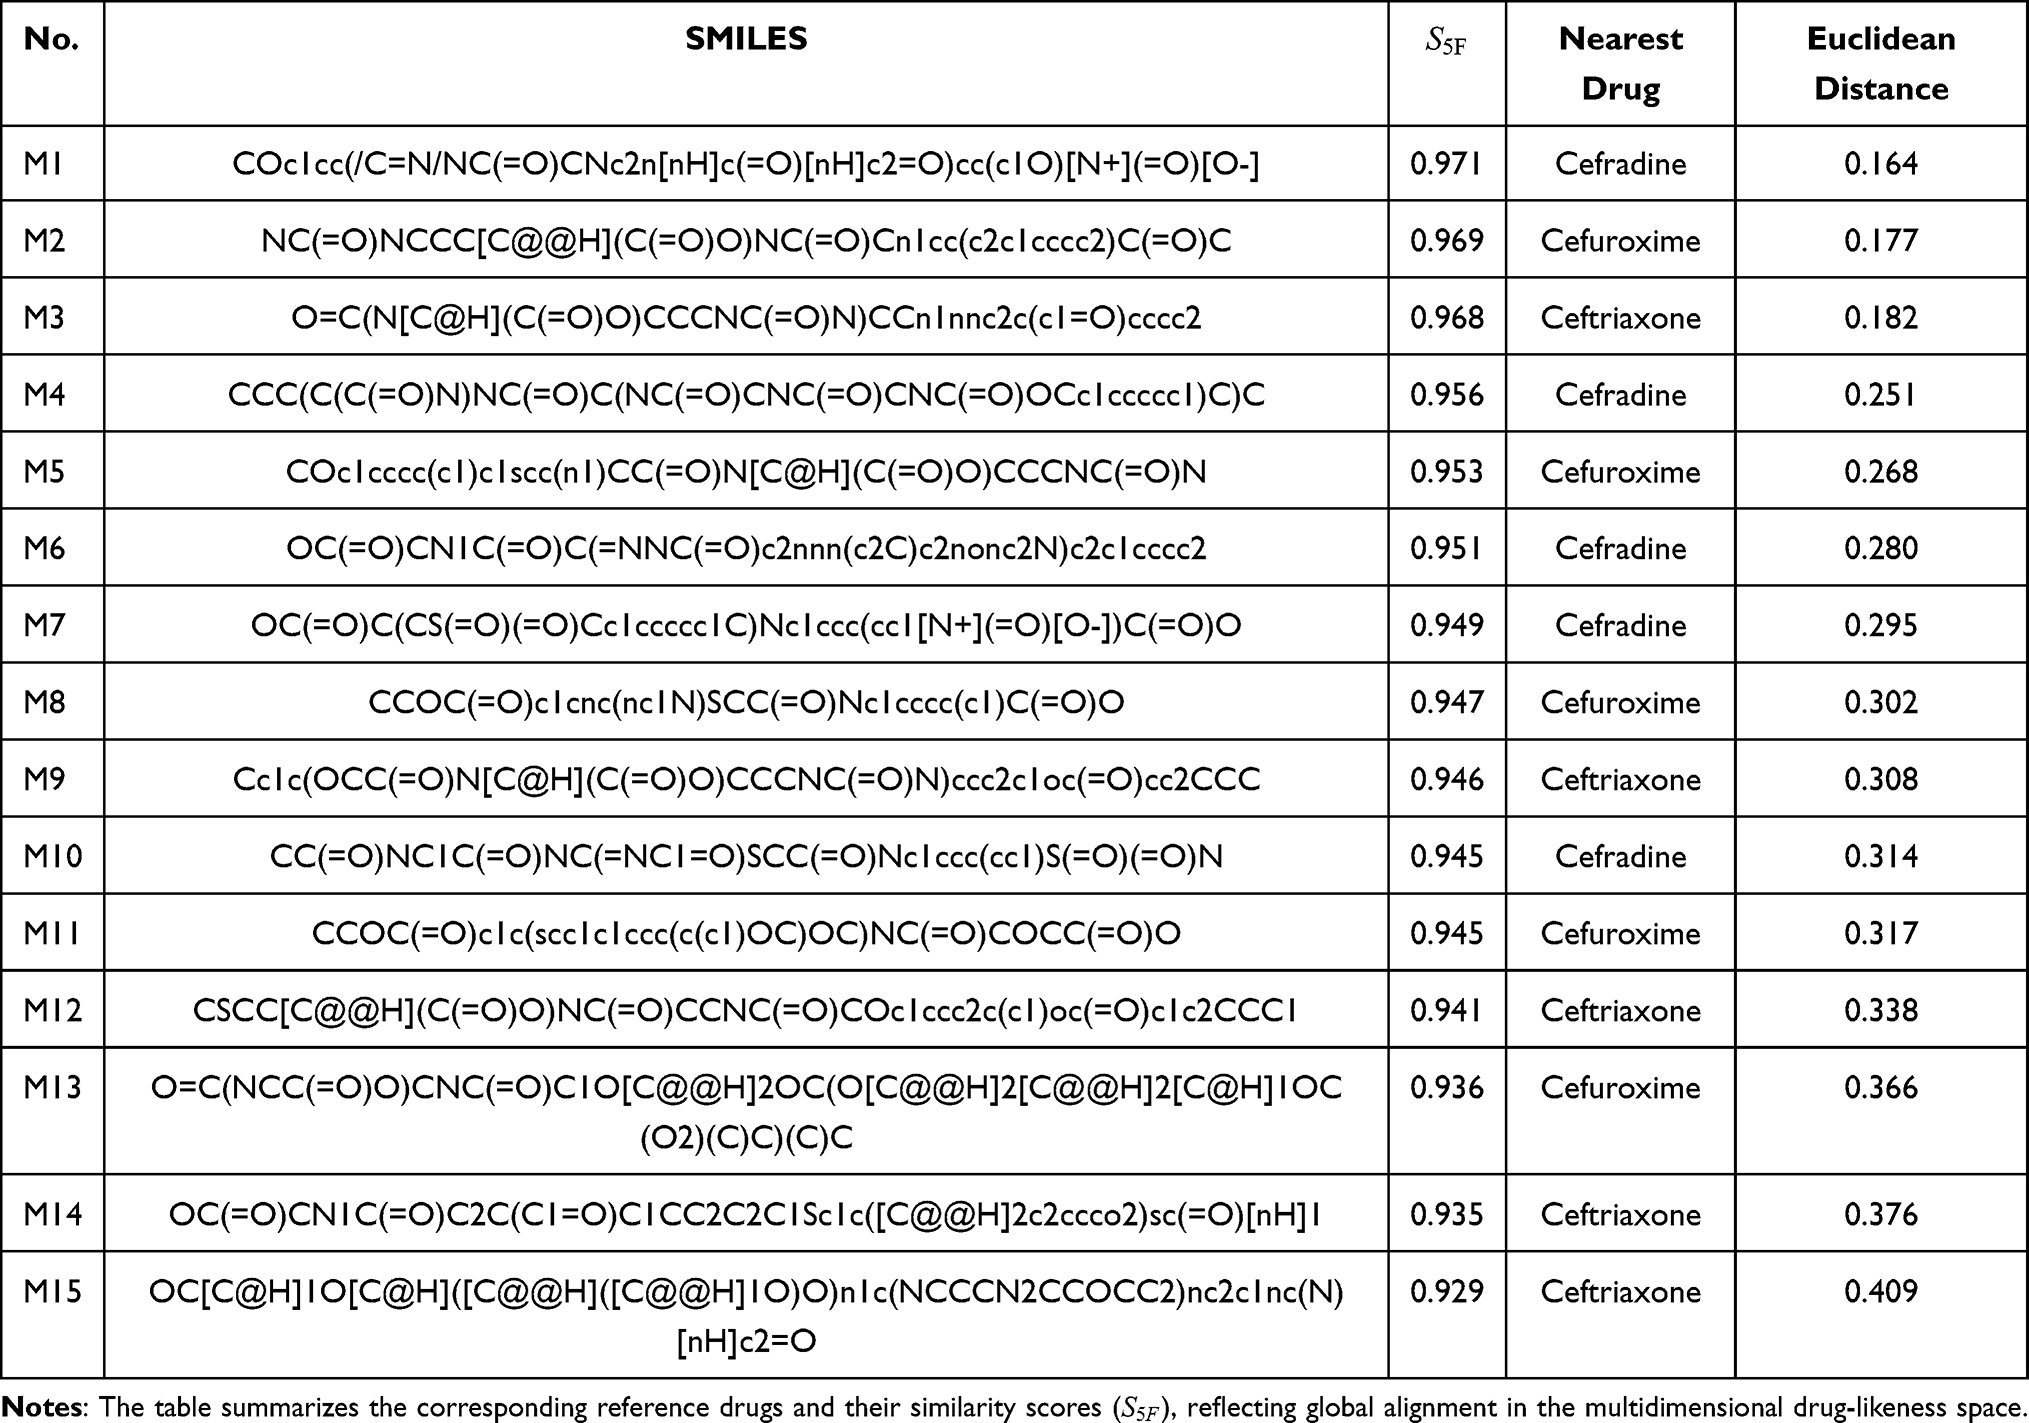 |
Table 1 Prioritized Candidate Molecules Identified by the 5F-MDL Screening Workflow |
The selected molecules showed high global property-spectrum similarity to their nearest reference drugs, with  values ranging from 0.929 to 0.971 and Euclidean distances ranging from 0.164 to 0.409. M1 showed the highest similarity to cefradine, with an
  score of 0.971 and a Euclidean distance of 0.164. M2 showed the highest similarity to cefuroxime, with an
  score of 0.969 and a Euclidean distance of 0.177. M3 showed the highest similarity to ceftriaxone, with an
  score of 0.968 and a Euclidean distance of 0.182. The remaining candidates also maintained high similarity to their corresponding reference drugs, supporting their prioritization for subsequent experimental evaluation.
To further visualize the property-spectrum alignment underlying the  -based ranking, the normalized 33-dimensional property profiles of the reference drugs and their corresponding candidate molecules were plotted (Figure 4). For the cefradine-centered group, M1, M4, M6, M7, and M10 showed broadly similar property-spectrum patterns to cefradine (Figure 4A). For the cefuroxime-centered group, M2, M5, M8, M11, and M13 followed the overall profile of cefuroxime across most property dimensions (Figure 4B). For the ceftriaxone-centered group, M3, M9, M12, M14, and M15 displayed global alignment with ceftriaxone (Figure 4C).
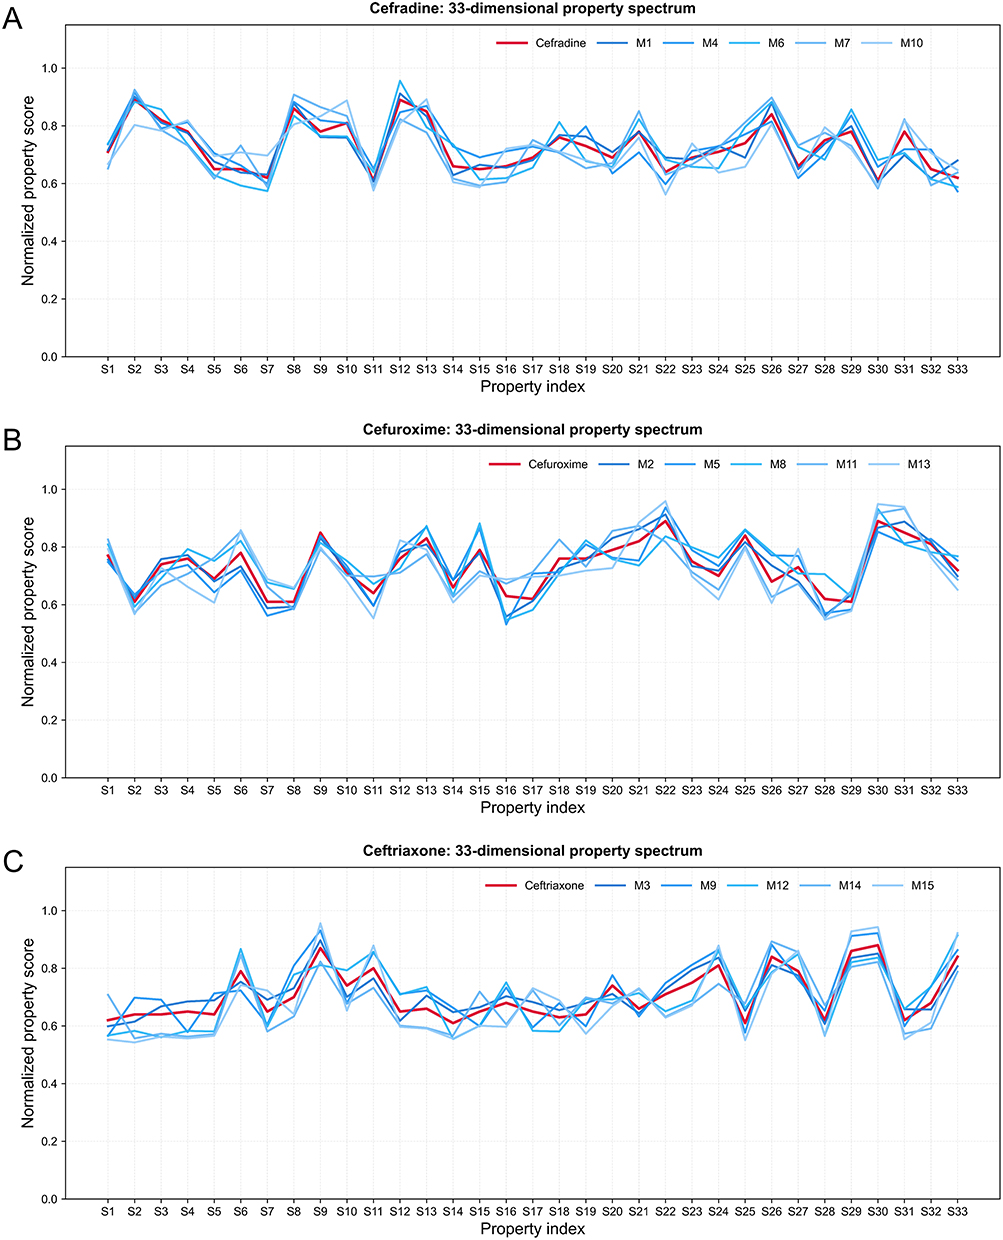 |
Figure 4 Property-spectrum alignment between reference drugs and prioritized candidate molecules. Normalized predicted values are shown for (A) cefradine, (B) cefuroxime, and (C) ceftriaxone (thick red lines) and their respective top five candidate molecules (thin blue lines). The x-axis represents the 33 property indices, and the y-axis represents the normalized property score. |
Although local deviations were observed for individual properties, the overall trends of the candidate molecules were close to those of their nearest reference drugs. This indicates that the 5F-MDL workflow did not prioritize molecules based on a single property, but rather selected compounds with globally reference-like profiles across physicochemical, pharmacokinetic, efficacy-related, safety, and stability dimensions. The inclusion of SMILES strings in Table 1 further supports structural reproducibility and allows subsequent scaffold-level evaluation of the prioritized candidates.
Antibacterial Activity by Disk Diffusion
The phenotypic antibacterial activity of the fifteen prioritized candidates was first assessed using a modified disk diffusion assay. Because disk diffusion is influenced not only by antibacterial potency but also by compound diffusion and dispersion in agar, only compounds producing measurable inhibition zones were included in the quantitative bar chart, whereas compounds without measurable zones were not plotted.
As shown in Figure 5, several candidates produced measurable inhibition zones against E. coli ATCC 25922 at 30 µg per disk. Among the tested candidates, M2 produced the largest inhibition zone, followed by M9, M8, M5, M3, M13, M12, M11, and M1. The remaining candidates produced no measurable inhibition zones under the disk diffusion conditions used in this study. Cefuroxime produced the largest inhibition zone among all tested compounds and was used as the positive reference antibiotic. Representative agar plates are shown for M2, M8, M9, and cefuroxime, which were among the compounds with the most apparent inhibition zones. These results suggested that M2 exhibited the most favorable diffusion-dependent antibacterial phenotype among the candidate molecules. However, because compounds with limited agar diffusion may show weak or undetectable inhibition zones despite retaining broth activity, all fifteen prioritized candidates were further evaluated by broth microdilution.
 |
Figure 5 Disk diffusion analysis of prioritized candidate molecules against Escherichia coli ATCC 25922. Representative agar plates are shown for M2, M8, M9, and cefuroxime, which produced among the most apparent inhibition zones under the tested conditions. The bar chart summarizes the inhibition zone diameters of compounds with measurable zones at 30 µg per disk. Compounds without measurable inhibition zones under the disk diffusion conditions were not included in the bar chart. Cefuroxime was used as the positive reference antibiotic. |
MIC and MBC Determination Results
To provide a diffusion-independent evaluation of antibacterial activity, all fifteen prioritized candidate molecules were evaluated by broth microdilution. As shown in Table 2, the MIC values of the candidate molecules ranged from 25.6 to 102.4 µg/mL against E. coli ATCC 25922. Cefuroxime showed a substantially lower MIC of 3.2 µg/mL and served as the positive reference antibiotic.
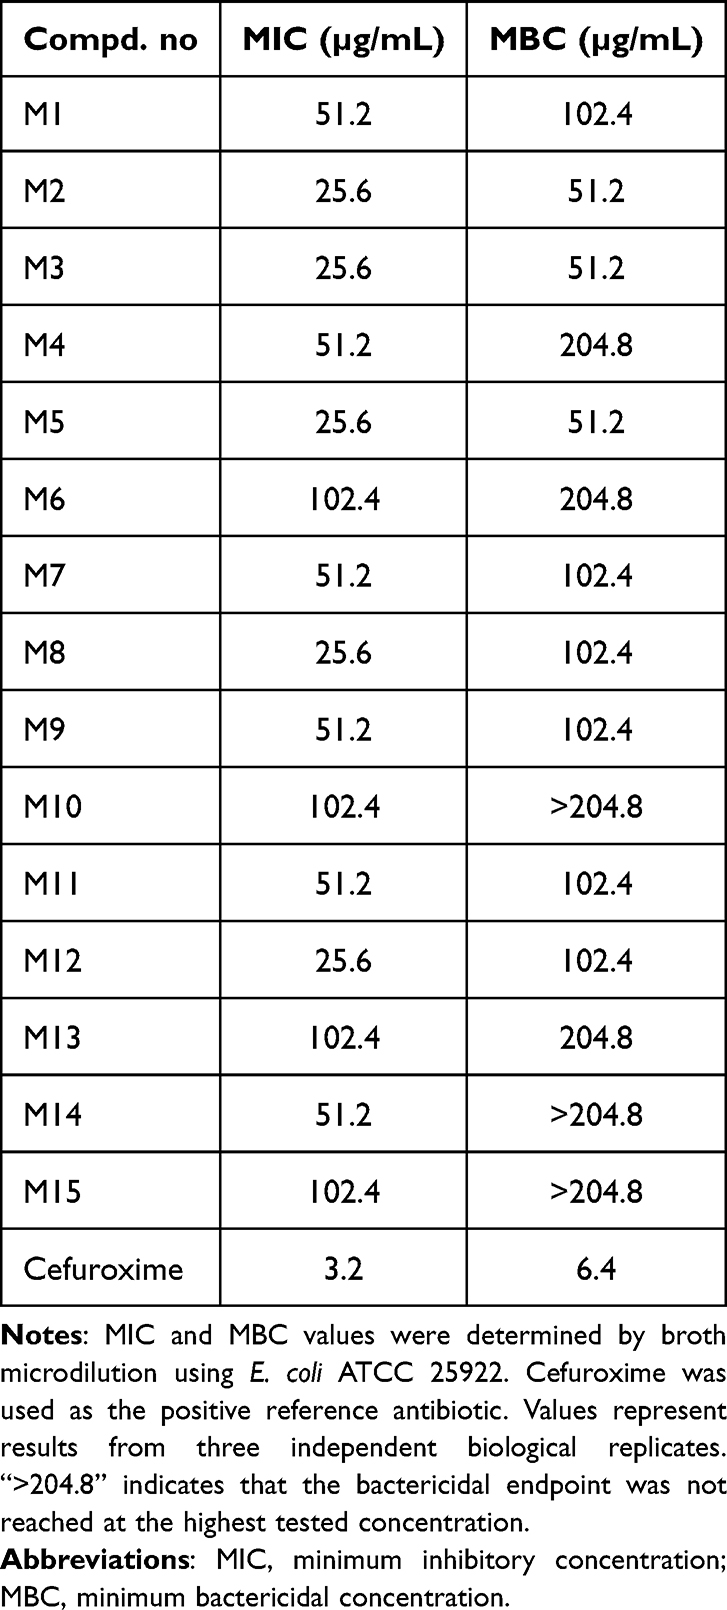 |
Table 2 MICs and MBCs of the Fifteen Prioritized Candidate Molecules Against Escherichia coli ATCC 25922 |
Among the candidate molecules, M2, M3, M5, M8, and M12 showed the lowest MIC value of 25.6 µg/mL. M9 showed an MIC of 51.2 µg/mL, whereas several other candidates showed weaker inhibitory activity, with MIC values of 51.2 or 102.4 µg/mL. MBC determination further showed that M2, M3, and M5 had MBC values of 51.2 µg/mL, whereas M8, M9, M1, M7, M11, and M12 showed MBC values of 102.4 µg/mL. For M10, M14, and M15, the MBC was not reached within the tested concentration range and was therefore recorded as >204.8 µg/mL. These results indicate that broth microdilution detected antibacterial activity for several compounds that showed weak or no measurable inhibition zones in the disk diffusion assay. This finding supports the concern that disk diffusion alone may underestimate the activity of compounds with limited agar diffusion. Considering the combined disk diffusion, MIC, and MBC results, M2 was selected as the primary candidate for subsequent target-related computational and biochemical analyses because it combined one of the lowest MIC/MBC profiles with the largest inhibition zone among the prioritized candidates.
Molecular Docking Results
Molecular docking was performed for the fifteen prioritized candidates and three reference antibiotics to evaluate their potential non-covalent binding to PBP2. CB-Dock2 identified five ligand-accessible cavities with volumes of 517, 549, 286, 635, and 510 Å3. The docking scores are summarized in Table S3.
Although several compounds showed favorable docking scores in the 517 ų cavity, structural inspection indicated that the 549 ų cavity was more closely associated with the reported penicillin-binding region of E. coli PBP2. This cavity contained key active-site-associated residues, including Ser330 and Trp370. Ser330 is the reported penicillin-binding active-site residue of E. coli PBP2, whereas Trp370 has been implicated in active-site inhibitor recognition through hydrophobic stacking interactions. Therefore, the 549 ų cavity was selected for target-oriented interpretation.
In the 549 Å3 cavity, cefuroxime showed a docking score of −7.4 kcal/mol. Among the candidate molecules with favorable MIC/MBC profiles, M3 showed the most favorable docking score of −8.2 kcal/mol, whereas M2 and M5 both showed docking scores of −7.8 kcal/mol. These values were comparable to or slightly more favorable than that of cefuroxime in the same active-site-associated cavity. However, the docking scores did not fully parallel the antibacterial results, indicating that predicted non-covalent binding affinity alone is insufficient to explain phenotypic antibacterial activity. Factors such as aqueous dispersion, membrane permeability, intracellular exposure, and actual target engagement may also influence the final antibacterial outcome.
Because M2, M3, and M5 showed the most favorable MIC/MBC profiles among the prioritized candidates, their binding modes in the 549 Å3 cavity were further compared with that of cefuroxime (Figure 6). Cefuroxime was modeled in a non-covalent pre-acylation state. Its predicted binding pose was stabilized by multiple hydrogen-bonding interactions involving Ser330, Ser387, Asp389, Ser545, and Thr547, together with hydrophobic or π-related contacts involving Trp370 and Lys572. This interaction pattern is consistent with its location in the active-site-associated region. However, because cefuroxime is a β-lactam antibiotic, this docking model represents only the non-covalent recognition state and does not capture the subsequent covalent acylation step.
 |
Figure 6 Molecular docking interaction analysis of cefuroxime and selected candidate molecules in the active-site-associated cavity of PBP2. Docking poses are shown for (A) cefuroxime and selected candidate molecules, including (B) M2, (C) M3, and (D) M5, illustrating their binding orientations and key interactions within the 549 Å3 active-site-associated cavity. |
M2 adopted a compact binding pose within the 549 Å3 cavity (Figure 6B). The two-dimensional interaction map suggested that M2 formed several conventional hydrogen bonds with Ser330, Thr547, Gln465, Tyr393, and Arg368. In addition, a π–π stacked interaction with Trp370 was observed, indicating that M2 can engage a residue previously implicated in PBP2 inhibitor recognition. These interactions suggest that M2 may occupy the active-site-associated cavity through a combination of polar anchoring and aromatic stabilization, which is consistent with its favorable MIC/MBC values and prominent disk diffusion activity among the candidate molecules.
M3 showed the most favorable docking score among M2, M3, and M5 in the 549 Å3 cavity. Its predicted binding mode was supported by an extensive hydrogen-bonding network involving Ser330, Ser387, Ser545, Thr547, Gly546, Lys572, and Leu573 (Figure 6C). The interaction diagram also showed contacts involving Trp370 and Asp389. This relatively dense interaction network may contribute to the favorable docking score of M3 and is consistent with its low MIC and MBC values. Nevertheless, because docking evaluates a static non-covalent pose, the stronger docking score of M3 should not be interpreted as direct evidence of superior antibacterial potency without further biochemical validation.
M5 also occupied the 549 Å3 active-site-associated cavity and formed multiple stabilizing interactions (Figure 6D). Conventional hydrogen bonds were observed with Ser330, Thr547, Ser387, Gln465, Gly546, Asn454, and Lys572. In addition, hydrophobic or π-related interactions involving Trp370, Tyr533, Val460, and Ala599 were observed in the two-dimensional interaction map. This mixed polar and hydrophobic interaction pattern provides a structural explanation for the favorable MIC/MBC profile of M5, although further target-specific assays would be required to confirm direct PBP2 inhibition.
Overall, the docking results suggest that M2, M3, and M5 can form non-covalent interaction networks within an active-site-associated PBP2 cavity containing Ser330 and Trp370. Nevertheless, these results should be interpreted as supportive structural evidence for potential PBP2-associated binding rather than as direct proof of β-lactam-like covalent inhibition.
Molecular Dynamics Simulation
To further evaluate the dynamic behavior of the ligand–PBP2 complexes, 200 ns molecular dynamics simulations were performed for the M2–PBP2 and cefuroxime–PBP2 complexes, with three independent runs for each system. The initial complexes were derived from the docking poses in the 549 Å3 active-site-associated cavity, ensuring consistency between the docking and MD analyses.
As shown in Figure 7A, both complexes underwent rapid structural adjustment during the early stage of simulation and subsequently fluctuated within relatively stable ranges. The cefuroxime–PBP2 complex showed backbone RMSD values mainly around 3.0–3.6 Å after the initial equilibration period, with a mild upward drift in several trajectories during the later stage of the 200 ns simulations. In contrast, the M2–PBP2 complex generally fluctuated within a slightly lower and narrower range, mostly around 2.6–3.1 Å, and the three independent runs showed relatively consistent convergence. These results suggest that the M2–PBP2 complex maintained a stable non-covalent binding-associated conformation in the 549 Å3 active-site-associated cavity under the simulation conditions used in this study.
 |
Figure 7 Molecular dynamics analysis of the cefuroxime–PBP2 and M2–PBP2 complexes. (A) Backbone RMSD profiles during 200 ns molecular dynamics simulations. Three independent runs were performed for each complex. (B) Per-residue RMSF profiles of the two complexes. The complexes were generated from docking poses in the 549 Å3 active-site-associated cavity, and cefuroxime was modeled in a non-covalent pre-acylation state. |
Residue-level RMSF analysis showed that the overall flexibility profiles of the cefuroxime–PBP2 and M2–PBP2 complexes were broadly similar (Figure 7B). It should be noted that the x-axis of the RMSF plot represents the sequential indices of the 538 resolved residues rather than the original PDB residue numbers. Because the PBP2 structure contains residues numbered 57–613, with residues 550–568 absent, active-site-associated residues in the 549 Å3 cavity are shifted in the RMSF plot. For example, Ser330, Trp370, Ser387, Asp389, Thr547, and Lys572 correspond approximately to residue indices 274, 314, 331, 333, 491, and 497, respectively. The cavity-associated residues generally fell within regions of moderate fluctuation in both complexes, indicating that ligand binding in the 549 Å3 cavity did not introduce substantial local destabilization. In several active-site-associated regions, including the segments corresponding to Ser330/Trp370 and Ser387/Asp389, the RMSF values of the M2–PBP2 complex were comparable to those of the cefuroxime–PBP2 complex. Around the segment corresponding to Ser545–Thr547 and nearby residues, moderate fluctuations were observed in both systems, which may reflect the intrinsic flexibility of this local region. These results support the dynamic stability of the M2-associated binding model while also indicating that the local flexibility pattern remains broadly similar to that of the cefuroxime reference complex.
MM-PBSA analysis was performed using the final 10 ns of the 200 ns trajectories to estimate the relative non-covalent binding free energies of the simulated complexes. As shown in Table 3, the calculated binding free energy of the M2–PBP2 complex was −39.83 kcal/mol, whereas that of the modeled cefuroxime–PBP2 pre-acylation complex was −27.79 kcal/mol. This result suggests that, under the present computational conditions, the M2–PBP2 complex maintained a more favorable modeled non-covalent binding state than the cefuroxime–PBP2 pre-acylation complex. Energy decomposition showed that the favorable binding free energy of M2–PBP2 was mainly driven by stronger van der Waals and electrostatic interactions. The van der Waals contribution of M2–PBP2 was −46.07 kcal/mol, compared with −34.68 kcal/mol for cefuroxime–PBP2. Similarly, the electrostatic contribution was more favorable for M2–PBP2 than for cefuroxime–PBP2, with values of −29.82 and −16.94 kcal/mol, respectively. In both systems, polar solvation opposed binding. The polar solvation penalty was higher for M2–PBP2 (+40.01 kcal/mol) than for cefuroxime–PBP2 (+26.56 kcal/mol), but this unfavorable contribution was offset by the stronger van der Waals, electrostatic, and non-polar solvation terms.
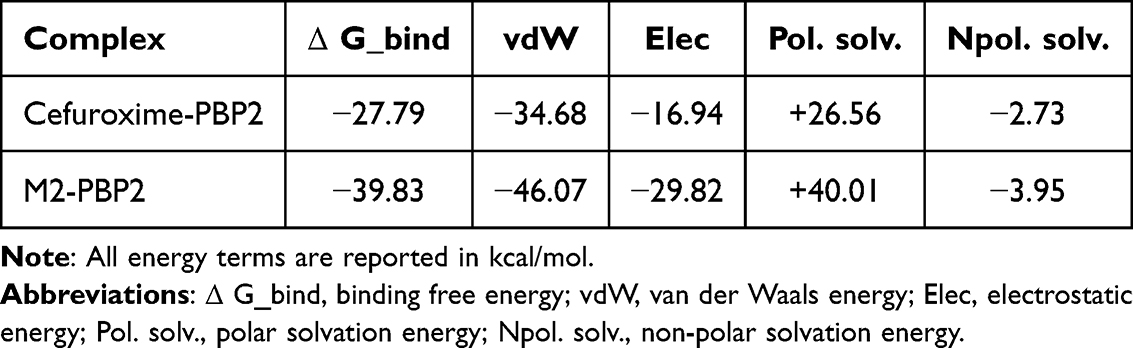 |
Table 3 MM-PBSA Binding Free Energy Decomposition of the Cefuroxime–PBP2 and M2–PBP2 Complexes |
Importantly, these computational results should be interpreted only as estimates of the relative stability of modeled non-covalent complexes. Cefuroxime is a β-lactam antibiotic whose antibacterial activity depends on covalent acylation of the PBP2 active-site serine. Therefore, the RMSD, RMSF, and MM-PBSA comparisons do not represent a direct comparison of the complete inhibitory potency of M2 and cefuroxime.
Bocillin-FL Competition Assay
A Bocillin-FL-based competition assay was performed to further examine whether M2 could interfere with probe labeling of PBP2 within a defined short-time reaction window. As shown in Figure 8A, a strong fluorescent band corresponding to PBP2 was observed in the DMSO control group after Bocillin-FL labeling, indicating effective probe labeling of the protein. In contrast, the fluorescence intensity of the PBP2 band decreased gradually when PBP2 was preincubated with increasing concentrations of M2, suggesting that M2 interfered with Bocillin-FL labeling in a concentration-dependent manner. The positive control cefuroxime almost completely suppressed the fluorescence signal under the same experimental conditions.
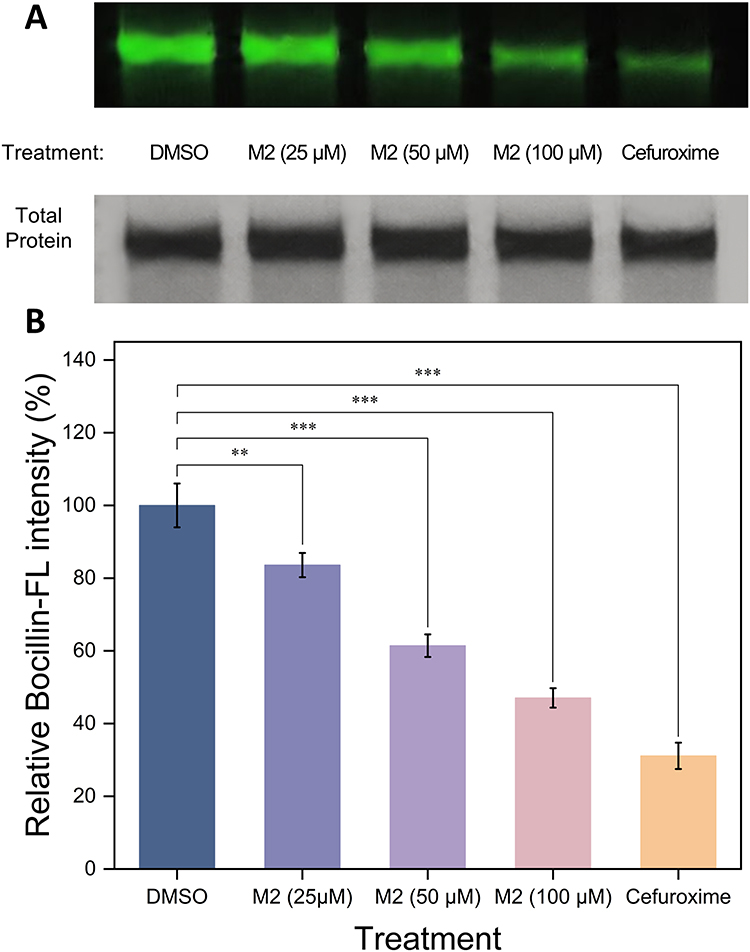 |
Figure 8 Bocillin-FL competition assay evaluating the interaction of M2 with Escherichia coli PBP2. (A) Representative fluorescent gel image showing Bocillin-FL labeling of purified PBP2 after treatment with DMSO, M2 (25, 50, and 100 µM), or cefuroxime. The lower panel shows Coomassie Brilliant Blue staining of the same gel to confirm comparable protein loading. (B) Quantitative analysis of relative Bocillin-FL intensity. Fluorescence intensities were normalized to the corresponding total protein band intensity and expressed relative to the DMSO control group. Data are presented as mean ± SD from three independent experiments. Statistical significance was determined by one-way ANOVA followed by Dunnett’s multiple comparison test versus the DMSO control (* p < 0.05, ** p < 0.01, *** p < 0.001). |
Densitometric analysis further confirmed the concentration-dependent reduction in Bocillin-FL labeling intensity after M2 treatment (Figure 8B). Because Bocillin-FL is an irreversible β-lactam probe and the precise binding mode of M2 remains unresolved, the assay should be interpreted as a competitive labeling experiment within the selected incubation window. The reduced fluorescence signal indicates that M2 can interfere with Bocillin-FL access to or labeling of PBP2 during the early reaction period. However, this assay does not determine whether M2 acts through reversible binding, slow dissociation, time-dependent inhibition, or a covalent mechanism.
Discussion
This study developed a property-spectrum-based 5F-MDL workflow for early-stage antibacterial candidate prioritization against E. coli. Different from conventional virtual screening strategies that often emphasize target affinity or a single activity endpoint, the present framework integrates 33 predicted properties across physicochemical properties, pharmacokinetics, efficacy-related descriptors, safety, and stability. By comparing candidate molecules with clinically approved reference antibiotics in a normalized multidimensional property space, the 5F-MDL strategy was designed to prioritize compounds with globally reference-like developability profiles.
Existing deep learning-based drug discovery approaches have been widely used for molecular property prediction, target-activity modeling, ADMET prediction, virtual screening, and de novo molecular design. These methods have substantially improved the ability to model complex structure–property relationships, but many applications remain centered on individual endpoints, such as potency, toxicity, or pharmacokinetic properties, or are used as separate prediction modules within a larger screening workflow. In contrast, the 5F-MDL framework uses deep learning to generate a unified 33-dimensional property spectrum and then integrates physicochemical, pharmacokinetic, efficacy-related, safety, and stability dimensions into a single reference-drug-centered similarity score. Therefore, the present workflow is not intended to replace existing deep learning-based prediction or virtual screening methods, but to complement them by providing a multidimensional developability-oriented prioritization layer before target-specific computational and experimental validation.27,31,32
The screening results support the feasibility of this multidimensional prioritization concept. The fifteen selected molecules showed high global property-spectrum similarity to their nearest reference drugs, with  scores ranging from 0.929 to 0.971. The property-spectrum profiles further showed that the prioritized molecules generally followed the characteristic patterns of cefradine, cefuroxime, or ceftriaxone across the 33 normalized property dimensions. These results suggest that the 5F-MDL workflow can enrich compounds with broad property-level resemblance to approved antibacterial agents rather than selecting candidates based on isolated single-property similarity.
However, the  score should be interpreted as an early-stage prioritization metric rather than a direct predictor of antibacterial potency. Although all fifteen candidates showed high property-spectrum similarity, their experimental antibacterial activities differed. This observation is reasonable because phenotypic antibacterial activity depends not only on global drug-likeness-related properties, but also on bacterial permeability, efflux susceptibility, intracellular exposure, target accessibility, compound solubility, and assay-specific behavior. Therefore, computational prioritization cannot replace experimental validation.
The expanded antibacterial evaluation provided a more complete assessment of the prioritized candidates. Disk diffusion identified compounds with measurable diffusion-dependent antibacterial effects, with M2 showing the most apparent inhibition zone among the candidates. In contrast, broth microdilution of all fifteen candidates revealed that several molecules with weak or limited disk diffusion performance still showed measurable inhibitory activity. M2, M3, M5, M8, and M12 showed the lowest MIC value among the candidates, whereas M2, M3, and M5 also displayed relatively favorable MBC values. These results confirm that disk diffusion alone may underestimate compounds with poor agar diffusion or dispersion, and that MIC/MBC testing provides a more reliable basis for assessing the hit rate of the 5F-MDL workflow.
Among the experimentally active molecules, M2 was selected as the representative candidate for further target-related analysis because it combined a high  score, one of the lowest MIC/MBC profiles, the largest inhibition zone among the candidates, and supportive computational and biochemical evidence. Nevertheless, cefuroxime remained substantially more potent than the candidate molecules in antibacterial assays. Therefore, M2 should be regarded as a preliminary lead-like hit rather than as a compound with activity comparable to clinically used β-lactam antibiotics.
The docking analysis provided structural support for potential PBP2-associated recognition by the active candidates. The 549 Å3 cavity was selected for target-oriented analysis because it overlaps with the reported penicillin-binding region of E. coli PBP2 and contains active-site-associated residues such as Ser330 and Trp370. Within this cavity, M2, M3, and M5 formed multiple hydrogen-bonding, hydrophobic, and π-related interactions with surrounding residues. These interactions suggest that the active candidates can occupy a PBP2 active-site-associated region. However, docking scores did not fully parallel MIC/MBC values, indicating that static docking alone is insufficient to explain phenotypic antibacterial activity. A rigorous interpretation of docking results should therefore consider both structural interaction patterns and experimental validation.70
The 200 ns molecular dynamics simulations further supported the stability of the M2–PBP2 binding model derived from the 549 Å3 cavity. Across three independent runs, the M2–PBP2 complex showed relatively consistent backbone RMSD convergence and slightly lower overall RMSD fluctuations than the modeled cefuroxime–PBP2 pre-acylation complex. RMSF analysis also indicated that the cavity-associated regions were not substantially destabilized in the M2–PBP2 complex. MM-PBSA analysis based on the final 10 ns of the trajectories showed a more favorable calculated binding free energy for M2–PBP2 than for the modeled cefuroxime–PBP2 pre-acylation complex, mainly driven by stronger van der Waals and electrostatic contributions. These findings support the relative stability of the modeled M2–PBP2 non-covalent binding state, and they are consistent with the value of extended MD simulations for evaluating protein–ligand complex stability.71
Despite this computational support, the comparison with cefuroxime must be interpreted cautiously. Cefuroxime is a β-lactam antibiotic whose antibacterial effect depends on non-covalent recognition followed by covalent acylation of the PBP active-site serine. In contrast, the present docking, MD, and MM-PBSA analyses only describe modeled non-covalent ligand–protein states and do not evaluate covalent reaction kinetics. Therefore, the more favorable MM-PBSA value of M2 should not be interpreted as evidence that M2 is more potent than cefuroxime. Rather, it provides supportive computational evidence that M2 can maintain a stable binding-associated conformation within the selected PBP2 cavity.
The Bocillin-FL competition assay provided additional target-engagement support for M2. The concentration-dependent reduction in Bocillin-FL labeling suggests that M2 can interfere with probe access to or labeling of PBP2 within the selected short-time reaction window. However, because Bocillin-FL irreversibly labels PBPs and the precise binding mode of M2 has not yet been determined, this assay does not define whether M2 acts through reversible binding, prolonged residence time, time-dependent inhibition, or covalent modification. Further kinetic competition assays, washout experiments, intact-protein mass spectrometry, and direct binding measurements will be required to clarify the inhibitory mode of M2.
Several limitations should be acknowledged. First, the current  score uses an unweighted Euclidean-distance formulation. This provides a transparent proof-of-concept baseline, but different properties do not necessarily contribute equally to candidate success. Future versions of the 5F-MDL framework should incorporate indication-specific weighting schemes or hard-filter thresholds, especially for safety-critical and efficacy-critical endpoints. Second, safety-related predictions, including hERG-related risk, should be considered prioritization signals rather than direct evidence of clinical safety. Experimental safety evaluation, including hERG channel assays and cytotoxicity testing, remains necessary before any developability conclusion can be drawn.72 Third, although applicability-domain and prediction-reliability controls were incorporated to reduce out-of-distribution extrapolation, model uncertainty cannot be completely eliminated for structurally novel or underrepresented chemotypes.
Overall, this study demonstrates that the 5F-MDL workflow can prioritize molecules with high multidimensional similarity to approved antibacterial reference drugs and identify candidates with measurable antibacterial activity. The integration of property-spectrum screening, full MIC/MBC validation, target-oriented docking, 200 ns MD simulations, MM-PBSA analysis, and Bocillin-FL competition provides a coherent proof-of-concept framework for early-stage antibacterial candidate selection. Further validation in additional E. coli strains, resistant isolates, and broader Gram-negative bacterial panels, together with permeability, cytotoxicity, direct binding, and mechanism-of-action studies, will be necessary to establish the broader applicability of the 5F-MDL strategy.
Conclusion
This work presents a property-spectrum-based screening workflow termed 5F-MDL for early-stage candidate prioritization against Escherichia coli. By integrating 33 predicted molecular properties across five dimensions, the framework enabled the selection of candidate molecules from a large commercial library. Among the 15 selected candidates, M2 showed the most balanced overall profile, with measurable inhibitory and bactericidal activity against E. coli under the tested conditions. Computational analyses suggested that M2 may interact with PBP2 through a relatively stable binding mode, and the Bocillin-FL competition assay further supported its ability to interfere with probe labeling of PBP2 in vitro. These findings identify M2 as a compound with preliminary lead-like potential and support the utility of 5F-MDL as an upstream filtering strategy that can be integrated with structure-based evaluation and biological validation in early-stage antibacterial drug discovery. However, the precise mechanism of action of M2 and the broader applicability of the 5F-MDL framework remain to be further investigated.
Data Sharing Statement
The data supporting the findings of this study are available from the corresponding author upon reasonable request.
Ethical Statement
Ethics approval was not required for this study because all experiments were conducted using commercially available compounds, an Escherichia coli laboratory strain, and recombinant protein assays, with no involvement of human participants, human samples, personal/medical data, or animals.
Acknowledgment
A preprint of this paper has been posted on arXiv: https://arxiv.org/pdf/2512.21895.
Funding
This work was supported by the National Natural Science Foundation of China (82260896), the Open Fund of State Key Laboratory of Chemo/Biosensing and Chemometrics of Hunan University (20230017), and the Key Research and Development Program of Henan Province of China (251111311300).
Disclosure
The authors declare no competing interests in this work.
References
1. Newman DJ, Cragg GM. Natural products as sources of new drugs over the nearly four decades from 01/1981 to 09/2019. J Nat Prod. 2020;83(3):770–23. doi:10.1021/acs.jnatprod.9b01285
2. Rodney S, Banerji U. Optimizing the FDA’s Project Optimus: opportunities and challenges. Nat Rev Clin Oncol. 2024;21(3):165–166. doi:10.1038/s41571-023-00853-z
3. Sun YP, Wang LY. Development of anti-HIV therapeutics: from conventional drug discovery to cutting-edge technology. Pharmaceuticals. 2024;17(7):887. doi:10.3390/ph17070887
4. Temereanca A, Ruta S. Strategies to overcome HIV drug resistance-current and future perspectives. Front Microbiol. 2023;14:1133407. doi:10.3389/fmicb.2023.1133407
5. Zumla A, Nahid P, Cole ST. Advances in the development of new tuberculosis drugs and treatment regimens. Nat Rev Drug Discov. 2013;12(5):388–404. doi:10.1038/nrd4001
6. Conradie F, Bagdasaryan TR, Borisov S, et al. Bedaquiline-pretomanid-linezolid regimens for drug-resistant tuberculosis. N Engl J Med. 2022;387(9):810–823. doi:10.1056/NEJMoa2119430
7. Hay M, Thomas DW, Craighead JL, Economides C, Rosenthal J. Clinical development success rates for investigational drugs. Nat Biotechnol. 2014;32(1):40–51. doi:10.1038/nbt.2786
8. Dowden H, Munro J. Trends in clinical success rates and therapeutic focus. Nat Rev Drug Discov. 2019;18(7):495–496. doi:10.1038/d41573-019-00074-z
9. Piddock LJV, Malpani R, Hennessy A. Challenges and opportunities with antibiotic discovery and exploratory research. ACS Infect Dis. 2024;10(8):2445–2447. doi:10.1021/acsinfecdis.4c00530
10. Bon M, Cunningham F, Chauhan J, et al. AI drug discovery: expanding the horizons of infectious disease therapeutics. ACS Infect Dis. 2025;11(8):2048–2050. doi:10.1021/acsinfecdis.5c00462
11. Campos KR, Coleman PJ, Alvarez JC, et al. The importance of synthetic chemistry in the pharmaceutical industry. Science. 2019;363(6424):aat0805. doi:10.1126/science.aat0805
12. Brow DG, Boström J. Analysis of past and present synthetic methodologies on medicinal chemistry: where have all the new reactions gone? J Med Chem. 2016;59(10):4443–4458. doi:10.1021/acs.jmedchem.5b01409
13. Schiesser S, Cox RJ, Czechtizky W. The powerful symbiosis between synthetic and medicinal chemistry. Future Med Chem. 2021;13(11):941–944. doi:10.4155/fmc-2021-0062
14. Ayon NJ. High-throughput screening of natural product and synthetic molecule libraries for antibacterial drug discovery. Metabolites. 2023;13(5):625. doi:10.3390/metabo13050625
15. Carnero A. High throughput screening in drug discovery. Clin Transl Oncol. 2006;8(7):482–490. doi:10.1007/s12094-006-0048-2
16. Sink R, Gobec S, Pecar S, Zega A. False positives in the early stages of drug discovery. Curr Med Chem. 2010;17(34):4231–4255. doi:10.2174/092986710793348545
17. Dahlin JL, Walters MA. The essential roles of chemistry in high-throughput screening triage. Future Med Chem. 2014;6(11):1265–1290. doi:10.4155/fmc.14.60
18. Mayr LM, Fuerst P. The future of high-throughput screening. J Biomol Screen. 2008;13(6):443–448. doi:10.1177/1087057108319644
19. Mayr LM, Bojanic D. Novel trends in high-throughput screening. Curr Opin Pharmacol. 2009;9(5):580–588. doi:10.1016/j.coph.2009.08.004
20. Pereira DA, Williams JA. Origin and evolution of high throughput screening. Br J Pharmacol. 2007;152(1):53–61. doi:10.1038/sj.bjp.0707373
21. Vénien-Bryan C, Li Z, Vuillard L, Boutin JA. Cryo-electron microscopy and X-ray crystallography: complementary approaches to structural biology and drug discovery. Struct Biol Commun. 2017;73:174–183. doi:10.1107/S2053230X17003740
22. Dey D, Deprez BE, Zelinskaya N, Castro JM, Wuest WM, Conn GL. Discovery of first-in-class inhibitors targeting a pathogen-associated aminoglycoside-resistance 16S rRNA methyltransferase. ACS Infect Dis. 2025;11(8):2276–2286. doi:10.1021/acsinfecdis.5c00297
23. Wu K, Karapetyan E, Schloss J, Vadgama J, Wu Y. Advancements in small molecule drug design: a structural perspective. Drug Discov Today. 2023;28(10):103730. doi:10.1016/j.drudis.2023.103730
24. Lounnas V, Ritschel T, Kelder J, McGuire R, Bywater RP, Foloppe N. Current progress in Structure-Based Rational Drug Design marks a new mindset in drug discovery. Comput Struct Biotechnol J. 2013;5:e201302011. doi:10.5936/csbj.201302011
25. Surade S, Blundell TL. Structural biology and drug discovery of difficult targets: the limits of ligandability. Chem Biol. 2012;19(1):42–50. doi:10.1016/j.chembiol.2011.12.013
26. He HQ, Liu BQ, Luo HY, Zhang TT, Jiang JW. Big data and artificial intelligence discover novel drugs targeting proteins without 3D structure and overcome the undruggable targets. Stroke Vasc Neurol. 2020;5(4):381–387. doi:10.1136/svn-2019-000323
27. Sadybekov AV, Katritch V. Computational approaches streamlining drug discovery. Nature. 2023;616(7958):673–685. doi:10.1038/s41586-023-05905-z
28. Ouma RBO, Ngari SM, Kibet JK. A review of the current trends in computational approaches in drug design and metabolism. Discov Public Health. 2024;21(1):108. doi:10.1186/s12982-024-00229-3
29. Kitchen DB, Decornez H, Furr JR, Bajorath J. Docking and scoring in virtual screening for drug discovery: methods and applications. Nat Rev Drug Discov. 2004;3(11):935–949. doi:10.1038/nrd1549
30. Paggi JM, Pandit A, Dror RO. The art and science of molecular docking. Annu Rev Biochem. 2024;93:389–410. doi:10.1146/annurev-biochem-030222-120000
31. Cherkasov A, Muratov EN, Fourches D, et al. QSAR modeling: where have you been? Where are you going to? J Med Chem. 2014;57(12):4977–5010. doi:10.1021/jm4004285
32. Tropsha A, Isayev O, Varnek A, Schneider G, Cherkasov A. Integrating QSAR modelling and deep learning in drug discovery: the emergence of deep QSAR. Nat Rev Drug Discov. 2024;23(2):141–155. doi:10.1038/s41573-023-00832-0
33. Harvey MJ, De Fabritiis G. High-throughput molecular dynamics: the powerful new tool for drug discovery. Drug Discov Today. 2012;17(19–20):1059–1062. doi:10.1016/j.drudis.2012.03.017
34. AlRawashdeh S, Barakat KH. Applications of molecular dynamics simulations in drug discovery. Methods Mol Biol. 2024;2714:127–141. doi:10.1007/978-1-0716-3441-7_7
35. Gao QZ, Yang LL, Zhu YQ. Pharmacophore based drug design approach as a practical process in drug discovery. Curr Computer-Aided Drug Design. 2010;6(1):37–49. doi:10.2174/157340910790980151
36. Yang SY. Pharmacophore modeling and applications in drug discovery: challenges and recent advances. Drug Discov Today. 2010;15(11–12):444–450. doi:10.1016/j.drudis.2010.03.013
37. Schaller D, Sribar D, Noonan T, et al. Next generation 3D pharmacophore modeling. Wiley Interdiscip Rev Comput Mol Sci. 2020;10(4):e1468. doi:10.1002/wcms.1468
38. Gurung AB, Ali MA, Lee J, Abul Farah M, Al-Anazi KM. An updated review of computer-aided drug design and Its application to COVID-19. Biomed Res Int. 2021;8853056. doi:10.1155/2021/8853056
39. Muratov EN, Amaro R, Andrade CH, et al. A critical overview of computational approaches employed for COVID-19 drug discovery. Chem Soc Rev. 2021;50(16):9121–9151. doi:10.1039/D0CS01065K
40. Sun F, Wang C, Xu Z, et al. Temporal variations of bacterial and eukaryotic community in coastal waters-implications for aquaculture. Appl Microbiol Biotechnol. 2024;108(1):388. doi:10.1007/s00253-024-13176-5
41. El Chaar M, Khoury Y, Douglas GM, et al. Longitudinal genomic surveillance of multidrug-resistant Escherichia coli carriage in critical care patients. Microbiol Spectr. 2024;12(2):e0312823. doi:10.1128/spectrum.03128-23
42. Qing Y, Zou Z, Jiang G, Qin L, Liu K, Liu Z. A global perspective on the abundance, diversity and mobility of antibiotic resistance genes in Escherichia coli. Front Vet Sci. 2024;11:1442159. doi:10.3389/fvets.2024.1442159
43. Azerefegne EF, Tasamma AT, Demass TB, Tessema AG, Degu WA. Prevalence of multidrug resistant gram-negative bacteria and associated factors among gram-negative blood culture isolates at Tikur Anbessa specialized hospital: a retrospective study. BMC Infect Dis. 2025;25(1):1006. doi:10.1186/s12879-025-11328-0
44. Cerniauskiene K, Vitkauskiene A. Multidrug-resistant acinetobacter baumannii: risk factors for mortality in a tertiary care teaching hospital. Trop Med Infect Dis. 2025;10(1):15. doi:10.3390/tropicalmed10010015
45. Ali MA, Raza MT, Majeed S, et al. Correlation of serum albumin levels with the severity of sepsis among intensive care unit patients. Cureus. 2024;16(10):e71411. doi:10.7759/cureus.71411
46. Yan K, Liang B, Zhang G, Wang J, Zhu M, Cai Y. Efficacy and safety of plazomicin in the treatment of enterobacterales infections: a meta-analysis of randomized controlled trials. Open Forum Infect Dis. 2022;9(9):429. doi:10.1093/ofid/ofac429
47. Narendrakumar L, Chakraborty M, Kumari S, Paul D, Das B. β-Lactam potentiators to re-sensitize resistant pathogens: discovery, development, clinical use and the way forward. Front Microbiol. 2022;13:1092556. doi:10.3389/fmicb.2022.1092556
48. Lima LM, Silva B, Barbosa G, Barreiro EJ. β-Lactam antibiotics: an overview from a medicinal chemistry perspective. Eur J Med Chem. 2020;208:112829. doi:10.1016/j.ejmech.2020.112829
49. den Blaauwen T, Aarsman MEG, Vischer NE, Nanninga N. Penicillin-binding protein PBP2 of Escherichia coli localizes preferentially in the lateral wall and at mid-cell in comparison with the old cell pole. Mol Microbiol. 2003;47(2):539–547. doi:10.1046/j.1365-2958.2003.03316.x
50. Bulman ZP, Krapp F, Pincus NB, et al. Genomic features associated with the degree of phenotypic resistance to carbapenems in carbapenem-resistant Klebsiella pneumoniae. MSystems. 2021;6(5):e0019421. doi:10.1128/msystems.00194-21
51. Shi Q, Han R, Guo Y, et al. Multiple novel ceftazidime-avibactam-resistant variants of bla(KPC-2)-positive Klebsiella pneumoniae in two patients. Microbiol Spectr. 2022;10(3):e0171421. doi:10.1128/spectrum.01714-21
52. Bush K, Bradford PA. Epidemiology of beta-Lactamase-producing pathogens. Clin Microbiol Rev. 2020;33(2):e00047–19. doi:10.1128/cmr.00047-19
53. Adler M, Anjum M, Andersson DI, Sandegren L. Combinations of mutations in envZ, ftsI, mrdA, acrB and acrR can cause high-level carbapenem resistance in Escherichia coli. J Antimicrob Chemother. 2016;71(5):1188–1198. doi:10.1093/jac/dkv475
54. Giuliano S, Fox V, Ferin S, et al. Potential role of avibactam in restoring susceptibility in Escherichia coli with two copies of bla(KPC-3) and PBP3 mutations. Sci Rep. 2025;15(1):21161. doi:10.1038/s41598-025-07624-z
55. Ranjitkar S, Reck F, Ke X, et al. Identification of mutations in the mrda gene encoding pbp2 that reduce carbapenem and diazabicyclooctane susceptibility of Escherichia coli clinical isolates with mutations in ftsI (PBP3) and which carry bla(NDM-1). MSphere. 2019;4(4):e00074–19. doi:10.1128/msphere.00074-19
56. McElheny CL, Butcher EL, Kawai A, Shanks RMQ, Shields RK, Doi Y. In vitro evolution of durlobactam resistance in NDM-producing Escherichia coli due to a single mutation in mrdA encoding penicillin-binding protein 2. Antimicrob Agents Chemother. 2025;69(11):e01014–25. doi:10.1128/aac.01014-25
57. Tooke CL, Hinchliffe P, Beer M, et al. Tautomer-specific deacylation and ω-loop flexibility explain the carbapenem-hydrolyzing broad-spectrum activity of the KPC-2 β-lactamase. J Am Chem Soc. 2023;145(13):7166–7180. doi:10.1021/jacs.2c12123
58. Dean CR, Barkan DT, Bermingham A, et al. Mode of action of the monobactam LYS228 and mechanisms decreasing in vitro susceptibility in Escherichia coli and Klebsiella pneumoniae. Antimicrob Agents Chemother. 2018;62(10):e01200–18. doi:10.1128/aac.01200-18
59. Hu JG, Che CY, Jiang W, et al. Avian pathogenic Escherichia coli through Pfs affects the tran-scription of membrane proteins to resist β-lactam antibiotics. Veter Sci. 2022;9(3):98. doi:10.3390/vetsci9030098
60. Recacha E, Fox V, Díaz-Díaz S, et al. Disbalancing envelope stress responses as a strategy for sensitization of Escherichia coli to antimicrobial agents. Front Microbiol. 2021;12:653479. doi:10.3389/fmicb.2021.653479
61. Taha R, Kader O, Shawky S, Rezk S. Ceftazidime-Avibactam plus aztreonam synergistic combination tested against carbapenem-resistant Enterobacterales characterized phenotypically and genotypically: a glimmer of hope. Ann Clinic Microbiol Antimicrob. 2023;22(1):21. doi:10.1186/s12941-023-00573-3
62. Alkofide H, Alhammad AM, Alruwaili A, et al. Multidrug-Resistant and extensively drug-resistant enterobacteriaceae: prevalence, treatments, and outcomes - A retrospective cohort study. Infect Drug Resist. 2020;13:4653–4662. doi:10.2147/IDR.S283488
63. Theuretzbacher U, Bush K, Harbarth S, et al. Critical analysis of antibacterial agents in clinical development. Nat Rev Microbiol. 2020;18(5):286–298. doi:10.1038/s41579-020-0340-0
64. Hoffman PS. Antibacterial discovery: 21st century challenges. Antibiotics-Basel. 2020;9(5):213. doi:10.3390/antibiotics9050213
65. Murray CJL, Ikuta KS, Sharara F, et al. Global burden of bacterial antimicrobial resistance in 2019: a systematic analysis. Lancet. 2022;399(10325):629–655. doi:10.1016/S0140-6736(21)02724-0
66. Yadav RK, Shrestha P, Timilsina K, et al. Antioxidant, antibacterial activity, in silico molecular docking, and ADME-toxicity study of lactone from rhizome of angiopteris helferiana. J Chem. 2024;2024:5623028. doi:10.1155/2024/5623028
67. Tjandrawinata RR, Nurkolis F. A comparative analysis on impact of extraction methods on carotenoids composition, antioxidants, antidiabetes, and antiobesity properties in seagrass enhalus acoroides: in silico and in vitro study. Mar Drugs. 2024;22(8):365. doi:10.3390/md22080365
68. Levy N, Bruneau JM, Le Rouzic E, et al. Structural basis for E. coli penicillin binding protein (PBP) 2 inhibition, a platform for drug design. J Med Chem. 2019;62(9):4742–4754. doi:10.1021/acs.jmedchem.9b00338
69. Nygaard R, Graham CLB, Belcher Dufrisne M, et al. Structural basis of peptidoglycan synthesis by E. coli RodA-PBP2 complex. Nat Commun. 2023;14:5151. doi:10.1038/s41467-023-40483-8
70. Famuyiwa SO, Ahmad S, Fakola EG, et al. Comprehensive computational studies of naturally occurring kuguacins as antidiabetic agents by targeting visfatin. Chemistry Africa. 2023;6:1415–1427. doi:10.1007/s42250-023-00604-8
71. Kaul T, Eswaran M, Ahmad S, et al. Probing the effect of a plus 1bp frameshift mutation in protein-DNA interface of domestication gene, NAMB1, in wheat. J Biomol Struct Dyn. 2020;38(12):3633–3647. doi:10.1080/07391102.2019.1680435
72. Ahmad S, Bashar A, Khanna K, Bano N, Raza K. Chapter 18 - Deep learning in variant detection and annotation. Deep Learn Genet Genom. 2025;1:383–396. doi:10.1016/B978-0-443-27574-6.00010-2
 © 2026 The Author(s). This work is published and licensed by Dove Medical Press Limited. The
full terms of this license are available at https://www.dovepress.com/terms
and incorporate the Creative Commons Attribution
- Non Commercial (unported, 4.0) License.
By accessing the work you hereby accept the Terms. Non-commercial uses of the work are permitted
without any further permission from Dove Medical Press Limited, provided the work is properly
attributed. For permission for commercial use of this work, please see paragraphs 4.2 and 5 of our Terms.
© 2026 The Author(s). This work is published and licensed by Dove Medical Press Limited. The
full terms of this license are available at https://www.dovepress.com/terms
and incorporate the Creative Commons Attribution
- Non Commercial (unported, 4.0) License.
By accessing the work you hereby accept the Terms. Non-commercial uses of the work are permitted
without any further permission from Dove Medical Press Limited, provided the work is properly
attributed. For permission for commercial use of this work, please see paragraphs 4.2 and 5 of our Terms.