Back to Journals » Cancer Management and Research » Volume 10
Identification of an eight-gene prognostic signature for lung adenocarcinoma
Authors Li S, Xuan Y , Gao B, Sun X, Miao S, Lu T , Wang Y , Jiao W
Received 12 May 2018
Accepted for publication 28 June 2018
Published 10 September 2018 Volume 2018:10 Pages 3383—3392
DOI https://doi.org/10.2147/CMAR.S173941
Checked for plagiarism Yes
Review by Single anonymous peer review
Peer reviewer comments 3
Editor who approved publication: Dr Antonella D'Anneo
Shicheng Li,1,* Yunpeng Xuan,1,* Bing Gao,2 Xiao Sun,1 Shuncheng Miao,1 Tong Lu,1 Yuanyong Wang,1 Wenjie Jiao1
1Department of Thoracic Surgery, Affiliated Hospital of Qingdao University, Qingdao, China; 2School of Basic Medicine, Qingdao University, Qingdao, China
*These authors contributed equally to this work
Background: Lung adenocarcinoma (LUAD) is the leading cause of cancer-related death worldwide. The main obstacle to early diagnosis or monitoring of patients at high risk of poor survival has been the lack of essential predictive biomarkers.
Methods: RNA-sequencing was performed on LUAD affected tissue and paired adjacent to noncancerous tissue samples and Gene Expression Omnibus dataset GSE19188 and GSE33532 were used to obtain an intersection of differential expressed genes and construct a protein–protein interaction network to get hub genes. Then corresponding overall survival information of two cohorts of LUAD patients from our hospital and The Cancer Genome Atlas project-LUAD were included in the present study. An analysis of the Kyoto Encyclopedia of Genes and Genomes database and Gene Ontology were carried out to study the signature mechanism.
Results: In our study, we identified eight candidate genes (DLGAP5, KIF11, RAD51AP1, CCNB1, AURKA, CDC6, OIP5 and NCAPG) closely related to survival in LUAD. A linear prognostic model of the eight genes was constructed and weighted by the regression coefficient (β) from the multivariate Cox regression analysis of The Cancer Genome Atlas-LUAD cohort to divide patients into low- and high-risk groups. The prognostic ability of the signature was validated in LUAD patients at our hospital. Patients assigned to the high-risk group exhibited poor overall survival compared to patients in the low-risk group. Finally, functional enrichment analysis showed that cell division played a vital role in the development of LUAD.
Conclusion: The study identified an mRNA signature including eight genes, which may serve as a potential prognostic marker of LUAD.
Keywords: RNA-seq, prognostic, signature, lung adenocarcinoma
Introduction
Lung cancer, including its two main subtypes, small cell lung cancer and non-small-cell lung cancer, remains the leading cause of cancer-related deaths globally1. Lung squamous cell carcinoma and lung adenocarcinoma (LUAD) are the two major subtypes of non-small-cell lung cancer. LUAD accounts for approximately 40% of all cases.2 Over the past several decades, in spite of the current multimodal therapy, the survival time of LUAD patients has shown marginal improvement only. LUAD recurrence and metastasis are common, even with the tumor diagnosed at an early stage.3 It is necessary to identify novel biomarkers and therapeutic targets for treatment of LUAD. Especially, the identification of multiple-gene signature of LUAD would be of great clinical significance.
With the development of high-throughput technology, gene expression profiles have been broadly used to identify more novel biomarkers. RNA-sequencing (RNA-seq) technology is an efficient high-throughput sequencing tool to measure transcripts, identify new transcriptional units and discover differentially expressed genes (DEGs) among samples. RNA-seq, usually together with bioinformatics methods, has been broadly used in cancer research. For example, recent studies have found several key genes in lung cancer using RNA-seq and bioinformatics methods.4,5 Thus, in this study, we applied RNA-seq and gene microarray to identify the key genes in the process of LUAD. Firstly, we generated RNA-seq data from lung cancer tissues and adjacent normal tissues of three patients, and identified some candidate genes. To validate the abovementioned genes, two mRNA microarray datasets were downloaded from the Gene Expression Omnibus (GEO) database and DEG were screened using R software between LUAD and normal lung tissues. Subsequently, function enrichment, protein–protein interaction (PPI) network and survival analysis curves were generated to identify the biomarkers for LUAD.
In our study, a total of 604 DEGs, including 127 upregulated and 477 downregulated, were identified with the RNA-seq method. After comparing them with results from the GEO database, we finally identified 289 significative genes dysregulated in all studied datasets. Further functional enrichment showed the DEGs mainly enriched in cancer-related processes. Through PPI construction we identified ten hub genes and carried out survival analysis with The Cancer Genome Atlas (TCGA) database which showed that DLGAP5, KIF11, RAD51AP1, CCNB1, AURKA, CDC6, OIP5 and NCAPG have a correlation with a poor prognosis in LUAD. Then the prognostic ability of the signature was validated in LUAD patients in our hospital. The eight-gene signature enriched the biological progress of cell division, a cancer-related pathway. Overall, this study identifies a new signature, a promising biomarker and therapeutic target for LUAD.
Methods
Patient samples
Seventy six LUAD tissue and paired adjacent noncancerous tissue samples were obtained from the Department of Thoracic Surgery, Qingdao University Hospital. The cases were included in the study only if clinical data was available. This study was approved by the Ethical Committee of Qingdao University Hospital, and all surgical patients were informed of the use of their resected samples and clinical data for research and they provided a written informed consent for this study. The tissue specimens were snap frozen in liquid nitrogen shortly after resection and stored at −80°C until RNA extraction. In addition, the sequencing and clinical data of LUAD patients were downloaded from the GEO and the TCGA databases.
Illumina transcriptome sequencing mRNA was collected with oligo (dT) magnetic beads by following the specifications of the manufacturer (Thermo Fisher Scientific, Waltham, MA, USA). The mRNAs were fragmented into short sequences by adding the fragmentation buffers. The cleaved mRNAs were transcribed with random hexamers. Next, buffers, dNTPs, RNase H and the DNA polymerase I were added to synthesize the second-strand cDNA. Then the cDNA was purified with AMPure XP beads (Beckman CoulterInc., Danvers, MA, USA). After end repair and ligation of adaptors, the product was selected with AMPure XP beads and then amplified to create a cDNA library by PCR. The cDNA library was constructed on an IlluminaHiSeq (Illumina, San Diego, CA, USA).
Identification of DEGs
Fragments per kilobase of per million fragments mapped (FPKM) in samples were calculated and combined with RSEM to get relative expression levels in the tissue. Pearson’s correlation coefficient (r) analysis was done to evaluate the correlation between different biological replicates and confirm that the differential expressions of genes were reliable. DESeq (http://wwwhuber.embl.de/users/anders/DESeq) in bioconductor was utilized to evaluate differential gene expressions in two groups. The Benjamini–Hochberg test was applied to obtain the significance of differential gene expression. The P-value was determined with the false discovery rate. The criterion for a DEG was false discovery rate <0.01, as well the ratio of the FPKM value between the groups (fold change) being ≥2.
Kyoto Encyclopedia of Genes and Genomes (KEGG) and gene ontology (GO) enrichment analyses of DEGs
To obtain a more comprehensive set of functions of genes and proteins for researchers to explore biological information, we utilized a free online tool, database for annotation, visualization and integrated discovery (DAVID; http://david.ncifcrf.gov). KEGG is an essential database resource for a deep understanding of functions and biological process from large-scale molecular datasets produced by high-throughput experimental technology.6 GO (is a recognized bioinformatics tool for annotating genes and the analysis of the biological process of target genes.7 To explore the function of DEGs, biological analysis was performed using DAVID online database. P<0.05 was considered statistically significant.
PPI network construction
The PPI network was predicted with the search tool for the retrieval of interacting genes (STRING; http://string-db.org) online database. A sufficient understanding of the functional interaction between proteins can give a better insight into the underlying mechanisms of generation or development of cancers. In our study, the PPI network of genes was constructed with the STRING database and the interaction, with a combined score >0.4, was statistically significant. Then we used Cytoscape, a free bioinformatics platform, to visualize the molecular interaction network.8
Construction and validation of the prognostic gene signature
The intersection of the DEG in the three cohorts was used to construct the predictive signature for survival. These prognostic genes from the TCGA cohort were fitted in a multivariate Cox regression model using the online survival analysis and biomarker validation tool, SurvExpress.9 A prognosis risk score was calculated on the basis of a linear combination of these gene expression levels multiplied by a regression coefficient (β) derived from the multivariate Cox proportional hazards regression model of each gene with the following formula: risk score = expression of gene1 × β1gene1+ expression of gene2 × β2gene2 + … expression of genen × βngenen. We selected the data from a total of 255 patients in LUAD cohorts available in the SurvExpress database: the TCGA- LUAD cohort for individual survival analysis. Then, cohorts of patients from our hospital were used for the prognostic signature validation. The LUAD patients were divided into low-risk and high-risk groups according to the median value of the prognostic risk score.
Statistical analysis
We performed statistical analysis of survival probability on the two groups using the log-rank method. SurvExpress utilizes the log-rank test to draw Kaplan–Meir plots with the “Survival” package of the R software, which is integrated into the website. GraphPad Prism 7.0 was also used for Kaplan–Meir analysis. P-values <0.05 were considered statistically significant.
Results
DEGs screening in LUAD
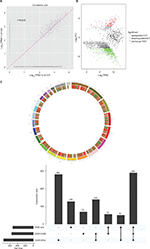
The scatter and volcano plot showed the variation of mRNA expression between LUAD and normal samples (Figures 1A and B). In total, 604 differentially expressed mRNAs with a fold-change of >2.0, including 127 upregulated and 477 downregulated, were identified. The details of DEGs was comprehensively displayed in circos plot (Figure 1C) and after analysis of the gene microarray in the GEO database, we obtained 761 and 556 DEGs in the datasets of GSE33532 and GSE19188, respectively. Finally, a total of 289 genes were identified as differently expressed in all the three datasets (Figure 1D).
Functional annotation of DEGs
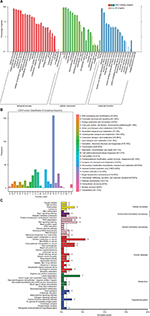
GO enrichment analysis was performed to explore the biological functions of all the DEGs. Based on the sequence homology, unigenes and DEGs were divided into multiple functional groups (Figure 2A). In the biological process ontology, cellular processes and biological regulation were the most enriched terms. In cellular components ontology, cell part, cells and organelles were the most enriched terms. In molecular function ontology, the most enriched terms were binding and catalytic activities. The general functions of transcription and posttranslational modification were the most represented functional clusters after classifying the DEGs in the Cluster of Orthologous Groups database (Figure 2B). We also mapped the DEGs in the KEGG pathway database and classified all pathways into five categories. The result shows that most of the annotated genes were enriched in choline metabolism in cancer, lysine degradation and the Ras signaling pathway. (Figure 2C).
Construction of PPI network and cluster identification
To construct a PPI network, a PPI dataset from STRING in Cytoscape software was applied (Figure 3). DLGAP5, KIF11, RAD51AP1, CCNB1, TRIP13, AURKA, CDC6, OIP5, GINS2 and NCAPG were the top ten genes with highest degree (Table 1).
  | Figure 3 PPI of DEGs. Notes: A larger node means a higher degree. The red nodes represent the hub genes. Abbreviations: DEG, differentially expressed genes; PPI, protein–protein interaction. |
  | Table 1 List of ten hub genes identified in the PPI network Abbreviation: PPI, protein–protein interaction. |
Survival analysis
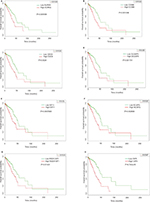
To evaluate the prognostic value of the ten hub genes selected by PPI, the Kaplan–Meier plotter was applied to the patient data in the TCGA database. Overall survival for patients with LUAD was obtained according to the low and high expression of the hub genes. The results showed that high expression of DLGAP5, KIF11, RAD51AP1, CCNB1, AURKA, CDC6 OIP5 and NCAPG were associated with worse overall survivals for LUAD patients (P<0.05) (Figure 4A–H). Thus, to evaluate the prognostic value of the eight genes in LUAD patient survival, we analyzed overall survival in the TCGA-LUAD cohort available in the SurvExpress web tool.
Construction and validation of the eight-gene signature
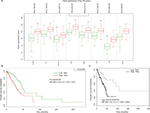
A total of 255 patient samples were divided into high-risk (n=127) and low-risk groups (n=128) based on their expression pattern (Figure 5A). The survival probability estimates in the two risk groups were visualized as Kaplan–Meier plots. Strikingly, overall survival analysis revealed that patients in the high-risk group had poorer survival (HR=2.27; CI=1.42–3.61; P=0.0005759) than the low-risk group (Figure 5B). Thus, our analysis strongly suggests that genes regulated by the eight-gene signature are powerful predictors of a poor prognosis in LUAD patients.
To evaluate the power of the prognostic risk score model for patient survival prediction, the prognostic signature and the cutoff point derived from the TCGA cohort were applied to the patients in our hospital as independent validation (Table 2). The result of the Kaplan–Meier analysis showed a significant difference in patients’ overall survival between the high-risk and low-risk groups (log-rank P=0.00039, HR=3.01, 95% CI=1.924–3.883, Figure 5C).
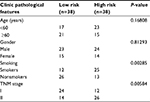  | Table 2 The correlation of LUAD clinic pathological variables with gene expression level in tissue samples Abbreviations: LUAD, lung adenocarcinoma; TNM, tumor, lymph node and metastasis. |
Further analysis for the new biomarkers
Similarly, we carried out PPI analysis for the eight genes (Figure 6). Consequently, function analysis was carried out with the genes in the network (Table 3). Surprisingly, most genes were enriched in the biological progress of cell division which has a high correlation with cell proliferation in cancer. Meanwhile, some genes enriched in the p53 signaling pathway, which has been reported to be involved in LUAD. These results validate the eight-gene signature as a potential biomarker for LUAD.
  | Figure 6 PPI network analysis of the eight-gene signature. Abbreviation: PPI, protein-protein interaction. |
  | Table 3 GO and KEGG pathway analysis of genes in the network Abbreviations: GO, gene ontology; KEGG, Kyoto Encyclopedia of Genes and Genomes. |
Discussion
Thanks to the development of high-throughput technology, people can get a deeper understanding of cancers. Biomarkers for cancers are mostly obtained by identification of significant DEGs in the high-throughput studies of cancer.10–12 However, most studies did not have enough sample size and study of only the samples in the database may lead to imprecise results. The TCGA plan and GEO database already have a large RNA-seq data of tumor samples in multiple cancers. Biomarkers of LUAD have been developed using the TCGA or GEO data.13,14 However, few studies integrated RNA-seq data from the database and their own patients to identify biomarkers in LUAD, which is more reliable and precise for cancer research.
In our study, we made the RNA-seq with LUAD patients in our hospital and selected two studies on LUAD in the GEO database with tumor and non-tumor samples for further analysis. All three datasets were included for a more concise DEGs analysis. Considering the potential error in individual studies, we chose the most significant DEGs across the three studies as candidate genes. In GO analysis, these DEGs showed an association with cellular process and cell part. Pathway analysis showed the genes were mostly enriched in choline metabolism in cancer, lysine degradation, and the Ras signaling pathway. Subsequently, the PPI network was constructed with the DEGs to identify the novel genes and finally, we obtained eight survival-related genes. The signature consisting of eight genes showed a good prognostic and diagnostic ability for LUAD. The eight genes highly related to the eight genes also enriched multiple biological processes, especially cell division which is involved in the pathogenesis of cancers.15
Of these eight genes, some have been proven to have relevance with cancers. For example, AURKA was reported to be associated with colorectal adenocarcinoma.16 KIF11(kinesin family member 11) may be a biomarker for breast cancer.17 A recent study showed that RAD51AP1 associated protein 1 is upregulated in lung cancer patients and is related with mTOR signaling pathway.18 A recent genome-scale analysis identified DLGAP5 as a promising diagnostic and prognostic biomarker in human lung cancer.19 CCNB1 is reported to be a novel therapeutic approach toward colorectal cancer.20 CDC6 could regulate DNA replication licensing, tumorigenesis, and prognosis in lung cancer.21 OIP5 acts as an oncogene in bladder cancer.22 NCAPG is a novel gene for hepatocellular cancer cell proliferation and migration.23 Despite all this research, there is no reliable evidence that the eight genes were involved in the progress of LUAD and influenced the patient’s clinical features. Therefore, this study first identified the prognostic and diagnostic ability of the eight genes and discussed the potential mechanism of these genes. However, further experiments should be carried out to verify our results.
Conclusion
The present study identified an eight-gene signature as a potential biomarker for LUAD patients by analyzing the genome-wide expression profiles from patients and GEO database. The statistical analysis verified the prognostic ability of the signature. However, further investigations are necessary for revealing the mechanism in the process of LUAD development.
Acknowledgment
This work was supported by Shandong Provincial Natural Science Foundation, China (CN) (No. zr2016hm58).
Disclosure
The authors report no conflicts of interest in this work.
References
Siegel RL, Miller KD, Jemal A. Cancer statistics, 2018. CA Cancer J Clin. 2018;68(1):7–30. | ||
Ettinger DS, Akerley W, Borghaei H, et al. Non–Small Cell Lung Cancer, Version 2.2013. J Natl Compr Canc Netw. 2013;11(6):645–653; quiz 653. | ||
Koo HK, Jin SM, Lee CH, et al. Factors associated with recurrence in patients with curatively resected stage I-II lung cancer. Lung Cancer. 2011;73(2):222–229. | ||
La-Ohoo X, Xie L, Song X, Song X. Identification of potential tumor-educated platelets RNA biomarkers in non-small-cell lung cancer by integrated bioinformatical analysis. J Clin Lab Anal. 2018:e22450. | ||
Li Sa-O S X, Miao S, Liu J, Jiao W. Differential protein-coding gene and long noncoding RNA expression in smoking-related lung squamous cell carcinoma. Thorac Cancer. 2017;8(6):672–681. | ||
Tanabe M, Kanehisa M. Using the KEGG database resource. Curr Protoc Bioinformatics. 2005;Chapter 1:Unit 1.12. | ||
The Gene Ontology C, Ashburner M, Ball CA, et al. Gene Ontology: tool for the unification of biology. The Gene Ontology Consortium. Nat Genet. 2000;25(1):25–29. | ||
Demchak B, Hull T, Reich M, et al. Cytoscape: the network visualization tool for GenomeSpace workflows. F1000Res. 2014;3:151. | ||
Aguirre-Gamboa R, Gomez-Rueda H, Martínez-Ledesma E, et al. SurvExpress: an online biomarker validation tool and database for cancer gene expression data using survival analysis. PLoS One. 2013;8(9): e74250. | ||
Zhang C, Peng L, Zhang Y, et al. The identification of key genes and pathways in hepatocellular carcinoma by bioinformatics analysis of high-throughput data. Med Oncol. 2017;34(6):101. | ||
Wei L, Lian B, Zhang Y, et al. Application of microRNA and mRNA expression profiling on prognostic biomarker discovery for hepatocellular carcinoma. BMC Genomics. 2014;15 Suppl 1:S13. | ||
De Marco C, Laudanna C, Rinaldo N, et al. Specific gene expression signatures induced by the multiple oncogenic alterations that occur within the PTEN/PI3K/AKT pathway in lung cancer. PLoS One. 2017;12(6):e0178865. | ||
Shang J, Song Q, Yang Z, et al. Identification of lung adenocarcinoma specific dysregulated genes with diagnostic and prognostic value across 27 TCGA cancer types. Oncotarget. 2017;8(50):87292–87306. | ||
Gan TQ, Chen WJ, Qin H, et al. Clinical Value and Prospective Pathway Signaling of MicroRNA-375 in Lung Adenocarcinoma: A Study Based on the Cancer Genome Atlas (TCGA), Gene Expression Omnibus (GEO) and Bioinformatics Analysis. Med Sci Monit. 2017;23:2453–2464. | ||
Shostak A. Circadian Clock, Cell Division, and Cancer: From Molecules to Organism. Int J Mol Sci. 2017;18(4):E873. | ||
Goos JA, Coupe VM, Diosdado B, et al. Aurora kinase A (AURKA) expression in colorectal cancer liver metastasis is associated with poor prognosis. Br J Cancer. 2013;109(9):2445–2452. | ||
Jiang M, Zhuang H, Xia R, et al. KIF11 is required for proliferation and self-renewal of docetaxel resistant triple negative breast cancer cells. Oncotarget. 2017;8(54):92106–92118. | ||
Chudasama D, Bo V, Hall M, et al. Identification of cancer biomarkers of prognostic value using specific gene regulatory networks (GRN): a novel role of RAD51AP1 for ovarian and lung cancers. Carcinogenesis. 2018;39(3):407–417. | ||
Shi YX, Yin JY, Shen Y, Zhang W, Zhou HH, Liu ZQ. Genome-scale analysis identifies NEK2, DLGAP5 and ECT2 as promising diagnostic and prognostic biomarkers in human lung cancer. Sci Rep. 2017;7(1):8072. | ||
Fang Y, Yu H, Liang X, Xu J, Cai X. Chk1-induced CCNB1 overexpression promotes cell proliferation and tumor growth in human colorectal cancer. Cancer Biol Ther. 2014;15(9):1268–1279. | ||
Zhang X, Xiao D, Wang Z, et al. MicroRNA-26a/b regulate DNA replication licensing, tumorigenesis, and prognosis by targeting CDC6 in lung cancer. Mol Cancer Res. 2014;12(11):1535–1546. | ||
He X, Hou J, Ping J, Wen D, He J. Opa interacting protein 5 acts as an oncogene in bladder cancer. J Cancer Res Clin Oncol. 2017;143(11):2221–2233. | ||
Zhang Q, Su R, Shan C, Gao C, Wu P. Non-SMC Condensin I Complex, Subunit G (NCAPG) is a Novel Mitotic Gene Required for Hepatocellular Cancer Cell Proliferation and Migration. Oncol Res. 2018;26(2):269–276. |
 © 2018 The Author(s). This work is published and licensed by Dove Medical Press Limited. The full terms of this license are available at https://www.dovepress.com/terms.php and incorporate the Creative Commons Attribution - Non Commercial (unported, v3.0) License.
By accessing the work you hereby accept the Terms. Non-commercial uses of the work are permitted without any further permission from Dove Medical Press Limited, provided the work is properly attributed. For permission for commercial use of this work, please see paragraphs 4.2 and 5 of our Terms.

