
Back to Journals » Journal of Hepatocellular Carcinoma » Volume 13
Identification of a Prognostic Gene Signature Based on Lenvatinib Resistance in Hepatocellular Carcinoma with Functional Validation of the Key Gene CPB2
Authors Liu K  , Cheng F, Li C, Cheng S, Wei J, Wu J, Huang S
Received 8 January 2026
Accepted for publication 5 May 2026
Published 14 May 2026 Volume 2026:13 579244
DOI https://doi.org/10.2147/JHC.S579244
Checked for plagiarism Yes
Review by Single anonymous peer review
Peer reviewer comments 3
Editor who approved publication: Dr Ali Hosni
Kan Liu,1,* Fei Cheng,2,* Chao Li,3,* Simiao Cheng,4 Junyan Wei,4 Jianbing Wu,1 Shenglan Huang1
1Department of Oncology, The Second Affiliated Hospital, Jiangxi Medical College, Nanchang University, Nanchang, Jiangxi, People’s Republic of China; 2Department of Gastroenterologic Surgery, The Second Affiliated Hospital, Jiangxi Medical College, Nanchang University, Nanchang, Jiangxi, People’s Republic of China; 3Department of Hepatic & Billiary Surgery, The Second Affiliated Hospital, Jiangxi Medical College, Nanchang University, Nanchang, Jiangxi, People’s Republic of China; 4The Second Clinical medical college, Nanchang University, Nanchang, Jiangxi, People’s Republic of China
*These authors contributed equally to this work
Correspondence: Shenglan Huang, Email [email protected] Jianbing Wu, Email [email protected]
Background: Hepatocellular carcinoma (HCC) is a prevalent and lethal form of liver cancer that necessitates the exploration of innovative strategies due to the limitations of current therapies, including high recurrence rates and drug resistance.
Methods: Lenvatinib-resistant Huh7-LR and PLC/PRF/5-LR cell lines were established. RNA sequence analysis was performed to identify differentially expressed genes associated with lenvatinib resistance in HCC tissues. A prognostic model was constructed using Cox regression analysis incorporating eight prognosis-related genes. A nomogram was developed by combining clinical factors and risk scores. Functional validation of the key gene, CPB2, was performed to explore its role in HCC progression and lenvatinib resistance.
Results: Lenvatinib-resistant Huh7-LR and PLC/PRF/5-LR cell lines exhibited significant resistance indices of 4.59 and 4.37, respectively. RNA sequence analysis revealed 82 genes associated with lenvatinib resistance that were differentially expressed in HCC tissues. The prognostic model stratified patients into high-risk and low-risk groups with significantly distinct overall survival outcomes (p = 3.057e-05). The nomogram demonstrated high concordance in predicting survival probabilities (AUC = 0.78). CPB2 has emerged as a core gene linked to lenvatinib resistance; low expression of CPB2 in HCC tissues is associated with poor prognosis and promotes HCC progression and lenvatinib resistance via inhibition of the MAPK signaling pathway.
Conclusion: These findings underscore the importance of understanding lenvatinib resistance mechanisms, providing a foundation for future therapeutic strategies targeting CPB2, and advancing personalized treatment approaches for HCC.
Keywords: hepatocellular carcinoma, lenvatinib resistance, risk signature, CPB2
Introduction
Hepatocellular carcinoma (HCC) poses a significant global health challenge, ranking among the most common malignancies and a leading cause of cancer-related mortality worldwide.1 However,the prognosis remains dismal, and the 5-year survival rate is no higher than 18%, highlighting its devastating impact.2 A major hurdle to improving outcomes is the persistently low rate of early detection. Most patients are diagnosed at intermediate or advanced stages, significantly limiting curative options.2 While surgical resection or local ablation offers a potential cure for early stage HCC, Liver transplantation is also a curative treatment for early stage liver cancer,3 and advanced disease relies heavily on systemic therapies. Molecular targeted treatment with multikinase inhibitors and immunotherapies4 forms the cornerstone of treatment for advanced HCC.5 Unfortunately, the efficacy of these targeted therapies is frequently compromised by the development of both intrinsic and acquired resistance, leading to suboptimal clinical responses and treatment failures in many patients.6 This resistance is driven by complex and interconnected regulatory networks involving variations in cell signaling pathways, aberrant signaling cascades, tumor microenvironment interactions, and profound metabolic reprogramming.7 Consequently, the fundamental molecular mechanisms underlying HCC pathogenesis, progression, and evolution of resistance to targeted therapies remain inadequately understood, emphasizing the critical need for continued research to elucidate these pathways and identify novel therapeutic vulnerabilities.
Among the emerging therapeutic agents, lenvatinib, a multi-targeted tyrosine kinase inhibitor, has shown promise as a first-line treatment for advanced HCC owing to its non-inferiority to sorafenib.8 However, resistance to lenvatinib is increasingly being recognized as a significant barrier to therapeutic efficacy, ultimately leading to poor prognosis in patients with HCC. Previous studies have identified various potential mechanisms, including alterations in gene expression profiles, epigenetic modifications, and abnormal activation of certain signaling pathways.9,10 However, systematic exploration of these lenvatinib-related genes and pathways remains lacking. Thus, there is a pressing need to elucidate the interplay between genetic factors and clinical characteristics that contribute to patient outcomes, thus paving the way for personalized treatment approaches that could enhance the efficacy of lenvatinib in patients with HCC.
CPB2, also known as thrombin-activatable fibrinolysis inhibitor (TAFI), is a plasma zymogen that is synthesized mainly by the liver.11 CPB2 circulates as an inactive proenzyme and is unstable under physiological conditions, with a half-life of 10 min at 37°C.12 Its structure includes a movement peptide with 55 amino acid segments. In proCPB2, activation by thrombin-thrombomodulin or plasmin (enhanced by glycosaminoglycans) removes this peptide, generating active CPB2 at the injury/inflammation sites.11 CPB2 acts as a carboxypeptidase. Its primary biological function is to inhibit fibrinolysis by cleaving the fibrin C-terminal lysines, thereby reducing plasminogen activation. It also inactivates bradykinin, C3a, and C5a, regulating vascular permeability and complement, thus modulating inflammatory responses and neutrophil extracellular trap (NET) formation.13,14 CPB2 deficiency exacerbates hemolytic uremic syndrome (HUS) and vascular leakage.15 In patients with stroke, CPB2 is rapidly activated during thrombolysis.16 It also protects against sepsis and acute lung injury (ALI) via complement regulation. However, to date, no studies have addressed the relationship between CPB2 and the occurrence and progression of tumors.
In this study, we conducted transcriptome sequencing to identify the genes associated with lenvatinib resistance and differential gene expression in HCC tissues. We aimed to provide a comprehensive framework for understanding the complexities surrounding lenvatinib resistance in HCC and to establish a reliable prognostic signature that can inform clinical decision-making and improve patient management. Furthermore, we verified the effect of CPB2 on the proliferation, migration, and invasion of HCC cells and the drug resistance of Lenvatinit to identify potential therapeutic targets, thereby enhancing treatment outcomes in HCC patients.
Materials and Methods
Cell Culture and Construction of Lenvatinib-Resistant Cells
HCC cells (Huh7, PLC/PRF/5) were purchased from Procell Life Science&Technology Co., Ltd. (Wuhan, China). The cells were cultured in high-glucose DMEM (Solarbio, Beijing, China) supplemented with 10% FBS (Gibco, Grand Island, NY, USA), 100ug/mL streptomycin and 100U/mL penicillin sodium (Biotechnology, Beijing, China). The cells were cultured in a humidified incubator at 37°C and 5% CO2.
Two types of HCC cell lines, Huh7 and PLC/PRF/5, were treated with lenvatinib (MedChemExpress, E7080) for 48 h at concentrations ranging from 0 to 80 μM to determine the half-maximal drug inhibitory concentration (IC50). Culturing commenced at the IC50 dose, with daily monitoring of cell status. Upon cell adaptation to this dose, the lenvatinib concentration increased by 10% IC50. Following a 6-month drug treatment, when RI (resistance index)>3, RI was calculated as the IC50 of lenvatinib-resistant cells divided by that of the parental cells. The lenvatinib-resistant cell lines Huh7-LR and PLC/PRF/5-LR were successfully established.
RNA Sequencing and Screening of Differential Genes Related to Lenvatinib Resistance
RNA sequencing (RNA-seq) was performed on resistant cells (Huh7-LR and PLC/PRF/5-LR) and their parental counterparts (Huh7-P and PLC/PRF/5-P). Initially, RNA from resistant and parental cells was isolated and purified using TRIzol (Invitrogen, CA, USA) according to the manufacturer’s protocol, followed by RNA-seq performed by LC-Bio Technologies Co., Ltd. (Hangzhou, China). Double-ended sequencing was performed using Illumina Novaseq 6000 (LC Bio Technology CO.,Ltd. Hangzhou, China) in accordance with the standard procedures, and the sequencing mode was PE150. Transcriptome data were normalized using Fragments Per Kilobase Million (FPKM) values. Differentially expressed genes between lenvatinib-resistant cells and the corresponding parental cells were assessed using the R package edgeR and were identified based on the criteria of |log2FC|≥1 and p< 0.05. Visualization of the data was accomplished by generating volcano plots using the “ggplot2” package in R.
Acquisition and Processing of Public Datasets
The HCC cohort based on the FPKM format was obtained from TCGA database, including 50 normal and 374 tumor samples. Genes were annotated and distributed into 19659 protein-coding genes and 14142 lncRNAs with reference to the ENSEMBL database (https://www.ensembl.org/), where a total of 11283 protein-coding genes were used for further analysis. We collected clinical information, including age, sex, histological grade, TNM stage, survival status, and survival time, from the UCEC database. The “caret” package in R software was employed to randomly assign 344 samples into a training set (n = 170) and a testing set (n = 174) at a 5:5 ratio. A prognostic model for lenvatinib resistance was developed using the training set and subsequently validated in the testing set.
Construction and Validation for a Prognostic Signature Associated with Lenvatinib Resistance (LR-Sig)
The raw count matrix of the TCGA-LIHC datasets underwent differential analysis and standardized processing through the “DESeq2” R package to identify differentially expressed genes(DEGs) in HCC tissues. The selection criteria were |logFC| ≥1 and p < 0.05. Venn diagrams were used to overlap the DEGs in HCC tissues with genes associated with lenvatinib resistance, resulting in 40 protein-coding genes linked to lenvatinib resistance and differential expression (LR-DEGs). A prognostic assessment of these genes was conducted using univariate Cox regression analysis in the TCGA-LIHC cohort. Genes that significantly influenced prognosis (p <0.05) underwent to variable selection and shrinkage via LASSO regression. A prognostic signature was constructed using multivariate Cox regression analysis. The risk score for each patient was determined using the coefficients from the multivariate Cox regression, and the expression values of each gene were calculated using the following formula: Risk score = [Expression value of Gene 1×coefficient]+[Expression value of Gene 2×coefficient]+…+[Expression value of Gene n×coefficient]. Subsequently, the patients were categorized into high- and low-risk groups based on the median risk score. Kaplan-Meier (K-M) survival analysis was performed to compare overall survival between the two groups. Time-dependent receiver operating characteristic (time-ROC) curve analysis and multi-indicator ROC (multi-ROC) curve analysis were carried out using the R “survival ROC” package to evaluate the predictive performance of the risk signature.
Nomogram Construction and Validation
Multivariate and univariate Cox regression analyses were performed by including other clinical factors (age, sex, tumor grade, and clinical stage) to evaluate the predictive ability of the risk model for the overall survival of HCC patients. Hazard ratios (HR) and 95% confidence intervals (CI) for each variable were calculated based on the basis of being significance at a p-value less than 0.05. A nomogram was established with the risk score and clinical traits to predict the 1-year, 2-year and 3-year survival rates of patients with HCC. Subsequently, calibration curves were generated to estimate the predictive accuracy of the nomogram, and a curve near the 45° line indicated a better prediction. The nomogram and calibration curves were built with the “rms” R package.
Enrichment Analysis
Differential gene expression analysis was conducted in the high- and low-risk groups using the TCGA-LIHC dataset. Subsequently, these expression genes were incorporated into GO enrichment analysis using the R “ClusterProfiler” package to identify enriched terms across three ontologies: biological process (BP), cellular component (CC), and molecular function (MF). To elucidate the impact of the risk model on biological functions and cellular activities in HCC, the top 10 significantly enriched GO terms were selected based on a significance threshold of p <0.05. To identify differential biological pathways between high- and low-risk groups, Gene Set Enrichment Analysis (GSEA) was carried out with the “c2.cp.kegg.v2025.symbols. The gmt Hallmark” gene set was obtained from the MSigDB database. The ranked gene list was inputted into GSEA software (version 4.1.0), employing 100 permutations. Key outputs, including the gene set enrichment score (ES), normalized enrichment score (NES), nominal p-value, and false discovery rate (FDR) were determined. Significantly enriched gene sets were visualized if they met the criteria of p <0.05 and an absolute NES value ≥1.5.
Construction of Plasmids and Transfection
The CPB2 overexpression vector was constructed using GeneChem (Shanghai, China), with the target gene CPB2 cloned into the GV712 vector. Drug-resistant cell lines (Huh7-LR, PLC/PRF/5-LF) were selected for transfection. When the cells reached 70%-80% confluence, transfection was performed using Lipofectamine 3000 according to the manufacturer’s instructions. After 4–6 hours of incubation, the medium was replaced with a complete medium containing 10% FBS, followed by further culture for 24–48 hours. To detect the expression of CPB2 at both the protein and mRNA levels, Western blotting or quantitative real-time PCR (qPCR) was used to evaluate the transfection efficiency.
Western Blotting
Protein extraction and Western blotting were performed as previously reported.17 Cells were lysed in lysis buffer (Solarbio) supplemented with complete ULTRA Tablets (Solarbio) and PhosphoStop (Solarbio) to inhibit protease and phosphatase activity, respectively. Protein concentration was quantified using a BCA assay kit (Solarbio). Equivalent protein amounts were resolved by SDS-PAGE and subsequently transferred onto a PVDF membrane (Millipore). After blocking with 5% skim milk in TBST (Tris-buffered saline containing 0.1% Tween-20, pH 7.4), the membrane was incubated sequentially with the relevant primary antibodies and HRP-conjugated secondary antibodies. Signal detection was performed using FluorChem E imaging system (Bio-Rad). The primary antibodies used were as follows: antin-CPB2 (YT4533, Immunoway), anti-MEK1/2(YM8273, Immunoway), anti-pMEK1/2 (Phospho Ser217/221,YM8556, Immunoway), anti-ERK1/2(YM8336, Immunoway), and anti-pERK1/2 (Phospho Thr202/Tyr204, YM8452, Immunoway). HRP-conjugated secondary antibodies were added and incubated at room temperature for 1 hour. An ECL chemiluminescent substrate (US Everbright Inc., Suzhou, China) was used to visualize the protein bands on the PVDF membrane using a gel imaging system. GAPDH served as the internal control, and ImageJ software was used to analyze band intensities to calculate the relative expression levels of target proteins.
Cell Viability Measurements
HCC cells were inoculated into 96-well plates at a density of 5×10³ cells per well. Following a 24-hour incubation period, the original medium was replaced with lenvatinib-containing medium at varying concentrations. The cells were further incubated for 48 h, after which 10 μL of the CCK-8 reagent was added to each well and incubated at 37°C for 2 h. The absorbance at 450 nm was measured using an enzyme-linked immunosorbent assay reader to determine cell viability. Cell viability was calculated using the following formula: cell viability (%) = (OD value of the experimental group - OD value of the blank group)/(OD value of the control group - OD value of the blank group) ×100%. The half-maximal inhibitory concentration (IC50) was calculated to assess the drug resistance.
Colony Formation Assays
The cell density was adjusted to 500 cells/well and plated in 6-well plates. Cell distribution was ensured by gently shaking the plates before incubating them at 37°C with 5% CO2 for 10–14 days. The culture medium was refreshed every 3–4 d to monitor colony growth. Upon visible colony formation, the cells were fixed with 4% paraformaldehyde for 30 min and stained with 0.1% crystal violet solution at room temperature for 15 min. After air drying, the colonies were enumerated with more than 50 cells under a microscope. Assess and compare colony-forming capacity among various treatment groups.
EdU Cell Proliferation Assay
HCC cells were seeded at a density of 5×10⁴ cells per well in a 96-well plate, with each well containing 100 μL of complete medium, and allowed to adhere. Following the protocol of the EdU kit (YF 555 Click-iT EdU kit, C6016L, US Everbright® Inc., China), EdU working solution with a final concentration of 10 μM was added to the wells and then incubated for 2 h to facilitate EdU incorporation into proliferating cells. Subsequently, the cells were fixed with 4% paraformaldehyde for 30 min and treated with a permeabilization buffer (PBS with 0.5% Triton X-100) for 10 min. EdU reaction solution was then applied and incubated at room temperature in the dark for 30 min. Next, nuclei were stained with Hoechst 33342 for 10 min. Fluorescence microscopy was used for the imaging and quantification of EdU-positive cells. The cell proliferation rate was calculated using the following formula: Cell proliferation rate = (number of EdU-positive cells/total number of cells) × 100%.
Cell Migration and Invasion
We conducted a cell migration assay using transwell chambers without Matrigel coating. After adjusting the cells to a density of 1×10⁶ cells/mL, we added 200 μL of serum-free cell suspension to the upper chamber, and the lower chamber was loaded with 600 μL of medium with 10% fetal bovine serum (acting as a chemoattractant). Following a 24-hour incubation, the upper chamber’s medium was aspirated, and non-migrated cells on the upper membrane surface were gently swabbed off. Thereafter, the cells were washed with PBS, fixed in 4% paraformaldehyde, stained with 0.1% crystal violet for 15 min, rinsed in water, and air-dried. Cell migration ability was assessed by counting the number of cells that traversed the membrane under a microscope. For the invasion assay, the upper transwell chamber was pre-coated with Matrigel (diluted 1:8, added to the upper chamber, and solidified at 37°C for 4–6 h). The subsequent procedures mirrored those used in the migration assay. Cell invasion capability was determined by quantifying the cells that breached both the Matrigel and the membrane.
Flow Cytometry for Cell Apoptosis Assay
Apoptosis was detected using FITC-annexin V and PI apoptosis kits (F6012, US Everbright® Inc., China). Cultured cells were trypsinized without EDTA, centrifuged at 1000 rpm for 5 min, and resuspended in 300 μL Binding Buffer to achieve a concentration of 1×10⁶cells/mL. Subsequently, 100 μL of this cell suspension was transferred to a new flow cytometry tube, to which 5 μL of Annexin V-FITC and 5 μL of PI were added. After gentle mixing, the mixture was incubated at room temperature in the dark for 15 minutes. Next, 400 μL of Binding Buffer was added to each tube, and the samples were analyzed using a flow cytometer (BD Biosciences). The FITC channel was used to detect Annexin V-FITC fluorescence, whereas the PI channel was employed for PI fluorescence detection. A two-parameter scatter plot was utilized for cell apoptosis analysis, distinguishing viable cells (Annexin V−/PI−), early apoptotic cells (Annexin V⁺/PI−), and late apoptotic/necrotic cells (Annexin V⁺/PI⁺). The proportion of each cell subpopulation was calculated to compare the differences in apoptosis rates among the various treatment groups.
Xenograft Mouse Model
Female nude SPF mice aged four weeks were purchased from Sibeifu Biotechnology Co., Ltd. (Beijing, China, License number:SCXK(jing)2024–001). Mice were randomly assigned to two groups (n=10 per group): OE-NC Huh7-LR and OE-CPB2 Huh7-LR. HCC cells were adjusted to a concentration of 1×10⁷ cells/mL and a 200 μL cell suspension (containing 2×10⁶ cells) was subcutaneously injected into one side of the dorsal region of each mouse. Tumors were monitored twice a week. When the tumor volume reached 50±10 mm3, mice in each group were randomly divided into two subgroups. One subgroup received lenvatinib treatment via gavage, while the other received DMSO treatment for a duration of two weeks. Tumor dimensions, including length (L) and width (W), were measured twice a week using a Vernier caliper, starting from the first day of treatment. Tumor volume was calculated using the formula V = 0.5×L×W2, and tumor growth curves were constructed. After 30 days, the mice were euthanized by carbon dioxide asphyxiation, the tumors were excised completely, and the tumor weight was measured using an electronic balance. All animal experiments were approved by the Institutional Animal Care and Use Committee of Nanchang Royo Biotech Co. Ltd. Ltd (Ethics ID: RYE2023120301). All experimental methods were performed in accordance with the Chinese Regulations for the Protection and Use of Animals.
Statistical Analysis
Statistical analyses and graphical representations were performed using GraphPad Prism (version 9.0; GraphPad Software, CA, USA) or R software version 4.0.4 (https://www.r-project.org/). Normality was assessed using the Shapiro–Wilk test, and homogeneity of variance was confirmed using Levene’s test. Student’s t-test was used to compare two groups with normally distributed data, whereas the Mann–Whitney U-test was used for non-normally distributed data. Survival curves were generated using the Kaplan-Meier method, and group disparities were assessed using the Log rank test. Prognostic risk models were developed using LASSO and Cox regression analyses and hazard ratios (HR) and 95% confidence intervals (CI) were calculated. The significance threshold was set at p < 0.05. Each experiment was replicated at least three times, and the results are presented as mean ± standard deviation(SD).
Results
Identification of Lenvatinib Resistant Differential Expressed Genes in HCC
Lenvatinib-resistant cell lines Huh7 (Huh7-LR) and PLC/PRF/5 (PLC/PRF/5-LR) were established. The IC50 values indicated significantly higher resistance in the lenvatinib-resistant cells than in the parental cells, with RI=4.59 of Huh7-LR and 4.37 for PLC/PRF/5 (Figure 1a and b). Colony formation assays treated with lenvatinib (10 μM) demonstrated a notable increase in colony formation in the resistant cell lines compared to the parental cells (Figure 1c–e). Similarly, flow cytometry apoptosis assays revealed a higher proportion of apoptotic cells in parental cells than in resistant cells following lenvatinib treatment (10 μM) (Figure 1f–h).
 |
Figure 1 Construction of lenvatinib resistant cell lines and screening of genes related to drug resistance. (a and b) Lenvatinib-resistant cell lines Huh7-LR and PLC/PRF/5-LR were subjected to IC50 determination using the CCK8 assay; (c–e) Evaluation of drug resistance was conducted through cell plate cloning assay, comparing clone proliferation between parental cells and resistant cells, with results quantified in a histogram, (n = 3, error bars ± SD); (f–h) Apoptosis levels in resistant and parental cells were assessed via flow cytometry, with results presented in a histogram and quantified, (n = 3, error bars ± SD); (I and j) Volcano plots displayed differentially expressed genes in Huh7-LR and PLC/PRF/5-LR compared to their respective parent cell lines, as identified through RNA sequencing; (k and l) KEGG analysis revealed predominant involvement of differentially expressed genes in biological processes for Huh7-LR (k) and PLC/PRF/5-LR (l); (m) Volcano plots displayed differentially expressed genes in HCC tissues compared to normal tissues based on the TCGA-LIHC dataset; (n) A Venn diagram illustrated the overlap between differentially expressed genes in drug-resistant cell lines and HCC tissues.*p<0.05,***p<0.001. |
Subsequent transcriptome sequencing was conducted on Huh7 cells (Huh7-LR vs. Huh7-P) and PLC/PRF/5 cells (PLC/PRF/5-LR vs. PLC/PRF/5-P). Differentially expressed genes in resistant cells are presented in Figure 1i and j. Huh7-LR cells exhibited 4,483 upregulated and 1,086 downregulated genes compared to parental cells, while PLC/PRF/5-LR cells showed 674 upregulated and 254 downregulated genes. KEGG enrichment analysis identified significant enrichment of pathways such as “Focal adhesion,” “Regulation of actin cytoskeleton,” “PI3K−Akt signaling pathway,” “MAPK signaling pathway,” “Pathways in cancer,” and “Metabolic pathways” (Figure 1k and L). Subsequently, transcriptomic data from 374 tumor samples and 50 normal tissues were acquired from the TCGA-LIHC dataset. Differentially expressed genes in HCC tissues were identified using the criteria of |logFC| ≥ 1 and p <0.05, yielding 5345 upregulated and 1881 downregulated genes (Figure 1m). The Venn diagram in Figure 1n shows 82 differentially expressed genes associated with lenvatinib resistance and significantly altered genes in HCC tissues. Among these, 40 were protein-coding genes, which were subsequently subjected to prognostic analysis.
Establishment and Validation the Lenvatinib Resistance Related Prognostic Model in HCC Patients
Univariate Cox regression analysis conducted on the training set identified eight prognosis-related genes (p <0.05, Table 1). Thereafter, a multivariate Cox regression model was developed; the HR value and coefficient for each gene are presented in Table 1. Among these eight genes, CPB2, HPX, ELFN1, SERPINA4, IL1RN, and CPED1 exhibited HR values less than 1, whereas SERPINE1 and KRT17 showed HR values greater than 1. Risk scores were then computed for individual patients, leading to stratification of the training set into high-risk (n = 84) and low-risk (n = 85) groups according to the median score. The results of the survival analysis indicated significantly poorer outcomes for high-risk HCC patients compared to the low-risk group (p = 3.057e-05), as shown in Figure 2a. The risk score curve and scatter plot indicated a higher likelihood of mortality among the patients in the high-risk group (Figure 2b). The AUCs for 1-year, 3-year, and 5-year survival were 0.781, 0.724, and 0.705, respectively, confirming the accurate prediction of overall survival by the risk model (Figure 2c). Subsequently, age, sex, grade, stage, and risk model were incorporated into univariate and multivariate Cox proportional hazards regression analyses. The results demonstrated that the clinical stage (HR = 1.748, 95% CI [1.279–2.390], p < 0.001) and risk model (HR = 1.18, 95% CI [1.079–1.291], p < 0.001) were independent predictors of OS in patients with HCC (Figure 2d and Figure 2e). Furthermore, multi-index receiver operating characteristic (multi-ROC) curve analysis revealed that the risk model achieved the highest AUC value of 0.784 compared to other clinical features (age, sex, grade, and stage) (Figure 2f), suggesting that the lenvatinib resistance-related risk model provided a more precise survival prediction for patients with HCC than other clinical characteristics.
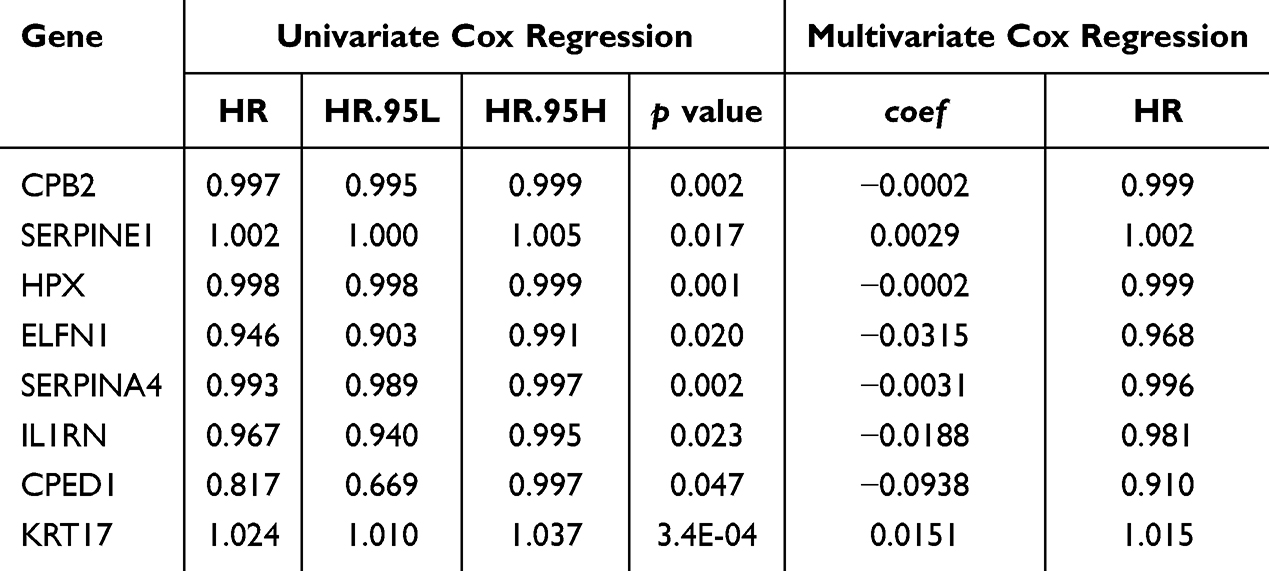 |
Table 1 Univariate and Multivariate Cox Regression Analysis of Lenvatinib-Related Genes |
 |
Figure 2 Construction and validation of the Lenvatinib resistance related prognostic risk signature based on TCGA database. (a) Kaplan-Meier survival analysis of the high- and low-risk groups in training group; (b) Risk score curves and survival state of each patient in training group; (c) Time-ROC curve assessed the accuracy of the prognostic model in predicting 1-, 2-, and 3-year OS in training group; (d) Univariate regression analysis assessing the impact of risk signature and clinical characteristics on overall survival in training group; (e) Multivariate regression analysis evaluating the influence of risk signature and clinical characteristics on overall survival in training group; (f) Multi-ROC curve analysis comparing the predictive accuracy of risk signature and other clinical characteristics in training group; (g) Kaplan-Meier survival analysis of the high- and low-risk groups in testing group; (h) Risk score curves and survival state of each patient in testing group; (i) Time-ROC curve assessed the accuracy of the prognostic model in predicting 1-, 2-, and 3-year OS in testing group; (j) Univariate regression analysis assessing the impact of risk signature and clinical characteristics on overall survival in testing group. (k)Multivariate regression analysis evaluating the influence of risk signature and clinical characteristics on overall survival in tesing group; (l) Multi-indicator ROC curve analysis comparing the predictive accuracy of risk signature and other clinical characteristics in testing group. |
The performance of the risk score was evaluated through internal validation using independent samples within the testing set obtained from TCGA database. Consistent with previous findings, the high-risk group displayed notably lower OS rates than the low-risk group (Figure 2g and h). The areas under the curve (AUC) for the 1-year, 3-year, and 5-year ROC curves were 0.767, 0.627, and 0.611, respectively (Figure 2i). Corresponding to the results from the training set, both Univariate and Multivariate Cox regression analyses indicated that clinical stage [HR = 1.718, 95% CI (1.25–2.36), p < 0.001] and the risk model [HR = 1.527, 95% CI (1.002–2.328), p =0.049] were independent predictors of OS in testing patients (Figure 2j and k). Analysis of multiple ROC curves demonstrated that the AUC value of the risk model (0.735) exceeded those of the other clinical factors in the testing group (Figure 2L).
Construction of a Nomogram for the Prediction of Overall Survival
A prognostic nomogram model was developed in the training cohort to improve the accuracy of patient prognosis prediction. This model integrated various clinical factors, including age, sex, grade, clinical stage, and risk (Figure 3a). Calibration curves for the 1-year and 3-year predictions revealed a high level of concordance between the nomogram-predicted probabilities and observed outcomes (Figures 3b–c). The AUC values for the 1-year and 3-year predictions were both 0.78, underscoring the precision and dependability of the model (Figures 3d and Figure 3e).
 |
Figure 3 Construction and verification of the predictive nomogram for patients with HCC. (a) Nomogram predicting the survival probability of 1-year and 3-year OS in training group; (b) Calibration curve of the nomogram for predicting 1-year OS in training group; (c) Calibration curve of the nomogram for predicting 3-year OS in training group; (d) Multi-indicator ROC curves of the nomogram for 1-year OS in training group; (e) Multi-indicator ROC curves of the nomogram for 3-year OS in training group; (f) Nomogram predicting the survival probability of 1-year and 3-year OS in testing group; (g) Calibration curve of the nomogram for predicting 1-year OS in testing group; (h) Calibration curve of the nomogram for predicting 3-year OS in testing group; (i) Multi-indicator ROC curves of the nomogram for 1-year OS in testing group; (j) Multi-indicator ROC curves of the nomogram for 3-year OS in testing group. |
Moreover, the prognostic performance of the nomogram in the testing cohort was consistent with that in the training cohort (Figure 3f). The calibration curves demonstrated a close alignment with the actual results for both cohorts (Figures 3g and Figure 3h). For the 1-year and 3-year predictions, the AUC values were 0.783 and 0.672, respectively, surpassing the predictive capacity of tumor grade and clinical stage and emphasizing the superior predictive performance of the nomogram (Figure 3i and Figure 3j).
Potential Biological Pathways and Protein Interaction Analysis of Lenvatinib Resistance Related Risk Model
To investigate the association between the lenvatinib-related risk model and the HCC development, we conducted Gene Set Enrichment Analysis (GSEA) and Gene Ontology (GO) enrichment analyses on specimens from the TCGA-LIHC dataset, utilizing risk stratification as a grouping variable. The GO enrichment analysis unveiled that high-risk group was significantly involved in Biological Processes (BP) linked to cell division, encompassing “mitotic nuclear division,” “nuclear division,” “organelle fission,” and “extracellular matrix organization” (Figure 4a). GSEA enrichment analysis showed that pathways like “DNA replication,” “cell cycle,” and “pyrimidine metabolism” were notably enriched in the high-risk group (Figure 4b–d), which indicates heightened proliferative potential in this group. Subsequently, we scrutinized protein-protein interactions (PPIs) among the 40 LR-DEGs using the STRING database (https://string-db.org) with a medium confidence threshold (0.40). The outcomes revealed PPIs among 24 genes, with CPB2 identified as a central hub gene (Figure 4e).
 |
Figure 4 Analysis of potential biological pathways and protein-protein interactions in the prognostic model associated with resistance to lenvatinib. (a) Gene Ontology (GO) enrichment analysis comparing biological functions in high-risk versus low-risk cohorts; (b–d) Gene Set Enrichment Analysis (GSEA) identified markedly enriched signaling pathways in high-risk cohorts; (e) Examination of protein-protein interactions was performed on 40 protein-coding genes implicated in lenvatinib resistance and exhibiting distinct expression patterns in HCC tissues, highlighting CPB2 as the central gene. |
Low Expression of CPB2 is Associated with Poor Prognosis and Promotes HCC Progression and Lenvatinib Resistance
Previous analyses have confirmed that CPB2 serves as a protective prognostic factor (HR < 1) and is a core gene linked to lenvatinib resistance. Subsequently, we analyzed the differential expression between tumor and adjacent tissues in the TCGA-LIHC dataset and HCC tissues, revealing that CPB2 is downregulated in tumor tissues at both the mRNA and protein levels (Figure 5a–c). Kaplan-Meier analysis and Log rank test demonstrated a positive correlation between low CPB2 expression and shorter overall survival (OS)(Figure 5d), progression-free interval (PFI) (Figure 5e), and disease-specific survival (DSS) (Figure 5f). Additionally, binary logistic regression analysis examining the association between CPB2 expression and clinicopathological characteristics of HCC patients revealed that high CPB2 expression correlated with more favorable pathological stage, histological grade, tumor stage, and lower AFP levels (Table 2). These results indicate that the reduced expression of CPB2 in HCC tissues facilitates tumor progression. To validate this, we upregulated CPB2 in HCC cells (Huh7 and PLC/PRF/5) and evaluated its effect on cell proliferation using the CCK8 and EdU assays. The overexpression efficacy was validated using Western blotting, which indicated a notable increase in CPB2 expression after transfection with the CPB2 overexpression plasmid (Figure 5g). The findings indicated that increased CPB2 expression notably hindered the proliferation of HCC cells (Figure 5h and i) and diminished their DNA replication relative to the control group (Figure 5j). Furthermore, increased CPB2 expression suppressed the migratory and invasive potential of HCC cells (Figure 5k and Figure 5L).
 |
Table 2 The Relationship Between CPB2 Expression and Clinicopathological Parameters |
 |
Figure 5 Low CPB2 expression in HCC is associated with poor prognosis and promotes tumor progression. (a–c) CPB2 expression was markedly reduced in HCC compared to normal liver tissue in unpaired (a) and paired (b) HCC samples from the TCGA-LIHC dataset, as well as in clinical samples post liver cancer surgery (c); (D and E) Kaplan-Meier survival analysis investigating the association between CPB2 expression levels and overall survival (d), progression-free survival (e), and disease-specific survival (f) of HCC patients; (g) An overexpression plasmid of CPB2 was transfected into Huh7 and PLC/PRF/5 liver cancer cells, and Western blot analysis confirmed the efficacy of overexpression; (h and i) CCK8 assay assessing the impact of CPB2 overexpression on HCC cell proliferation (n = 3, error bars ± SD); (j) EdU staining evaluating the effect of CPB2 on DNA replication; (k and l) The migration (k) and invasion (l) abilities of HCC cells following CPB2 overexpression were assessed using Transwell assays. **p<0.01,***p<0.001. |
Subsequently, we investigated the association between CPB2 and lenvatinib resistance in HCC cells. Western blot analysis revealed decreased CPB2 expression in lenvatinib-resistant cells compared to that in parental cells (Figure 6a). Subsequently, drug-resistant cells were transfected with a CPB2 overexpression plasmid, and the efficiency of overexpression was verified (Figure 6b). Notably, compared to the negative control(NC), augmenting CPB2 expression increased the susceptibility of lenvatinib-resistant cells, as evidenced by a substantial decrease in IC50 (Figure 6c and d). Upon exposure to lenvatinib, CPB2 overexpression impeded cell proliferation, leading to marked reduction in colony formation (Figure 6e–g). Moreover, flow cytometry analysis revealed that the overexpression of CPB2 in lenvatinib-resistant cells amplified the population of apoptotic cells, thereby increasing their responsiveness to lenvatinib treatment (Figure 6h–j).
 |
Figure 6 CPB2 overexpression in HCC cells increases sensibility to lenvatinib. (a) Western blot analysis revealed low expression of CPB2 in drug-resistant cells; (b)Huh7-LR and PLC/PRF/5-LR cell lines were transfected with an overexpression plasmid (OE-CPB2), and the efficiency of overexpression was assessed using Western blot analysis. (c and d) The resistance to lenvatinib in Huh7-LR and PLC/PRF/5-LR cells transfected with the CPB2 overexpression plasmid was analyzed using CCK8 assays (e–g) Cell cloning experiments showed that transfection of the CPB2 plasmid decreased the formation of HCC cell clones following treatment with DMSO or lenvatinib(e), with quantitative results presented in histograms (n = 3, error bars ± SD)(f and g); (h–j) Flow cytometry analysis indicated that transfection of the CPB2 plasmid increased the apoptosis ratio of HCC cells treated with DMSO and lenvatinib(h), with quantitative results displayed in a histogram (n = 3, error bars ± SD) (I and j). *p<0.05, **p<0.01,***p<0.001. |
Overexpression of CPB2 Increases Sensitivity of Drug-Resistant Cells to Lenvatinib by Inhibiting MAPK Signaling Pathway
To further analyze the biological processes and associated signaling pathways involving CPB2, we conducted GO and GSEA analyses of differentially expressed genes downstream of CPB2. GO analysis revealed that CPB2 is primarily involved in immune-related pathways, including “humoral immune response”, “lymphocyte-mediated immunity, and “complement activation” (Figure 7a). The GSEA analysis revealed that the CPB2 low-expression cohort exhibited significant enrichment in pathways such as “MAPK signaling,” “NOTCH signaling,” “VEGF signaling,” “Purine metabolism” and “Pyrimidine metabolism” (Figure 7b). Previous studies have reported that the MAPK signaling pathway is closely associated with HCC progression and lenvatinib resistance.8 Western blotting confirmed that elevated CPB2 expression in HCC cells led to decreased p-MEK1/2 and p-ERK1/2 protein levels, consequently suppressing the MAPK pathway (Figure 7c). Consequently, diminished CPB2 expression in HCC cells markedly facilitated tumor growth and conferred lenvatinib resistance, likely mediated by modulation of the MAPK signaling pathway.
 |
Figure 7 CPB2 enhances the susceptibility of drug-resistant cells to lenvatinib through the suppression of the MAPK signaling pathway. (a) Gene Ontology (GO) enrichment analysis elucidated the primary biological functions associated with CPB2; (b) Gene Set Enrichment Analysis (GSEA) identified pathways significantly enriched in CPB2 low-expression group; (c) Western blot analysis confirmed the impact of CPB2 overexpression on MAPK pathway proteins in HCC cells; (d and e) Subcutaneous tumor formation assays in nude mice demonstrated that DDX1-overexpressing Huh7-LR cells regained sensitivity to lenvatinib; (f and g) Tumor growth curve were assessed in the OE-CPB2 and Vector groups following treatment with DMSO or lenvatinib; (h and i) Tumor weight were assessed in the OE-CPB2 and Vector groups following treatment with DMSO or lenvatinib. *p<0.05, **p<0.01,***p<0.001. |
Subsequently, subcutaneous tumor formation was induced in nude mice by using CPB2-overexpressing Huh7-LR cells. When the tumor volume reached 50 ±10 mm3, the mice were administered lenvatinib or DMSO via oral gavage. The results indicated that the CPB2-overexpressing group displayed heightened sensitivity to lenvatinib treatment compared to the control group, manifesting as a reduced tumor growth rate, diminished tumor volume, and decreased tumor weight (Figure 7d–i).
Discussion
Hepatocellular carcinoma (HCC) is one of the most prevalent and aggressive forms of liver cancer and accounts for a significant proportion of cancer-related deaths worldwide. The incidence of HCC is increasing due to the increasing prevalence of non-alcoholic fatty liver disease (NAFLD) and chronic viral hepatitis, necessitating urgent advancements in diagnostic and therapeutic strategies.18,19 A previous study found that ESR1 in icaritin can inhibit the malignant proliferation of liver cancer cells and increase cellular sensitivity to icaritin, making it a new target in HCC.20 Xu et al discovered that miR-3130-5p can also serve as a novel prognostic biomarker and potential therapeutic target for liver cancer. miR-3130-5p directly binds to a specific region (3’-UTR) of the FDX1 gene, thereby inhibiting the expression of FDX1 and promoting liver cancer progression both in vitro and in vivo.21 Lenvatinib, a multi-targeted tyrosine kinase inhibitor, has emerged as the first-line therapy for advanced HCC. However, resistance to this treatment is a substantial clinical challenge, which limits its effectiveness.22 Therefore, further investigations into the underlying mechanisms of HCC progression and novel therapeutic interventions are warranted.
Previous studies have identified various gene signatures, such as sorafenib resistance-related genes (SRGs), epithelial-mesenchymal transition (EMT)-related genes, and genes related to fatty acid synthesis and metabolism as prognostic biomarkers for HCC, predicting both prognosis and therapeutic response.23–25 However, there have been no reports of constructing a risk model based on lenvatinib resistance-related genes to predict the prognosis of patients with HCC. This study aimed to address this gap by establishing an LR-DEGs prognostic model utilizing lenvatinib-resistant HCC cell lines to elucidate the roles of key genes and their mechanisms, facilitating the early identification of lenvatinib resistance and poor prognosis in HCC patients for tailored interventions. Differentially expressed genes in lenvatinib-resistant HCC cells and tissues were identified in this study. Subsequently, the LR-Sig was constructed using univariate and multivariate Cox regression analyses. LR-Sig effectively categorized HCC patients into distinct prognostic groups, with high-risk patients experiencing significantly worse survival outcomes than low-risk patients, thus acting as an independent prognostic indicator. The predictive performance of LR-Sig was confirmed through time-ROC and multi-ROC analyses, demonstrating that the AUC outperformed that of other clinical factors such as tumor grade and clinical stage, indicating high specificity and sensitivity in survival prediction. The risk score-based prognostic model exhibited superior predictive accuracy compared with traditional clinical staging. External validation in independent clinical cohorts further substantiated that patients with high-risk scores had poorer prognosis. Furthermore, GO and GSEA enrichment analyses demonstrated that the high-risk cohort exhibited significant enrichment in pathways related to “nuclear division,” “DNA replication,” and “cell cycle.” This suggests an augmented proliferative and replicative potential of tumor cells within the high-risk group, ultimately resulting in reduced overall survival.
This prognostic model comprises eight genes: CPB2, HPX, ELFN1, SERPINA4, IL1RN, CPED1, SERPINE1, and KRT17. HPX has been identified as a diagnostic marker for several types of tumors, including liver cancer, pancreatic cancer, breast cancer, and lung cancer.26 Proteomic analysis comparing pancreatic cancer patients with lymph node metastasis (LN+) to those without metastasis (LN-) showed increased HPX expression in the stroma of LN+ pancreatic cancer.27 Elevated HPX expression in the stroma was found to enhance the invasive potential of pancreatic cancer cells.27 However, Canesin et al observed that HPX levels in the stroma of prostate cancer were lower than those in benign tissues, and low levels of stromal HPX were linked to poor prognosis and early disease recurrence.28 SERPINA4 is pivotal for inhibiting tumor growth and angiogenesis in different malignancies. In colorectal cancer, the expression of SERPINA4 are notably reduced in tumor tissues compared to normal tissues and is closely linked to the extent of tumor invasion, lymph node engagement, and distant metastasis. Furthermore, SERPINA4 is an autonomous prognostic factor for disease-free survival and overall survival among colorectal cancer patients.29 IL1RA, a potent competitive antagonist of IL1, plays a crucial role in regulating inflammation, and is closely linked to tumorigenesis, progression, and immune suppression.30,31 Elevated IL-1Ra expression has been detected in human pancreatic ductal adenocarcinoma (PDA) and is positively correlated with malignant advancement, IL1RN knockout cells in immunocompetent mice demonstrated heightened tumor-suppressive capabilities.31 Conversely, another study indicated that increased levels of IL1RA can lower the risk of acute and chronic pancreatitis, as well as pancreatic cancer development.32 In patients with advanced pancreatic cancer (PCa), elevated serum IL1RN levels are linked to increased disease aggressiveness and infiltration of M2-like macrophages. This effect is mediated through the activation of the MAPK/AKT signaling pathway via CHRM interaction.33 SERPINE1, a serine protease inhibitor, is upregulated in multiple malignancies. Elevated SERPINE1 expression in gastric cancer is correlated with increased tumor aggressiveness, lymphatic spread, and adverse prognostic factors.34 Through resistance to anoikis and facilitation of M2 macrophage polarization, SERPINE1 inhibits CD8+ T cell infiltration and function in the tumor microenvironment (TME), playing a pivotal role in driving gastric cancer advancement.35 KRT17 expression is a significant indicator of aggressiveness across various cancer histological types, correlating with reduced patient survival, resistance to specific chemotherapy, and targetable functional domains.36 Previous studies have indicated that KRT17 plays a crucial oncogenic role in cervical cancer cell survival, migration, and resistance to paclitaxel.37 In osteosarcoma, elevated KRT17 levels are observed, and its depletion suppresses cell proliferation, induces cell cycle arrest, and inhibits glycolysis.38 The association between CPB2 and tumors remains unexplored. Our protein-protein interaction analysis identified CPB2 as a key gene. This research unveils CPB2’s protective function in HCC, showing its reduced expression in tumor tissues. Experimental findings indicate that CPB2 overexpression in HCC cells suppresses tumor growth and invasion, re-establishes responsiveness to lenvatinib treatment, and boosts drug-induced cytotoxicity in tumor cells. Targeting CPB2 may represent a novel avenue for overcoming lenvatinib resistance, thereby improving treatment response in patients with HCC.
Understanding the biological pathways and mechanisms associated with lenvatinib resistance is crucial for identifying new therapeutic targets in HCC. Genetic alterations in cellular signaling pathways, whether primary or acquired, can lead to resistance to targeted therapies that focus on these pathways, including EGFR, cMET, oxidative stress pathways, and abnormal activation of the AKT/mTOR, VEGF receptor, and MAPK signaling pathways.7 Zhang et al found that NAT10 catalyzes ac4C modification, stabilizes the mRNA of the oncogene SMAD3, and subsequently activates the TGF-β signaling pathway, thereby promoting the proliferation, invasion, and epithelial-mesenchymal transition (EMT) of liver cancer cells, while inhibiting anoikis. Their study revealed the potential of NAT10 as a therapeutic target in liver cancer.39 Notably, the MAPK/ERK pathway plays a crucial role in the pathogenesis of HCC. Fu et al showed that HGF/c-MET activation stimulates the PI3K/AKT and MAP/ERK pathways, promoting the epithelial-mesenchymal transition(EMT) in HCC cells.40 Prolonged lenvatinib exposure elevates c-MET expression in HCC cells, whereas c-MET inhibition enhances lenvatinib-induced growth suppression and apoptosis.40 Cao et al demonstrated that ARL8B facilitates HCC progression and EMT by activating the MAPK/ERK pathway via RAB2A, impacting the sensitivity to lenvatinib.41 Stromal cell-derived factor 1 (SPP1) from cancer-associated fibroblasts (CAFs) accelerates RAF/MAPK and PI3K/AKT/mTOR signaling through the PKCα pathway, promoting oncogenic signaling and EMT, thereby enhancing TKI resistance in HCC.42 Yang et al revealed that CircCCNY enhanced HCC sensitivity to lenvatinib and suppressed immune evasion by inhibiting the MAPK pathway.10 Our study showed that CPB2 overexpression decreased p-MAK1/2 and p-ERK/2 levels, suggesting that reduced CPB2 expression in HCC cells affects lenvatinib sensitivity through MAPK/ERK regulation. These results are consistent with those of previous studies underscoring the pivotal role of the MAPK/ERK pathway in lenvatinib resistance in HCC.
The limitations of this study warrant further careful consideration. First, although we developed a prognostic model for genes related to lenvatinib resistance, TCGA database lacks information on lenvatinib treatment, which hinders the predictive capability of this risk model for lenvatinib efficacy. Second, while internal validation of the risk model was conducted using TCGA dataset, the absence of external dataset validation or clinical data validation restricts the generalizability and practicality of the model to some extent. We plan to conduct a future clinical study by collecting data from a multicenter cohort of patients with HCC receiving first-line lenvatinib therapy. By analyzing the relationship between the risk score and patients’ objective response rate and progression-free survival, we aimed to provide high-level clinical evidence for the predictive performance of this signature, thereby advancing personalized treatment strategies for hepatocellular carcinoma. Furthermore, our study showed that CPB2 exhibits dual downregulation at both the mRNA and protein levels in lenvatinib-resistant cells, suggesting that its regulation primarily occurs at the transcriptional level. However, the specific upstream mechanisms that lead to transcriptional repression remain unknown. In future studies, we will further dissect the specific transcriptional regulatory mechanisms underlying CPB2 downregulation using dual-luciferase reporter assays and chromatin immunoprecipitation (ChIP). Although our study demonstrates that CPB2 overexpression increases the sensitivity of hepatocellular carcinoma to lenvatinib by inhibiting the MAPK signaling pathway, the precise molecular mechanisms mediating this regulation remain to be fully elucidated. Since CPB2 is a classical secreted carboxypeptidase that primarily functions in the extracellular space, we speculated that CPB2 may exert its indirect regulatory effects by modulating upstream signaling events. For example, its enzymatic activity may cleave specific extracellular substrates in the tumor microenvironment, such as inflammatory peptides, chemokines, or growth factors, thereby inhibiting the activation of cell surface receptors that drive the downstream MAPK cascade. The current study lacks direct experimental validation of these specific upstream targets or physical interactions, which is a limitation. Future research integrating secretomics, receptor pull‑down assays, and corresponding rescue experiments is necessary to identify the specific extracellular substrates of CPB2 and to fully dissect the CPB2‑MAPK regulatory axis in HCC.
Although the upregulation of CPB2 shows promising therapeutic potential in overcoming lenvatinib resistance, the clinical translation of CPB2‑targeted therapies faces significant challenges regarding systemic safety. Physiologically, CPB2 is a potent inhibitor of fibrinolysis. Therefore, systemic administration or non-specific upregulation of CPB2 may disrupt the delicate hemostatic balance, potentially exacerbating the hypercoagulable state often present in patients with HCC and increasing the risk of thromboembolic events. To overcome these off-target hematological effects, future therapeutic strategies must prioritize precise delivery approaches. The development of liver‑specific or tumor-targeted delivery systems, such as GalNAc conjugation platforms, lipid nanoparticles (LNPs) modified with HCC‑specific ligands, or locoregional transcatheter arterial delivery (eg., in combination with TACE) — is critical. These technologies could ensure high local concentrations of CPB2 within the tumor microenvironment to exert antitumor and sensitizing effects while avoiding interference with systemic coagulation and fibrinolysis cascades.
In conclusion, we developed a novel prognostic model for lenvatinib resistance-related genes using bioinformatics methods. This model offers potential applications for risk stratification and prognosis prediction in patients with HCC. This study significantly advances our understanding of lenvatinib resistance in HCC by elucidating the underlying molecular mechanisms and identifying CPB2 as a promising therapeutic target. These findings emphasize the importance of personalized treatment strategies based on genetic risk factors and provide a foundation for future investigations aimed at improving patient outcomes.
Data Sharing Statement
The data supporting the findings of this study are available from the corresponding author upon reasonable request.
Ethical Approval Statement
This study used a public dataset (TCGA). According to the provisions of Items 1 and 2 of Article 32 of the “Measures for Ethical Review of Life Science and Medical Research Involving Human Subjects”, this research is exempt from institutional ethical approval.All animal experiments were approved by the Institutional Animal Care and Use Committee of Nanchang Royo Biotech Co. Ltd (Ethics ID: RYE2023120301).
Author Contributions
All authors made a significant contribution to the work reported, whether that is in the conception, study design, execution, acquisition of data, analysis, and interpretation, or in all these areas, took part in drafting, revising, or critically reviewing the article; gave final approval of the version to be published; have agreed on the journal to which the article has been submitted; and agree to be accountable for all aspects of the work.
Funding
This research was supported by the Science and Technology Project of Jiangxi Provincial Department of Education (No. GJJ2400117).
Disclosure
The authors declare that this research was conducted in the absence of any commercial or financial relationships that could be construed as potential conflicts of interest.
References
1. Singal AG, Kanwal F, Llovet JM. Global trends in hepatocellular carcinoma epidemiology: implications for screening, prevention and therapy. Nat Rev Clin Oncol. 2023;20(12):864–18. doi:10.1038/s41571-023-00825-3
2. Tan DJH, Ng CH, Lin SY, et al. Clinical characteristics, surveillance, treatment allocation, and outcomes of non-alcoholic fatty liver disease-related hepatocellular carcinoma: a systematic review and meta-analysis. Lancet Oncol. 2022;23(4):521–530. doi:10.1016/S1470-2045(22)00078-X
3. Sensi B, Angelico R, Toti L, et al. Mechanism, potential, and concerns of immunotherapy for hepatocellular carcinoma and liver transplantation. Curr. Mol. Pharmacol. 2024;17:e18761429310703.
4. Zhu X, Tang L, Li H, Li H, Wang J. PD-1/PD-L1 in Hepatocellular Carcinoma (2014–2024): a combined macro and micro analysis of immunotherapy implications. iNew Med. 2026;2(1):e70003.
5. Shen H, Li H, Tang H. CCDC110 promotes the progression of hepatocellular carcinoma by activating the TGF-β/SMAD signaling pathway through targeted regulation of TGFBR1. Can Cell Inter. 2025;25(1):183. doi:10.1186/s12935-025-03803-0
6. Dong R, Fei Y, He Y, et al. Lactylation-Driven HECTD2 limits the response of hepatocellular carcinoma to lenvatinib. Adv. Sci. 2025;12(15):e2412559. doi:10.1002/advs.202412559
7. Ladd AD, Duarte S, Sahin I, Zarrinpar A. Mechanisms of drug resistance in HCC. Hepatology. 2024;79(4):926–940. doi:10.1097/HEP.0000000000000237
8. Liang BG, Zheng YM, Xu MH, et al. The MASTL/YBX1/PAK4 axis regulated by stress-activated STK24 triggers lenvatinib resistance and tumor progression in hepatocellular carcinoma. Hepatology. 2025;83:771–788. doi:10.1097/HEP.0000000000001392
9. Guo J, Zhao J. USP22-JMJD8 axis promotes Lenvatinib resistance in hepatocellular carcinoma. Biochim. Biophys. Acta, Mol. Cell. Res. 2024;1871(1):119617. doi:10.1016/j.bbamcr.2023.119617
10. Yang L, Tan W, Wang M, et al. circCCNY enhances lenvatinib sensitivity and suppresses immune evasion in hepatocellular carcinoma by serving as a scaffold for SMURF1 mediated HSP60 degradation. Cancer Lett. 2025;612:217470. doi:10.1016/j.canlet.2025.217470
11. Leung LLK, Morser J. Carboxypeptidase B2 and carboxypeptidase N in the crosstalk between coagulation, thrombosis, inflammation, and innate immunity. J. Thromb. Haemost. 2018;16:1474–1486. doi:10.1111/jth.14199
12. Eaton DL, Malloy BE, Tsai SP, Henzel W, Drayna D. Isolation, molecular cloning, and partial characterization of a novel carboxypeptidase B from human plasma. J Biol Chem. 1991;266(32):21833–21838. doi:10.1016/S0021-9258(18)54713-X
13. Morser J, Shao Z, Nishimura T, et al. Carboxypeptidase B2 and N play different roles in regulation of activated complements C3a and C5a in mice. J. Thromb. Haemost. 2018;16(5):991–1002. doi:10.1111/jth.13964
14. Zhang Y, Han K, Du C, et al. Carboxypeptidase B blocks ex vivo activation of the anaphylatoxin-neutrophil extracellular trap axis in neutrophils from COVID-19 patients. Critical Care. 2021;25(1):51. doi:10.1186/s13054-021-03482-z
15. Zhou Q, Zhao L, Shao Z, Declerck P, Leung LLK, Morser J. Both plasma basic carboxypeptidases, carboxypeptidase B2 and carboxypeptidase N, regulate vascular leakage activity in mice. J. Thromb. Haemost. 2022;20(1):238–244. doi:10.1111/jth.15551
16. Mertens JC, Blanc-Guillemaud V, Claesen K, et al. Carboxypeptidase U (TAFIa) is rapidly activated and deactivated following thrombolysis and thrombectomy in stroke patients. Transl. Stroke Res. 2022;13(6):959–969. doi:10.1007/s12975-021-00962-w
17. Huang S, Sun L, Hou P, Liu K, Wu J. A comprehensively prognostic and immunological analysis of actin-related protein 2/3 complex subunit 5 in pan-cancer and identification in hepatocellular carcinoma. Front Immunol. 2022;13:944898. doi:10.3389/fimmu.2022.944898
18. McGlynn KA, Petrick JL, El-Serag HB. Epidemiology of hepatocellular carcinoma. Hepatology. 2021;73(Suppl 1):4–13. doi:10.1002/hep.31288
19. Xu Y, An Z, Wang S, et al. Dual role of pregnane x receptor in nonalcoholic fatty liver disease. Curr. Mol. Pharmacol. 2024;17:e18761429259143. doi:10.2174/0118761429259143230927110556
20. Zhou Y, Gu J, Yu H, et al. Screening and identification of esr1 as a target of icaritin in hepatocellular carcinoma: evidence from bibliometrics and bioinformatic analysis. Curr. Mol. Pharmacol. 2024;17:e18761429260902. doi:10.2174/0118761429260902230925044009
21. Xu W, Liao S, Hu Y, Huang Y, Zhou J. Upregulation of miR-3130-5p enhances hepatocellular carcinoma growth by suppressing ferredoxin 1: mir-3130-5p enhances hcc growth via inhibiting FDX1. Curr. Mol. Pharmacol. 2024;17:e18761429358008. doi:10.2174/0118761429358008250305070518
22. Tao M, Han J, Shi J, et al. Application and resistance mechanisms of lenvatinib in patients with advanced hepatocellular carcinoma. J Hepatocell Carcinoma. 2023;10:1069–1083. doi:10.2147/JHC.S411806
23. Luo T, Chen X, Pan W, Zhang S, Huang J. The sorafenib resistance-related gene signature predicts prognosis and indicates immune activity in hepatocellular carcinoma. Cell Cycle. 2024;23(2):150–168. doi:10.1080/15384101.2024.2309020
24. Huang S, Li D, Zhuang L, Zhang J, Wu J. Identification of an epithelial-mesenchymal transition-related long non-coding rna prognostic signature to determine the prognosis and drug treatment of hepatocellular carcinoma patients. Front Med. 2022;9:850343. doi:10.3389/fmed.2022.850343
25. Zhengdong A, Xiaoying X, Shuhui F, et al. Identification of fatty acids synthesis and metabolism-related gene signature and prediction of prognostic model in hepatocellular carcinoma. Can Cell Inter. 2024;24(1):130. doi:10.1186/s12935-024-03306-4
26. Fiorito V, Tolosano E. Hemopexin and Cancer. Int J Mol Sci. 2022;23(2):997. doi:10.3390/ijms23020997
27. Suzuki Y, Takadate T, Mizuma M, et al. Stromal expression of hemopexin is associated with lymph-node metastasis in pancreatic ductal adenocarcinoma. PLoS One. 2020;15(7):e0235904. doi:10.1371/journal.pone.0235904
28. Canesin G, Di Ruscio A, Li M, et al. Scavenging of labile heme by hemopexin is a key checkpoint in cancer growth and metastases. Cell Rep. 2020;32(12):108181. doi:10.1016/j.celrep.2020.108181
29. Sun HM, Mi YS, Yu FD, et al. SERPINA4 is a novel independent prognostic indicator and a potential therapeutic target for colorectal cancer. Am. J. Cancer Res. 2016;6(8):1636–1649.
30. Schneider L, Liu J, Zhang C, et al. The role of interleukin-1-receptor-antagonist in bladder cancer cell migration and invasion. Int J Mol Sci. 2021;22(11):5875. doi:10.3390/ijms22115875
31. Fan YC, Fong YC, Kuo CT, et al. Tumor-derived interleukin-1 receptor antagonist exhibits immunosuppressive functions and promotes pancreatic cancer. Cell Biosci. 2023;13(1):147. doi:10.1186/s13578-023-01090-8
32. Yuan S, Miao Y, Ruan X, Chen J, Li X, Larsson SC. Therapeutic role of interleukin-1 receptor antagonist in pancreatic diseases: mendelian randomization study. Front Immunol. 2023;14:1240754. doi:10.3389/fimmu.2023.1240754
33. Liu YN, Liu MK, Wen YC, et al. Binding of interleukin-1 receptor antagonist to cholinergic receptor muscarinic 4 promotes immunosuppression and neuroendocrine differentiation in prostate cancer. Cancer Lett. 2024;598:217090. doi:10.1016/j.canlet.2024.217090
34. Yang Z, Zhong D, Hu X, Chen W, Liao Y, He X. NFATC2/SERPINE1/JAK3/STAT3 signaling feedback loop in gastric cancer: immune evasion and anti-PD-1 resistance. Cell Biol Toxicol. 2025;41(1):102. doi:10.1007/s10565-025-10050-6
35. Wang B, Gu B, Gao L, et al. SERPINE1 facilitates metastasis in gastric cancer through anoikis resistance and tumor microenvironment remodeling. Small. 2025;21(19):e2500136. doi:10.1002/smll.202500136
36. Baraks G, Tseng R, Pan CH, et al. Dissecting the oncogenic roles of keratin 17 in the hallmarks of cancer. Cancer Res. 2022;82(7):1159–1166. doi:10.1158/0008-5472.CAN-21-2522
37. Li J, Chen Q, Deng Z, et al. KRT17 confers paclitaxel-induced resistance and migration to cervical cancer cells. Life Sci. 2019;224:255–262. doi:10.1016/j.lfs.2019.03.065
38. Yan X, Yang C, Hu W, et al. Knockdown of KRT17 decreases osteosarcoma cell proliferation and the Warburg effect via the AKT/mTOR/HIF1α pathway. Oncol Rep. 2020;44(1):103–114. doi:10.3892/or.2020.7611
39. Zhang Y, Dong Y, Chen S, et al. Targeting NAT10 inhibits hepatocarcinogenesis via ac4c-mediated smad3 mrna stability. Exploration. 2025;5(6):20250075. doi:10.1002/EXP.20250075
40. Fu R, Jiang S, Li J, Chen H, Zhang X. Activation of the HGF/c-MET axis promotes lenvatinib resistance in hepatocellular carcinoma cells with high c-MET expression. Med Oncol. 2020;37(4):24. doi:10.1007/s12032-020-01350-4
41. Cao MM, Li YM, Ding X, Fang F, Yang LY. ARL8B promotes hepatocellular carcinoma progression and inhibits antitumor activity of lenvatinib via MAPK/ERK signaling by interacting with RAB2A. Cell. Signalling. 2024;124:111470. doi:10.1016/j.cellsig.2024.111470
42. Eun JW, Yoon JH, Ahn HR, et al. Cancer-associated fibroblast-derived secreted phosphoprotein 1 contributes to resistance of hepatocellular carcinoma to sorafenib and lenvatinib. Cancer Commun. 2023;43(4):455–479. doi:10.1002/cac2.12414
 © 2026 The Author(s). This work is published and licensed by Dove Medical Press Limited. The
full terms of this license are available at https://www.dovepress.com/terms
and incorporate the Creative Commons Attribution
- Non Commercial (unported, 4.0) License.
By accessing the work you hereby accept the Terms. Non-commercial uses of the work are permitted
without any further permission from Dove Medical Press Limited, provided the work is properly
attributed. For permission for commercial use of this work, please see paragraphs 4.2 and 5 of our Terms.
© 2026 The Author(s). This work is published and licensed by Dove Medical Press Limited. The
full terms of this license are available at https://www.dovepress.com/terms
and incorporate the Creative Commons Attribution
- Non Commercial (unported, 4.0) License.
By accessing the work you hereby accept the Terms. Non-commercial uses of the work are permitted
without any further permission from Dove Medical Press Limited, provided the work is properly
attributed. For permission for commercial use of this work, please see paragraphs 4.2 and 5 of our Terms.