Back to Journals » Pharmacogenomics and Personalized Medicine » Volume 16
Identification and Validation of Ferroptosis-Related Subtypes and a Predictive Signature in Hepatocellular Carcinoma
Authors Zheng C, Peng Y, Wang H, Wang Y, Liu L, Zhao Q ![]()
Received 16 November 2022
Accepted for publication 12 January 2023
Published 26 January 2023 Volume 2023:16 Pages 39—58
DOI https://doi.org/10.2147/PGPM.S397892
Checked for plagiarism Yes
Review by Single anonymous peer review
Peer reviewer comments 2
Editor who approved publication: Dr Martin H Bluth
Chunlan Zheng,1,2,* Yanan Peng,1,2,* Haizhou Wang,1,2 Youwei Wang,1,2 Lan Liu,1,2,* Qiu Zhao1,2,*
1Department of Gastroenterology, Zhongnan Hospital of Wuhan University, Wuhan, 430071, People’s Republic of China; 2Hubei Clinical Center and Key Laboratory of Intestinal and Colorectal Diseases, Wuhan, 430071, People’s Republic of China
*These authors contributed equally to this work
Correspondence: Lan Liu; Qiu Zhao, Tel +86-027-67812888, Fax +86 027-67812892, Email [email protected]; [email protected]
Background: Hepatocellular carcinoma (HCC) is one of the most common malignant tumors in the world with an immunosuppressive Tumor microenvironment (TME). Ferroptosis plays an essential role in tumor proliferation, invasion, and metastasis. However, the relationship between ferroptosis and TME of HCC has remained elusive.
Methods: Differentially expressed ferroptosis-related genes (DE FRGs) between normal liver tissues and HCC tissues were obtained from The Cancer Genome Atlas (TCGA). On this basis, we identified the molecular subtypes mediated by DE FRGs and TME cell infiltration. Next, a predictive signature was established to quantity the ferroptosis-related characteristics by performing the least absolute shrinkage and selection operator Cox regression analyses. Univariate and multivariate COX analyses determined the independent prognostic factors. Finally, the expression stability of 3 ferroptosis-related signature genes was verified in cancer and paracancerous normal tissues of HCC.
Results: We identified three different molecular subtypes and found that the subtype with the better prognosis was associated with high enrichment of immune- and metabolic-related hallmark signaling pathways and high infiltration of immune cells in TME. The signature was considered to be an independent prognostic factor. We also found that the signature can reflect the infiltration characteristics of different immune cells in TME. Immunosuppressive cells such as myeloid-derived suppressor cells (MDSCs), regulatory T cells, and type 17 T helper cells were significantly enriched in the high-risk group. The analysis data of immune checkpoints and tumor mutation load indicated that the signature had great potential in predicting Immunotherapy response and chemotherapeutic sensitivity. In addition, the overexpression of 3 ferroptosis-related signature genes was confirmed in HCC tissues and HCC cell lines. Ferroptosis inducer RSL3 inhibited the proliferation of HCC cells and was a potential cancer immunotherapy agent.
Conclusion: These findings enhanced our understanding of the regulatory mechanism of ferroptosis in HCC and provided new insights into evaluating prognosis and developing more effective Immunotherapy and chemotherapy strategies.
Keywords: hepatocellular carcinoma, ferroptosis, prognosis, immunotherapy, tumor mutational burden
Background
Hepatocellular carcinoma (HCC), with 841,080 new cases and 781,631 deaths annually, is the sixth most widespread malignancy and the fourth leading cause of death.1 In the past decade, the non-drug and drug treatments of HCC have made significant progress. For early HCC patients, hepatectomy and transplantation can be performed, but the recurrence rate is still high.2 Some small molecular targeted drugs are mainly used in treating unresectable HCC for systemic or postoperative adjuvant therapies. Sorafenib, a multi-kinase inhibitor, significantly prolonged no progression and overall survival in patients with HCC, but drug resistance and side effects limit the benefits of survival.3,4 Immune checkpoint inhibitors (ICIs)-based Immunotherapy restores the immune response to tumor cell antigens by blocking the inhibitory receptors of immune cells. In particular, inhibition of PD1/PD-L1 and CTLA-4 are the principal antibodies of ICIs at present.5,6 These suggests that Immunotherapy has excellent potential in the treatment of HCC patients. Therefore, we urgently want to find more effective ways to explore the molecular characteristics of HCC and improve the response of Immunotherapy.
Ferroptosis is a newly identified modality that regulates nonapoptotic cell death and is characterized by iron-dependent lipid peroxidation and accumulation of reactive oxygen species, which is mainly caused by the inactivation of a cellular antioxidant system.7,8 Cystine/glutamate Antiporter (also known as System Xc-or xCT), encoded by the gene SLC7A11, transports cystine across membranes into cells for de novo synthesis of the antioxidant peptide glutathione (GSH). GSH is a cofactor necessary for the normal function of Glutathione-peroxidase (Gpx4), which directly reduces lipid hydroperoxides to non-toxic lipid alcohols.9 SLC7A11 inhibitors and GPX4 inactivation have been widely used to induce ferroptosis in HCC10−12. Ruize et al found that upregulated SLC7A11 expression resulted in sorafenib resistance of HCC.13 These indicate that ferroptosis-related drugs have become indispensable to HCC treatment strategies. It is of great significance to explore the minutial mechanism of these drugs and develop individualized medical strategies for HCC treatment.
Tumor mutational burden (TMB) is an emerging response biomarker of whether Immunotherapy is effective in cancer patients.14 The assessment of TMB with targeted next-generation sequencing found that TMB was associated improving survival in patients receiving ICIs across various cancers.15 As a measure of the number of somatic mutations in the tumor genome, TMB is usually defined as the total number of non-synonymous point mutations in each coding region of a tumor genome.16 Accumulating somatic mutation will result in the expression of neoantigens, which can elicit an antitumor response by activating CD8+ cytotoxic T lymphocytes (CTLs).17,18 So, further studies are needed to integrate genomic or pathological biomarkers with TMB for predicting the response of ICIs.
In recent years, the study of the carcinogenic signal pathway of tumor cells has been transferred to the tumor microenvironment (TME), which includes not only stromal cells but also innate and adaptive immune cells.19 Among them, the research on adaptive immune cells is the hottest, especially T lymphocytes, which have potent cytotoxicity to tumor cells. ICIs are effective for enhancing T cell antitumor response.6 In addition, studies have shown that ferroptosis and immune regulation are inextricably linked. Tumor cells are more sensitive to xCT inhibition-induced ferroptosis than activated CD8+ T cells.20 Moreover, ferroptosis can promote cancer cells to secrete damage-associated molecular pattern (DAMPs) signals to enhance the immunogenicity of ferroptotic cancer cells, which can induce tumor-specific immune responses and enhance the efficacy of ICIs.21,22 Therefore, exploring a more complicated relationship between TME and ferroptosis is necessary to find more Immunotherapy targets.
In this study, patients with HCC in the TCGA database were divided into three subtypes according to 26 Ferroptosis-related genes (FRGs). The differences in prognosis and immune infiltration in TME were discussed. In addition, a prognostic signature based on FRGs was established to characterize the immune landscape of HCC and to accurately predict the prognosis of patients and their response to Immunotherapy and chemotherapy. These results show that the signature was a powerful prognostic indicator.
Methods
Data Acquisition
Samples with both RNA sequencing data and clinical information were included in this study. Transcriptome data (fragments per kilobase of exon model per million reads mapped [FPKM] value) of 370 liver cancer specimens and 50 adjacent normal tissues were downloaded from The Cancer Genome Atlas (TCGA) dataset (https://portal.gdc.cancer.gov/). Clinical data, copy number variation (CNV), and mutation data were also collected from TCGA. At the same time, we downloaded GSE14520 (n=242) gene expression profile and clinical data from the GEO dataset (https://www.ncbi.nlm.nih.gov/geo/) for external validation.
A comprehensive ferroptosis-related genes (FRGs) list was obtained from the FerrDb dataset (http://www.zhounan.org/ ferrdb/),23 which updated the ferroptosis regulator data accurately and promptly, and shared data for ferroptosis-associated disease research.
Data Preprocessing and Differential Analysis
After removing the samples’ low or no-expression genes, we used the edgeR package in R software to screen the differentially expressed genes (DEGs) between HCC and normal tissues. The adjusted p-value < 0.01 and |log2fold change (FC)| > 2 were taken as the cut-off threshold. Twenty-six differentially expressed ferroptosis-related genes (DE FRGs) (See Supplementary Table 1) were obtained from the overlap of DEGs and FRGs.
Identification of the Ferroptosis Subtypes of the TCGA Dataset
According to the expression level of 26 DE FRGs genes, the unsupervised cluster analysis of the “ConsensusClusterPlus” package of R was conducted to classify 370 patients with HCC into different subgroups. In order to ensure the accuracy of the classification, we carried out 1000 iterations, and 80% of the samples were taken in each iteration.24 The best clustering number was determined to be three based on the cumulative distribution function (CDF) curve, Delta area plot, and tracking plot.
Functional and Pathway Enrichment Analyses
To investigate the clusters’ biological processes, which were determined by gene set variation analyses (GSVA).25 We downloaded the Hallmark gene sets “h.all. v7.5.1. symbols” from the molecular signature dataset (MSigD) and used the GSVA package to transform the gene expression matrix into the gene set matrix. Then the difference between signal pathways was analyzed by the “limma” package, and the screening thresholds were set to |log2 FC| > 0.1 and the adjusted p-value<0.05.
Correlation of Ferroptosis Clusters with TME
The level of the tumor microenvironment (TME) cell infiltration in each HCC patient was evaluated by a single sample gene set enrichment analysis (ssGSEA) algorithm, and the infiltration abundances of 23 immune cells were obtained.26 In addition, we used the ESTIMATE algorithm of the R package to evaluate each patient’s estimate score, immune score, stromal score, and tumor purity.27
Construction of the Ferroptosis-Related Gene Prognostic Signature
Firstly, 370 patients with HCC were randomly divided into a training set (n = 186) and a testing set (n = 184) using the “caret” of the R package. In order to screen the DE FRGs related to the survival of patients with HCC, we conducted a univariate Cox proportional hazard regression analysis to explore the relationship between overall survival (OS) and DE FRGs in the training set. P<0.01 was considered to be significantly related to survival. Next, we performed the least absolute shrinkage and selection operator (LASSO) Cox regression analysis by the “glmnet” of R packet to establish the best gene risk model based on the above identified DE FRGs with significant correlation with survival. The risk score of each patient was calculated based on the coefficient and expression of genes in the risk model. The formula is: risk score = (coefficient gene1 × expression of gene1) + (coefficient gene 2 × expression of gene 2) + ⋯ + (coefficient gene n × expression gene n). Patients were divided into a high-risk and a low-risk group according to the median risk score. The Kaplan-Meier survival curve of high- and low-risk groups was plotted with “survival” and “survminer” of the R package. In order to verify the accuracy and validity of the signature, we used the “SurvivalROC” package to calculate the area under the curve (AUC) of 1-, 3-, and 5- year. Univariate and multivariate COX regression analyses were performed between clinicopathological features (age, gender, grade, stage) and risk scores to evaluate the independent prognostic value of signatures.
The Predictive Nomogram of the Total Set
Based on the results of independent predictive analyses, we used the “RMS” package of R to synthesize the clinicopathological features and risk scores of patients with the total set to establish a predictive nomogram. In the nomogram scoring system, each variable was converted into a corresponding score, and the total score of all variables in each sample was the patient’s score. According to the score, the patient’s 1-, 3-, and 5-year survival prognosis can be predicted. The calibration curves of the nomogram were used to describe the predicted values between the predicted 1 -, 2 -, 3-and 5-year survival events and virtual observations.
Mutation and Drug Susceptibility
Based on the somatic mutation data downloaded from theTCGA dataset, we calculated the tumor mutation load (TMB) score of each HCC patient, compared the gene mutation rate and TMB among different risk groups, and evaluated the effect of TMB on prognosis by Kaplan-Meier survival analysis.
We also analyzed the differences in the expression of a series of immune checkpoints between the two risk groups. In order to explore the difference in the efficacy of chemotherapeutic drugs between the two groups, we used the “pRRophetic” of the R package to calculate the semi-inhibitory concentration (IC50). In addition, the immunophenoscore (IPS) from the Cancer Immunome Atlas (https://tcia.at/) was used to analyze the response of different risk groups to ICIs (anti-CTLA4 and anti-PD-1 antibodies).
Cell Lines and Cell Culture
Human normal liver cell line LO2 (CRL-12461), human liver cancer cell lines HepG2 (HB-8065) and Hep3B (HB-8064) were purchased from the American Type Culture Collection (ATCC; Manassas, VA, USA) in June 2019. Human hepatoma cell lines (Huh7 and lm3) were obtained from the Shanghai Cell Bank of the Chinese Academy of Sciences. Cells were cultured at 37 ℃ with 5% CO2 in Dulbecco’s Modified Eagle’s Medium (DMEM) containing 10% Fetal bovine serum (FBS) and 1% penicillin/streptomycin (Gibco, USA).
RNA Extraction and Quantitative Real-Time Polymerase Chain Reaction (qRT-PCR)
The total RNA of hepatoma cells and tissues was extracted by TRIZOL (Invitrogen, USA). Reverse transcriptional reactions were completed with a reverse transcriptase kit (Roche, USA). qRT-PCR was performed on the Roche LightCycler® 96 Instrument using the following cycling parameters, 95 ℃ for 2 min, followed by 40 cycles of 95 ℃ for 15s, 60 ℃ for 45s. The primer sequences are listed as follows:
STMN1 gene 5′-CCTTTGGGGCTGGTAGA-3′ (sense) and 5′- GCAGTCATTGTGGAAGGAG-3′(anti-sense).
TXNRD1 gene 5′-GCATCACACTGGGGTCA-3′ (sense) and 5′- TGTTCCATCACCGCCTAC −3′(anti-sense).
MT3 gene 5′-TTGGAGAAGCCCGTTCA-3′ (sense) and 5′- TTGCATCCCTCGCACTT −3′(anti-sense).
Cell Viability Assay
The cells were treated with ferroptosis inducer RSL3 for 24 h and seeded on 96-well plates with 2500 cells per well and 4 multiple Wells per group.The 10ul cell count kit-8 kit (CCK-8; Dojindo, Kumamoto, Japan) was added at different time points and cultured at 37 ° C for 2 h. The OD value of each well was detected at 450nm (Thermo multiskan FC; Thermo Fisher).
Reactive Oxygen Species (ROS) Assay
Huh7 and HepG2 cells were seeded in 6-well plates and treated with RSL3 for 24 h. Then DCFH-DA (Invitrogen, CA, USA) was added, incubated for 30 mins, and washed 3 times. Flow cytometry was used to detect ROS accumulation in cells.
Iron Assay
Intracellular iron was measured using an iron colorimetry kit (Milpitas, California, USA) according to manufacturer’s instructions. Iron ions dissociated from ferric ion carrier proteins into solution in acid buffering environment. Iron was reduced to ferrous form (Fe2+) and reacted with Ferene S to form a stable-colored complex. OD values were detected at 593nm.
Statistical Analyses
The R (v.4.1.0) software and GraphPad prism (9.0, SPSS) were employed for all statistical analyses. Differences among continuous variables were tested using a t-test or nonparametric test, and chi-square or fisher’s exact test tested categorical variables.
Results
Comprehensive Analyses of Differentially Expressed Ferroptosis-Related Genes in the TCGA Dataset
Choosing the adjusted p-value < 0.01 and |log2FC| > 2 as cut-off, we first explored the TCGA dataset to obtain 2019 differentially expressed genes (DEGs), including 91 down-regulated genes and 1928 upregulated genes (Figure S1A). 26 differentially expressed ferroptosis-related genes (DE FRGs) were extracted from the cross set of DEG and ferroptosis-related genes (FRGs) (Figure S1B). Specifically, compared with normal tissues, the expression of HAMP was downregulated, and the remaining 25 genes were highly expressed in hepatocellular carcinoma (HCC) tissues (Figure 1A). Figure 1B presents the locations of CNV alterations of FR DEGs on their respective chromosomes. We also investigated CNV alteration frequencies, which revealed that about half of the 26 FR DEGs had CNV loss. Some FR DEG highly expressed in cancer tissues, such as NOS2, ASNS, G6PD, AURKA, AKR1C3, HSPB1, FANCD2, RRM2, SLC7ALL, NQO1, NOX5, NOX4, ALOX15, were positively correlated with CNV alterations (Figure 1C). It was suggested that CNV alterations might regulate the expression of these genes. GO enrichment analyses of the 26 FR DEGs showed that the most highly enriched terms for the biological process were related to oxidative stress response and detoxification, such as “response to oxidative stress”, “reactive oxygen species metabolic process”, “cellular response to chemical stress”, “response to toxic substance”, “cellular detoxification” among others (Figure S1C). Next, to further understand the role of these 26 FR DEG in HCC, we have made a network map, which can more intuitively demonstrate the interaction between these 26 genes and their impact on prognosis (Figure 1D).
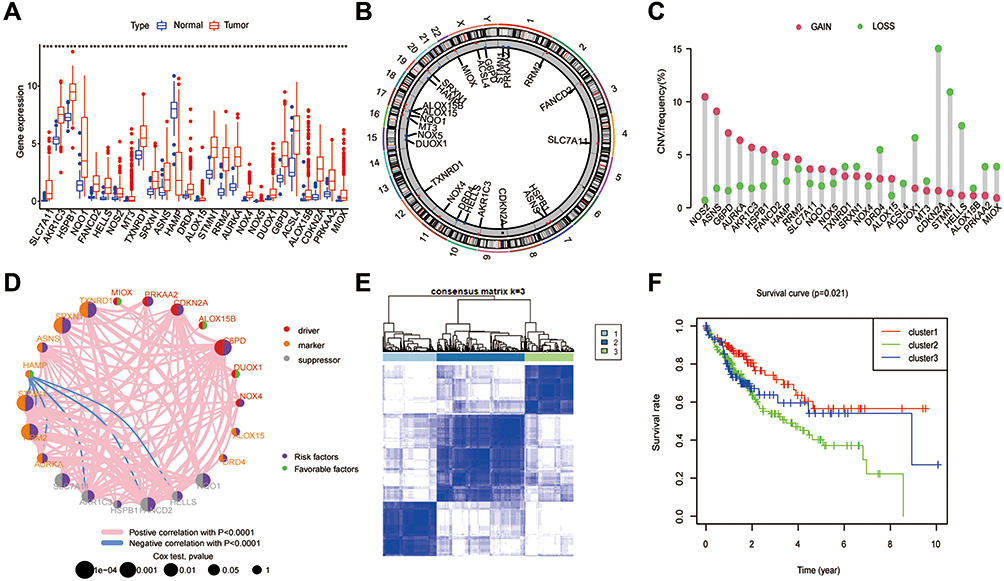 |
Figure 1 Landscape of FRGs in HCC and tumor Classification based on FRGs in TCGA. (A) Expression distribution of 26 FRGs between normal and HCC tissues based on the TCGA-HCC dataset. (B) The location of CNV alteration of 26 FRG on 23 chromosomes. (C) Interaction of FRGs in HCC. Red, Orange and grey represent driver, marker and suppressor, respectively. The circle size represents the impact of each ferroptosis gene on the prognosis, the P value calculated by Log rank test. Green dots in the circle represent favorable factors and purple dots represent risk factors. Red lines represent positive correlations, blue lines represent negative correlations, and the thickness of the lines represents the strength of the correlation between them. (D) The CNV variation frequency of 26 FRGs. The height of the column represented the alteration frequency. (E) Consensus matrix heatmap defining three clusters and their correlation area. (F) Survival analysis of three clusters in all patients. |
Identification of Ferroptosis-Related Subgroups in the TCGA Dataset
For exploring the expression characteristics of the 26 FR DEGs, we used the R package of ConsensusClusterPlus to classify 370 HCC patients according to the expression profiles of the 26 FR DEG. The results showed that k = 3 was the best choice to divide the whole cohort into three subgroups, including cluster 1 (n = 105), cluster 2 (n = 170) and cluster 3 (n = 95) (Figure 1E). The survival analyses of the three subgroups of ferroptosis showed that cluster 1 had a significant survival advantage, while cluster 2 had the worst prognosis (p = 0.021) (Figure 1F).
TME Cell Infiltration and Biological Characteristics of Three Subgroups
By comparing the clinicopathological features of HCC in different subgroups, it was found that there was a significant difference between FR DEGs expression profiles. Most FR DEGs were highly expressed in clusters 2 and 3 and downregulated in cluster 1 (Figure 2A). GSVA analysis was adopted to assess the involvement of FR DEGs in cancer-related Hallmarks (Figure 2B and C). Cell proliferation-related pathways such as MYC target pathway, E2F target pathway, G2M checkpoint pathway, mitotic spindle pathway, and DNA repair were highly activated in clusters 2 and 3, whereas enriched in cluster 1 were immune- and metabolic-related pathways, such as myogenesis pathway, inflammatory response pathway, xenobiotic metabolism pathway, bile acid metabolism pathway, allograft rejection pathway, IL2 state signaling pathway, and complement. It was suggested that those FR DEGs highly expressed in cluster 2 and cluster 3 might play a role in promoting cancer expansion. For determining the relationship between FR DEGs and tumor microenvironment (TME), the enrichment scores of immune cells in the three subtypes were evaluated using ssGSEA analyses. In cluster 1, the most significant infiltrating cells were activated B cells, activated CD8+ T cells, CD56bright/dim natural killer cells, eosinophils, gamma delta T cells, immature B cells, immature dendritic cells, macrophages, mast cells, monocyte, natural killer cells, neutrophils, plasmacytoid dendritic cells, type 1 T helper cells, in contrast, activated CD4+ T cells, type 2 T helper cells were mainly in the cluster 2. Almost all immune cells were poorly infiltrated in cluster 3 (Figure 2D). We used the ESTIMATE algorithm to evaluate the TME scores (stromal scores, immune scores, ESTIMATE scores, and tumor purity) of three subtypes, the stromal scores represent the content of TME stromal cells, the immune scores represent the degree of immune cell infiltration, and the estimated scores represent the comprehensive scores of the first two. If there are more stromal cells and immune cells, the purity of the tumor is lower, whereas the purity of the tumor is high. In cluster 1, the stromal, immune, and ESTIMATE scores were all higher. Cluster 3 had the lowest scores, and the scores in cluster 2 were between cluster 1 and cluster 3 (Figure 2E–G). The tumor purity was the lowest in cluster 1, the highest in cluster 3, and cluster 2 was between them (Figure 2H).
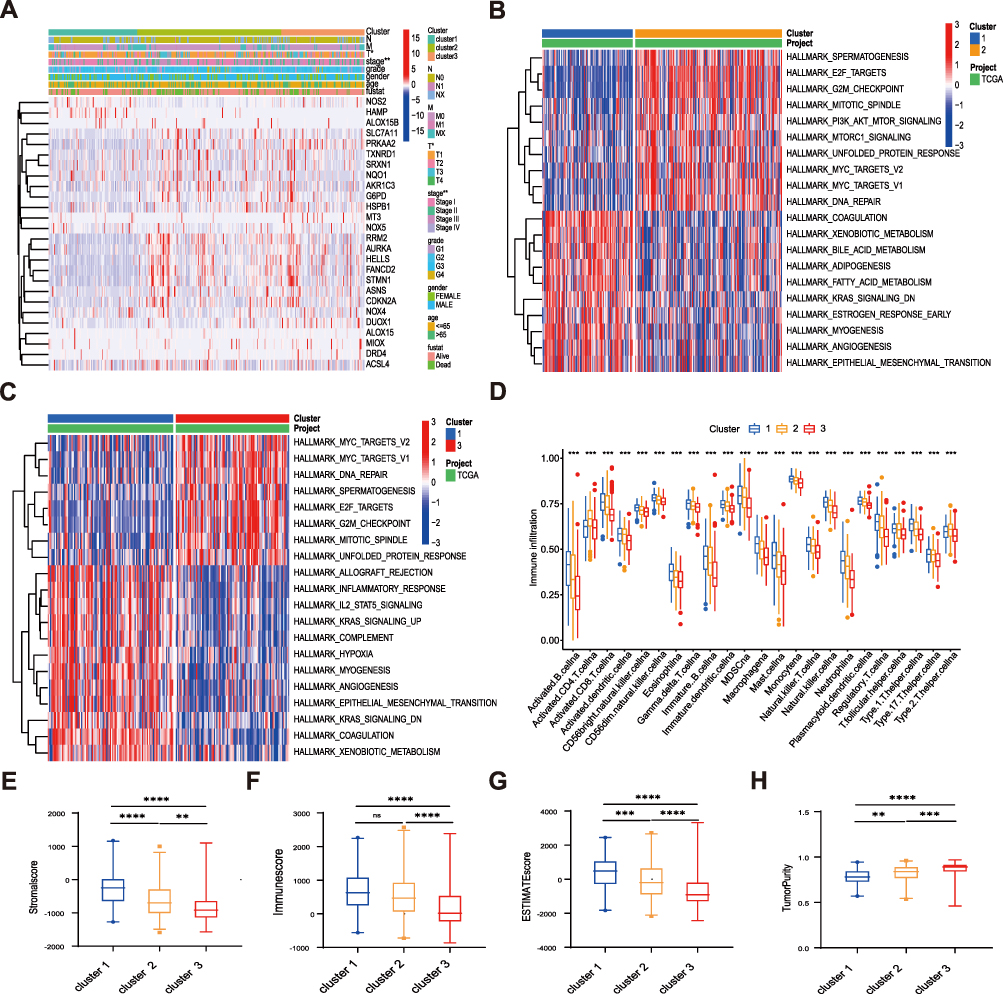 |
Figure 2 TME cell infiltration and biological characteristics of three clusters. (A) Differences in clinicopathologic features and expression levels of FRGs between the three clusters. (B and C) GSVA analyzed Hallmark pathways of three clusters. Red represents activation of pathways and blue represents inhibition of pathways, cluster 1 vs cluster 2 (B), cluster 1 vs cluster 3 (C). (D) The infiltration difference of TME cells between the three clusters. (E–G) The box plot indicated the difference of stromal score (E), immune score (F), estimate score (G), and tumor purity (H) between three clusters. The asterisks represented the statistical p value (**P < 0.01; ***P < 0.001; ****P<0.00001). Abbreviation: ns, not significant. |
Development of Ferroptosis-Related Risk Signature
In order to explore the relationship between the FR DEGs and the prognosis of patients with HCC, univariate COX regression analysis was performed based on the expression of 26 FR DEGs and the survival outcomes of TCGA patients. 11 FR DEGs were significantly correlated with the overall survival (OS) of patients in the training set. The least absolute shrinkage and selection operator (LASSO) Cox regression analysis was used to reduce the overfitting of 11 FR DEGs further. Finally, 3 FR DEGs were identified to construct the optimal ferroptosis-related prognostic signature (Figure 3A). We extract the expressions of these three ferroptosis-related signature genes and their coefficient values obtained from the multivariate Cox regression to calculate the risk score of each patient. The formula is as follows: Risk score = (0.09659 * MT3) + (0.01261 * TXNRD1) + (0.02572 * STMN1). Based on the median risk score, all patients in the training group were divided into low-risk (n = 93) and high-risk (n = 93) groups. In the high-risk group, MT3, TXNRD1, and STMN1 were highly expressed (Figure 3B). The time-dependent receiver operating characteristic curve (ROC) was conducted to evaluate the predictive value of the signature. The area under curve (AUC) values of 1-, 3-, and 5-year were 0.798, 0.740, and 0.699, respectively (Figure 3C). The risk score distribution curve and survival status of the training set showed that more deaths in the high-risk group (Figure 3D). The K–M survival curve demonstrated that the low-risk group had significantly better OS than the high-risk group (p < 0.01; Figure 3E). Moreover, we performed a univariate Cox regression analysis of the risk signature and clinical parameters to evaluate their prognostic value. This risk signature was associated with poor survival (HR: 1.267, 95% CI: 1.164–1.379, p < 0.001; Figure 3F). Multivariate COX analysis showed that this risk signature was an independent prognostic factor for HCC (HR: 1.249, 95% CI: 1.139–1.370, p < 0.001; (Figure 3G).
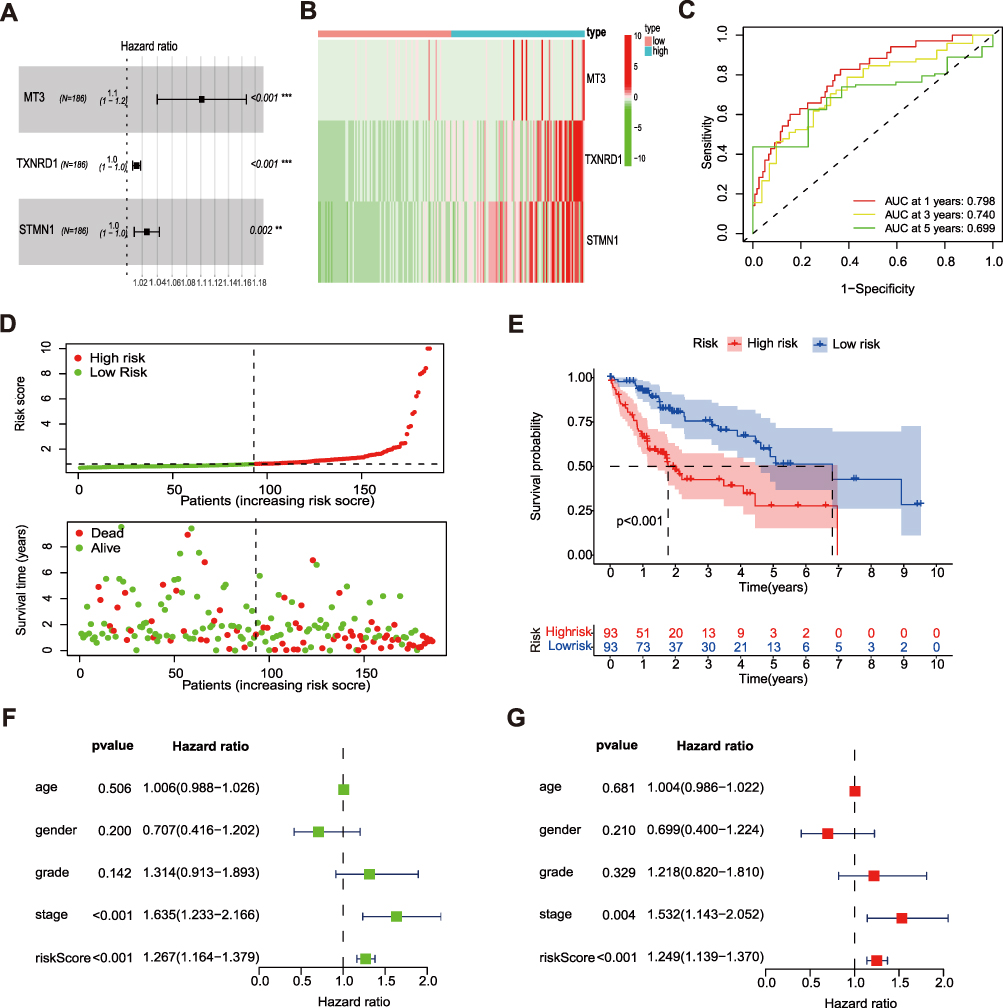 |
Figure 3 Development of the prognostic signature based on FRGs in the training set. (A) Forest plot demonstrating the multivariable Cox model results of 3 ferroptosis-related signature genes. (B) Heatmap of expression profiles of 3 ferroptosis-related signature genes in high- and low-risk groups. (C) Time- ROC curve of the prognostic signature. (D) Risk score distribution and survival status of high- and low-risk groups. (E) Overall survival (OS) of HCC patients in high- and low-risk groups. (F and G) Univariate analysis and multivariate analysis of clinical features and risk score with Cox proportional hazard model. The asterisks represented the statistical p value (**P < 0.01; ***P < 0.001). |
Development of a Nomogram to Predict Prognosis
Based on the results of multivariate Cox analysis, we developed a Nomogram that integrated clinicopathological features and risk signature to predict prognosis, which could provide a simple and practical method to predict 1-, 3-, and 5-year OS of HCC (Figure 4A). The calibration curves of 1-, 2-, 3-, and 5- year OS rates almost overlapped with standard lines (Figure 4B). In addition, the ROC and decision curve analysis (DCA) curves of risk signature showed that the risk signature was superior to the traditional clinicopathological characteristics in predicting the prognosis of HCC (Figure 4C and D).
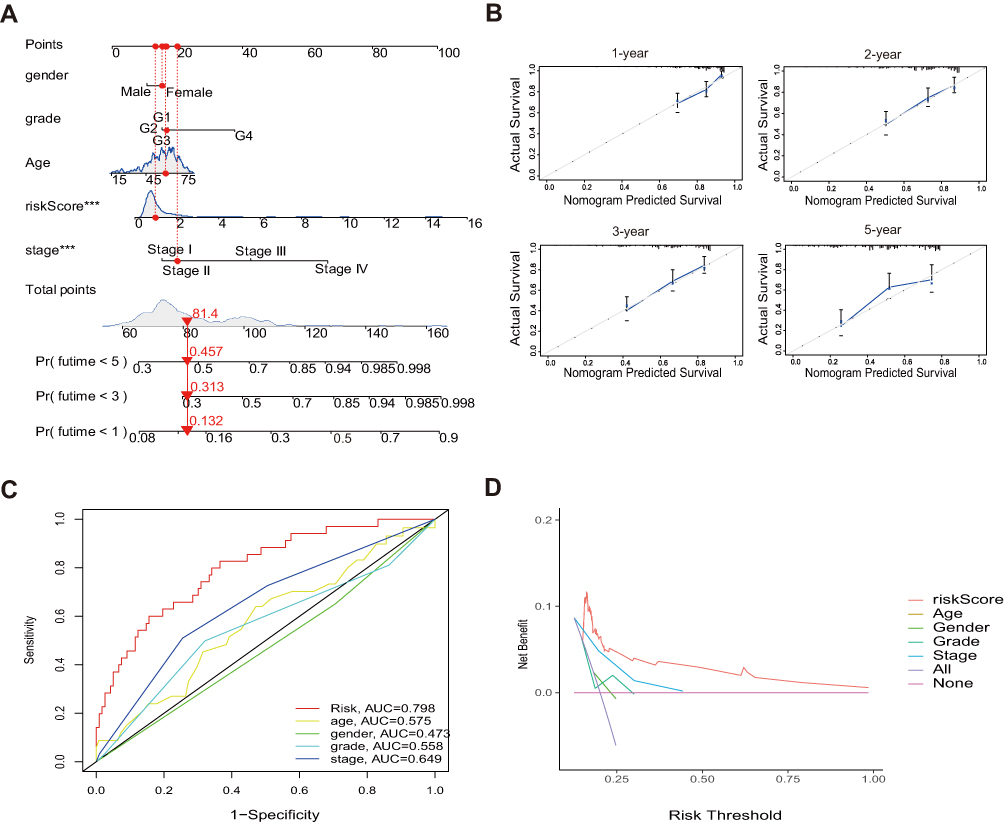 |
Figure 4 Construction and validation of a nomogram in the total set. (A) Nomogram for predicting the 1-, 3-, and 5-year prognosis of HCC patients. (B) Calibration curves of the nomogram for predicting of 1-, 2-, 3-, and 5-year prognosis. (C and D) The AUC values and the DCA of the risk signature. |
Validation of the Predictive Capability of the Risk Signature
To evaluate the predictive abilities of the above risk signature, which were verified in the GSE14520 dataset, TCGA testing set, and TCGA total set. According to the formula, the risk score of each patient in these datasets was calculated, and the patients were divided into a high-risk group and a low-risk group. In the GSE1450 (p = 0.002; Figure 5A), TCGA total set (p<0.001; (Figure 5E), and testing set (p = 0.021; (Figure 5I), survival analyses revealed that the OS of the high-risk groups were worse than that of the low-risk groups. The risk score distributions and survival statuses also proved that the mortality rates were higher in the high-risk groups (Figure 5B, F and J). In the GSE14520, the AUC values for 1-, 3-, and 5- year OS were 0.572, 0.585, and 0.650, respectively (Figure 5C). In the total set, the AUC values for 1-, 3-, and 5- year OS were 0.771, 0.703, and 0.646, respectively (Figure 5G). In the testing set, the AUC values for 1-, 3-, and 5- year OS were 0.734, 0.658, and 0.646, respectively (Figure 5K). Consistent with the training set, the three ferroptosis-related signature genes were highly expressed in the high-risk groups (Figure 5D, H and L). In conclusion, these results prove that the risk signature has a good ability to discriminate and predict the survival of patients with HCC.
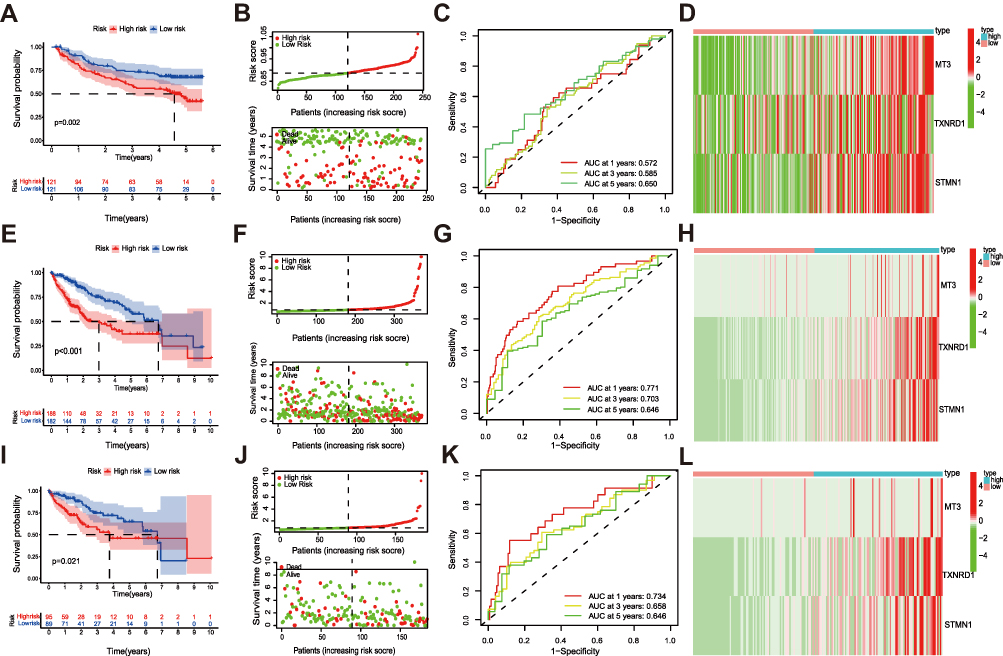 |
Figure 5 Validation of the prognostic signature in the GSE14520 dataset, testing set and total set. (A) OS of HCC, risk score distribution and survival status (B), time-dependent ROC curve 1-, 3-, and 5-year OS predictions (C), heatmap of expression profiles of 3 ferroptosis-related signature genes between risk groups in GSE14520 (D). (E) OS of HCC, risk score distribution and survival status (F), time-dependent ROC curve 1-, 3-, and 5-year OS predictions (G), heatmap of expression profiles of 3 ferroptosis-related signature genes between risk groups in total set (H). (I) OS of HCC, risk score distribution and survival status (J), time-dependent ROC curve 1-, 3-, and 5-year OS predictions (K), heatmap of expression profiles of 3 ferroptosis-related signature genes between risk groups in test set (L). |
Relationships Between the Risk Signature and Clinical Features
To examine the effectiveness of the risk signature, we stratified the clinicopathological features and analyzed the OS of the two risk groups. The results show that the signature can be well applied to every subgroup of age (<= 65/>65; Figure 6A and B), gender (Figure 6C and D), clinical stage (Figure 6E and F), T stage (Figure 6G and H), and histological grade (Figure 6I and J). In all subgroups of these clinical parameters, the prognoses of patients in the high-risk groups were worse than that in the low-risk groups. In addition, the risk scores of patients with clinical stage III/IV were higher than those with clinical stage I/II (Figure 6K). The histological grade also observed the same result (Figure 6L).
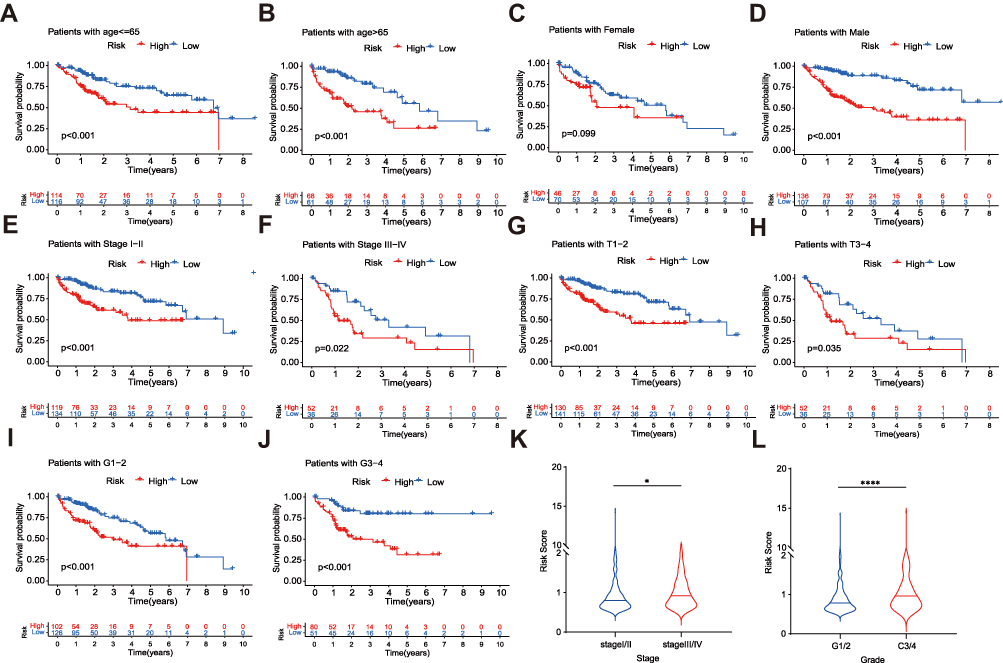 |
Figure 6 Stratified analysis of the prognostic signature in the TCGA dataset. OS of the two risk groups in different clinical stratification like age (A and B), gender (C and D), stage (E and F), T stage (G and H) and grade (I and J). The relationships between the prognostic signature and stage (K), tumor grade (L). The asterisks represented the statistical p value (*P<0.05; ****P < 0.0001). |
Alteration of Tumor Microenvironment Associated with the Risk Signature
The alluvial diagram was used to visualize the survival difference of patients in three ferroptosis clusters and ferroptosis risk signature (Figure 7A). The risk scores of cluster 1 were the lowest. In contrast, the risk scores of cluster 2 and cluster 3 were higher (Figure 7B), suggesting that low-risk scores may be related to immunity and metabolic activation, and high-risk scores were related to the proliferation characteristics of cancer cells. As expected, the proportion of death in the high-risk group was higher than in the low-risk group (Figure 7C). In addition, low-risk scores were closely related to high stromal scores and high ESTIMATE scores. On the contrary, low-risk scores were associated with low tumor purity (Figure 7D–G).
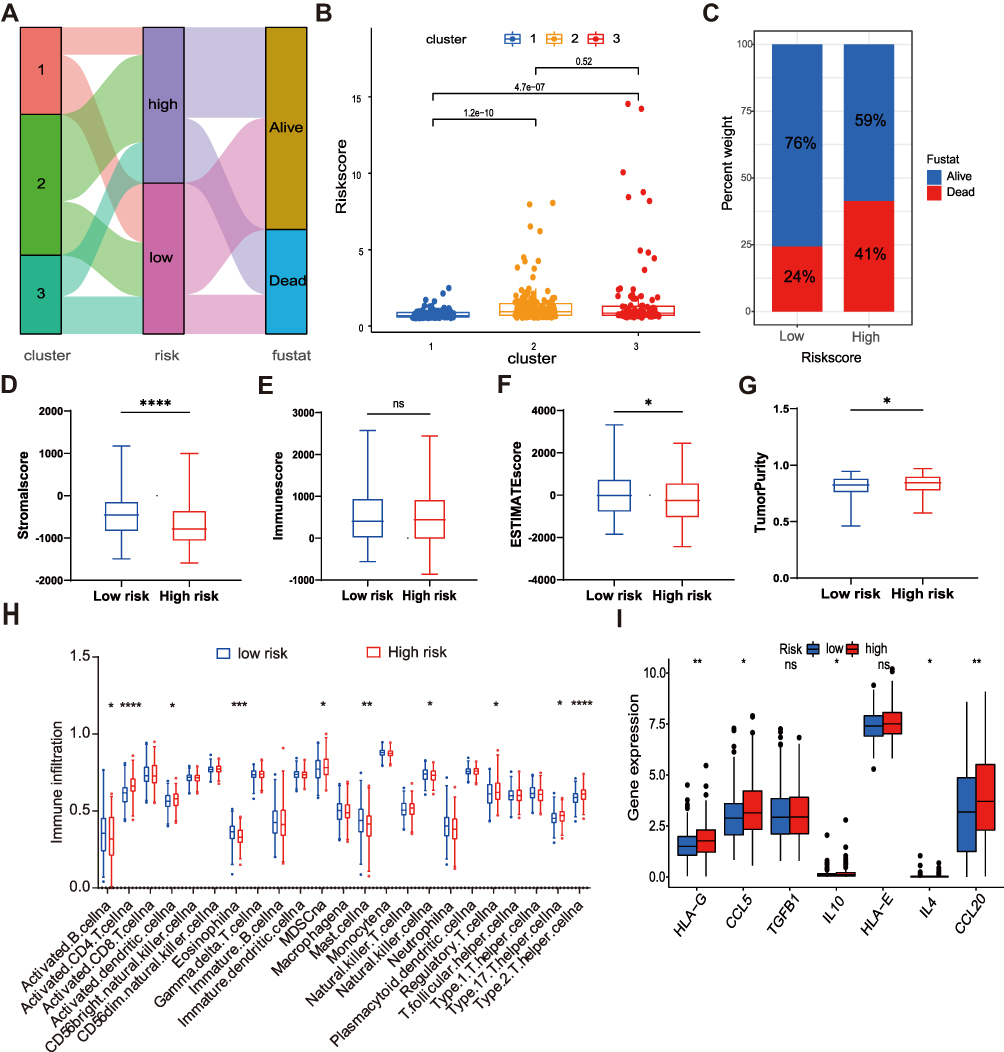 |
Figure 7 Evaluation of the TME and immunosuppressive factors between the two risk groups. (A) Alluvial diagram of clusters distributions in groups with different risk scores and survival outcomes. (B) Differences in risk scores between clusters. (C) The proportion of survival outcomes between risk groups in HCC patients. The box plot indicated the difference of stromal score (D), immune score (E), estimate score (F), and tumor purity (G) between two risk groups. (H) The infiltration difference of TME cells between the two risk groups. (I) Comparison of immunosuppressive factors expression between the two risk groups. The asterisks represented the statistical p value (*P<0.05; **P < 0.01; ***P < 0.001; ****P < 0.0001). Abbreviation: ns, not significant. |
Next, we further explored the infiltration of 23 immune cells in the TME of high-and low-risk groups. In the low-risk group, activated B cells, eosinophils, mast cells, and natural killer cells were significantly enriched. However, in the high-risk group, the immunosuppressive cells such as myeloid-derived suppressor cells (MDSCs), regulatory T cells, and type 17 T helper cells were significantly enriched (Figure 7H). Similarly, some important immunosuppressive factors were also highly expressed in the high-risk group (Figure 7I), such as CCL5 (recruiting regulatory T cells to tumor areas), IL-10 (suppressing tumor-related specific immunity), HLA-G (involving in immune editing of cancer), IL-4 (promoting MDSC activation), CCL20 (promoting regulatory T cells recruitment).28–32
The Relationship Between Risk Signature and Mutation Profile
More and more studies have proved that there was a close relationship between TMB and Immunotherapy, so we calculated the TMB scores of patients with HCC in the TCGA data set and found that there was a positive correlation between TMB scores and risk scores (R = 0.18, p = 0.0005; (Figure 8A). The TMB scores of the high-risk group were significantly higher than that of the low-risk group (Figure 8B). In addition, the TP53 mutation rate in the high-risk group was significantly higher than in the low-risk group (41% vs 10%; Figure 8C and D). Survival analysis revealed that the prognosis of patients with high mutation scores was worse than that of patients with low mutation scores (p = 0.010; Figure 8E), and the prognoses of patients with high mutation and high-risk scores were the worst, while these of patients with low mutation and low-risk scores were the best (Figure 8F). These results revealed that the risk signature could well evaluate the mutation burden of patients and provide a new strategy for Immunotherapy.
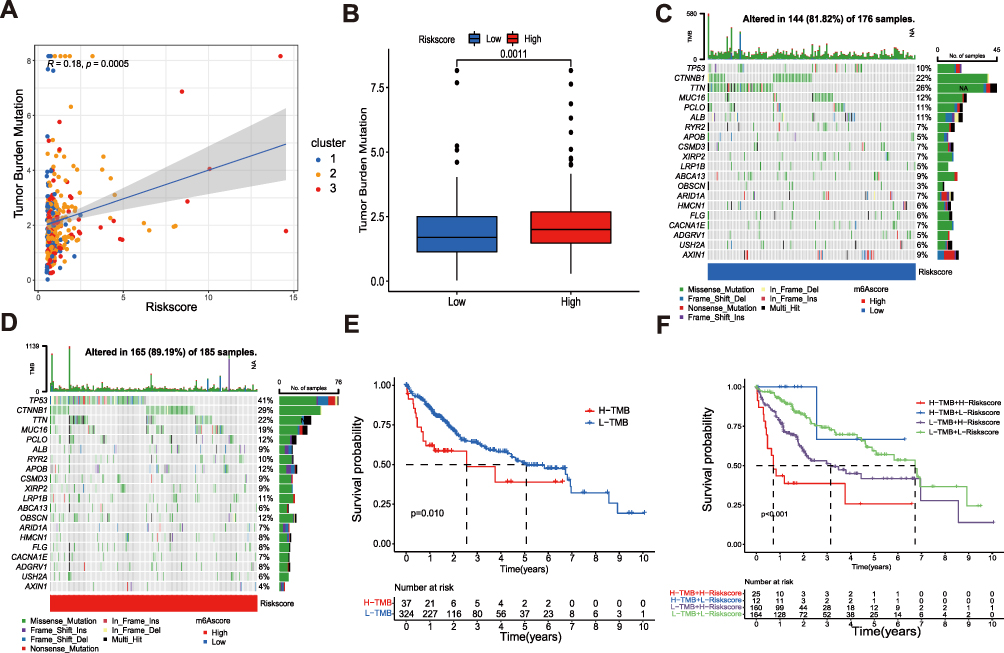 |
Figure 8 The mutation profile and TMB among low-risk and high-risk groups. (A) Spearman correlation analysis of the risk scores and TMB. (B) TMB in different risk score groups. (C and D) The waterfall plot of somatic mutation features established with high and low risk groups. (E) The association of TMB and overall survival of patients. (F) The relationship between the combination of TMB and risk score and the overall survival of patients. |
Immune Checkpoints and Drug Susceptibility Analysis
To explore the relationship between risk signature and immune checkpoints, we verified the expression difference of immune checkpoints between the high-risk and low-risk groups (Figure 9A). It was worth noting that almost all immune checkpoints were highly expressed in high-risk groups, such as CTLA4, PD1, PD-L1, B7-H3, LAG3, TIGIT, TIM-3, CD200R1, indicating that patients in high-risk groups may be more sensitive to Immunotherapy. Based on the IPS (immunophenoscore) predictions, we discovered that whether alone or in combination with anti-PD-1 and anti-CTLA4 treatment, the benefit of the high-risk group was better than that of the low-risk group (Figure 9B–E). Next, we also analyzed the sensitivity of high-risk and low-risk groups to chemotherapeutic drugs. Compared with the high-risk group, patients in the low-risk group had lower IC50 to cytotoxic drugs, such as camptothecin, SN-38, TW37, and YM155, indicating that the low-risk group was more sensitive to these drugs (Figure 9F–I). However, the high-risk group had lower IC50 to small-molecule targeted drugs, such as imatinib, ruxolitinib, dasatinib, sunitinib, sorafenib, bortezomib, which suggested that small-molecule targeted drugs were more effective in the high-risk group (Figure 9J–O).
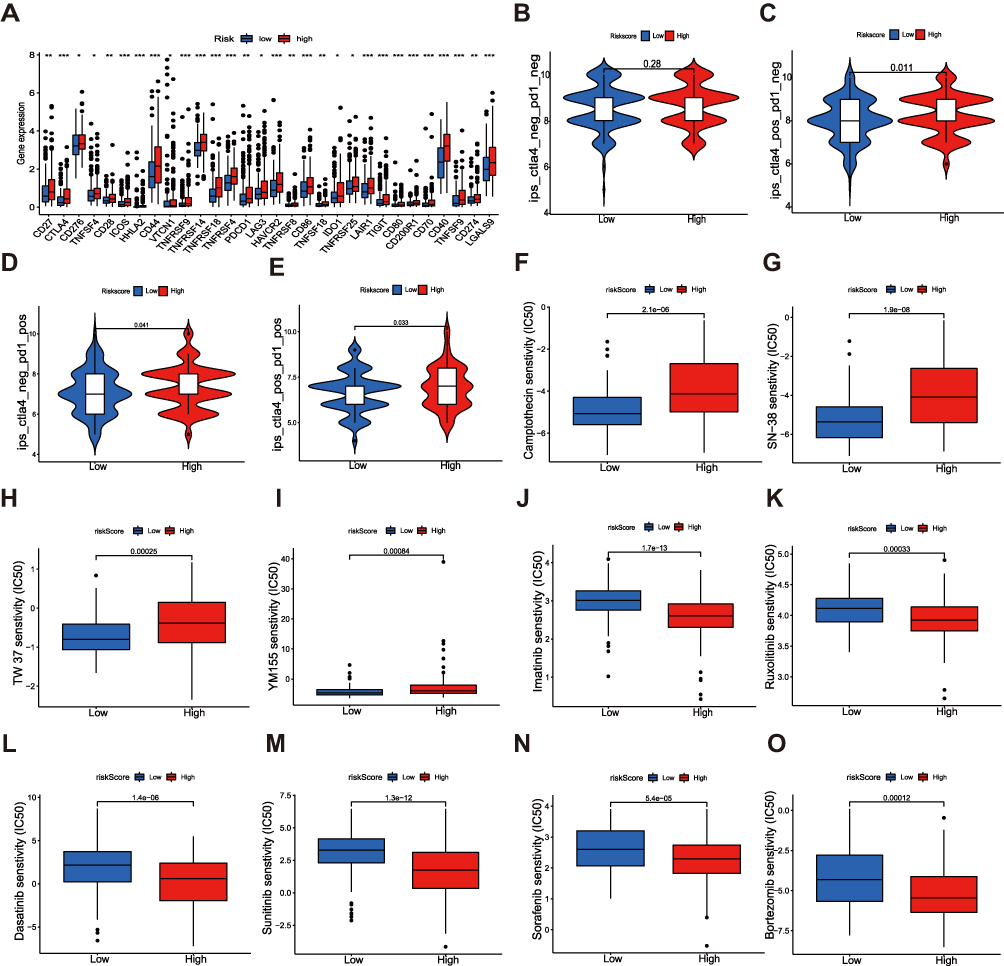 |
Figure 9 Correlations between the risk signature and immune checkpoints and drug susceptibility in HCC. (A) Expression of immune checkpoints in two risk groups. (B–E) Efficacy analysis of different risk groups for immune checkpoint inhibitors. Sensitivity of various cytotoxic drugs (F–I) and small-molecule targeted agents (J–O) in high- and low-risk groups of HCC patients. The asterisks represented the statistical p value (*P<0.05; **P < 0.01; ***P < 0.001). Abbreviation: ns, not significant. |
Validation of the Expression of 3 Ferroptosis-Related Signature Genes
To verify the expression stabilities of 3 ferroptosis-related signature genes, we detected the expression of three genes in cancer and paracancerous normal tissues. Figure 10A–C showed that STMN1, TXNRD1, and MT3 were significantly overexpressed in cancer tissues. Consistent with those of HCC tissues, the expressions of the three genes in four hepatoma cell lines (Hep3B, HepG2, Huh7, and LM3) were higher than that in normal liver cell lines (LO2) (Figure 10D). We obtained the immunohistochemical results of these three genes in HCC and paracancerous tissues from the Human Protein Atlas (HPA) database (Figure 10E). It was proved that these three genes were highly expressed in cancer tissues at the protein level. CCK-8 assay demonstrated that the ferroptosis inducer RSL3 inhibited cell proliferation in a dose-dependent manner (Figure 10F and G). RSL3 treatment significantly increased the accumulation of ROS (Figure 10H–I) and iron (Figure 10K and L) in cells. In addition, RSL3 treatment increased the expression of STMN1, TXNRD1, and MT3 in cells (Figure 10M and N). These results suggest that RSL3 inhibits HCC proliferation by inducing ferroptosis, which is closely related to the three signature genes.
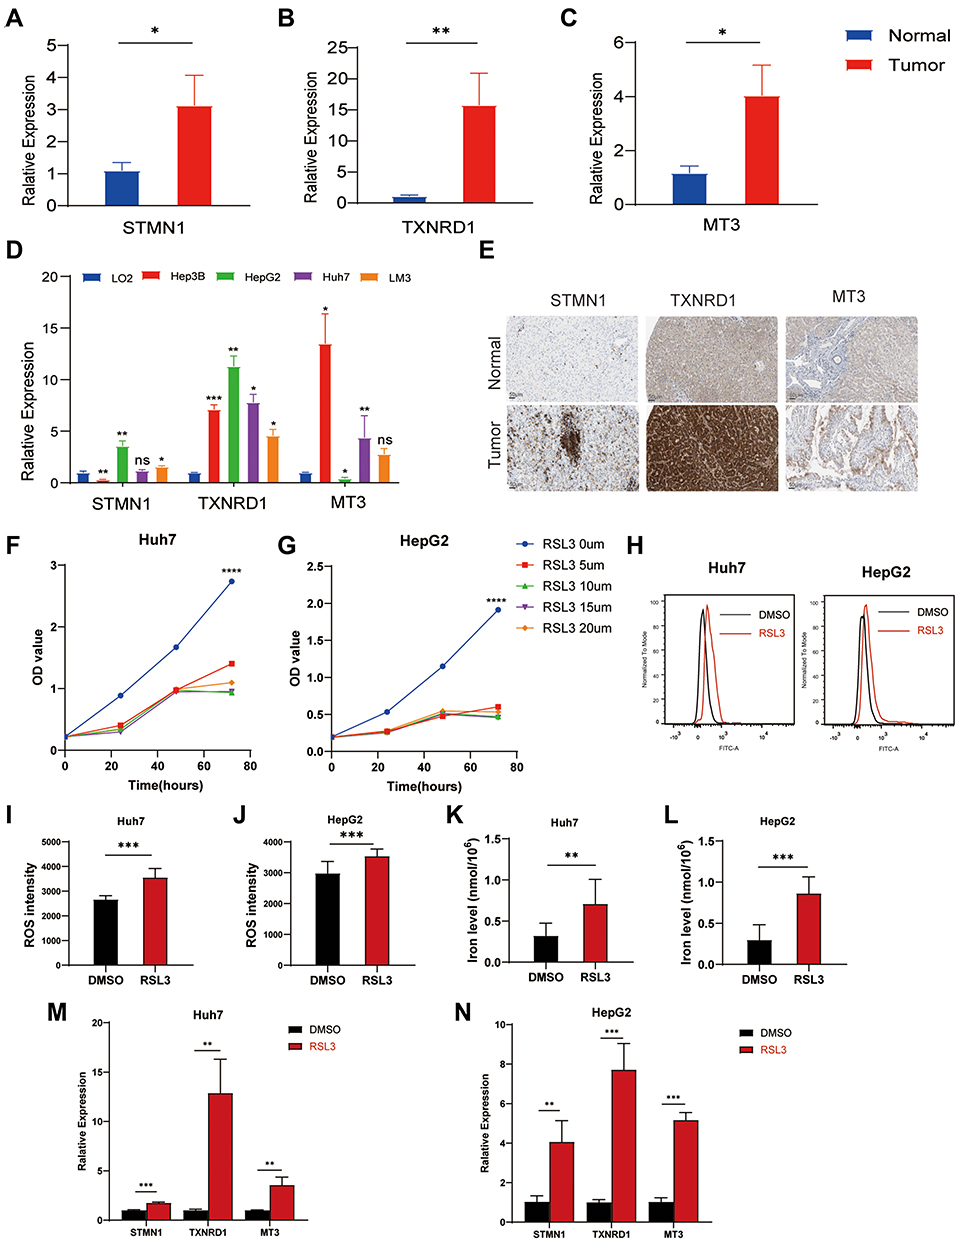 |
Figure 10 Validation of the expression of 3 ferroptosis-related signature genes in HCC. The expression of STMN1 (A), TXNRD1 (B), and MT3 (C) in liver tumor tissues (n=5–14) and corresponding adjacent tissues (n=5–8). (D) The expression of 3 ferroptosis-related signature genes in the liver normal cell line, LO2, and 4 liver cancer cell lines, Hep3B, HepG2, LM3, and Huh7. (E) The immunohistochemical staining results shown significant differences of 3 ferroptosis-related signature genes at the protein expression between liver normal and tumor tissues. The CCK-8 assay showed that RSL3 inhibited the proliferation of Huh7 cells (F) and HepG2 cells (G) in a dose-dependent manner. RSL3 stimulation enhanced ROS accumulation in Huh7 cells (H and I) and HepG2 cells (J). (K and L) RSL3 treatment increased iron levels in Huh7 and HepG2 cells. The expression of STMN1, TXNRD1, and MT3 in Huh7 cells (M) and HepG2 cells (N) after RSL3 treatment. The asterisks represented the statistical p value (*P<0.05; **P < 0.01; ***P < 0.001; ****P < 0.0001). Abbreviation: ns, not significant. |
Discussion
Hepatocellular carcinoma (HCC) is one of the most common cancers, and its treatment has always attracted much attention. As a first-line chemotherapy drug for liver cancer, multi-kinase inhibitor sorafenib has been confirmed to be beneficial to most patients However, no biomarker has been found to predict sorafenib response.33,34 Currently, ICIs have been approved as second-line drugs for treating advanced HCC in the United States. For patients resistant or refractory to sorafenib, an anti-PD-1 antibody has a better response and disease control rate.35,36 Nevertheless, HCC consists of a group of heterogeneous cancers with different etiology, mutations, and immune microenvironments. ICIs are unsuitable for all patients, and only a small number of patients have achieved better outcomes. Ferroptosis has been shown to be involved in the antitumor effect of CD8+T cells activated by ICIs.20 Erastin, a ferroptosis inducer, enhances the cytotoxicity effect of cisplatin after short pretreatment with tumor cells.37 Another ferroptosis inducer, RSL3, can increase cellular ROS and iron accumulation in colon cancer cells in a dose and time-dependent manner, resulting in cell death.38 The key to cancer treatment is effectively killing cancer cells while keeping healthy cells intact. The death mechanism of cancer cells is quite different from that of normal cells, for promoting growth, cancer cells have a higher demand for iron than normal cells. Therefore, this dependence on iron can make cancer cells more sensitive to iron-catalyzed necrosis.39 Of note, ferroptosis has become a new research direction in treating tumors. However, the relationship between ferroptosis and therapy response remains unclear, and relevant biomarkers are still lacking. Therefore, it is necessary to make a comprehensive analysis of the genome and transcriptome of patients with HCC, combined with various algorithms, to mine biomarkers that can predict patients’ treatment responses and guide patients to stratify to provide individual medical strategies for each patient. Effectively reduce the occurrence of complications and medical costs.
First, in the TCGA database, we identified 26 differentially expressed ferroptosis-related genes (DE FRGs) in liver cancer and normal tissues. These DE FRGs may be the most valuable clinical biomarkers. Based on the expression of these 26 DE FRGs, we identified three different molecular subtypes, of which the survival benefit of cluster 1 was the best, cluster 2 was the worst, and cluster 3 was between the two. The expression levels of DE FRGs in cluster 1 were the lowest, closely related to immune and metabolic pathways. However, clusters 2 and 3, with higher expressions of DE FRGs, did show cancer cell-related Hallmark pathways with proliferation. There were also significant differences in the characteristics of TME among the three subtypes. The infiltration abundance of activated B cells and CD8+ T cells, natural killer cells, and gamma delta T cells in cluster 1 were higher than those in cluster 2 and cluster 3, which might explain why cluster 1 had a significant survival advantage. In addition, cluster 1 had higher stromal and immune cell infiltration scores and lowered tumor cell infiltration. We speculated that these ferroptosis-related genes might be a promising immune marker, according to the differences among the three subtypes regarding immune infiltration, hallmark pathways, and clinical results. These contributed to a more comprehensive understanding of ferroptosis and TME of HCC. Furthermore, to explore the mechanism of these ferroptosis-related genes in tumor progression, we constructed a robust and effective prognostic signature using Lasso Cox regression analysis based on these DE FRGs. The signature divided patients into high-risk and low-risk groups with different OS, and its predictive ability was verified in the GSE14520 database. There were significant differences in prognoses, mutation, immune infiltration, immune checkpoints, and drug sensitivity between high-risk and low-risk patients. In addition, by combining the signature with other clinicopathological features of the patient, a Nomogram was established, which further improved the predictive performance and clinical convenience of the signature. The signature can also predict the prognoses of patients of different genders, ages, and clinical stages. In short, the prognostic signature can be well used for patient stratification, understanding the molecular mechanism, and guiding clinical treatment of disease.
Immune-related cells in TME play an indispensable role in the occurrence, development, and treatment of tumors. These interactions between tumor cells and non-tumor cells constitute the TME.40 In HCC, the prominent features were accumulated immunosuppressive cells and depletion of effector T cells. Therefore, the wide-ranging consumption of immunosuppressive cells and the restoration of the function of effector T cells can improve the therapeutic effects of HCC.41 In this study, we found that the characteristics of TME and the abundance of tumor-infiltrating immune cells varied among clusters and risk groups. In addition, immune cells’ high-infiltrating cluster 1 was associated with lower risk scores, and immune cells’ low-infiltrating clusters 2 and 3 were associated with higher risk scores. These findings suggested that ferroptosis plays a significant role in the TME of HCC. CD8+ T cells play a vital role in killing tumor cells, which are the prominent lymphocytes killing tumor cells at present.42,43 Similar to the function of CD8+ T cells, NK cells mainly mediate cytotoxicity by secreting lytic granules, which mainly include key effector molecules such as perforin and granzymes. Perforin inserts into the plasma membrane of target cells to form pores, and granzymes enter through pores to activate caspase and induce target cell apoptosis.44 NK cells also secrete chemokines to recruit dendritic cells (DCs) into TME, and IFN promotes the polarization of type 1 T helper cells.45,46 In an orthotopic mouse model, Chiao et al found that the combination of DCs vaccine and anti-PD-L1 antibody could enhance the antitumor immune response, which showed great potential in the immune defense of HCC.47 Γ δ T cells have unique antitumor properties independent of human leukocyte antigen. More and more studies explored therapy strategies based on γ δ T cells, especially synergistic therapy with ICIs and chemotherapy.48 Cluster 1 with low-risk scores showed a better prognosis and high infiltration patterns of CD8+ T cells, NK cells, DCs, type 1 helper cells, and γ δ T cells, indicating that the infiltration of these cells was positively correlated with the prognoses of patients. In HCC, many immunosuppressive cells can promote the occurrence and progression of cancer. Regulatory T cells (Tregs) promote the invasion and migration of HCC cells by secreting TGF-β1.49 In vitro studies have shown that Th17 cells can inhibit the proliferation of CD8+T cells and the production of IFN.50 MDSCs not only secrete IL-10 and TGF-β immunosuppressive molecules to inhibit the activity of DCs, T cells, B cells, and NK cells but also stimulate Th17, Tregs, and tumor-associated macrophages (TAMs) cells, as well as tumor angiogenesis and metastasis.51 These were consistent with our results. In the high-risk group with poor prognoses, Tregs, Th17, and MDSCs immunosuppressive cells were higher than those in the low-risk group. The roles of B cells in TME should not be underestimated. Zhang et al found that patients with a high density of B cell infiltration in HCC had better prognoses.52 In the hepatoma model of Hras12V transgenic mice, B cells inhibited the occurrence of tumors.53 The interaction between tumor-infiltrating B cells and T cells can enhance immune activities and improve the prognoses of patients with liver cancer.54 These correspond to our findings that the level of B cell infiltration of the low-risk group was higher than the high-risk group. It was suggested that B cells could be used as an innovative therapeutic target for anticancer. We noted that activated CD4+ T cells were highly infiltrated in the high-risk group, but some studies showed no correlation between CD4+ T cells and the prognoses of HCC patients.55,56 Therefore, further experiments are needed to verify the regulations of CD4+ T cells. In conclusion, we speculated that the poor prognoses of HCC patients were due to the immunosuppressive TME, and the better prognoses were due to the higher infiltration levels of antitumor immune cells.
TMB has become a new biomarker of ICIs treatment response.15 In this study, we analyzed the relationship between risk signature and TMB and found that the high-risk group with higher TMB might be inclined to respond to ICIs. It was worth noting that there was a positive correlation between the risk scores and the expressions of immune checkpoints such as CTLA4, PD1, PD-L1, B7-H3, LAG3, TIGIT, TIM-3, CD200R1, which also suggested that ICIs applied to patients in the high-risk group. The predictions of IPS were also consistent with our speculation. In addition, drug sensitivity analysis has shown that chemotherapy has potential benefits for patients in the high-risk group. These results provided a reference for the selection and efficacy prediction of Immunotherapy and chemotherapy in patients with HCC.
However, this study had several limitations. First, all the analyses were based on transcriptome data in the public database, and there were no further reliable experiments to support our point of view. Second, all the samples used in our study were retrospective. Large-scale prospective studies should be needed to confirm our findings. In addition, some critical clinical treatments that affected the patients’ prognoses, such as surgery, neoadjuvant chemotherapy, and radiotherapy, have not been comprehensively analyzed.
Conclusion
In summary, we explored the regulatory patterns of ferroptosis-related genes and developed a novel signature based on DE FRGs, which has an excellent ability to predict prognoses of HCC patients. The results further supplied new perspectives for ferroptosis in regulating TME and drug sensitivities and showed unique ingenuity for guiding personalized Immunotherapy and chemotherapy for HCC patients.
Abbreviations
HCC, Hepatocellular carcinoma; TME, tumor microenvironment; DE FRGs, differentially expressed ferroptosis-related genes; MDSCs, myeloid-derived suppressor cells; ICIs, Immune checkpoint inhibitors; GSH, peptide glutathione; Gpx4, Glutathione-peroxidase; TMB, Tumor mutational burden; CTLs, cytotoxic T lymphocytes; DAMPs, damage-associated molecular pattern; FRGs, ferroptosis-related genes; TCGA, The Cancer Genome Atlas; CNV, copy number variation; DEGs, differentially expressed genes; FC, fold change; CDF, distribution function; GSVA, gene set variation analyses; ssGSEA, single sample gene set enrichment analysis; OS, overall survival; LASSO, the least absolute shrinkage and selection operator; AUC, area under the curve; qRT-PCR, quantitative Real-Time Polymerase Chain Reaction; GO, gene ontology; ROC, receiver operating characteristic curve; DCA, decision curve analysis; IC50, semi-inhibitory concentration; DCs, dendritic cells; Tregs, regulatory T cells; TAMs, tumor-associated macrophages; ROS, reactive oxygen species.
Data Sharing Statement
Publicly available datasets were analyzed in this study; these can be found in The Cancer Genome Atlas (TCGA) (https://portal.gdc.cancer.gov/) and GSE14520 (https://www.ncbi.nlm.nih.gov/geo/).
Ethics Approval and Consent to Participate
The tissue samples of HCC patients used in the present study were approved by the Ethics Committee of Zhongnan Hospital of Wuhan University. Written informed consent was obtained from all patients (grant number #20200110). The study was performed and reported in accordance with the Helsinki Declaration.
Acknowledgments
Chunlan Zheng and Yanan Peng are co-first authors for this study. Lan Liu and Qiu Zhao are co-correspondence authors for this study.
Author Contributions
All authors made a significant contribution to the work reported, whether that is in the conception, study design, execution, acquisition of data, analysis and interpretation, or in all these areas; took part in drafting, revising or critically reviewing the article; gave final approval of the version to be published; have agreed to submit to the current journal; and agree to be accountable for all aspects of the work.
Funding
This work was supported by the National Natural Science Foundation of China grants (grant number #81870390).
Disclosure
The authors declare that they have no competing interests in this work.
References
1. Bray F, Ferlay J, Soerjomataram I, et al. Global cancer statistics 2018, GLOBOCAN estimates of incidence and mortality worldwide for 36 cancers in 185 countries. CA Cancer J Clin. 2018;68:394–424. doi:10.3322/caac.21492
2. Marasco G, Colecchia A, Colli A, et al. Role of liver and spleen stiffness in predicting the recurrence of hepatocellular carcinoma after resection. J Hepatol. 2019;70. doi:10.1016/j.jhep.2018.10.022
3. Bruix J, Qin S, Merle P, et al. Regorafenib for patients with hepatocellular carcinoma who progressed on sorafenib treatment (RESORCE), a randomised, double-blind, placebo-controlled, Phase 3 trial. Lancet. 2017;389:56–66. doi:10.1016/s0140-6736(16)32453-9
4. Foerster F, Galle PR. The current landscape of clinical trials for systemic treatment of HCC. Cancers. 2021;13:1962. doi:10.3390/cancers13081962
5. Kudo M. Scientific rationale for combination immunotherapy of hepatocellular carcinoma with Anti-PD-1/PD-L1 and Anti-CTLA-4 antibodies. Liver Cancer. 2019;8. doi:10.1159/000503254
6. Pinto Marques H, da Silva G, De Martin S, Agopian E, Martins PN. Emerging biomarkers in HCC patients, Current status. Int J Surg. 2020;82:70–76. doi:10.1016/j.ijsu.2020.04.043
7. Dixon SJ, Lemberg K, Lamprecht M, et al. Ferroptosis, an iron-dependent form of nonapoptotic cell death. Cell. 2012;149:1060–1072. doi:10.1016/j.cell.2012.03.042
8. Yang WS, SriRamaratnam R, Welsch M, et al. Regulation of ferroptotic cancer cell death by GPX4. Cell. 2014;156:317–331. doi:10.1016/j.cell.2013.12.010
9. Lachaier E, Louandre C, Godin C, et al. Sorafenib induces ferroptosis in human cancer cell lines originating from different solid tumors. Anticancer Res. 2014;34:6417–6422.
10. Sun J, Zhou C, Zhao Y, et al. Quiescin sulfhydryl oxidase 1 promotes sorafenib-induced ferroptosis in hepatocellular carcinoma by driving EGFR endosomal trafficking and inhibiting NRF2 activation. Redox Biol. 2021;41:101942. doi:10.1016/j.redox.2021.101942
11. Chang WT, Bow Y-D, Fu P-J, et al. A marine terpenoid, heteronemin, induces both the apoptosis and ferroptosis of hepatocellular carcinoma cells and involves the ROS and MAPK pathways. Oxid Med Cell Longev. 2021;2021:1–12. doi:10.1155/2021/7689045
12. Yang M, Wu X, Hu J, et al. COMMD10 inhibits HIF1α/CP loop to enhance ferroptosis and radiosensitivity by disrupting Cu-Fe balance in hepatocellular carcinoma. J Hepatol. 2022;76:1138–1150. doi:10.1016/j.jhep.2022.01.009
13. Gao R, Kalathur RKR, Coto‐Llerena M, et al. YAP/TAZ and ATF4 drive resistance to Sorafenib in hepatocellular carcinoma by preventing ferroptosis. EMBO Mol Med. 2021;13:e14351. doi:10.15252/emmm.202114351
14. Steuer CE, Ramalingam SS. Tumor mutation burden, leading immunotherapy to the era of precision medicine? J Clin Oncol. 2018;36:631–632. doi:10.1200/jco.2017.76.8770
15. Samstein RM, Lee C-H, Shoushtari AN, et al. Tumor mutational load predicts survival after immunotherapy across multiple cancer types. Nat Genet. 2019;51:202–206. doi:10.1038/s41588-018-0312-8
16. McNamara MG, Jacobs T, Lamarca A, et al. Impact of high tumor mutational burden in solid tumors and challenges for biomarker application. Cancer Treat Rev. 2020;89:102084. doi:10.1016/j.ctrv.2020.102084
17. Gubin MM, Artyomov MN, Mardis ER, Schreiber RD. Tumor neoantigens, building a framework for personalized cancer immunotherapy. J Clin Invest. 2015;125:3413–3421. doi:10.1172/jci80008
18. Goodman AM, Kato S, Bazhenova L, et al. Tumor mutational burden as an independent predictor of response to immunotherapy in diverse cancers. Mol Cancer Ther. 2017;16:2598–2608. doi:10.1158/1535-7163.Mct-17-0386
19. Hinshaw DC, Shevde LA. The tumor microenvironment innately modulates cancer progression. Cancer Res. 2019;79:4557–4566. doi:10.1158/0008-5472.Can-18-3962
20. Wang W, Green M, Choi JE, et al. CD8(+) T cells regulate tumour ferroptosis during cancer immunotherapy. Nature. 2019;569:270–274. doi:10.1038/s41586-019-1170-y
21. Tang D, Chen X, Kang R, Kroemer G. Ferroptosis, molecular mechanisms and health implications. Cell Res. 2021;31:107–125. doi:10.1038/s41422-020-00441-1
22. Xu H, Ye D, Ren M, Zhang H, Bi F. Ferroptosis in the tumor microenvironment, perspectives for immunotherapy. Trends Mol Med. 2021;27:856–867. doi:10.1016/j.molmed.2021.06.014
23. Zhou N, Bao J. FerrDb, a manually curated resource for regulators and markers of ferroptosis and ferroptosis-disease associations. Database. 2020;2020. doi:10.1093/database/baaa021
24. Wilkerson MD, Hayes DN. ConsensusClusterPlus, a class discovery tool with confidence assessments and item tracking. Bioinformatics. 2010;26:1572–1573. doi:10.1093/bioinformatics/btq170
25. Hänzelmann S, Castelo R, Guinney J. GSVA, gene set variation analysis for microarray and RNA-seq data. BMC Bioinform. 2013;14. doi:10.1186/1471-2105-14-7
26. Rooney MS, Shukla SA, Wu CJ, Getz G, Hacohen N. Molecular and genetic properties of tumors associated with local immune cytolytic activity. Cell. 2015;160:48–61. doi:10.1016/j.cell.2014.12.033
27. Yoshihara K, Shahmoradgoli M, Martínez E, et al. Inferring tumour purity and stromal and immune cell admixture from expression data. Nat Commun. 2013;4. doi:10.1038/ncomms3612
28. Locati M, Deuschle U, Massardi ML, et al. Analysis of the gene expression profile activated by the CC chemokine ligand 5/RANTES and by lipopolysaccharide in human monocytes. J Immunol. 2002;168:3557–3562. doi:10.4049/jimmunol.168.7.3557
29. Mougiakakos D, Choudhury A, Lladser A, Kiessling R, Johansson CC. Regulatory T cells in cancer. Adv Cancer Res. 2010;107:57–117. doi:10.1016/s0065-230x(10)07003-x
30. Li P, Wang N, Zhang Y, Wang C, Du L. HLA-G/sHLA-G and HLA-G-bearing extracellular vesicles in cancers, potential role as biomarkers. Front Immunol. 2021;12. doi:10.3389/fimmu.2021.791535
31. Gabrilovich DI, Nagaraj S. Myeloid-derived suppressor cells as regulators of the immune system. Nat Rev Immunol. 2009;9:162–174. doi:10.1038/nri2506
32. Chen KJ, Lin SZ, Zhou L, et al. Selective recruitment of regulatory T cell through CCR6-CCL20 in hepatocellular carcinoma fosters tumor progression and predicts poor prognosis. PLoS One. 2011;6. doi:10.1371/journal.pone.0024671
33. Vogel A, Cervantes A, Chau I, et al. Hepatocellular carcinoma, ESMO clinical practice guidelines for diagnosis, treatment and follow-up. Ann Oncol. 2018;29:iv238–iv255. doi:10.1093/annonc/mdy308
34. Bruix J, Cheng A-L, Meinhardt G, et al. Prognostic factors and predictors of sorafenib benefit in patients with hepatocellular carcinoma, Analysis of two Phase III studies. J Hepatol. 2017;67:999–1008. doi:10.1016/j.jhep.2017.06.026
35. Zhu AX, Finn RS, Edeline J, et al. Pembrolizumab in patients with advanced hepatocellular carcinoma previously treated with sorafenib (KEYNOTE-224), a non-randomised, open-label Phase 2 trial. Lancet Oncol. 2018;19:940–952. doi:10.1016/s1470-2045(18)30351-6
36. El-Khoueiry AB, Sangro B, Yau T, et al. Nivolumab in patients with advanced hepatocellular carcinoma (CheckMate 040), an open-label, non-comparative, Phase 1/2 dose escalation and expansion trial. Lancet. 2017;389:2492–2502. doi:10.1016/s0140-6736(17)31046-2
37. Sato M, Kusumi R, Hamashima S, et al. The ferroptosis inducer erastin irreversibly inhibits system x(c)- and synergizes with cisplatin to increase cisplatin’s cytotoxicity in cancer cells. Sci Rep. 2018;8. doi:10.1038/s41598-018-19213-4
38. Sui X, Zhang R, Liu S, et al. RSL3 drives ferroptosis through GPX4 inactivation and ROS production in colorectal cancer. Front Pharmacol. 2018;9. doi:10.3389/fphar.2018.01371
39. Hassannia B, Vandenabeele P, Vanden Berghe T. Targeting ferroptosis to iron out cancer. Cancer Cell. 2019;35:830–849. doi:10.1016/j.ccell.2019.04.002
40. Pottier C, Wheatherspoon A, Roncarati P, et al. The importance of the tumor microenvironment in the therapeutic management of cancer. Expert Rev Anticancer Ther. 2015;15:943–954. doi:10.1586/14737140.2015.1059279
41. Lugade AA, Kalathil S, Miller A, Iyer R, Thanavala Y. High immunosuppressive burden in advanced hepatocellular carcinoma patients, Can effector functions be restored? Oncoimmunology. 2013;2:e24679. doi:10.4161/onci.24679
42. Melief CJ. Mutation-specific T cells for immunotherapy of gliomas. N Engl J Med. 2015;372:1956–1958. doi:10.1056/NEJMcibr1501818
43. Farhood B, Najafi M, Mortezaee K. CD8 + cytotoxic T lymphocytes in cancer immunotherapy: a review. J Cell Physiol. 2019;234:8509–8521. doi:10.1002/jcp.27782
44. Gwalani LA, Orange JS. Single degranulations in NK cells can mediate target cell killing. J Immunol. 2018;200:3231–3243. doi:10.4049/jimmunol.1701500
45. Barry KC, Hsu J, Broz ML, et al. A natural killer-dendritic cell axis defines checkpoint therapy-responsive tumor microenvironments. Nat Med. 2018;24:1178–1191. doi:10.1038/s41591-018-0085-8
46. Morvan MG, Lanier LL. NK cells and cancer, you can teach innate cells new tricks. Nat Rev Cancer. 2016;16:7–19. doi:10.1038/nrc.2015.5
47. Teng CF, Wang T, Wu T-H, et al. Combination therapy with dendritic cell vaccine and programmed death ligand 1 immune checkpoint inhibitor for hepatocellular carcinoma in an orthotopic mouse model. Ther Adv Med Oncol. 2020;12:175883592092203. doi:10.1177/1758835920922034
48. Kabelitz D, Serrano R, Kouakanou L, Peters C, Kalyan S. Cancer immunotherapy with γδ T cells, many paths ahead of us. Cell Mol Immunol. 2020;17. doi:10.1038/s41423-020-0504-x
49. Shi C, Chen Y, Chen Y, Yang Y, Bing W, Qi J. CD4(+) CD25(+) regulatory T cells promote hepatocellular carcinoma invasion via TGF-β1-induced epithelial-mesenchymal transition. Onco Targets Ther. 2019;12. doi:10.2147/ott.S172417
50. Zhao F, Korangy F, Greten TF. Cellular immune suppressor mechanisms in patients with hepatocellular carcinoma. Dig Dis. 2012;30:477–482. doi:10.1159/000341695
51. Hao X, Sun G, Zhang Y, et al. Targeting immune cells in the tumor microenvironment of HCC, new opportunities and challenges. Front Cell Dev Biol. 2021;9. doi:10.3389/fcell.2021.775462
52. Zhang Z, Ma L, Goswami S, et al. Landscape of infiltrating B cells and their clinical significance in human hepatocellular carcinoma. Oncoimmunology. 2019;8:e1571388. doi:10.1080/2162402x.2019.1571388
53. Wang K, Nie X, Rong Z, et al. B lymphocytes repress hepatic tumorigenesis but not development in Hras12V transgenic mice. Int J Cancer. 2017;141:1201–1214. doi:10.1002/ijc.30823
54. Garnelo M, Tan A, Her Z, et al. Interaction between tumour-infiltrating B cells and T cells controls the progression of hepatocellular carcinoma. Gut. 2017;66:342–351. doi:10.1136/gutjnl-2015-310814
55. Gao Q, Qiu S-J, Fan J, et al. Intratumoral balance of regulatory and cytotoxic T cells is associated with prognosis of hepatocellular carcinoma after resection. J Clin Oncol. 2007;25:2586–2593. doi:10.1200/jco.2006.09.4565
56. Yao W, He J-C, Yang Y, et al. The prognostic value of tumor-infiltrating lymphocytes in hepatocellular carcinoma, a systematic review and meta-analysis. Sci Rep. 2017;7. doi:10.1038/s41598-017-08128-1
 © 2023 The Author(s). This work is published and licensed by Dove Medical Press Limited. The
full terms of this license are available at https://www.dovepress.com/terms
and incorporate the Creative Commons Attribution
- Non Commercial (unported, 3.0) License.
By accessing the work you hereby accept the Terms. Non-commercial uses of the work are permitted
without any further permission from Dove Medical Press Limited, provided the work is properly
attributed. For permission for commercial use of this work, please see paragraphs 4.2 and 5 of our Terms.
© 2023 The Author(s). This work is published and licensed by Dove Medical Press Limited. The
full terms of this license are available at https://www.dovepress.com/terms
and incorporate the Creative Commons Attribution
- Non Commercial (unported, 3.0) License.
By accessing the work you hereby accept the Terms. Non-commercial uses of the work are permitted
without any further permission from Dove Medical Press Limited, provided the work is properly
attributed. For permission for commercial use of this work, please see paragraphs 4.2 and 5 of our Terms.
Recommended articles
Identification of a Novel Ferroptosis-Related Gene Signature for Predicting Prognosis and Responsiveness to Immunotherapy in Hepatocellular Carcinoma
Wang Q, Wang B, Ma X, Zhuang H, Xie Z, Tang C, Tan W, Yang L, Shang C, Chen Y
Journal of Hepatocellular Carcinoma 2023, 10:1-16
Published Date: 10 January 2023
Development and Validation of a Novel Nomogram Integrated with Hypoxic and Lactate Metabolic Characteristics for Prognosis Prediction in Hepatocellular Carcinoma
Qiu X, Dong L, Wang K, Zhong X, Xu H, Xu S, Guo H, Wei X, Chen W, Xu X
Journal of Hepatocellular Carcinoma 2024, 11:241-255
Published Date: 2 February 2024
Comprehensive Analysis of Angiogenesis and Ferroptosis Genes for Predicting the Survival Outcome and Immunotherapy Response of Hepatocellular Carcinoma
Wang P, Kong G
Journal of Hepatocellular Carcinoma 2024, 11:1845-1859
Published Date: 29 September 2024
The Potential Value of RPS27A in Prognosis and Immunotherapy: From Pan-Cancer Analysis to Hepatocellular Carcinoma Validation
Kuai X, Wei C, He X, Wang F, Wang C, Ji J
ImmunoTargets and Therapy 2024, 13:673-690
Published Date: 8 December 2024
Serum Osteopontin Enhances Hepatocellular Carcinoma Diagnosis and Predicts Anti-PD-L1 Immunotherapy Benefit

Wu M, Zou F, He S, Pi Y, Song Y, Chen S, Li L
Journal of Hepatocellular Carcinoma 2025, 12:729-745
Published Date: 13 April 2025