Back to Journals » OncoTargets and Therapy » Volume 12
Identification and validation of an individualized autophagy-clinical prognostic index in bladder cancer patients
Authors Wang SS ![]() , Chen G, Li SH, Pang JS, Cai KT
, Chen G, Li SH, Pang JS, Cai KT ![]() , Yan HB
, Yan HB ![]() , Huang ZG
, Huang ZG ![]() , He RQ
, He RQ
Received 10 December 2018
Accepted for publication 22 March 2019
Published 14 May 2019 Volume 2019:12 Pages 3695—3712
DOI https://doi.org/10.2147/OTT.S197676
Checked for plagiarism Yes
Review by Single anonymous peer review
Peer reviewer comments 2
Editor who approved publication: Dr Jianmin Xu
Shi-Shuo Wang,1 Gang Chen,1 Sheng-Hua Li,2 Jin-Shu Pang,2 Kai-Teng Cai,2 Hai-Biao Yan,2 Zhi-Guang Huang,1 Rong-Quan He3
1Department of Pathology, The First Affilated Hospital of Guangxi Medical University, Nanning, Guangxi Zhuang Autonomous Region, People’s Republic of China; 2Department of Urology, The First Affiliated Hospital of Guangxi Medical University, Nanning, Guangxi Zhuang Autonomous Region, People’s Republic of China; 3Department of Oncology, The First Affiliated Hospital of Guangxi Medical University, Nanning, Guangxi Zhuang Autonomous Region, People’s Republic of China
Purpose: Autophagy is a major catabolic system by which eukaryotic cells undergo self-degradation of damaged, defective, or unwanted intracellular components. An abnormal autophagic level is implicated in the pathogenesis of multiple diseases, including cancers. The aim of this study is to explore the prognostic value of autophagy in bladder cancer (BC), which is a major cause of cancer-related death globally.
Patients and methods: First, 27 differentially expressed autophagy-related genes (ARGs) were identified in BC patients based on The Cancer Genome Atlas (TCGA) database. Functional enrichment analyses hinted that autophagy may act in a tumor-suppressive role in the initiation of BC. Then, the Cox proportional hazard regression model were employed to identify three key prognostic ARGs (JUN, MYC, and ITGA3), which were related with overall survival (OS) significantly in BC. The three genes represented important clinical significance and prognostic value in BC. Then a prognostic index (PI) was constructed.
Results: The PI was constructed based on the three genes, and significantly stratified BC patients into high- and low-risk groups in terms of OS (HR=1.610, 95% CI=1.200–2.160, P=0.002). PI remained as an independent prognostic factor in multivariate analyses (HR=2.355, 95% CI=1.483–3.739, P<0.001). When integrated with clinical characteristics of age and stage, an autophagy-clinical prognostic index (ACPI) was finally validated, which had improved performance in predicting OS of BC patients (HR=2.669, 95% CI=1.986–3.587, P<0.001). The ACPI was confirmed in datasets of GSE13507 (HR=7.389, 95% CI=3.645–14.980, P<0.001) and GSE31684 (HR=1.665, 95% CI=0.872–3.179, P=0.122).
Conclusion: This study provides a potential prognostic signature for predicting prognosis of BC patients and molecular insights of autophagy in BC.
Keywords: autophagy-related genes, prognostic index, bladder cancer, The Cancer Genome Atlas
Introduction
Autophagy, also known as type II programmed cell death, is a major catabolic system by which eukaryotic cells undergo self-degradation of damaged, defective, or unwanted intracellular components.1,2 This is, in part, to quality control of intracellular organelles by continually renewing fresh, better-quality ones. Therefore, stability of cellular renovation, homeostasis, and maintaining physiological level are inseparable from autophagy. An abnormal autophagic level implicated in the pathogenesis of multiple diseases, including inflammation, neurodegenerative diseases, and tumors.3–7 However, the knowledge of autophagy-related mechanism in cancer is still rudimentary and inconclusive. Due to the complex function of autophagy in cancer, the further research on the relation of autophagy and tumors, underlying biological process, and then to apply this knowledge in well-designed therapeutic strategy could be valuable in the new route of cancer therapy. Even whether autophagy is a friend or a foe for cancers cannot draw reliable conclusions for now.8–10
Bladder cancer (BC) is a major cause of cancer-related death globally, causing 165,100 deaths per year.11 In the United States, thee were an estimated 79,030 newly-diagnosed cases in 2017 and 16,870 patients who succumbed to BC.12 Recently, several studies reported that autophagy could be an indispensable mechanism of the onset and progression of BC, which provided a new direction for the clinical management of BC.13–17 Su et al18 observed increased autophagic proteins in high grade urothelial bladder carcinoma, which were regulated via AMPK activation and mTOR inhibition for tumor cells survival, and inhibition of autophagy led to cancer cell death. Some studies have also suggested that targeting autophagy could improve sensitivity to anti-bladder cancer chemotherapy agents.14,15 Thus, exploring the appropriate molecular biomarkers focused on autophagy has attractive value in estimating the deterioration of BC reliably, and may be an important means of fighting BC.
Here we examined the correlation between expression profiles of autophagy-related genes (ARGs) and clinical outcome in 412 BC patients from The Cancer Genome Atlas (TCGA) and developed prognostic index (PI) as an independent index for overall survival (OS) prognosis based on ARGs. To leverage the complementary value of molecular and clinical characteristics, we integrated the PI with clinical factors to build a composite autophagy-clinical prognostic index (ACPI), which allowed us to improve the prognostic efficiency of BC patients. Further validation based on other databases evidently support our risk score model. These findings could also provide an effective multi-dimensional biomarker strategy that would be effective in monitoring autophagy and predicting the prognosis in BC patients.
Materials and methods
Data acquisition
The Human Autophagy Database (HADb,
Differentially expressed ARGs enrichment analysis
EdgeR package in R statistical software was applied to estimate differentially expressed ARGs between BC and non-tumor samples. Genes exhibiting at least 2-fold changes corresponding to an adjusted P-value less than 0.05 were selected as the significantly differentially expressed ARGs. Then, we performed a series of gene functional enrichment analyses to find the major biological attributes of these genes, including gene ontology (GO) and Kyoto Encyclopedia of Genes and Genomes (KEGG). The Database for Annotation, Visualization, and Integrated Discovery (DAVID,
Construction of an individualized prognostic index based on ARGs
ARGs expression profiles downloaded from TCGA were normalized by [log2(count+1)] transformed. Univariate Cox regression analyses were performed to select the ARGs whose expression profiles were significantly associated with BC patients’ OS. Subsequently, these survival-related genes were subjected to a multivariate Cox regression analysis to remove the genes that might not be an independent indicator in prognosis monitoring. Finally, several prognostic ARGs were obtained and the PI composed of these genes was developed. The formula of PI based on a linear combination of the relative expression level of genes multiplied regression coefficients, which represented the relative weight of genes in the multiple Cox analysis. BC patients were separated into high- and low-risk groups by the median PI value as the risk cutoff value. The survival curves were plotted by Kaplan–Meier (K–M) method, and differences in the survival rates between high- and low-risk groups were assessed using the log-rank test.
To investigate if the autophagy-related PI could be an independent predictor of OS in the TCGA cohort of BC patients, the multivariate Cox regression analysis was conducted. The PI, age, gender, tumor subtype, pathological stages, and histological grades were used as covariates. Age, stage, and PI were coded as continuous variables. Specifically, stage was coded as I=1, II=2, III=3, and IV=4. The risk factors of gender, subtype, and histologic grade are male, non-Papillary, and high grade.
Statistical analysis
All statistical analyses were conducted using SPSS 24.0 (Chicago, IL, USA) and R 3.3.1 (
Results
Differentially expressed ARGs
Altogether RNA-seq and clinical data of 414 BC tissue samples and 19 non-tumor samples were downloaded from TCGA. Among these patients, a total of 408 primary BC patients with gene expression data and clinical follow-up information was involved in the current study. Expression values of 234 ARGs were extracted. Considered as the criteria of a FDR <0.05 and |log2(Fold Change)|>1, we finally obtained nine up-regulated and 18 down-regulated ARGs (Figure 1). Furthermore, scatter plots were visualized to display the expression pattern of the 27 differentially expressed ARGs between BC and non-tumor tissues (Figure 2). Scatter plots displayed expression patterns of 18 down-regulated genes (FOS, JUN, HSPB8, CDKN1A, ITPR1, TP53INP2, PPP1R15A, DLC1, BAG3, MYC, GABARAPL1, BLC2, CCL2, PRKN, NAMPT, CXCR4, NRG2, and CX3CL1) and nine up-regulated genes (BIRC5, CDKN2A, BID, EVA1A, TP73, RGS19, EIF4EBP1, ITGB4, and ITGA3).
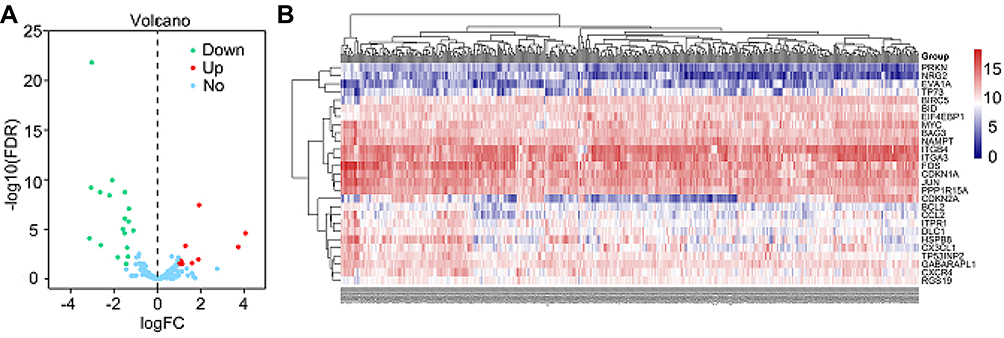 | Figure 1 Differentially expressed autophagy-related genes (ARGs) between bladder cancer (BC) and normal bladder tissues. (A) The volcano plot for the 234 ARGs from the TCGA data portal. Red indicates high expression and green low expression. Blue shows those genes showed no difference between BC and normal bladder tissues. (B) Hierarchical clustering of differentially expressed ARGs expression levels. Abbreviations: FDR, false discovery rate; TCGA, The Cancer Genome Atlas. |
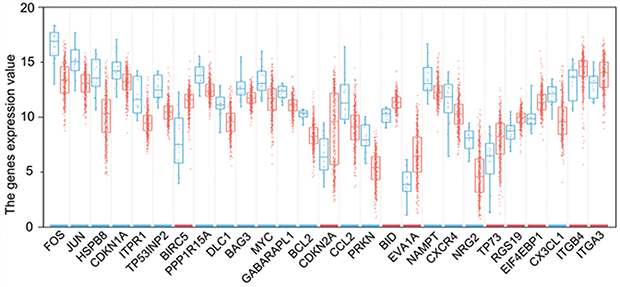 | Figure 2 The expression patterns of 27 autophagy-related genes (ARGs) in bladder cancer types and paired non-tumor samples. Each red dot represents a distinct tumor sample and blue a non-tumor sample. The red bar above the gene name shows a significantly high expression and the blue bar a low expression. |
Functional annotation of the differentially expressed ARGs
Functional enrichment analysis of the 27 differentially expressed ARGs offered that the biological understanding of these genes. The GO terms function and KEGG pathway enrichment of these genes were summarized in Table 1. According to the results of DAVID, we found that the top enriched GO terms for biological processes were: response to drug, response to gamma radiation, and apoptotic process; and for cellular components were: cytosol, protein complex, and mitochondrion. On the basis of molecular function, genes were mostly enriched in terms of transcription factor binding, ubiquitin protein ligase binding, and protein heterodimerization activity. The overview schematic of the analysis results is displayed in Figure 3. Besides, in the KEGG pathway enrichment analysis for the differentially expressed ARGs, these genes were shown to be notably associated with Pathways in cancer, colorectal cancer, Hepatitis B, ErbB signaling pathway, p53 signaling pathway, and so on. As shown in Figure 4A, the Z-score of enriched pathways less than zero indicated that most of the cancer pathways were more likely to be decreased. The heatmap of the relationship between ARGs and pathways was also displayed (Figure 4B).
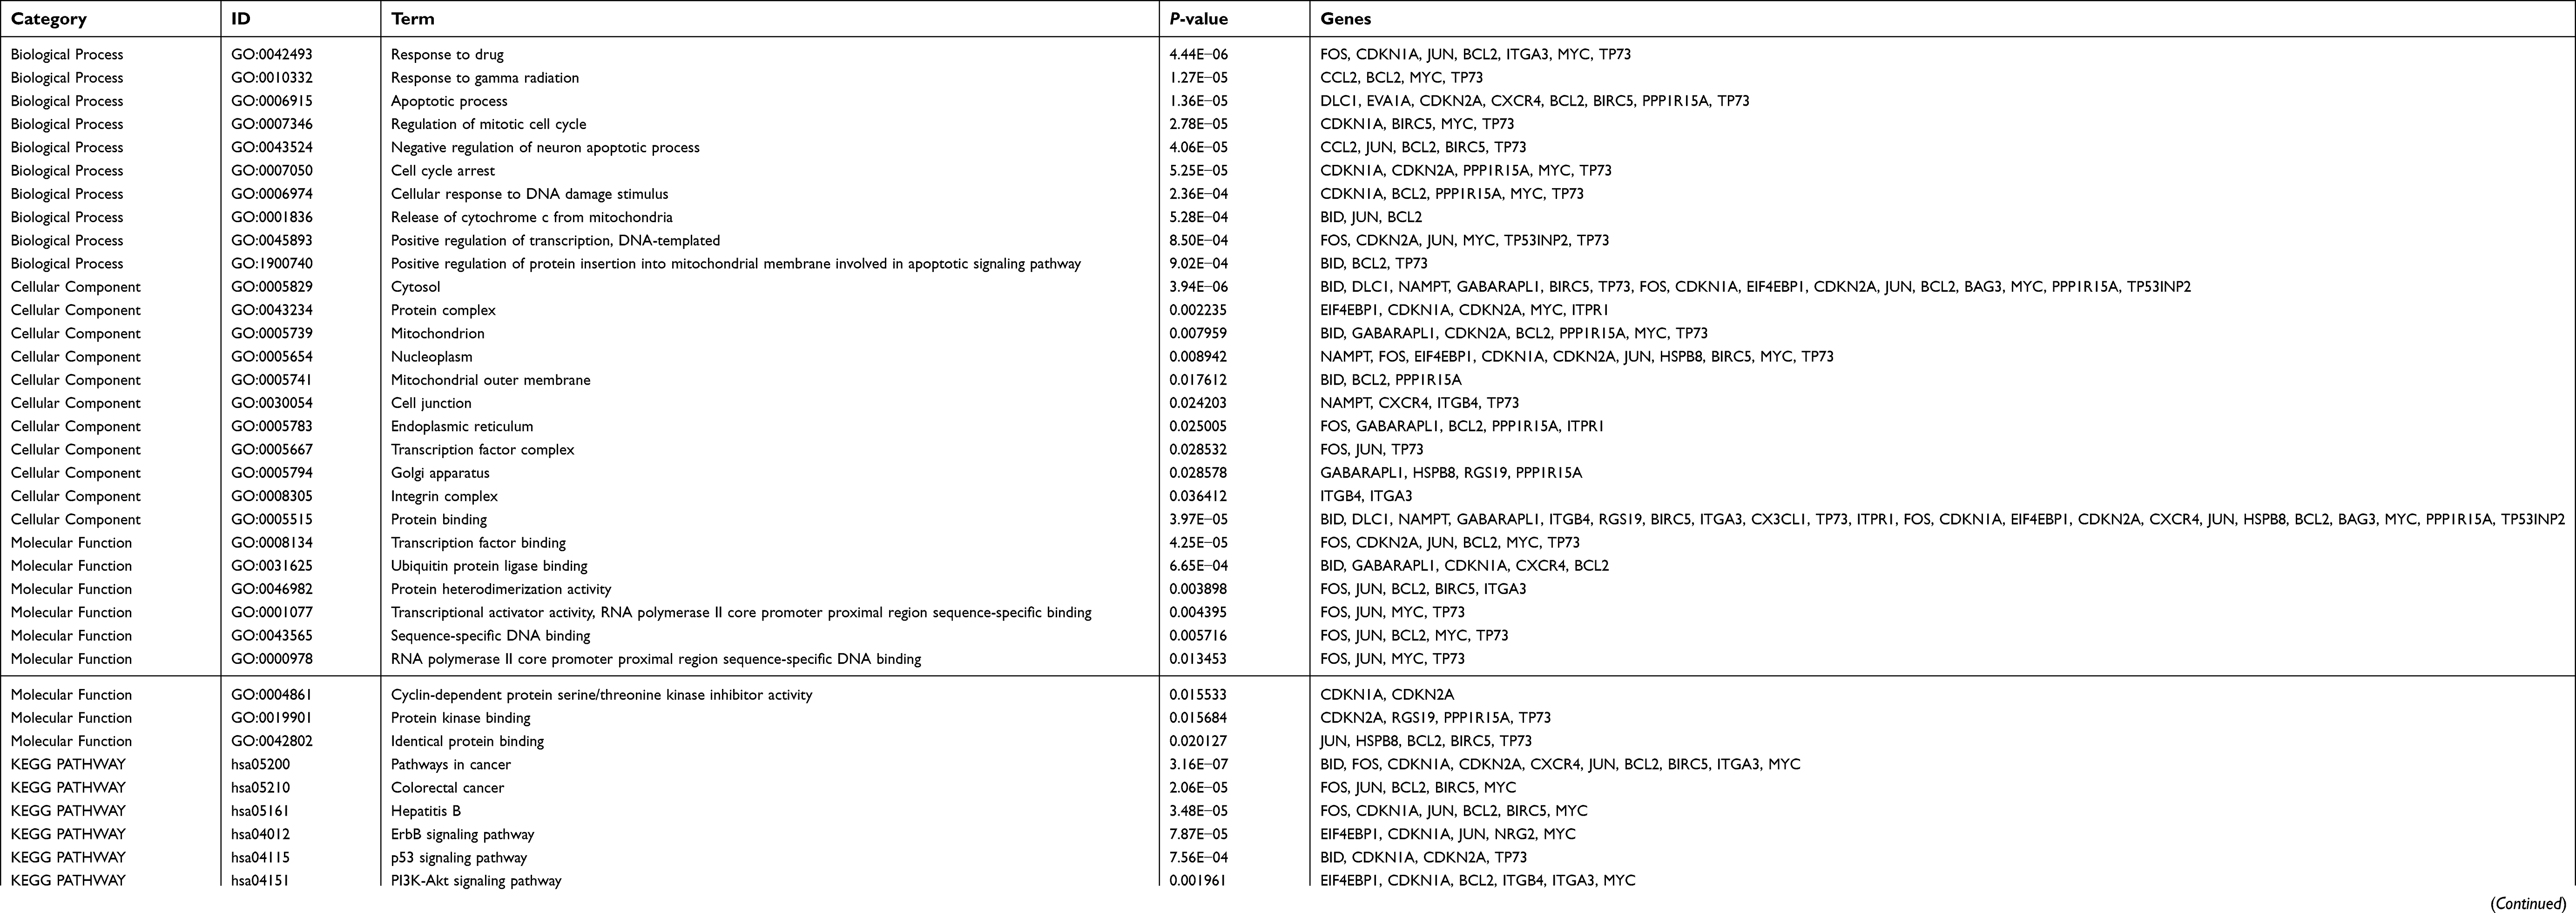 | Table 1 GO and KEGG analysis of differentially expressed autophagy-related genes |
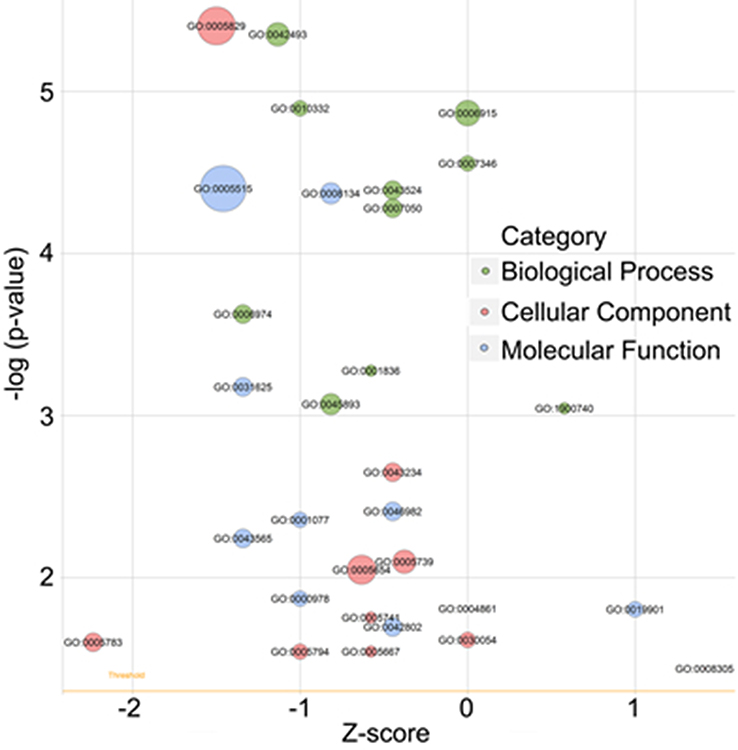 | Figure 3 The bubble plot of enriched gene ontology (GO) terms. The z-score is assigned to the x-axis, and the negative logarithm of the P-value to the y-axis, as in the barplot (the higher the more significant). The size of the displayed circles is proportional to the number of genes assigned to the term. Greed circles correspond to the biological process, red indicates the cellular component, and blue shows the molecular function category. |
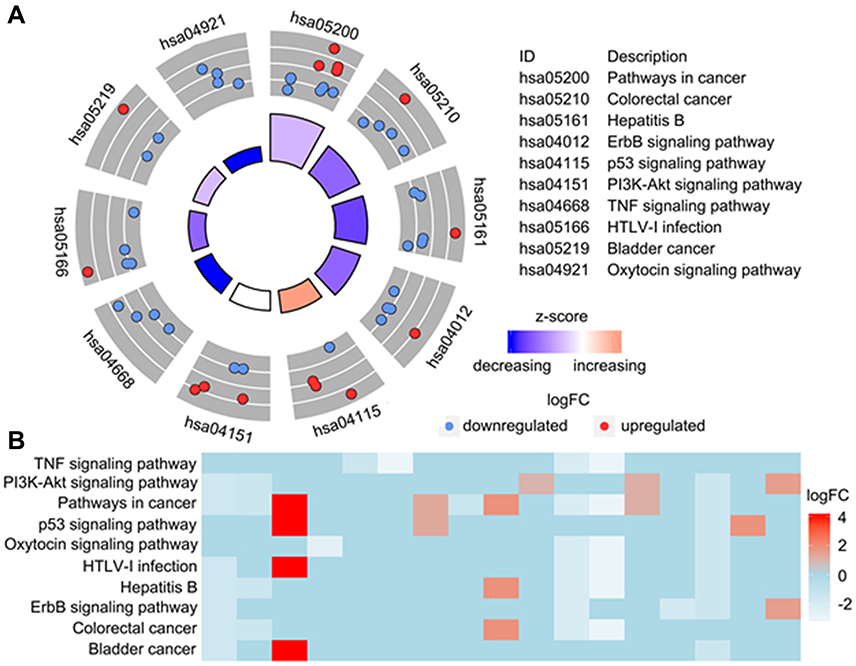 | Figure 4 Kyoto Encyclopedia of Genes and Genomes analysis of differentially expressed autophagy-related genes (ARGs). (A) The outer circle shows a scatter plot for each term of the logFC of the assigned genes. Red circles display up-regulation, and blue ones down-regulation. (B) The heatmap of the relationship between ARGs and pathways. The color of each block depends on the logFC values. |
Identification of prognostic ARGs
The relationships between the expression profiles of 27 differentially expressed ARGs and OS were assessed based on the data obtained from TCGA, resulting in four prognosis-related ARGs. In order to improve the robustness, four prognosis-related ARGs (JUN, MYC, ITGA3, and NAMPT) were selected for further multivariate Cox regression model by SPSS 24.0 (Table 2). However, the gene of NAMPT showed no significant prognostic value with P>0.05. Finally, three genes including JUN, MYC, and ITGA3 were identified to develop the PI model (Table 2). The results from K-M analysis indicated that the up-regulation of JUN was strongly correlated with the inferior OS of BC patients (HR=1.925, 95% CI=1.325–2.798, P<0.001; Figure 5A). Also, MYC overexpression lead to worse OS (HR=1.931, 95% CI=1.426–2.614, P<0.001; Figure 5C). On the contrary, up-regulated ITGA3 indicated BC patients has a longer survival time (HR=0.659, 95% CI=0.487–0.893, P=0.007; Figure 5E). According to the median value of the three genes to group, the same trend was obtained (Figures 5B, D, and F).
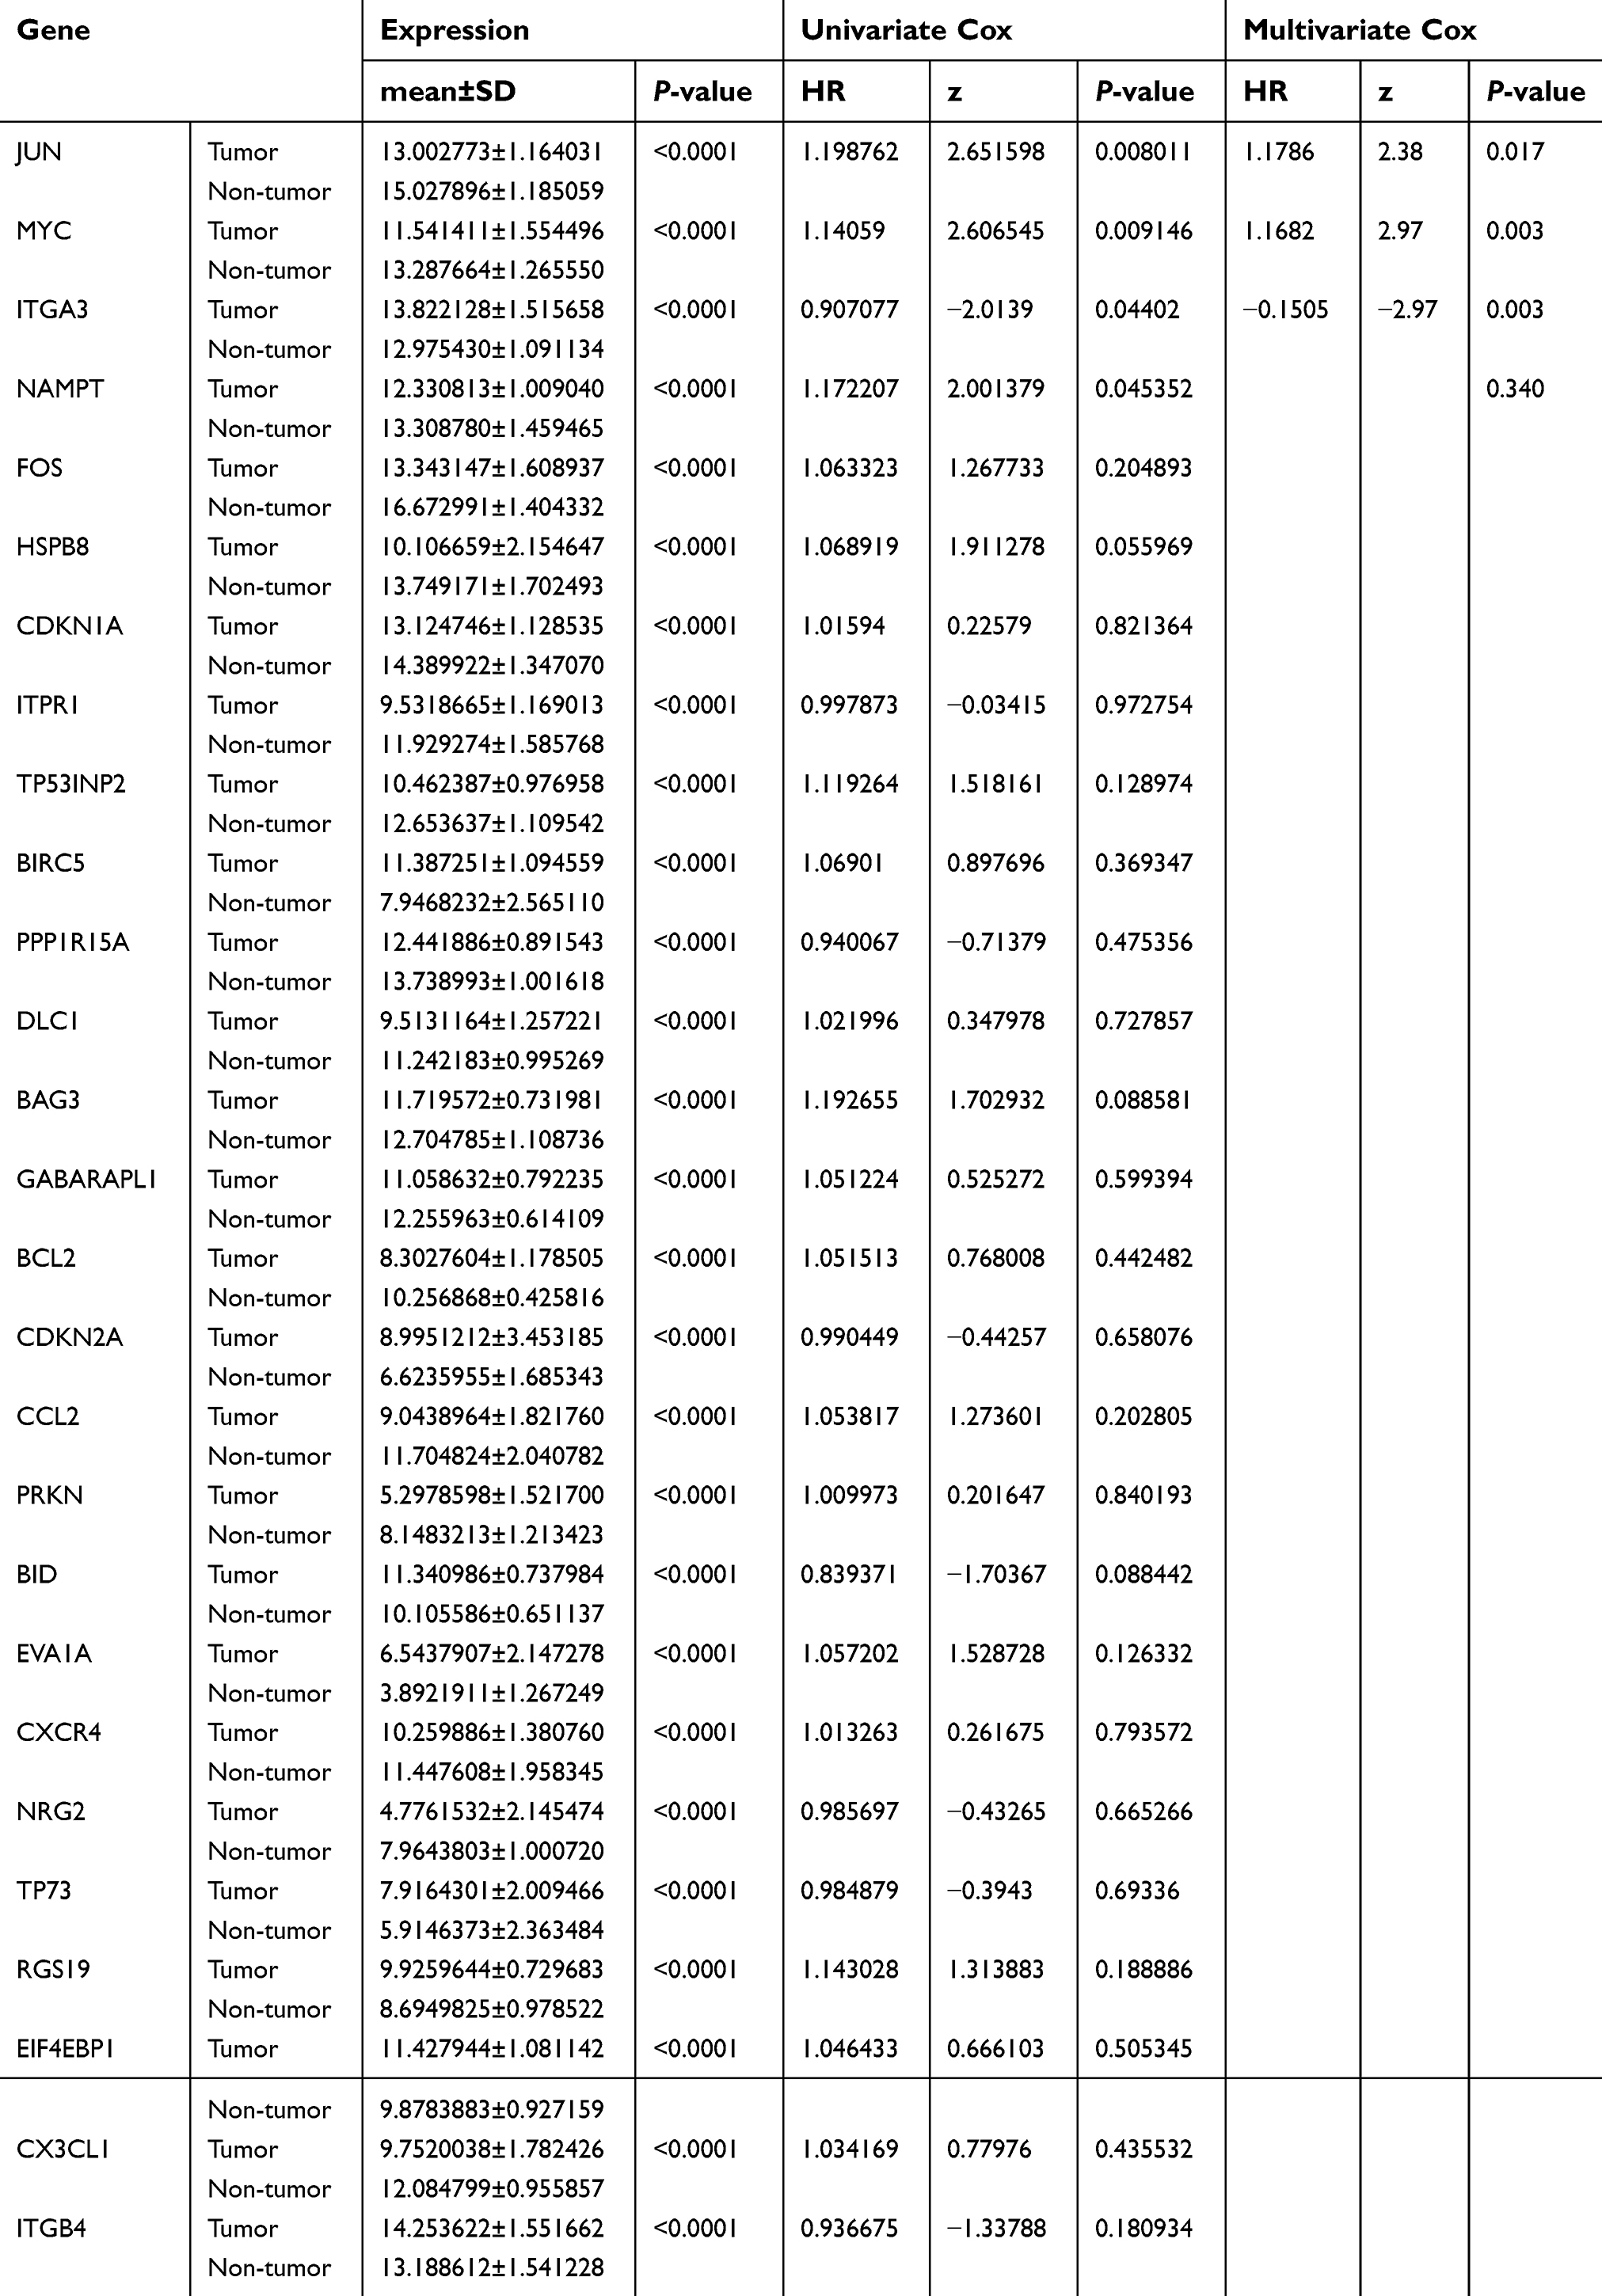 | Table 2 Expression and Cox regression analysis data of the prognosis-related ARGs in bladder cancer by TCGA |
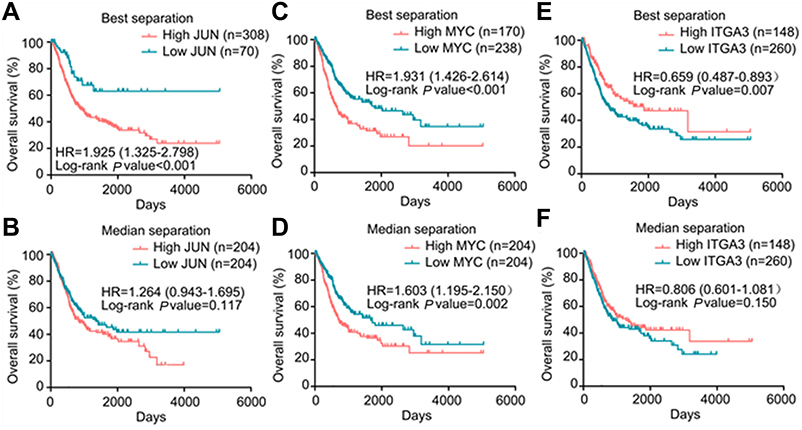 | Figure 5 The correlation between three genes included in prognostic signature and bladder cancer patients’ survival. Kaplan–Meier plots summarize results from analysis of correlation between (A) JUN expression level and patient survival, using best separation, (B) JUN expression level and patient survival, using median separation, (C) MYC expression level and patient survival, using best separation, (D) MYC expression level and patient survival, using median separation, (E) ITGA3 expression level and patient survival, using best separation, (F) ITGA3 expression level and patient survival, using median separation. |
The correlations between expression level of the three genes and clinicopathological parameters in BC are summarized in Table 3. We observed significant correlations between JUN overexpression and tumor subtype of non-Papillary (P<0.001), high histological grade (P=0.033), advanced pathologic stage (P<0.001), and advanced pathological T stage (P=0.002). Elevated MYC was closely linked with tumor subtype of non-Papillary (P=0.001) and high histological grade (P=0.005). High expression of ITGA3 occurred in low histological grade (P<0.001), early pathological stage (P=0.033), early pathological T stage (P=0.008), and no lymph node metastasis (P=0.016).
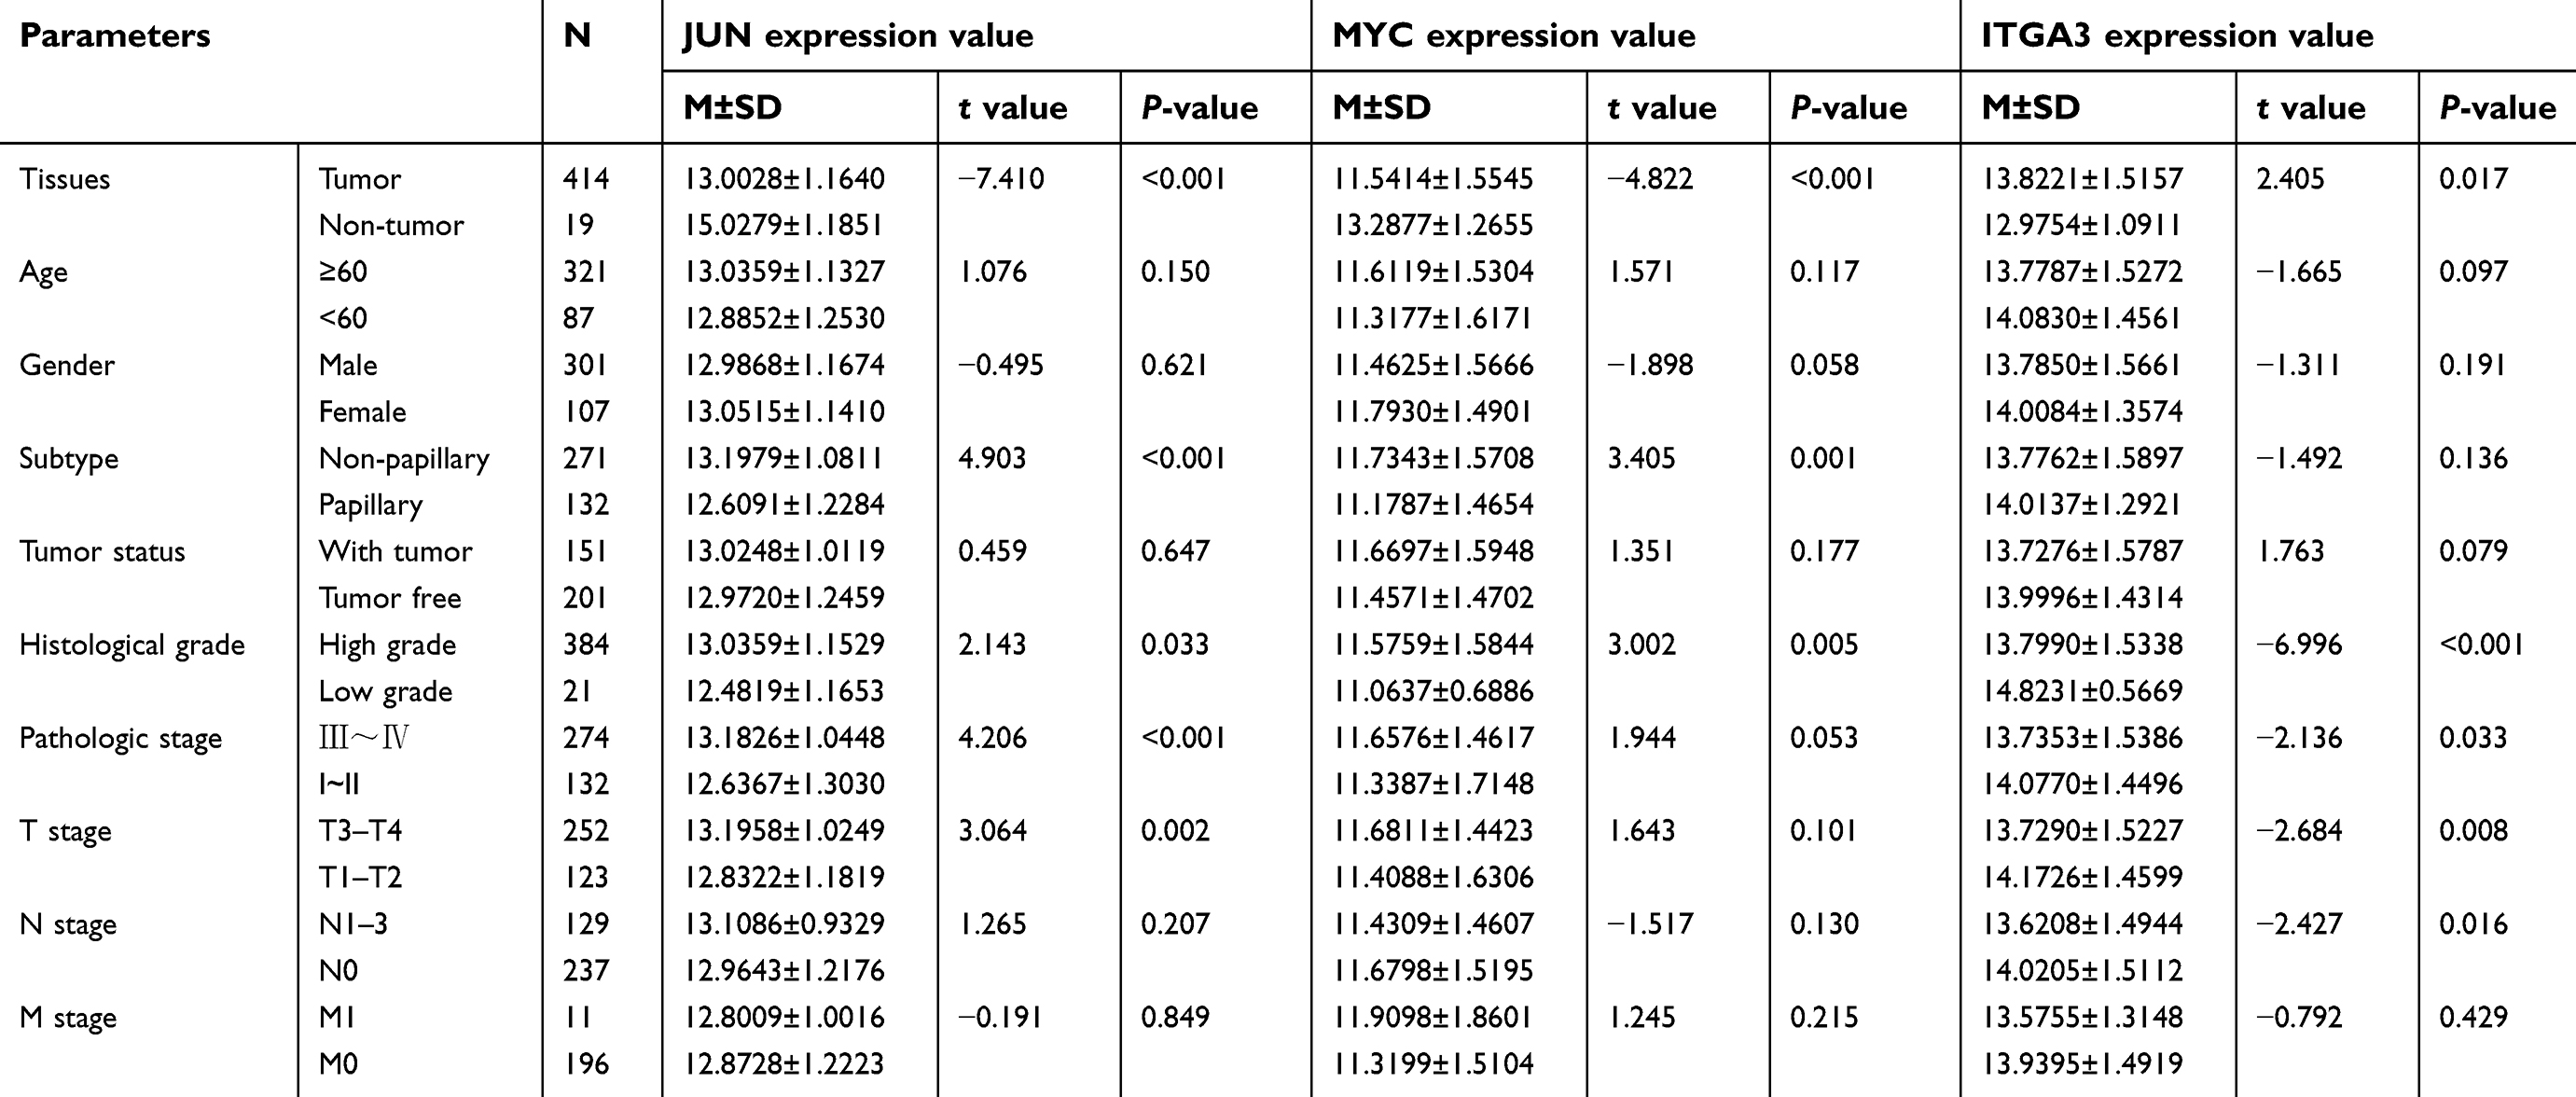 | Table 3 Relationships between three key prognostic genes expression and clinical parameters in bladder cancer by TCGA |
Construction and definition of the PI
The formula of PI is as follows: PI=(0.1643 × expression value of JUN)+(0.1555 × expression value of MYC)+(−0.1505 × expression value of ITGA3). It is noticed that the coefficient of ITGA3 is negative, indicating that the expression of JUN and MYC were negatively related with the survival time of BC patients, while the JUN was positively related with OS. Based on the median expression value of PI, the BC patients were stratified into high- and low-risk groups. We also calculated the expression levels of the three prognostic genes between high- and low-risk groups. Remarkably higher expression was noted for JUN and MYC in the high-risk groups, while lower expression was observed for ITGA3 in the high-risk groups (Figure 6). These findings also hint that JUN and MYC were risk factors, while ITGA3 was a protective factor for the progression of BC patients.
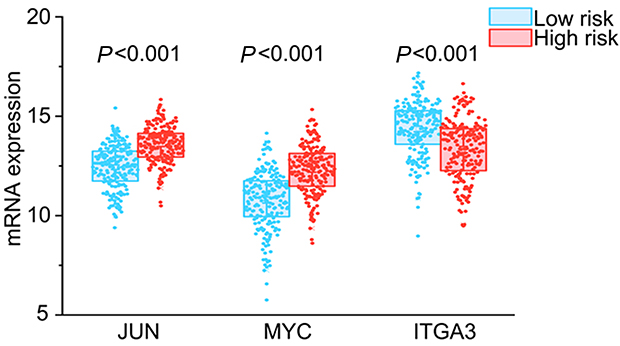 | Figure 6 Different expression of the three key genes between the high risk group and low risk group. |
In the meantime, the relationships between clinicopathological parameters and PI were also investigated. The results of independent sample t-tests showed that the PI values were higher in elder than in younger patients (P=0.009; Figure 7A), higher in non-papillary than in papillary bladder cancer (P<0.001; Figure 7C), higher in TIII–IV than in TI–II (P<0.001; Figure 7D), higher in histological stage III–IV than in I–II (P<0.001; Figure 7G), and higher in high grade than in low grade (P<0.001; Figure 7H). No difference of PI value was observed between male and female (P=0.494; Figure 7B), N1–3 stage and N0 stage (P=0.250; Figure 7E), or M1 and M0 stage (P=0.254; Figure 7F).
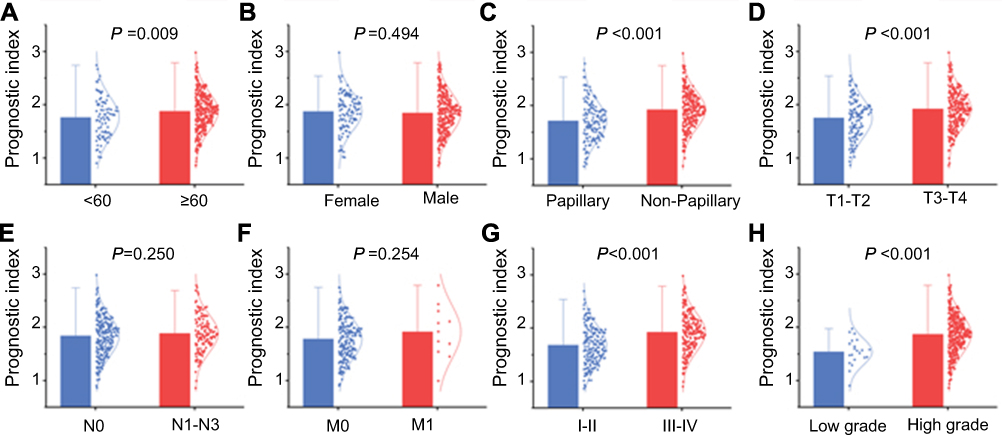 | Figure 7 The clinicopathological significance of prognostic index (PI) in bladder cancer. PI value in different (A) ages, (B) genders, (C) tumor subtypes, (D) pathological T stages, (E) pathological N stages, (F) pathological M stages, (G) pathological stages, (H) histological grades. |
To identify the performance of PI in predicting the clinical outcome of BC patients, the K-M plots were plotted to analyze the different survival time between the high- and low-risk groups. The results of K-M analysis indicated that the median OS for the high-expression group was 734 days; the median OS for the low-expression group was 1,423 days. Patients in the high-risk group suffered significantly worse survival than those in the low-risk group (HR=1.610, 95% CI=1.200–2.160, P=0.002, Figure 8A). Figures 8B–F show the PI distribution of patients in the training dataset, the number of patients in different risk groups, the OS of patients in the TCGA dataset, the number of censor patients, and the heatmap of the three genes expression profiles in the TCGA dataset. Furthermore, PI remained as an independent prognostic indicator for BC patients in multivariate analyses, after adjusting for clinicopathological features such as age, gender, tumor subtype, pathologic stage, and histological grade (HR=2.355, 95% CI=1.483–3.739, P<0.001, Table 4).
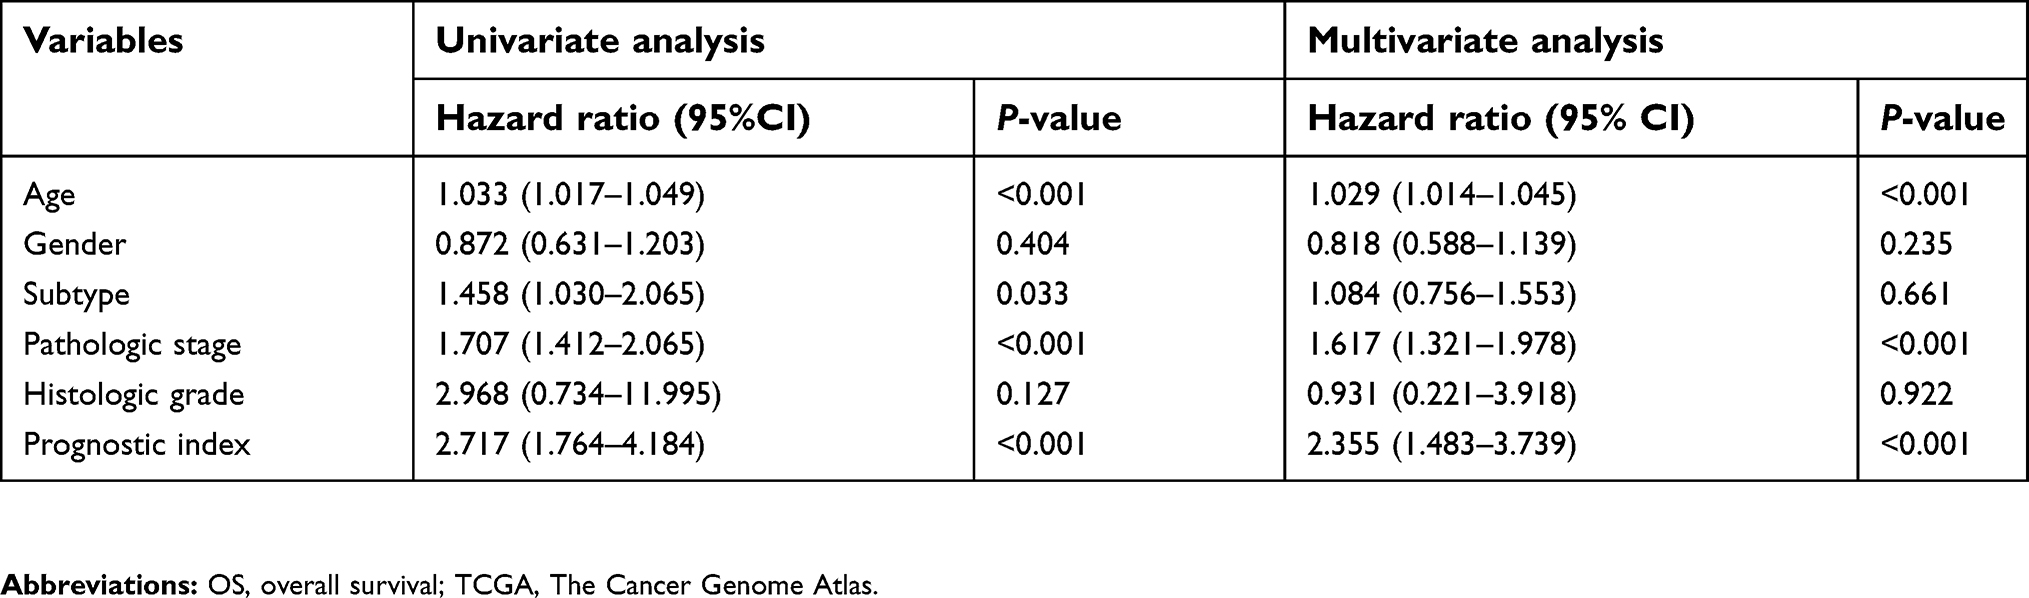 | Table 4 Univariate and multivariate analyses of OS in bladder cancer patients of TCGA |
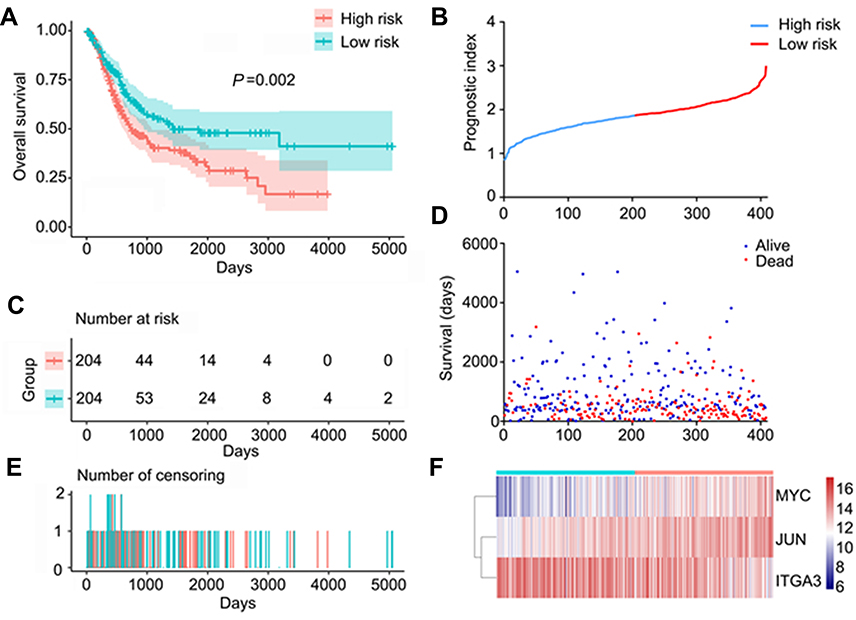 | Figure 8 Autophagy-related prognostic index (PI) of bladder cancer patients. (A) Kaplan–Meier plot represents that patients in the high-risk group had significantly shorter overall survival time than those in the low-risk group. (B) The PI distribution of patients in the training dataset. (C) The number of patients in different risk groups. (D) The overall survival of patients in the TCGA dataset. (E) The number of censor patients. (F) The heatmap of the three key genes expression profiles in the TCGA dataset.Abbreviations: TCGA, The Cancer Genome Atlas. |
Integrated prognostic signature by combining the PI with clinical parameters
Based on the multivariate Cox regression analysis with TCGA dataset, age, stage, and PI were suggested as independent prognostic factors with complementary value. To further improve accuracy of PI in predicting OS of BC patients, we integrated age, pathological stage, and PI to derive an ACPI as (0.028 × age)+(0.467 × stage)+(0.834 × PI score). Similarly, patients were divided into high- and low-risk groups based on the median value of ACPI. As expected, ACPI stratified BC patients into two groups with a significantly different prognosis (HR=2.669, 95% CI=1.986–3.587, P<0.001; Figure 9A). To evaluate how well the ACPI predicts the prognoses of BC patients, the time-dependent ROC curve analysis was carried out. The AUC for the ACPI was 0.689 (Figure 9B), demonstrating the competitive performance of the ACPI for survival prediction in the TCGA dataset. The prognostic value of ACPI was also validated by GSE13507 and GSE31684. Consistent with the findings based on the TCGA dataset, patients in the high-risk group had significantly shorter overall survival than those in the low-risk group based on GSE13507 (HR=7.389, 95% CI=3.645–14.980, P<0.001; Figure 9C), and the AUC for the ACPI was 0.864 (Figure 9D). A similar trend was observed in GSE31684 (HR=1.665, 95% CI=0.872–3.179, P=0.122; Figure 9E), and the AUC for the ACPI was 0.624 (Figure 9F).
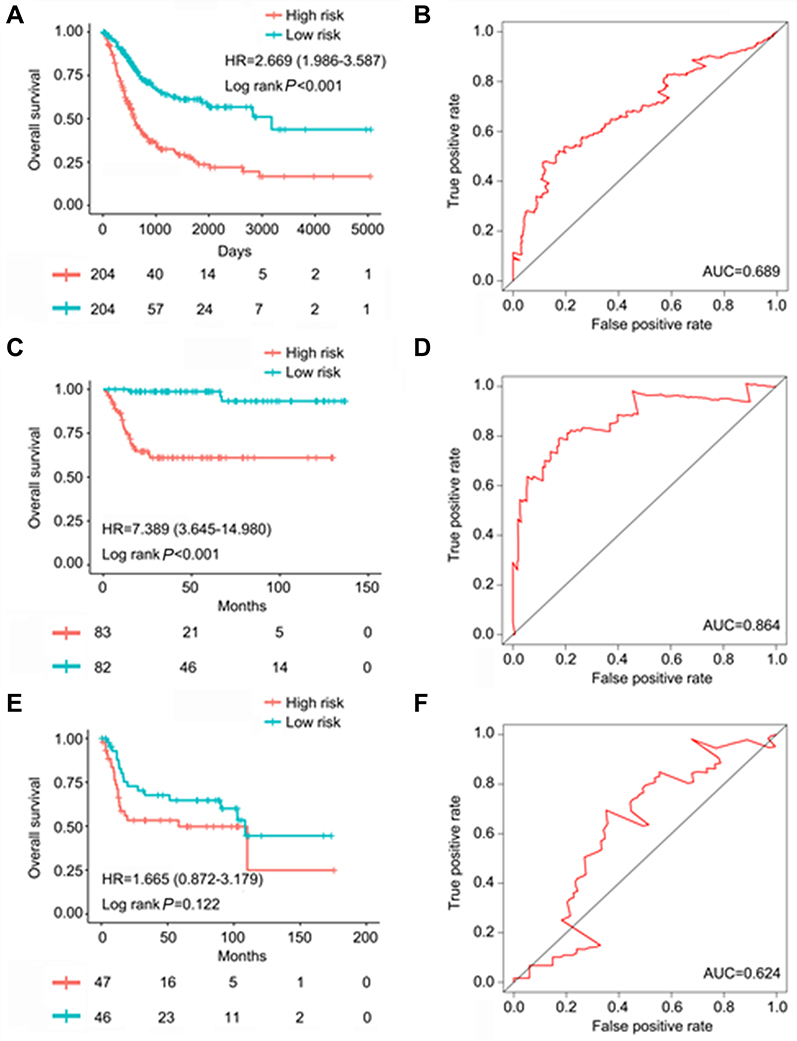 | Figure 9 The prognostic value of autophagy-clinical prognostic index (ACPI) of bladder cancer patients. (A) Kaplan–Meier (K–M) survival curve showing overall survival (OS) outcomes according to relative high-risk and low-risk patients based on The Cancer Genome Atlas (TCGA) database. (B) Time-dependent ROC curve analysis for survival prediction by the ACPI based on the TCGA database. (C) K–M survival curve showing OS outcomes according to relative high-risk and low-risk patients based on the GSE13507 dataset. (D) Time-dependent ROC curve analysis for survival prediction by the ACPI based on the GSE13507 dataset. (E) K–M survival curve showing OS outcomes according to relative high-risk and low-risk patients based on the GSE31684 dataset. (F) Time-dependent ROC curve analysis for survival prediction by the ACPI based on the GSE31684 dataset. |
Meta-analysis
A total of 19 eligible studies were involved, including Blaveri Bladder 2, Modlich Bladder, Sanchez Carbayo Bladder 2, TCGA, GSE3167, GSE13507, GSE76211, GSE2109, GSE7476, GSE30522, GSE31189, GSE37815, GSE52519, GSE65635, GSE37817, GSE100926, GSE24152, GSE19915 (GPL3883 and GPL5186), and GSE40355. The results of meta-analysis and the diagnostic tests of meta-analysis were also updated. The expression of JUN and MYC in BC tissues were lower than that in non-BC tissues (I2JUN=91.6%, PJUN<0.001; I2MYC=90.3%, PMYC<0.001) (Figures 10A and C), while the expression of ITGA3 was opposite (I2ITGA3=92.7%, PITGA3<0.001) (Figure 10E), the same expression tendence with that in TCGA. In addition, the diagnostic tests of meta-analysis showed that the AUC of the sROC of JUN, MYC, and ITGA3 were 0.91, 0.87, and 0.74, respectively (Figures 10B, D, and F). Among the 19 studies involved in meta-analysis, only two microarrays (GSE37137 and GSE35824) and TCGA contained gene expression data from non-muscle invasive bladder cancer (NMIBC) and muscle invasive bladder cancer (MIBC) tissues. Then we performed a meta-analysis to evaluate the expression of JUN, MYC, and ITGA3 between NMIBC and MIBC tissues. The expression of JUN and ITGA3 in MIBC tissues were higher than that in NMIBC tissues (I2JUN=72.1%, PJUN=0.028; I2ITGA3=92.8%, PITGA3<0.001), while the expression of MYC was opposite (I2MYC=67.2%, PITGA3=0.047) (data not shown). The heterogeneity of meta-analysis was significant due to the small size of cases involved in the microarrays and TCGA.
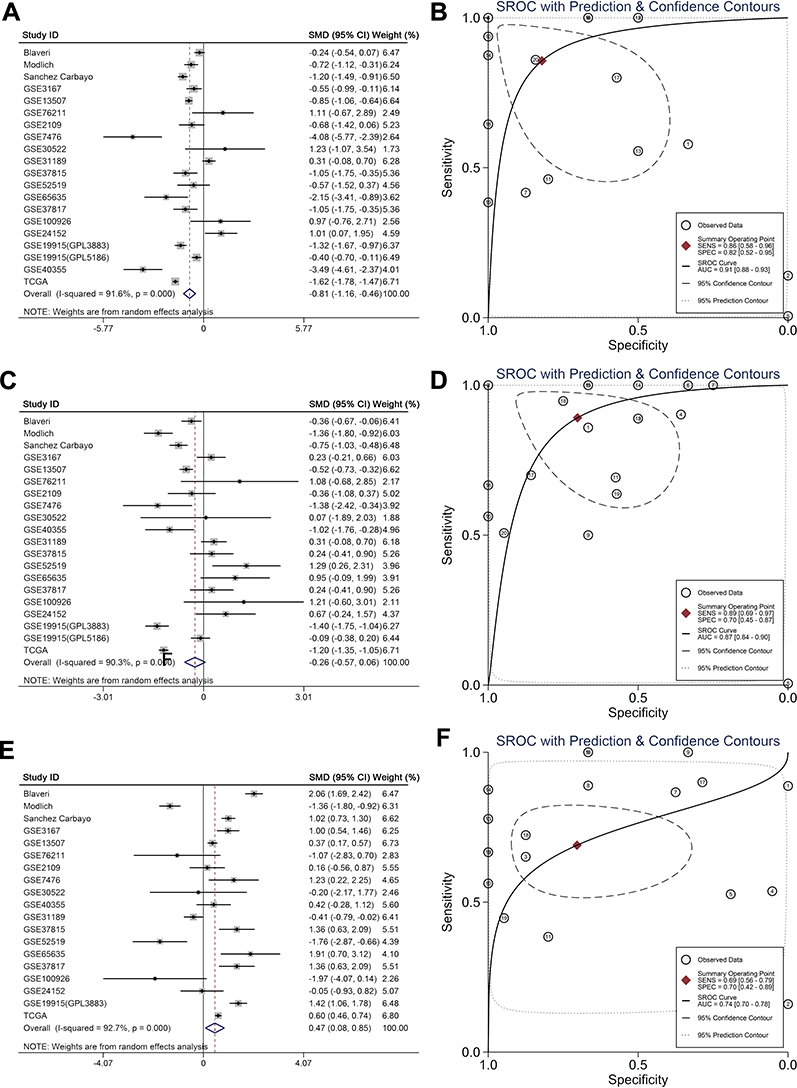 | Figure 10 Meta-analysis. (A) Forest plot of JUN expression in bladder cancer with six datasets. (B) sROC curve for JUN expression in bladder cancer with six datasets. (C) Forest plot of MYC expression in bladder cancer with six datasets. (D) sROC curve for MYC expression in bladder cancer with six datasets. (E) Forest plot of ITGA3 expression in bladder cancer with six datasets. (F) SROC curve for ITGA3 expression in bladder cancer with six datasets. |
Discussion
BC is a major lethal malignancy worldwide. The stalled advance in molecular targeted therapy and no effective molecular biomarkers for BC prognosis monitoring warrants a better understanding of the molecular mechanisms that underlie this condition.19,20 Exploration of autophagy mechanism opens new perspectives for BC.21–25 However, most research only focused on autophagy via studying a signal gene. To capture the genes necessary for BC from the perspective of autophagy, we screened ARGs and identified three key prognostic ARGs, all of which may offer additional potential therapeutic targets. We further leveraged the complementary value of molecular and clinical characteristics and showed that combining both could provide a more accurate estimation of overall survival in BC. This integrated study of multiple databases contributed to our novel understanding of BC biology and delineated potential therapeutic intervention possibilities.
Given great advances in high-throughput sequencing recently, several large-scale databases emerged, such as TCGA and GEO, which have provided effective measures for selecting gene signatures. In the current study, we deeply mined the expression profiles of ARGs from TCGA and aimed to search molecular biomarkers for detecting the prognosis of BC patients. We first screened 27 differentially expressed ARGs between BC and non-tumor tissues. Considering these genes may be depth involved in the initiation of BC, we performed GO and KEGG analysis of these genes. Interestingly, functional analysis revealed that the most significant KEGG pathway (pathways in cancer) of these enriched genes was decreased. Based on the results, we hypothesized that autophagy may act as the tumor suppressor in the process of tumor initiation. Autophagy caused great concern; of particular interest was its multi-faceted character in cancers. Initially, the tumor-suppressive role of autophagy in cancers was proposed for autophagy inhibited by activation of mutations in oncogenes or inactivation of tumor suppressor genes.26 Furthermore, systemic mosaic deletion of autophagy genes in the setting of certain mouse models can result in the initiation of neoplasia.27 Interestingly, autophagy turns to the guardian of malignant tumor cells after tumors are established.28 However, the role change of autophagy is not immutable and varies in different tumors.29,30
The result of univariate survival analysis revealed that four ARGs were associated with OS in the TCGA database. Further multivariate survival analysis helped us determine three key prognostic ARGs (JUN, MYC, ITGA3) to develop the PI, which could be an independent prognostic indicator for BC patients. JUN encodes c-Jun, which is the first discovered oncogenic transcription factor,31 involving diverse cellular processes, such as cell cycle progression,32 anti-apoptotic, and tumorigenesis. Previous studies have suggested that up-regulation of c-Jun proteins was predictive of inferior OS for BC patients.33 However, well-informed insights of the functional mechanism of JUN in BC only has little coverage. The MYC protein is a multifunctional, nuclear phosphoprotein, and shows its evil face in the progress of a variety of tumors, including BC.34–37 Massari et al38 also found that c-Myc could exert excellent ability in stratifying patients with muscle invasive bladder urothelial carcinoma into high-risk and low-risk groups significantly for survival. In addition, several studies found that c-Myc knockdown could inhibit proliferation, migration, and invasion of bladder cancer cells.37 ITGA3 belongs to a family of the integrins, which triggers cell survival, proliferation, or migration events.39 The present study demonstrated that JUN and MYC overexpression were significantly associated with advanced pathological stage and high grade. Additionally, up-regulation of JUN and MYC indicated inferior OS. The opposite pattern was observed in the relationships between ITGA3 and clinical significance. Hence, we speculated that JUN and MYC may function as major driving forces of tumor progression, while ITGA3 exerted its tumor suppressor role.
To date, some prognostic signature of cancers based on expression profiles were proposed by the aid of advances in a large-scale public database. For example, Bao et al40 analyzed the RNA-Seq data of 234 BC patients from TCGA and managed to obtain a four-lncRNA signature, which exerted a prognosis predicting value. Zhong et al41 also proposed a prognostic signature with six genes as a potential survival prediction marker for ER-positive breast cancer patients. However, these studies only focused on molecular biomarkers and overlooked the traditional clinical parameters. We attached much weight on molecular mechanisms and clinical perspective at once. Thus, the prognostic signature is promising to be converted into clinical application. However, a limitation of this study is its retrospective nature. Due to the lack of enough cases, we failed to evaluate the expression of JUN, MYC, and ITGA3 between NMIBC and MIBC tissues. In addition, other potential prognostic variables correlated to OS in BC, such as body mass index (BMI), residual tumor at tur, neutrophil-to-lymphocyte ratio (NLR), and lymphovascular invasion (LVI), should be investigated. Last, the changes of before and after the treatment, such as chemotherapy or Bacillus Calmette-Guérin (BCG) refractory, should also be considered to find the potential markers for predicting the treatment effect and prognosis.
Conclusion
In conclusion, based on the comprehensive analyses with ARGs expression profiles and corresponding clinical features, three prognostic ARGs (JUN, MYC, and ITGA3) were identified. The genes identified in autophagy pathways also provide new possibilities for bladder cancer therapeutic intervention. By combining molecular signature and clinical characteristics, we constructed a novel risk score model ACPI which can robustly estimate BC patients’ survival. Also, the ACPI risk score model was validated by large sample size. However, further prospective experiments can be expected to test the clinical utility and aid in the search for optimal personalized targeted therapies.
Data sharing statement
The RNA-seq data and clinical information of BC analyzed in this study can be downloaded from The Cancer Genome Atlas (TCGA). The microarray data of GSE13507, GSE31684, GSE76211, GSE2109, GSE7476, GSE30522, GSE31189, GSE37815, GSE52519, GSE65635, GSE37817, GSE100926, GSE24152, GSE19915 (GPL3883 and GPL5186), and GSE40355 can be acquired from the Gene Expression Omnibus (GEO) database.
Acknowledgments
The authors thank The Cancer Genome Atlas (TCGA), the Gene Expression Omnibus (GEO), The Human Autophagy Database (HADb,
Author contributions
All authors contributed to data analysis, drafting and revising the article, gave final approval of the version to be published, and agree to be accountable for all aspects of the work.
Disclosure
The authors report no conflicts of interest in this work.
References
1. Towers CG, Thorburn A. Therapeutic targeting of autophagy. EBioMedicine. 2016;14:15–23. doi:10.1016/j.ebiom.2016.10.034
2. Gafar AA, Draz HM, Goldberg AA, et al. Lithocholic acid induces endoplasmic reticulum stress, autophagy and mitochondrial dysfunction in human prostate cancer cells. PeerJ. 2016;4:e2445. doi:10.7717/peerj.2445
3. Cadwell K. Crosstalk between autophagy and inflammatory signalling pathways: balancing defence and homeostasis. Nat Rev Immunol. 2016;16(11):661–675. doi:10.1038/nri.2016.100
4. Zhong Z, Sanchez-Lopez E, Karin M. Autophagy, inflammation, and immunity: a troika governing cancer and its treatment. Cell. 2016;166(2):288–298. doi:10.1016/j.cell.2016.05.051
5. Vidal RL, Hetz C. Crosstalk between the UPR and autophagy pathway contributes to handling cellular stress in neurodegenerative disease. Autophagy. 2012;8(6):970–972. doi:10.4161/auto.20139
6. Mowers EE, Sharifi MN, Macleod KF. Autophagy in cancer metastasis. Oncogene. 2017;36(12):1619–1630. doi:10.1038/onc.2016.333
7. Jawhari S, Ratinaud M-H, Verdier M. Glioblastoma, hypoxia and autophagy: a survival-prone ‘ménage-à-trois’. Cell Death Dis. 2016;7(10):e2434. doi:10.1038/cddis.2016.318
8. Liu L, Liao J-Z, He X-X, Li P-Y. The role of autophagy in hepatocellular carcinoma: friend or foe. Oncotarget. 2017;8(34):57707–57722. doi:10.18632/oncotarget.17202
9. Wu H, Lin J, Liu P, et al. Is the autophagy a friend or foe in the silver nanoparticles associated radiotherapy for glioma? Biomaterials. 2015;62:47–57. doi:10.1016/j.biomaterials.2015.05.033
10. Hu L, Wang H, Huang L, Zhao Y, Wang J. Crosstalk between autophagy and intracellular radiation response (review). Int J Oncol. 2016;49(6):2217–2226. doi:10.3892/ijo.2016.3719
11. Torre LA, Bray F, Siegel RL, Ferlay J, Lortet-Tieulent J, Jemal A. Global cancer statistics, 2012. CA Cancer J Clin. 2015;65(2):87–108. doi:10.3322/caac.21262
12. Siegel RL, Miller KD, Jemal A. Cancer statistics, 2017. CA Cancer J Clin. 2017;67(1):7–30. doi:10.3322/caac.21387
13. Kou B, Liu W, Xu X, et al. Autophagy induction enhances tetrandrine-induced apoptosis via the AMPK/mTOR pathway in human bladder cancer cells. Oncol Rep. 2017;38:3137–3143. doi:10.3892/or.2017.5988
14. Song Y, Zhang P, Sun Y, et al. AMPK activation-dependent autophagy compromises oleanolic acid-induced cytotoxicity in human bladder cancer cells. Oncotarget. 2017;8(40):67942–67954. doi:10.18632/oncotarget.18980
15. Fan B, Zhang X, Ma Y, Zhang A. Fangchinoline induces apoptosis, autophagy and energetic impairment in bladder cancer. Cell Physiol Biochem. 2017;43(3):1003–1011. doi:10.1159/000481698
16. Wang C-Y, Xu Z-B, Wang J-P, et al. Rb deficiency accelerates progression of carcinoma of the urinary bladder in vivo and in vitro through inhibiting autophagy and apoptosis. Int J Oncol. 2017;50(4):1221–1232. doi:10.3892/ijo.2017.3889
17. Qi P, He Z, Zhang L, Fan Y, Wang Z. Rottlerin-induced autophagy leads to apoptosis in bladder cancer cells. Oncol Lett. 2016;12(6):4577–4583. doi:10.3892/ol.2016.5255
18. Su Z, Yang Z, Xu Y, Chen Y, Yu Q. MicroRNAs in apoptosis, autophagy and necroptosis. Oncotarget. 2015;6(11):8474–8490. doi:10.18632/oncotarget.3523
19. Knowles MA, Hurst CD. Molecular biology of bladder cancer: new insights into pathogenesis and clinical diversity. Nat Rev Cancer. 2015;15(1):25–41. doi:10.1038/nrc3817
20. Spiess PE, Agarwal N, Bangs R, et al. Bladder cancer, version 5.2017, NCCN clinical practice guidelines in oncology. J Natl Compr Canc Netw. 2017;15(10):1240–1267. doi:10.6004/jnccn.2017.0156
21. Yu G, Jia Z, Dou Z. miR-24-3p regulates bladder cancer cell proliferation, migration, invasion and autophagy by targeting DEDD. Oncol Rep. 2017;37(2):1123–1131. doi:10.3892/or.2016.5326
22. Tai H-C, Chung S-D, Chien C-T, Yu H-J. Sulforaphane improves ischemia-induced detrusor overactivity by downregulating the enhancement of associated endoplasmic reticulum stress, autophagy, and apoptosis in rat bladder. Sci Rep. 2016;6:36110. doi:10.1038/srep36110
23. Pan X-W, Li L, Huang Y, et al. Icaritin acts synergistically with epirubicin to suppress bladder cancer growth through inhibition of autophagy. Oncol Rep. 2016;35(1):334–342. doi:10.3892/or.2015.4335
24. Zhao J, Song Q, Wang L, et al. Detrusor myocyte autophagy protects the bladder function via inhibiting the inflammation in cyclophosphamide-induced cystitis in rats. PLoS One. 2015;10(4):e0122597. doi:10.1371/journal.pone.0122597
25. Mani J, Vallo S, Rakel S, et al. Chemoresistance is associated with increased cytoprotective autophagy and diminished apoptosis in bladder cancer cells treated with the BH3 mimetic (-)-Gossypol (AT-101). BMC Cancer. 2015;15:224. doi:10.1186/s12885-015-1584-3
26. Wang RC, Wei Y, An Z, et al. Akt-mediated regulation of autophagy and tumorigenesis through Beclin 1 phosphorylation. Science. 2012;338(6109):956–959. doi:10.1126/science.1225967
27. Kimmelman AC, White E. Autophagy and tumor metabolism. Cell Metab. 2017;25(5):1037–1043. doi:10.1016/j.cmet.2017.04.004
28. Moscat J, Karin M, Diaz-Meco MT. p62 in cancer: signaling adaptor beyond autophagy. Cell. 2016;167(3):606–609. doi:10.1016/j.cell.2016.09.030
29. Bono S, Lulli M, D’Agostino VG, et al. Different BCR/Abl protein suppression patterns as a converging trait of chronic myeloid leukemia cell adaptation to energy restriction. Oncotarget. 2016;7(51):84810–84825. doi:10.18632/oncotarget.13319
30. Simioni C, Ultimo S, Martelli AM, et al. Synergistic effects of selective inhibitors targeting the PI3K/AKT/mTOR pathway or NUP214-ABL1 fusion protein in human acute lymphoblastic leukemia. Oncotarget. 2016;7(48):79842–79853. doi:10.18632/oncotarget.13035
31. Vogt PK. Fortuitous convergences: the beginnings of JUN. Nat Rev Cancer. 2002;2(6):465–469. doi:10.1038/nrc818
32. Zhang A, Lakshmanan J, Motameni A, et al. MicroRNA-203 suppresses proliferation in liver cancer associated with PIK3CA, p38 MAPK, c-Jun, and GSK3 signaling. Mol Cell Biochem. 2018;441(1–2):89–98. doi:10.1007/s11010-017-3176-9
33. Huhe M, Liu S, Zhang Y, Zhang Z, Chen Z. Expression levels of transcription factors c-Fos and c-Jun and transmembrane protein HAb18G/CD147 in urothelial carcinoma of the bladder. Mol Med Rep. 2017;15(5):2991–3000. doi:10.3892/mmr.2017.6411
34. Chen B-J, Wu Y-L, Tanaka Y, Zhang W. Small molecules targeting c-Myc oncogene: promising anti-cancer therapeutics. Int J Biol Sci. 2014;10(10):1084–1096. doi:10.7150/ijbs.10190
35. Korac P, Dotlic S, Matulic M, Zajc Petranović M, Dominis M. Role of MYC in B cell lymphomagenesis. Genes (Basel). 2017;8(4):115. doi:10.3390/genes8040115
36. Ye W, Chen C, Gao Y, et al. Overexpression of SLC34A2 is an independent prognostic indicator in bladder cancer and its depletion suppresses tumor growth via decreasing c-Myc expression and transcriptional activity. Cell Death Dis. 2017;8(2):e2581. doi:10.1038/cddis.2017.518
37. Wang J, Zhao X, Shi J, et al. miR-451 suppresses bladder cancer cell migration and invasion via directly targeting c-Myc. Oncol Rep. 2016;36(4):2049–2058. doi:10.3892/or.2016.5040
38. Massari F, Bria E, Ciccarese C, et al. Prognostic value of beta-tubulin-3 and c-Myc in muscle invasive urothelial carcinoma of the bladder. PLoS One. 2015;10(6):e0127908. doi:10.1371/journal.pone.0127908
39. Pinon P, Wehrle-Haller B. Integrins: versatile receptors controlling melanocyte adhesion, migration and proliferation. Pigment Cell Melanoma Res. 2011;24(2):282–294. doi:10.1111/j.1755-148X.2010.00806.x
40. Bao Z, Zhang W, Dong D. A potential prognostic lncRNA signature for predicting survival in patients with bladder urothelial carcinoma. Oncotarget. 2017;8(6):10485–10497. doi:10.18632/oncotarget.14441
41. Zhong L, Lou G, Zhou X, Qin Y, Liu L, Jiang W. A six-long non-coding RNAs signature as a potential prognostic marker for survival prediction of ER-positive breast cancer patients. Oncotarget. 2017;8(40):67861–67870. doi:10.18632/oncotarget.18919
 © 2019 The Author(s). This work is published and licensed by Dove Medical Press Limited. The
full terms of this license are available at https://www.dovepress.com/terms
and incorporate the Creative Commons Attribution
- Non Commercial (unported, 3.0) License.
By accessing the work you hereby accept the Terms. Non-commercial uses of the work are permitted
without any further permission from Dove Medical Press Limited, provided the work is properly
attributed. For permission for commercial use of this work, please see paragraphs 4.2 and 5 of our Terms.
© 2019 The Author(s). This work is published and licensed by Dove Medical Press Limited. The
full terms of this license are available at https://www.dovepress.com/terms
and incorporate the Creative Commons Attribution
- Non Commercial (unported, 3.0) License.
By accessing the work you hereby accept the Terms. Non-commercial uses of the work are permitted
without any further permission from Dove Medical Press Limited, provided the work is properly
attributed. For permission for commercial use of this work, please see paragraphs 4.2 and 5 of our Terms.