Back to Journals » OncoTargets and Therapy » Volume 13
Identification and Clinical Validation of 4-lncRNA Signature for Predicting Survival in Head and Neck Squamous Cell Carcinoma
Received 14 April 2020
Accepted for publication 26 June 2020
Published 21 August 2020 Volume 2020:13 Pages 8395—8411
DOI https://doi.org/10.2147/OTT.S257200
Checked for plagiarism Yes
Review by Single anonymous peer review
Peer reviewer comments 3
Editor who approved publication: Dr Federico Perche
Yanping Ji,1 Yu Xue2
1Department of Pathology, Eye, Ear, Nose and Throat Hospital, Fudan University, Shanghai, People’s Republic of China; 2Department of General Surgery, Pudong Hospital, Shanghai, People’s Republic of China
Correspondence: Yanping Ji
Department of Pathology, Eye, Ear, Nose and Throat Hospital, Fudan University, 83 Fen Yang Road, Shanghai, People’s Republic of China
Email [email protected]
Background: The prognosis of patients with head and neck squamous cell carcinoma (HNSCC) is still poor due to the lack of effective prognostic biomarkers. lncRNA is an important survival prognostic indicator and has important biological functions in tumorigenesis.
Methods: RNA-seq was re-annotated, and comprehensive clinical information was obtained from the GEO database. Univariate and multivariate Cox regression analyses were used to construct the lncRNA prognosis signature. Gene set enrichment analysis (GSEA) enrichment analysis method is used to explore the possible mechanism of the selected lncRNA influencing HNSCC development. The rms package was used to calculate the C-index to evaluate the overall prediction performance between different signature. PCR is used to detect the expression of selected lncRNA in cancer and adjacent tissues.
Results: In the GSE65858 training cohort, 124 probes significantly related to prognosis were identified, 11 significant lncRNAs were further selected by rbsurv dimensionality reduction analysis. Finally, 4-lncRNA signature was constructed by multivariate Cox analysis. This signature was associated with tumor-associated pathway and is an independent factor of the patient’s prognosis. 4-lncRNA signature has strong robustness and can exert stable prediction performance in different cohorts. A nomogram comprising the prognostic model to predict the overall survival was established. The 4-lncRNA signature was significantly upregulated in HNSCC samples.
Conclusion: The predictive model and nomogram will enable patients to be more accurately managed in trials and clinical practices and could be applied as a new prognostic model for predicting survival of HNSCC patients.
Keywords: HNSCC, 4-lncRNA signature, prognostic biomarkers, nomogram
Introduction
Head and neck squamous cell carcinoma (HNSCC) is a highly aggressive malignant tumor which kills more than 300,000 people worldwide every year, making it the seventh most common cancer in the world.1,2 So far, HNSCC is still one of the most challenging malignancies. Comprehensive treatment including surgery, radiation therapy and chemotherapy is the key to treating locally advanced diseases.3,4 However, treatment of relapsed or metastatic diseases severely affects the prognosis of patients.5 The prognosis model currently used for HNSCC patients is based on clinicopathological parameters, but many cases in the same clinical stage showed opposite prognosis.6,7 Therefore, an effective prognostic prediction model is urgently needed for HNSCC patients.
Long non-coding RNA (lncRNA) is non-coding RNA longer than 200 nucleotides. Compared with mRNA, lncRNAs have higher tissue specificity and are easier to detect, so they are important biomarkers for tumor diagnosis and prognosis.8–10 Increasing evidence has suggested that lncRNAs play a crucial role in the development of tumors,11,12 including HNSCC.13,14 For example, lncRNA-EGFR-AS mediated the sensitivity of HNSCC to EGFR inhibitors by regulating EGFR function;15 overexpression of LINC01503 promoted the malignant biological phenotype of HNSCC.16 With the development of high-throughput sequencing technology and bioinformatics, more and more lncRNAs had been discovered, and lncRNA-signature related to the prognosis of HNSCC had been established, yet the function of lncRNA in most signatures was not clear.17–19 Therefore, it is of great significance for both patients and clinicians to establish a lncRNA-signature associated with the prognosis of HNSCC.
In short, a 4-lncRNA signature, which is an independent factor of clinical characteristics, was constructed in this study. It showed good predictive performance in both training and validation cohorts. Therefore, it was recommended to apply this 4-lncRNA signature to assess the prognostic risk of HNSCC patients.
Materials and Methods
Source of Expression Profile and Data Downloading
Original gene expression data and corresponding clinical information of patients with HNSCC were downloaded from the Gene Expression Omnibus (GEO) Database and The Cancer Genome Atlas (TCGA). The GeneChip data set GSE65858 was downloaded from GEO, which contained clinical information and expression profile data of 270 head and neck cancer patients. The annotation level was GPL10558.
The latest expression data and clinical follow-up information of HNSCC patients were download by TCGA GDC API. This data set contained clinical information and RNA-seq data of 500 patients.
Re-Annotation of ChIP-Chip Data
The probe sequence of Illumina HumanHT-12 V4.0 expression beadchip was first downloaded, and the latest lncRNA reference sequence and gtf file were downloaded in gencode, then sequence alignment was conducted through seqmap with no mismatch allowed. Finally ENSGID was converted to lncRNA symbol according to the gtf file.
GEO Data Preprocessing
The following steps were performed on the GSE65858 cohort:
- Remove samples with overall survival (OS) < 30 days or without survival information;
- Convert the probe IDs to the corresponding lncRNA ENSG IDs using re-annotation, and retain the lncRNA probe IDs;
- Retain probe IDs of samples with the median absolute difference greater than one-quarter of the probe value of all samples.
TCGA Data Preprocessing
The following steps were performed on the RNA-seq data of TCGA samples:
- Remove samples with OS < 30 days or without clinical information;
- Retain the lncRNA ENSG IDs.
After preprocessing, the GEO cohort contained the expression matrix and clinical information of 267 samples as well as 1595 lncRNA ENSG IDs. The TCGA cohort contained the expression matrix and clinical information of 500 samples as well as 60,483 lncRNA ENSG IDs. Clinical information statistics of the training cohort and validation cohort were shown in Table 1.
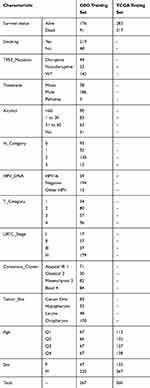 |
Table 1 Clinical Information Statistics of the Two Data Sets After Preprocessing |
Construction of the Risk Model
Univariate Cox Analysis
First, the R package survival coxph function was used to perform univariate Cox proportional hazard regression model on the re-annotated lncRNA probe expression in the training cohort.
1,000 Rbsurv Dimension Reduction Analysis
Next, 75% of the samples were randomly drawn from the training cohort for rbsurv analysis, 1,000 rbsurv analyses were conducted using triple cross-validation, the maximum number of lncRNAs was selected, and results of each dimension reduction analysis were finally summarized. Standard deviations of these lncRNA probes were calculated respectively, lncRNAs with standard deviation greater than the median standard deviation of all probes and frequency greater than 300 were selected to construct a multi-factor Cox regression model.
Construction of the Nomogram
The nomogram can be a method to show the results of the risk model intuitively and effectively, and it has an important clinical application in predicting the outcome. It uses the length of the line to show the influence and values of different variables on the outcome. We included the significant clinical variables of multivariate analysis to construct a nomogram. The nomogram is applied by adding up the points identified on the points scale for each variable. The total points projected on the bottom scales indicate the probability of 1-year, 3-years and 5-year’s overall survival or mortality rate.
Enriched Pathways of 4-lncRNA Signature
To explore the relationship between the 4-lncRNA signature and tumor-related pathways of different samples, the gene expression profiles corresponding to these samples were selected to perform single-sample Gene Set Enrichment Analysis (ssGSEA) analysis using the R package GSVA. Scores of each sample on different functions were calculated to obtain the ssGSEA scores of each function corresponding to each sample, then the correlation between these functions and RiskScores was further assessed.
Quantitative Reverse Transcription Polymerase Chain Reaction Validation of the Expression of lncRNAs
To complete the RNA extraction and real-time polymerase chain reaction (PCR) assay, total RNA was extracted using TRIzol Reagent (Invitrogen, Thermo Fisher Scientific, Waltham, MA, USA) following the manufacturer’s protocol and was reverse-transcribed into complementary DNA (cDNA) using a Superscript Reverse Transcriptase Kit (Transgene, France). Super SYBR Green Kit (Transgene, France) was used to carry out real-time PCR in ABI7300 real-time PCR system (Applied Biosystems, Thermo Fisher Scientific, Waltham, MA, USA). The primers pairs were:
Z98886.1 forward primer: CTGCCCGGCTAATTAATTGCT reverse primer: ACGAAAATTAGTGAGTTGGCATT
PIK3CD-AS1 forward primer: GAAGTGGGGCTCAGAAGGA reverse primer: GGCGGAAGGTTCTTTTGGTT
AL603962.1 forward primer: ACCCAGCCTGATCCTATTGT reverse primer: TCCCCTGTGAAATTCATTGTTCT
AL6455608.1 forward primer: ACGTCTAATCTGGCCCCAAG reverse primer: AAACGATCCTCAGGCTCCTC.
The expression levels of the four lncRNAs were calculated using the comparative 2−ΔΔCt method.
Results
Identification Prognostic lncRNA Probes
First, we performed univariate Cox analysis on 1,595 re-annotated lncRNA probes in the training cohort. The results are shown in Supplementary S1_Table . P<0.05 was set as the threshold to select 124 probes with significant prognosis, the top 20 lncRNA probes are shown in Table 2.
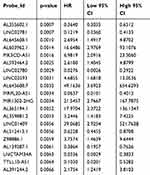 |
Table 2 Top 20 lncRNA Probes Most Significantly Associated with Prognosis in Univariate Analysis |
Relationship Between Prognosis and Clinical Characteristics
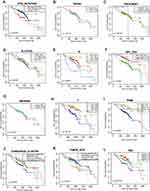
Univariate Cox analysis was performed according to the overall survival and clinical characteristics including TP53 mutation, age, gender, treatment, alcohol, smoking, lymph node metastasis N, HPV_DNA, degree of invasion T, UICC, genotyping, tumor tissue site. The results are shown in Figure 1, which indicates that TP53 mutation, lymph node metastasis N, HPV_DNA, invasion degree T, and UICC had significant prognosis, while tumor tissue site and age had a marginal significant impact.
We took significant clinical features including TP53 mutation, lymph node metastasis N, HPV_DNA, degree of invasion T, UICC status, tumor sites and age as covariates to further conduct multivariate Cox analysis for each lncRNA probe. The significance threshold was 0.05, and the 37 probes finally obtained are shown in Supplementary S2_Table.
1,000 Rbsurv Dimension Reduction Analysis
Three-fold cross-validation was employed, and the maximum number of lncRNAs was set as 30 to conduct 1000 rbsurv analyses. The final results of each dimension reduction are shown in Figure 2A. It can be seen that the frequencies of most probes are about 10%, which suggested that the influences of these probes on prognosis were not stable in different sample sets. The standard deviations of these high-frequency probes were relatively large, finally eleven lncRNAs with standard deviations greater than the median standard deviation of all probes and frequencies greater than 300 were selected. The distribution of their standard deviations is shown in Figure 2B.
Construction of a Prognostic Model
Based on the eleven identified lncRNAs related to the prognosis of HNSCC, ROC curve analysis was performed for each gene, which showed that the AUC of five probes LINC01342, Z98886.1, AL645608.1, PIK3CD-AS1, and AL603962.1 were above 0.6, as shown in Figure 3. Then multivariate Cox survival analysis for these five probes was conducted, and the AIC criterion (Akaike’s Information Criterion) was used as the condition for threshold screening. The AIC criterion believes that the model with the smallest AIC value is optimal. Therefore, results of the multivariate Cox were iterated, and the 4-lncRNA with the minimum AIC value (AIC = 851.90) were used to construct the final prognostic model.
 |
Figure 3 ROC curves of 11 probes for 1, 3, and 5 years. Probes with AUC greater than 0.6 are in red. |
4-lncRNA Risk Score = 1.008* Z98886.1+1.0232* AL645608.1+1.7362* PIK3CD-AS1+2.6919* AL603962.1
The results of the multivariate Cox analyses on the four lncRNAs are shown in Table 3.
 |
Table 3 Results of the Multivariate Survival Analyses on the four lncRNAs |
ROC Analysis of Risk Model
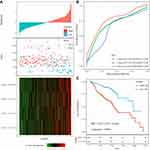
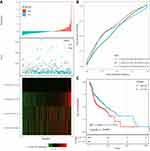
The risk score of each sample was calculated according to their expression level, and the risk score distribution of the sample is shown in Figure 4A. It could be seen that samples with a higher risk score had significantly smaller OS than those with a lower score, which meant that higher risk score indicated worse prognosis. The expression of the four different signature probes also increased with the increase of risk score. The high expressions of them were associated with high risk and were risk factors. The ROC analysis of the prognostic classification of risk score was further performed using the R software package timeROC, and the prognostic classification efficiency of 1, 3, and 5 years was analyzed, as shown in Figure 4B. The AUC for this model was as large as greater than 0.77. Finally, risk score were converted to z-score, 128 samples with a risk score greater than zero were divided into a high-risk group, and 139 with risk score less than zero were divided into a low-risk group. The KM curve is shown in Figure 4C, which indicates that they had an extremely significant difference in logrank; p<0.0001, HR = 2.932 (1.874–4.586).
Univariate and Multivariate Analysis of the 4-lncRNA Signature
To identify the independence of the 4-lncRNA signature model in clinical applications, clinical information for the entire training cohort was used to analyze the relevant HR, 95% CI of HR and p-value using univariate and multivariate Cox regression. Clinical information including gender, age, pathology T stage, N stage, M stage, UICC Stage, alcohol, HPV, smoking, TP53_mutation and other clinical information, as well as grouping information of the 4-lncRNA signature were systematically analyzed. Univariate Cox regression analysis revealed that age, pathology T stage, N stage, UICC Stage, HPV_DNA, consensus_cluster were significantly related to OS, as shown in Figure 5A. While the corresponding multivariate Cox analysis found risk score (HR=2.28, 95% CI=1.333–3.898, log rank p=0.003), pathological N status, and HPV_DNA significantly related to OS (Figure 5B). These indicated that the risk score, pathological N status and HPV_DNA were independent risk variables in patients' prognosis.
 |
Figure 5 (A) Forest map of univariate survival analysis; (B) Forest map of multivariate survival analysis, where orange-red represents significant relation to OS. |
Construction of Nomogram and DCA
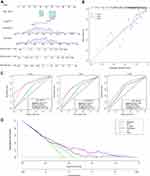
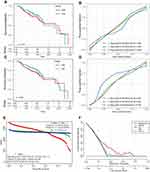
We included the significant clinical variables of 4-lncRNA Risk Score, pathological N status and HPV_DNA in the multivariate analysis to construct a nomogram (Figure 6A). Results showed that 4-ncRNA risk score had the greatest impact on survival prediction, indicating that the 4-lncRNA signature performed well in predicting overall survival.
Calibration plots were used to visualize the performances of the nomograms. The 45° line represented the best prediction. Calibration plots showed that the nomogram performed well (Figure 6B). At the same time, we compared the accuracy of this nomogram with independent Risk score, HPV_DNA and pathological N stage. We found that the performance of nomogram ROC was significantly higher than that of HPV_DNA, pathological N stage and risk score (Figure 6C).
Decision Curve Analysis (DCA) is a method for evaluating clinical predictive models, diagnostic tests, and molecular markers. In order to prove the advantage of the nomogram, we compared the 1-year, 3-year and 5-year ROC curves of HPV_DNA, pathological N stage and risk score and found that the nomogram showed the best net benefit (Figure 6D).
These findings suggest that the nomogram constructed by combining multiple independent prognostic variables is the best predictor of the survival time of patients, whether in the short term or in the long term, compared with an independent prognostic variable. This may be helpful for patient counseling, decision-making and follow-up scheduling. In short, the predictive model we developed will enable patients with head and neck cancer to be managed more accurately in clinical practice.
Enriched Pathways of 4-lncRNA Signature
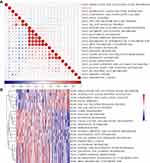
It can be seen that most of the tumor-related pathways are negatively correlated with the risk score of the samples (Figure 7A). A total of 22 KEGG Pathways with correlation greater than 0.3 were selected to conduct cluster analysis based on their enrichment score, as shown in Figure 7B. Among these 22 pathways, nod-like receptor signaling pathway and JAK/STAT signaling pathway increased with the rise of the risk score, while mismatch repair and endometrial cancer decreased as the risk score rose, which also suggested that the imbalance of these pathways was closely related to tumor development.
Relationship Between Risk Model and Immune Score
To identify the relationship between the 4-lncRNA signature, risk score and the immune score, 28 types of immune scores were first calculated.20 Further analysis showed that CD4 T cell, Central memory CD8 T cell, Gamma delta T cell, Regulatory T cell, T follicular helper cell, Type 1 T helper cell, Activated dendritic cell and other immune scores had significant differences between the high- and low-risk groups in the training cohort (p <0.05), as shown in Figure 8.
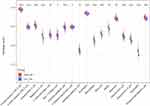 |
Figure 8 Immune scores with significant difference between the high- and low-risk groups in 28 immune scores. |
External Validation of 4-lncRNA Signature
The robustness of the model was further evaluated in the external cohort, using the same model and coefficients as in the training cohort. The risk score distribution is shown in Figure 9A, samples with higher risk scores had a worse prognosis. The 5-year ROC curve was 0.64 (Figure 9B). The KM curve in Figure 9C showed that there was an extremely significant difference between the two groups (log rank p=0.0058, HR=1.469 (1.115–1.933)).
Comparison of the Other Signatures
After reviewing the literature, two prognostic risk signatures, the 4-gene signature (Zhang et al)21 and the 10-gene signature (Xu et al),22 were finally selected for comparison with the 4-lncRNA model. To make them comparable, the same method was used to calculate the risk score of each sample in the training cohort according to the corresponding lncRNAs in the two published models. The ROC and KM curves of the two models in Figure 10A–D shows that in Zhang’s model, the AUC of 1-year, 3-years and 5-years were all below 0.6, and the prognosis was not significant (p=0.54). Among the Xu’s risk model, the AUC of 1-year and 3-years were also less than 0.6, and the prognosis was not significant (p=0.22). Unlike the model constructed in this study, these two could not divide the training cohort into high- and low-risk groups.
To compare the predictive performance of these models on HNSCC samples, the restricted mean survival curve was drawn using the R package rms. As shown in Figure 10E, the C-index of 4-lncRNA RiskScore was higher than that of both the Zhang et al 21and Xu et al22 models with a significant p-value, which indicated that our 4-lncRNA signature had better predictive performances for prognosis than the others. Figure 10F shows the clinical utility of the three models. We can see that 4-lncRNA signature risk score has the highest net benefit, indicating that our model has the best clinical applicability.
Quantitative Reverse Transcription Polymerase Chain Reaction Validation of the Expression of lncRNAs
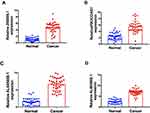
The experimental results of quantitative reverse transcription polymerase chain reaction (RT-qPCR) described that the 4-lncRNAs were significantly upregulated in 40 pairs in HNSCC compared with normal tissues (Figure 11).
Flowchart of Data Analysis
In order to make our research understood easily by readers, a flowchart of our research was performed (Figure 12).
 |
Figure 12 Flowchart of data analysis. |
Discussion
HNSCC has a high morbidity and mortality, with a 5-year survival rate of only 40−50%, and more than 60% of patients are in advanced stages at their first clinical visit.23,24 Therefore, it is vital to explore the diagnosis and prognosis biomarkers. In recent years, lncRNA has attracted widespread attention from researchers. LncRNA was involved in many biological processes of tumors, including regulating the proliferation, apoptosis, invasion, and metastasis of tumor cells.25,26 Recently, a variety of lncRNAs have gradually been confirmed to be abnormally expressed in HNSCC, and to play an important regulatory role in tumor development.
In this study, the lncRNA probe expression and survival data were re-annotated in the GSE65858 cohort, and 124 probes significantly associated with prognosis were identified through univariate Cox analysis, then they were reduced to eleven lncRNAs by rbsurv dimensionality reduction analysis. Combined with multivariate Cox regression analysis, a prognostic model including four lncRNAs, Z98886.1, AL645608.1, PIK3CD-AS1 and AL603962, was established. Integrating clinical information, the nomogram containing 4-lncRNA signature further confirmed its good predictive performance in clinical applications. Similarly, univariate and multivariate Cox analysis on the 4-lncRNA signature confirmed that it was an independent prognostic factor. More importantly, the 4-lncRNA signature also showed good predictive performance on prognosis in the TCGA validation cohort. This indicated that the 4-lncRNA signature had stable and consistent predictive performance for prognosis, thus having great potential for clinical application. RT-qPCR was used to explore the differential expression of 4-lncRNAs in head and neck cancer and normal tissues. The results showed that these 4-lncRNAs were up-regulated in head and neck cancer tissues compared with normal tissues.
Currently, there are no studies on Z98886.1, AL645608.1 and AL603962.1 in other tumors and head and neck cancer. There are a few studies on PIK3CD-AS1, only reported separately in kidney cancer and liver cancer. Chen et al27 found that the upregulation of PIK3CD-AS1 is closely related to higher clinical stage and metastasis of renal cell carcinoma. Song et al28 had found that the overexpression of lncRNA PIK3CD-AS1 inhibits the growth, invasion and metastasis of hepatocellular carcinoma cells by competitive binding with microRNA-566, thus promoting the expression of LATS1. Overall, lncRNA PIK3CD-AS1 is highly expressed in tumors, which is consistent with our experimental validation. Moreover, our 4-lncRNA signature is unique for head and neck cancer, and the combined prognostic effect of these four genes has not been reported in other studies.
Another focus of this study was exploratory analysis of the tumor-related pathway of the constructed lncRNA model. GSEA enrichment analysis showed that nod-like receptor signaling pathway, JAK/STAT signaling pathway, etc. increased with the rise of the risk score. Multiple studies have shown that excessive activation of the NLR pathway29–31 and JAK/STAT pathway32–34 promoted the malignant phenotype of HNSCC, further confirming the reliability of our analysis.
In contrast, some pathways such as mismatch repair decreased as the risk score rose, suggesting that dysregulation of the mismatch repair pathway might be related to the development of HNSCC, which was consistent with previous researches.35,36 The mismatch repair system is one of the most important ways to repair DNA damage, its main purpose is to ensure the integrity of DNA structure.37,38 Defects in the mismatch repair system would lead to genomic instability.39 This result suggested a potential link between the lncRNA model and the immune function of HNSCC. Therefore, the relationship between the 4-lncRNA signature and immune cells were subsequently explored. The results showed that 4-lncRNA signature was significantly correlated with the scores of CD4 T cell, central memory CD8 T cell, regulatory T cell and other cells, further indicating the close relationship between the model and immune function. These results revealed the potential function of lncRNA in this model, and more importantly, showed that the 4-lncRNA signature played an important role in maintaining the immune function of HNSCC, and the mechanism needed to be explored in further research.
Many previous studies had tried to identify lncRNA prognostic markers and to construct models for HNSCC. Zhang et al21 constructed a 4-lncRNA signature based on the TCGA data set.Xu et al22 constructed a ceRNA network of HNSCC by analyzing the TCGA data set, in which 11-lncRNA was significantly related to the prognosis and could be used as a prognostic biomarker for HNSCC patients. Comparative analysis showed that our signature in this study was better than these two models in predicting the prognosis of HNSCC. C-index analysis further confirmed its better overall performance than the others. These results indicated our 4-lncRNA signature prediction model had strong advantages in helping clinicians predict the individual risks and providing guidance for patient assessment and treatment decisions.
Although based on large samples, this study still had some limitations. The conclusions were mainly based on bioinformatics analysis, thus further validation in future in vivo and in vitro experiments was still needed. In addition, the specific functions of the four lncRNAs in HNSCC were still unknown, even though the possible mechanisms were predicted, we also need more experiments to validate in the future. Finally, the population race in the TCGA database is mainly limited to whites and blacks, and extrapolation of the study results to other multicenter studies needs to be confirmed.
In summary, a 4-lncRNA signature was constructed in this study, it showed satisfactory predictive performance in different cohorts. By incorporating the 4-lncRNA signature to construct the nomogram, we found that compared with the traditional pathological staging and HPV_DNA status, nomogram has the best ability to predict the prognosis and is expected to become routinely used in the future adding value in clinical situations.
Data Sharing Statement
The datasets used in this study are available from the corresponding author upon reasonable request.
Ethics Approval
This study was approved by the Ethics Committee of Department of Pathology, Eye, Ear, Nose and Throat Hospital, Fudan University.
Acknowledgments
The authors thank the numerous individuals who participated in this study.
Author Contributions
All authors contributed to data analysis, drafting and revising the article, gave final approval of the version to be published, and agree to be accountable for all aspects of the work.
Disclosure
The authors report no conflicts of interest in this work.
References
1. Argiris A, Karamouzis MV. Head and neck cancer. Lancet. 2008;371:1695–1709. doi:10.1016/S0140-6736(08)60728-X
2. Leemans CR, Braakhuis BJM, Brakenhoff RH. The molecular biology of head and neck cancer. Nat Rev Cancer. 2011;11:9–22. doi:10.1038/nrc2982
3. Hammerman PS, Hayes DN, Grandis JR. Therapeutic insights from genomic studies of head and neck squamous cell carcinomas. Cancer Discov. 2015;5:239–244. doi:10.1158/2159-8290.CD-14-1205
4. Rothenberg SM, Ellisen LW. The molecular pathogenesis of head and neck squamous cell carcinoma. J Clin Invest. 2012;122:1951–1957. doi:10.1172/JCI59889
5. Leemans CR, Snijders PJF, Brakenhoff RH. The molecular landscape of head and neck cancer. Nat Rev Cancer. 2018;18:269–282. doi:10.1038/nrc.2018.11
6. Marur S, Forastiere AA. Head and neck squamous cell carcinoma: update on epidemiology, diagnosis, and treatment. Mayo Clin Proc. 2016;91:386–396. doi:10.1016/j.mayocp.2015.12.017
7. Marur S, Forastiere AA. Head and neck cancer: changing epidemiology, diagnosis, and treatment. Mayo Clin Proc. 2008;83:489–501. doi:10.4065/83.4.489
8. Sole C, Arnaiz E, Manterola L, et al. The circulating transcriptome as a source of cancer liquid biopsy biomarkers. Semin Cancer Biol. 2019;58:100–108. doi:10.1016/j.semcancer.2019.01.003
9. Wu X, Tudoran OM, Calin GA, Ivan M. The many faces of long noncoding RNAs in cancer. Antioxid Redox Signal. 2018;29:922–935. doi:10.1089/ars.2017.7293
10. Carpenter S, Fitzgerald KA. Cytokines and long noncoding RNAs. Cold Spring Harb Perspect Biol. 2018;10:a028589. doi:10.1101/cshperspect.a028589
11. Ramnarine VR, Kobelev M, Gibb EA, et al. The evolution of long noncoding RNA acceptance in prostate cancer initiation, progression, and its clinical utility in disease management. Eur Urol. 2019;76:546–559. doi:10.1016/j.eururo.2019.07.040
12. Lin C, Yang L. Long noncoding RNA in cancer: wiring signaling circuitry. Trends Cell Biol. 2018;28:287–301. doi:10.1016/j.tcb.2017.11.008
13. Xu J, Bo Q, Zhang X, et al. lncRNA HOXA11-AS promotes proliferation and migration via sponging miR-155 in hypopharyngeal squamous cell carcinoma. Oncol Res. 2020;28(3):311–319. doi:10.3727/096504020X15801233454611
14. Li R, Chen S, Zhan J, et al. Long noncoding RNA FOXD2-AS1 enhances chemotherapeutic resistance of laryngeal squamous cell carcinoma via STAT3 activation. Cell Death Dis. 2020;11:41. doi:10.1038/s41419-020-2232-7
15. Tan DSW, Chong FT, Leong HS, et al. Long noncoding RNA EGFR-AS1 mediates epidermal growth factor receptor addiction and modulates treatment response in squamous cell carcinoma. Nat Med. 2017;23:1167–1175. doi:10.1038/nm.4401
16. Xie JJ, Jiang YY, Jiang Y, et al. Super-enhancer-driven long non-coding RNA LINC01503, regulated by TP63, is over-expressed and oncogenic in squamous cell carcinoma. Gastroenterology. 2018;154:2137–2151. doi:10.1053/j.gastro.2018.02.018
17. Wang P, Jin M, Sun CH, et al. A three-lncRNA expression signature predicts survival in head and neck squamous cell carcinoma (HNSCC). Biosci Rep. 2018;38. doi:10.1042/BSR20181528
18. Liu G, Zheng J, Zhuang L, et al. A prognostic 5-lncRNA expression signature for head and neck squamous cell carcinoma. Sci Rep. 2018;8:15250. doi:10.1038/s41598-018-33642-1
19. Diao P, Song Y, Ge H, et al. Identification of 4-lncRNA prognostic signature in head and neck squamous cell carcinoma. J Cell Biochem. 2019;120:10010–10020. doi:10.1002/jcb.28284
20. Charoentong P, Finotello F, Angelova M, et al. Pan-cancer immunogenomic analyses reveal genotype-immunophenotype relationships and predictors of response to checkpoint blockade. Cell Rep. 2017;18(1):248–262. doi:10.1016/j.celrep.2016.12.019
21. Zhang G, Fan E, Zhong Q, et al. Identification and potential mechanisms of a 4-lncRNA signature that predicts prognosis in patients with laryngeal cancer. Hum Genomics. 2019;13:36. doi:10.1186/s40246-019-0230-6
22. Xu Q, Yin H, Ao H, et al. An 11-lncRNA expression could be potential prognostic biomarkers in head and neck squamous cell carcinoma. J Cell Biochem. 2019;120(10):18094–18103. doi:10.1002/jcb.29113
23. Kaidar-Person O, Gil Z, Billan S. Precision medicine in head and neck cancer. Drug Resist Updat. 2018;40:13–16. doi:10.1016/j.drup.2018.09.001
24. Economopoulou P, Agelaki S, Perisanidis C, et al. The promise of immunotherapy in head and neck squamous cell carcinoma. Ann Oncol. 2016;27:1675–1685. doi:10.1093/annonc/mdw226
25. Arun G, Diermeier SD, Spector DL. Therapeutic targeting of long non-coding RNAs in cancer. Trends Mol Med. 2018;24:257–277. doi:10.1016/j.molmed.2018.01.001
26. Kopp F, Mendell JT. Functional classification and experimental dissection of long noncoding RNAs. Cell. 2018;172:393–407. doi:10.1016/j.cell.2018.01.011
27. Chen B, Wang C, Zhang J, Zhou Y, Hu W, Guo T. New insights into long noncoding RNAs and pseudogenes in prognosis of renal cell carcinoma. Cancer Cell Int. 2018;18:157. doi:10.1186/s12935-018-0652-6
28. Song W, Zhang J, Zhang J, Sun M, Xia Q. Overexpression of lncRNA PIK3CD-AS1 promotes expression of LATS1 by competitive binding with microRNA-566 to inhibit the growth, invasion and metastasis of hepatocellular carcinoma cells. Cancer Cell Int. 2019;19:150. doi:10.1186/s12935-019-0857-3
29. Feng X, Luo Q, Zhang H, et al. The role of NLRP3 inflammasome in 5-fluorouracil resistance of oral squamous cell carcinoma. J Exp Clin Cancer Res. 2017;36(1):81. doi:10.1186/s13046-017-0553-x
30. Bae JY, Lee SW, Shin YH, et al. P2X7 receptor and NLRP3 inflammasome activation in head and neck cancer. Oncotarget. 2017;8:48972–48982. doi:10.18632/oncotarget.16903
31. Huang CF, Chen L, Li YC, et al. NLRP3 inflammasome activation promotes inflammation-induced carcinogenesis in head and neck squamous cell carcinoma. J Exp Clin Cancer Res. 2017;36(1):116. doi:10.1186/s13046-017-0589-y
32. Lee YS, Johnson DE, Grandis JR. An update: emerging drugs to treat squamous cell carcinomas of the head and neck. Expert Opin Emerg Drugs. 2018;23:283–299. doi:10.1080/14728214.2018.1543400
33. Gao J, Zhao S, Halstensen TS. Increased interleukin-6 expression is associated with poor prognosis and acquired cisplatin resistance in head and neck squamous cell carcinoma. Oncol Rep. 2016;35:3265–3274. doi:10.3892/or.2016.4765
34. Choudhary MM, France TJ, Teknos TN, et al. Interleukin-6 role in head and neck squamous cell carcinoma progression. World J Otorhinolaryngol Head Neck Surg. 2016;2:90–97. doi:10.1016/j.wjorl.2016.05.002
35. Nogueira GAS, Costa EFD, Lopes-Aguiar L, et al. Polymorphisms in DNA mismatch repair pathway genes predict toxicity and response to cisplatin chemoradiation in head and neck squamous cell carcinoma patients. Oncotarget. 2018;9:29538–29547. doi:10.18632/oncotarget.25268
36. Nogueira GAS, Lourenço GJ, Oliveira CBM, et al. Association between genetic polymorphisms in DNA mismatch repair-related genes with risk and prognosis of head and neck squamous cell carcinoma. Int J Cancer. 2015;137:810–818. doi:10.1002/ijc.29435
37. Fishel R. Mismatch repair. J Biol Chem. 2015;290:26395–26403. doi:10.1074/jbc.R115.660142
38. Li Z, Pearlman AH, Hsieh P. DNA mismatch repair and the DNA damage response. DNA Repair. 2016;38:94–101. doi:10.1016/j.dnarep.2015.11.019
39. Lee V, Murphy A, Le DT, et al. Mismatch repair deficiency and response to immune checkpoint blockade. Oncologist. 2016;21:1200–1211. doi:10.1634/theoncologist.2016-0046
 © 2020 The Author(s). This work is published and licensed by Dove Medical Press Limited. The full terms of this license are available at https://www.dovepress.com/terms.php and incorporate the Creative Commons Attribution - Non Commercial (unported, v3.0) License.
By accessing the work you hereby accept the Terms. Non-commercial uses of the work are permitted without any further permission from Dove Medical Press Limited, provided the work is properly attributed. For permission for commercial use of this work, please see paragraphs 4.2 and 5 of our Terms.

