Back to Journals » Clinical Ophthalmology » Volume 11
Hydroxychloroquine for treatment of rheumatoid arthritis: multifocal electroretinogram and laser flare-cell photometry study
Authors Sebastiani S ![]() , Fresina M
, Fresina M ![]() , Cellini M, Campos EC
, Cellini M, Campos EC
Received 22 December 2016
Accepted for publication 18 March 2017
Published 11 April 2017 Volume 2017:11 Pages 689—696
DOI https://doi.org/10.2147/OPTH.S130899
Checked for plagiarism Yes
Review by Single anonymous peer review
Peer reviewer comments 2
Editor who approved publication: Dr Scott Fraser
Stefano Sebastiani, Michela Fresina, Mauro Cellini, Emilio C Campos
Department of Experimental, Diagnostic, and Specialty Medicine, Ophthalmology Service, University of Bologna, Bologna, Italy
Purpose: To evaluate early changes in multifocal electroretinogram (mfERG) and subclinical aqueous humor flare and cellularity in patients receiving hydroxychloroquine (HCQ) as treatment for rheumatoid arthritis.
Methods: Ten patients receiving treatment with HCQ and no ophthalmic symptoms were enrolled. After complete ocular examination, mfERG and laser flare-cell photometry were performed. Patients were also divided into two subgroups with HCQ cumulative dose (CD) higher or lower than 500 g. Results obtained were compared with a control group of ten healthy subjects and statistical analysis was performed.
Results: In patients receiving HCQ treatment, mfERG P1-wave in ring 2 showed a significant reduction in amplitude and a significant increase in latency compared to healthy control subjects, respectively resulting in 1.143 µV vs 1.316 µV (P=0.040) and 38.611 ms vs 36.334 ms (P=0.024). These changes are highly related to CD. Furthermore, when using the laser flare-cell photometry, a significant increase in aqueous humor flare and cellularity was shown in patients with CD higher than 500 g, resulting in a mean value of 14.4 ph/ms compared to 8.1 ph/ms in patients with CD lower than 500 g (P=0.0029). These reports appear highly related to CD (P=0.001). Receiver operating characteristic curve analysis showed mfERG P1-wave amplitude in ring 2 as the most sensitive value in detecting early HCQ-related retinopathy.
Conclusion: MfERG was shown to be a very sensitive test in detecting early retinal toxicity and should be used for the screening of patients receiving HCQ treatment. Although less sensitive, laser flare-cell photometry can provide further information to evaluate early toxic retinal cell damage.
Keywords: hydroxychloroquine, multifocal electroretinography, laser flare-cell photometry, rheumatoid arthritis
Introduction
Rheumatoid arthritis (RA) is a chronic inflammatory disease characterized by joint swelling, weakness, fragility, and progressive synovial membrane damage, leading to a high degree of disability. The disease evolution is not easily predictable and, if not promptly and adequately treated, can cause severe worsening in joint mobility and function, leading to various levels of disability, significant reduction in quality of life, and increased mortality.1–5
RA etiopathogenesis is still only partially known. Nowadays it seems possible that chronic inflammation localized in joint tissues can be the result of autoimmune reactions that firstly affects synovial tissue, and then may extend to cartilage and bone tissues.6,7
For a prompt and correct diagnosis, currently we refer to American College of Rheumatology – European League Against Rheumatism classification criteria. They suggest starting a pharmacological treatment based on disease-modifying anti-rheumatic drugs (DMARDs) as soon as possible.8
Currently, hydroxychloroquine (HCQ) represents the most commonly used molecule, mainly because of its lower toxicity compared to chloroquine (CQ).9 Nevertheless, it can also have harmful effects on retinal pigment epithelium (RPE) cells, and consequently on photoreceptor cells.10
This occurs most frequently in prolonged use because of the characteristic dose-dependent relationship of toxic retinopathy,11,12 and early identification is very important because a progression in retinal damage is possible even after therapy discontinuation.12 American Academy of Ophthalmology (AAO) recommends the following examinations as follow-up for patients taking HCQ: 10-2 pattern automated visual field analysis, spectral-domain optical coherence tomography (SD-OCT), fundus autofluorescence (FAF), and multifocal electroretinogram (mfERG).12
Sensitivity of these diagnostic tests in detecting any early sign of retinal toxicity is still under discussion, but in the last years mfERG has been increasingly gaining evidence as a very sensitive objective test.13
Following these evaluations, we set out to evaluate mfERG and subclinical aqueous humor flare and cellularity using a laser flare-cell meter in a group of patients taking HCQ for treatment of RA.
Materials and methods
The current study was approved by the Local Ethics Committee of the University of Bologna and adhered to the tenets of the Declaration of Helsinki. Written informed consent was obtained from all participants before any procedure.
Ten patients (seven females and three males; mean age 64.8±11.7 years) with a diagnosis of RA followed-up in the outpatient Rheumatology Service of Sant’Orsola-Malpighi University Hospital of Bologna and receiving treatment with HCQ (Plaquenil, Sanofi S.p.A., Milano, Italy) at a dose of 400 mg per day, were enrolled in this study.
Average treatment time was 46.7±15.2 months, with mean cumulative dose (CD) of 625.6±167.44 g. There were no patient complaints of any visual or ophthalmic symptoms. All patients underwent a comprehensive ophthalmological examination including best-corrected visual acuity for distant and near vision, intraocular pressure measurement with Goldmann applanation tonometry, anterior segment slit lamp biomicroscopy (Haag-Streit BM 900, Haag-Streit, Koeniz, Switzerland), posterior segment slit lamp indirect ophthalmoscopy conducted with Volk +78D non-contact lens (Volk Optical Inc., Mentor, OH, USA), SD-OCT and FAF (Spectralis HRA-OCT, Heidelberg Engineering, Heidelberg, Germany), and 10-2 pattern automated visual field analysis (Humphrey 640, Carl Zeiss Meditec AG, Jena, Germany).
After that, since previous examinations yielded results within normal limits, we extended the evaluation performing mfERG to evaluate retinal sensitivity and laser flare-cell photometry to assess aqueous humor subclinical flare and cellularity.
mfERG was recorded using Retimax Plus (CSO, Firenze, Italy) with the following technique. After pupillary dilation with 1% tropicamide eye drops and corneal topical anesthesia with 0.4% oxybuprocaine hydrochloride eye drops, ERG HK-Loop electrodes were applied on the inferior conjunctival fornix with ground and reference electrodes positioned on forehead and temporal regions respectively. Electrical impedance was less than 5 kOhm for all electrodes. mfERG was recorded monocularly using a 61-hexagon stimulus according to International Society for the Clinical Electrophysiology of Vision guidelines,14 with 21 inches video stimulating display (CRT monitor, 75 Hz frame rate, cut-offs 10–100 Hz), subtending 30° on either side of fixation. The room light was on during stimulation and the screen-patient distance was 28 cm. The radius of the central hexagon was 2° and a red central-fixation cross 2 mm in diameter was used. During stimulation, each element was either black or white (93% contrast) and mean luminance was 51.8 cd/m2. Mean responses, as assessed by the analysis of five concentric stimulus rings, were passed through a band-pass filter set to 10–300 Hz. The standard measurement for amplitude was the trough-to-peak amplitude measured from the trough of N1-wave to the peak of P1-wave and was expressed in μV, while the standard measurement for timing was the implicit time of P1-wave peak and was expressed in ms.14
Aqueous humor proteins and cells were quantified by a laser flare-cell meter FC-500 (Kowa Company Ltd., Electronics and Optics Division, Tokyo, Japan), which consists of a helium-neon laser beam system and a photomultiplier mounted on a slit lamp biomicroscope, all connected with a computer. The laser scans the aqueous humor across a sampling window (0.3×0.5 mm2) in 0.5 sec using an optical scanner. Light scattered by protein particles and inflammatory cells in the aqueous humor is proportional to their concentration and size, and is detected by a photon-counting multiplier and processed by a computer. Given that cells are larger than proteins, the amount of light scattered by cells is greater than that reflected by fine protein particles. At the end of the measurement, flare is expressed in photon counts per ms (ph/ms). A total of seven measurements were obtained for each eye, the highest and the lowest values were eliminated, and the computer calculated the mean and standard deviation automatically.
Ten healthy patients (eight females and two males; mean age 61.3±10.4 years) were enrolled as control group.
Statistical analysis was performed using MedCalc 12.3.0 statistical program (MedCalc Software, Ostend, Belgium). mfERG values of density, P1-wave amplitude and latency in rings 1, 2, 3, 4, 5 and laser flare-cell photometry values were analyzed applying Mann–Whitney U test and Spearman’s correlation test to assess differences between groups, considering P<0.05 as significant. Furthermore, receiver operating characteristic (ROC) curve and area under the curve (AUC) for mfERG and laser flare-cell photometry were measured to evaluate their sensitivity and specificity in detecting early retinal toxic damage.
Results
Regarding mfERG P1-wave in ring 2, data analysis showed a significant reduction in amplitude values for patients receiving treatment with HCQ compared to control patients, results are respectively 1.143±0.361 μV vs 1.316±0.236 μV (P=0.040) (Table 1), also with a significant increase in latency, results are respectively 38.611±2.857 ms vs 36.334± 2.212 ms (P=0.024) (Table 2). These statistically significant changes in ring 2 amplitude and latency values are highly related to HCQ CD (Table 3).
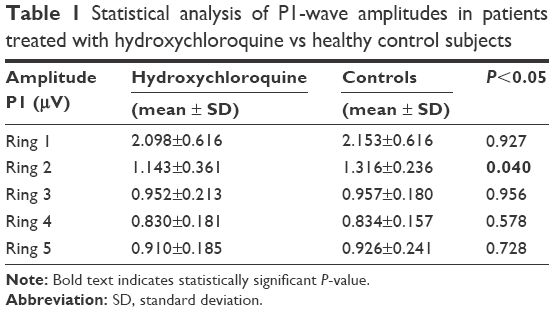 | Table 1 Statistical analysis of P1-wave amplitudes in patients treated with hydroxychloroquine vs healthy control subjects |
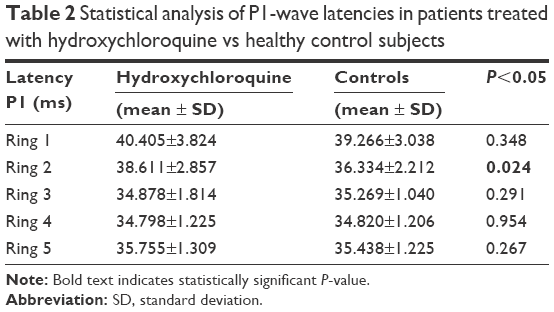 | Table 2 Statistical analysis of P1-wave latencies in patients treated with hydroxychloroquine vs healthy control subjects |
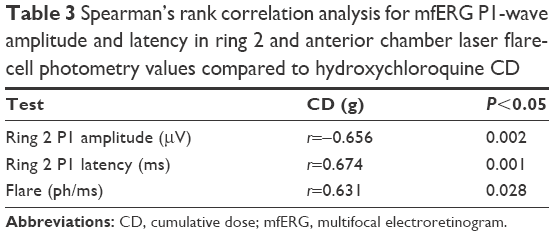 | Table 3 Spearman’s rank correlation analysis for mfERG P1-wave amplitude and latency in ring 2 and anterior chamber laser flare-cell photometry values compared to hydroxychloroquine CD |
No statistically significant changes were found regarding mfERG photoreceptor density values (Table 4).
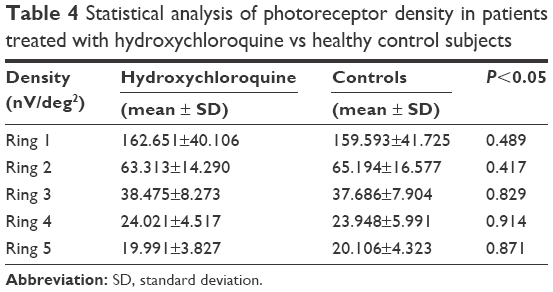 | Table 4 Statistical analysis of photoreceptor density in patients treated with hydroxychloroquine vs healthy control subjects |
Because we had no basal mfERG and laser flare-cell photometry values for these patients, we divided our patients into two subgroups according to the CD to evaluate possible changes correlated with this parameter. The first group presents CDs higher than 500 g (six patients; mean value 740.66±106.39 g), while the second group presents CDs lower than 500 g (four patients; mean value 453±30.6 g).
Analyzing these two subgroups, laser flare-cell photometry values are significantly higher in the group of patients with CD higher than 500 g compared to patients with CD lower than 500 g, results are respectively 14.4±6.3 ph/ms vs 8.1±2.9 ph/ms (P=0.029) (Table 5). This increase is found highly related to the CD of the drug (r=0.899; P=0.001) (Figure 1).
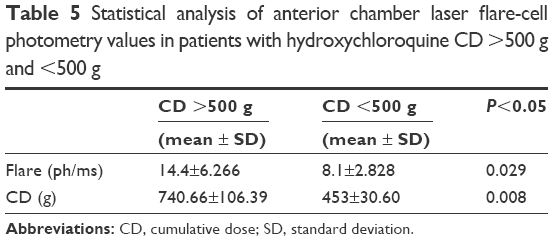 | Table 5 Statistical analysis of anterior chamber laser flare-cell photometry values in patients with hydroxychloroquine CD >500 g and <500 g |
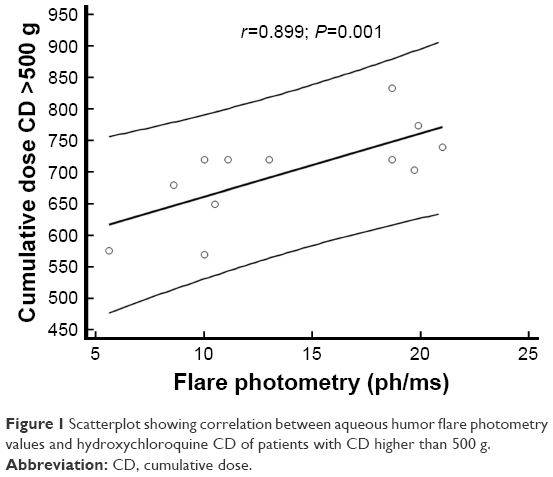 | Figure 1 Scatterplot showing correlation between aqueous humor flare photometry values and hydroxychloroquine CD of patients with CD higher than 500 g. |
Furthermore, mfERG data analyzed regarding these two subgroups, show a statistically significant reduction in P1-wave amplitude in ring 2 (0.974±0.261 μV vs 1.396±0.352 μV; P=0.006) (Table 6) and a statistically significant increase in P1-wave latency in ring 1 (42.332±2.94 ms vs 37.513±3.191 ms; P=0.008) and 2 (40.142±2.442 ms vs 36.314±2.442 ms; P=0.031) in patients with CD higher than 500 g (Table 7). This increase in latencies in ring 1 and 2, and this reduction in amplitude in ring 2 is highly related to the increase in laser flare-cell photometry values (for latencies in ring 1: r=0.838, P=0.0007; and in ring 2, r=0.628, P=0.029; for amplitude in ring 2: r=−0.619, P=0.032) (Table 8 and Figures 2–4).
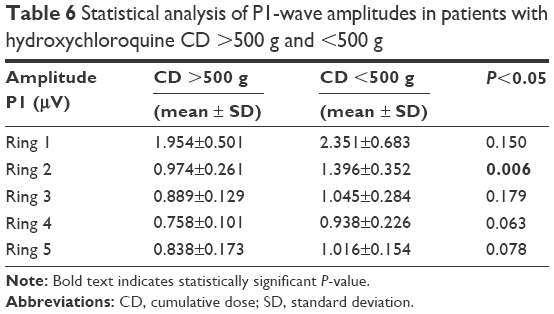 | Table 6 Statistical analysis of P1-wave amplitudes in patients with hydroxychloroquine CD >500 g and <500 g |
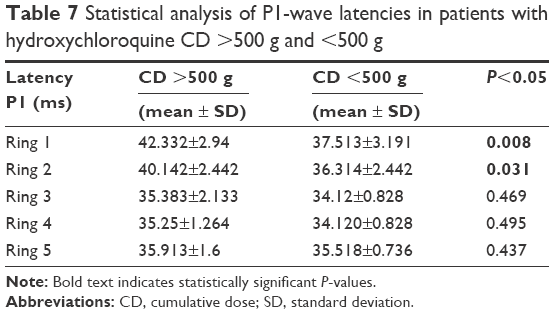 | Table 7 Statistical analysis of P1-wave latencies in patients with hydroxychloroquine CD >500 g and <500 g |
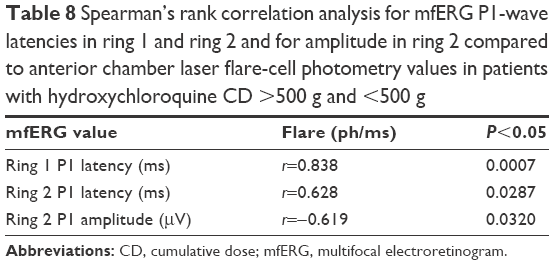 | Table 8 Spearman’s rank correlation analysis for mfERG P1-wave latencies in ring 1 and ring 2 and for amplitude in ring 2 compared to anterior chamber laser flare-cell photometry values in patients with hydroxychloroquine CD >500 g and <500 g |
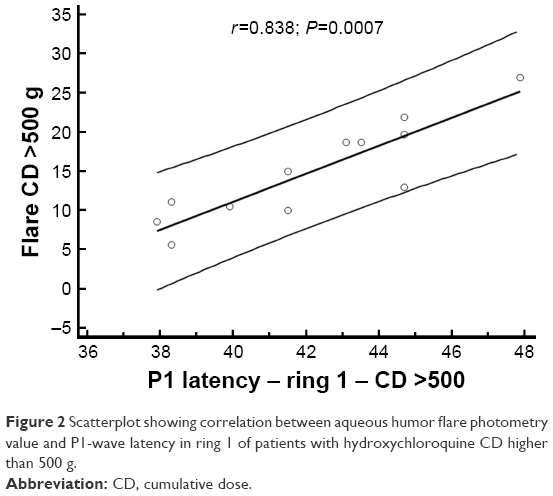 | Figure 2 Scatterplot showing correlation between aqueous humor flare photometry value and P1-wave latency in ring 1 of patients with hydroxychloroquine CD higher than 500 g. |
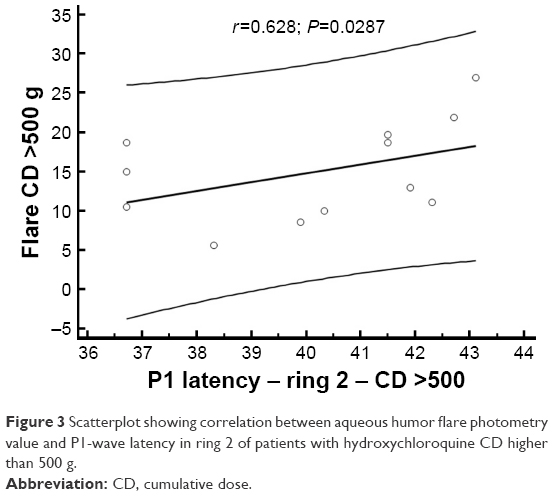 | Figure 3 Scatterplot showing correlation between aqueous humor flare photometry value and P1-wave latency in ring 2 of patients with hydroxychloroquine CD higher than 500 g. |
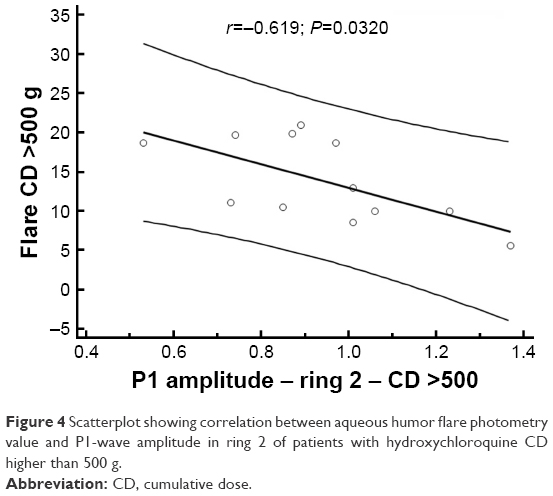 | Figure 4 Scatterplot showing correlation between aqueous humor flare photometry value and P1-wave amplitude in ring 2 of patients with hydroxychloroquine CD higher than 500 g. |
No statistically significant changes were found regarding mfERG photoreceptor density values comparing the two subgroups (Table 9).
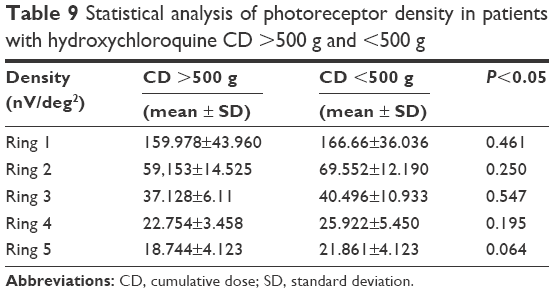 | Table 9 Statistical analysis of photoreceptor density in patients with hydroxychloroquine CD >500 g and <500 g |
Finally, ROC curve analysis demonstrates that the most sensitive test in detecting early retinal toxicity was mfERG P1-wave amplitude in ring 2 (AUC =0.931), followed by mfERG P1-wave latency in ring 2 (AUC =0.810), and then laser flare-cell photometry (AUC =0.791) (Table 10 and Figure 5).
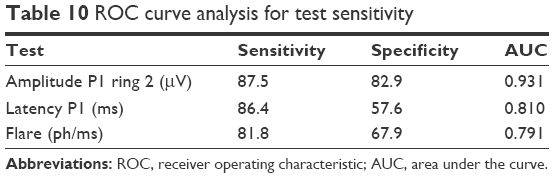 | Table 10 ROC curve analysis for test sensitivity |
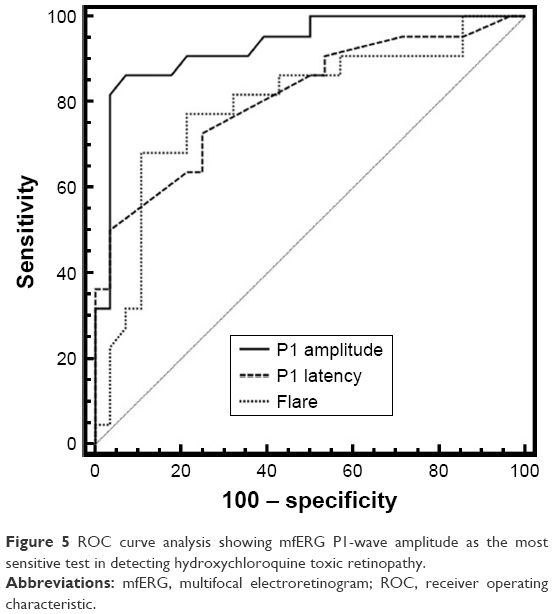 | Figure 5 ROC curve analysis showing mfERG P1-wave amplitude as the most sensitive test in detecting hydroxychloroquine toxic retinopathy. |
Discussion
HCQ is an anti-malarial drug still commonly used for its anti-inflammatory activity to favorably modulate the clinical course of RA. Its use has been associated with various adverse side effects, particularly progressive toxic retinopathy. Major risk factors for the development of retinopathy seem to be: the duration of treatment (>5 years), a high daily dose (>6.5 mg/Kg), a high CD (>1,000 g), concurrent kidney or liver diseases, and age over 60 years old.15–17
How HCQ and CQ can lead to the development of retinopathy still remains to be elucidated. In vitro experimental studies showed that these molecules could bind to pigmented cells containing melanin, particularly in iris and RPE cells.18
Moreover, HCQ causes the inhibition of some enzymes essential for RPE metabolic function,19 leading to progressive photoreceptor functional damage.16
Recently it has been described that HCQ, in addition to altering RPE function, can also alter blood-retinal barrier (BRB) stability20 provoking a marked increase in permeability of ARPE-19 monostratified cells.21 This increase in permeability seems to be related to a subsequent increase in tight junction molecules’ (ZO-1, occludin and claudin) production, which seems to disrupt RPE integrity, regardless of the direct drug action on RPE cells.22,23
Therefore, it is necessary to perform a thorough ophthalmological evaluation and follow these patients up with periodical screening exams, in order to detect any possible damage to photoreceptor function early on.
Actually, the AAO recommends the following screening exams: 10-2 pattern automated visual field analysis, macular SD-OCT, FAF, and mfERG.12
Based on mfERG analysis, our study shows that the most frequent finding in patients treated with HCQ was P1-wave amplitude reduction in ring 2, followed by amplitude reduction in rings 3, 4, and 1 (Table 11).
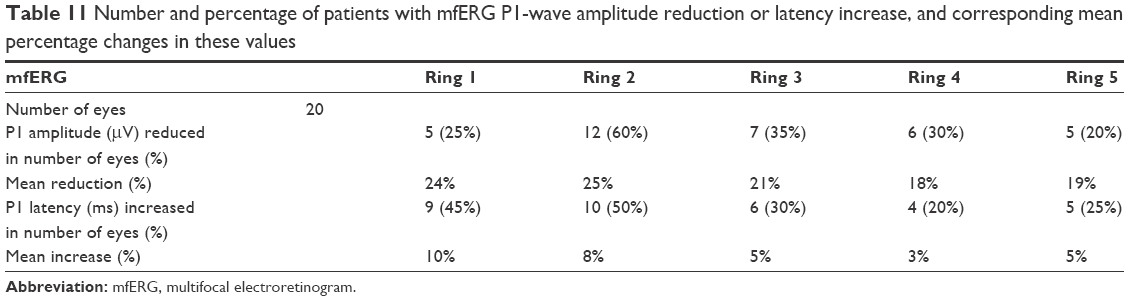 | Table 11 Number and percentage of patients with mfERG P1-wave amplitude reduction or latency increase, and corresponding mean percentage changes in these values |
These results are consistent with previously reported data in literature, although many authors described mfERG damages as central, paracentral, pericentral, and peripheral, according to the following criteria: ring 1 to the fovea (0°–2°), ring 2 to the parafovea (2°–7°), ring 3 to the perifovea (7°–13°), ring 4 to the near periphery (3°–22°), and ring 5 to the central part of the middle periphery (22.0°–30.5°).24–26
Regarding P1-wave latency, the most frequent finding seems to be an increase in ring 2 followed by an increase in ring 1. These data are consistent with previous reports in the literature,24,27,28 and only one study found an increased latency without reduction in amplitude.29
P1-wave amplitude reduction seems to be an expression of histological and morphological RPE damage,10 while increased P1-wave latency appears to be an inconstant parameter that is not always found in toxic retinopathy.30
Our findings differ from those reported in the literature about damage onset timing, a previous study described damage starting after 5 years of therapy.27
In this study we divided patients into two subgroups depending on whether CD values were higher or lower than 500 g. In the CD >500 g group, we found a significant decrease of P1-wave amplitude in ring 2, and a significant increase in P1-wave latencies in rings 1 and 2. These data appear to differ from reports by other authors,26,27 who assert that HCQ-related damage leads mainly to reduced P1-wave amplitude, and only rarely to an increase in latency in P1-wave analysis.
Finally, ROC curve analysis shows that mfERG sensitivity is extremely high regarding P1-wave amplitude decrease and latency increase, partially confirming previously described findings of some authors,13 who indicate amplitude as the most sensitive value in detecting HCQ toxic retinopathy. We believe that this partial discordance could be ascribed to the different CDs of the drug in our group of patients compared to other clinical records.
Laser flare-cell photometry has rarely been used for the study of patients with RA without any sign of uveal involvement, and not yet in treatment with DMARDs. Nevertheless, a previous study described a significant increase of aqueous humor flare and cellularity values in these patients, compared to healthy control subjects.31
In this study, we found higher laser flare-cell photometry values in the patient group with CD higher than 500 g compared to the patient group with CD lower than 500 g. Also in this case, the increase in flare values seemed to be correlated to higher HCQ CD.
To our knowledge, no previous clinical studies have described this correlation, however, it can be very interesting because we can find various possibilities to explain our results.
Our first hypothesis is that HCQ, binding to melanin in iris pigmented cells, can lead to their disruption, as occurs in RPE cells, with following pigment release in aqueous humor.32
A second interesting hypothesis is that the observed increase in flare values may be due to a breakdown in BRB, as previously reported by some authors using fluorophotometry,20 and caused by the increased permeability of ARPE-19 monostratified pigmented cells. This can be induced by HCQ21 not only directly, but also stimulating the production of enzymes such as ZO-1, claudin, and occludin.22,23 Thus, it appears possible to explain the correlation between increased flare values and increased P1-wave latencies in rings 1 and 2 observed in the group of patients with CDs higher than 500 g. Moreover, this BRB breakdown with the increase in circulating ET-1 levels found in patients with RA,33 could justify the significant retinal functional changes localized particularly in ring 2 of mfERG, but also found in ring 3 by other authors.25,30 This could be due to the particular anatomical distribution of bipolar cells in the macular region, which is smaller in the fovea and becomes more dense toward the parafovea and perifovea regions,34 where a proper choroidal blood supply is essential for neuronal function.
Conclusion
In conclusion, we believe that mfERG is a very sensitive test in detecting early retinal dysfunction caused by HCQ toxicity in patients with no ophthalmologic symptoms and normal fundus appearance, visual acuity, and 10-2 pattern automated visual field analysis.
In agreement with AAO recommendations, we suggest that mfERG should be used instead of automated visual field analysis as objective functional test for the screening of patients treated with HCQ.
Future studies on HCQ retinal toxicity with mfERG should be directed at the determination of the earliest point at which mfERG can detect retinopathy. Another interesting future evaluation could be to use laser flare-cell photometry to better understand the importance of vascular permeability deterioration and BRB integrity breakdown in the development of toxic damage.
Acknowledgements
The authors thank Mr Luca Teglia (Orthoptist) who performed the multifocal electroretinograms.
Disclosure
The authors do not have a financial relationship with any organization and declare that there are no conflicts of interest in this work.
References
Scott DL, Symmons DP, Coulton BL, Popert AJ. Long-term outcome of treating rheumatoid arthritis: results after 20 years. Lancet. 1987;1(8542):1108–1111. | ||
Mitchell DM, Spitz PW, Young DY, Bloch DA, McShane DJ, Fries JF. Survival, prognosis, and causes of death in rheumatoid arthritis. Arthritis Rheum. 1986;29(6):706–714. | ||
Pincus T, Callahan LF, Sale WG, Brooks AL, Payne LE, Vaughn WK. Severe functional declines, work disability, and increased mortality in seventy-five rheumatoid arthritis patients studied over nine years. Arthritis Rheum. 1984;27(8):864–872. | ||
Isomäki H. Long-term outcome of rheumatoid arthritis. Scand J Rheumatol Suppl. 1992;95:3–8. | ||
Wolfe F. The natural history of rheumatoid arthritis. J Rheumatol Suppl. 1996;44:13–22. | ||
Firestein GS. Evolving concepts of rheumatoid arthritis. Nature. 2003;423(6937):356–361. | ||
Smolen JS, Aletaha D, Koeller M, Weisman MH, Emery P. New therapies for treatment of rheumatoid arthritis. Lancet. 2007;370(9602):1861–1874. | ||
Radner H, Neogi T, Smolen JS, Aletaha D. Performance of the 2010 ACR/EULAR classification criteria for rheumatoid arthritis: a systematic literature review. Ann Rheum Dis. 2014;73(1):114–123. | ||
Rainsford KD, Parke AL, Clifford-Rashotte M, Kean WF. Therapy and pharmacological properties of hydroxychloroquine and chloroquine in treatment of systemic lupus erythematosus, rheumatoid arthritis and related diseases. Inflammopharmacology. 2015;23(5):231–269. | ||
Mahon GJ, Anderson HR, Gardiner TA, McFarlane S, Archer DB, Stitt AW. Chloroquine causes lysosomal dysfunction in neural retina and RPE: implications for retinopathy. Curr Eye Res. 2004;28(4):277–284. | ||
Rüther K, Foerster J, Berndt S, Schroeter J. [Chloroquine/hydroxychloroquine: variability of retinotoxic cumulative doses]. Ophthalmologe. 2007;104(10):875–879. German. | ||
Marmor MF, Kellner U, Lai TY, Melles RB, Mieler WF; American Academy of Ophthalmology. Recommendations on screening for chloroquine and hydroxychloroquine retinopathy (2016 Revision). Ophthalmology. 2016;123(6):1386–1394. | ||
Tsang AC, Ahmadi Pirshahid S, Virgili G, Gottlieb CC, Hamilton J, Coupland SG. Hydroxychloroquine and chloroquine retinopathy: a systematic review evaluating the multifocal electroretinogram as a screening test. Ophthalmology. 2015;122(6):1239–1251. | ||
Hood DC, Bach M, Brigell M, et al. ISCEV standard for clinical multifocal electroretinography (mfERG) (2011 edition). Doc Ophthalmol. 2012;124(1):1–13. | ||
Bernstein HN. Ocular safety of hydroxychloroquine. Ann Ophthalmol. 1991;23(8):292–296. | ||
Browning DJ. Hydroxychloroquine and chloroquine retinopathy: screening for drug toxicity. Am J Ophthalmol. 2002;133(5):649–656. | ||
Marmor MF, Carr RE, Easterbrook M, Farjo AA, Mieler WF; American Academy of Ophthalmology. Recommendations on screening for chloroquine and hydroxychloroquine retinopathy: a report by the American Academy of Ophthalmology. Ophthalmology. 2002;109(7):1377–1382. | ||
Bernstein HN, Ginsberg J. The pathology of chloroquine retinopathy. Arch Ophthalmol. 1964;71:238–245. | ||
Wright CI, Sabine JC. Cholinesterases of human erythrocytes and plasma and their inhibition by antimalarial drugs. J Pharmacol Exp Ther. 1948;93(2):230–239. | ||
Raines MF, Bhargava SK, Rosen ES. The blood-retinal barrier in chloroquine retinopathy. Invest Ophthalmol Vis Sci. 1989;30(8):1726–1731. | ||
Korthagen NM, Bastiaans J, van Meurs JC, van Bilsen K, van Hagen PM, Dik WA. Chloroquine and hydroxychloroquine increase retinal pigment epithelial layer permeability. J Biochem Mol Toxicol. 2015;29(7):299–304. | ||
Abe T, Sugano E, Saigo Y, Tamai M. Interleukin-1beta and barrier function of retinal pigment epithelial cells (ARPE-19): aberrant expression of junctional complex molecules. Invest Ophthalmol Vis Sci. 2003;44(9):4097–4104. | ||
Yoshikawa T, Ogata N, Izuta H, Shimazawa M, Hara H, Takahashi K. Increased expression of tight junctions in ARPE-19 cells under endoplasmic reticulum stress. Curr Eye Res. 2011;36(12):1153–1163. | ||
Moschos MM, Nitoda E, Chatziralli IP, Gatzioufas Z, Koutsandrea C, Kitsos G. Assessment of hydroxychloroquine maculopathy after cessation of treatment: an optical coherence tomography and multifocal electroretinography study. Drug Des Devel Ther. 2015;9:2993–2999. | ||
So SC, Hedges TR, Schuman JS, Quireza ML. Evaluation of hydroxychloroquine retinopathy with multifocal electroretinography. Ophthalmic Surg Lasers Imaging. 2003;34(3):251–258. | ||
Moschos MN, Moschos MM, Apostolopoulos M, Mallias JA, Bouros C, Theodossiadis GP. Assessing hydroxychloroquine toxicity by the multifocal ERG. Doc Ophthalmol. 2004;108(1):47–53. | ||
Maturi RK, Yu M, Weleber RG. Multifocal electroretinographic evaluation of long-term hydroxychloroquine users. Arch Ophthalmol. 2004;122(7):973–981. | ||
Lai TY, Chan WM, Li H, Lai RY, Lam DS. Multifocal electroretinographic changes in patients receiving hydroxychloroquine therapy. Am J Ophthalmol. 2005;140(5):794–807. | ||
Aliferis K, Mermoud C, Safran AB. [Multifocal electroretinography in follow-up of patients treated with hydroxychloroquine]. J Fr Ophtalmol. 2011;34(7):468–475. French. | ||
Kellner U, Renner AB, Tillack H. Fundus autofluorescence and mfERG for early detection of retinal alterations in patients using chloroquine/hydroxychloroquine. Invest Ophthalmol Vis Sci. 2006;47(8):3531–3538. | ||
Cellini M, Versura P, Leonetti P, et al. Ocular surface and intraocular inflammation are related in SS-I and rheumatoid arthritis patients. Rheumatol Int. 2007;27(9):853–857. | ||
Trese M, Li Y, Gao H, Qiao X. Inflammation exacerbates hydroxychloroquine-induced retinotoxicity in human retinal pigment epithelial cells. Invest Ophthalmol Vis Sci. 2013;54:6090. | ||
Pache M, Schwarz HA, Kaiser HJ, et al. Elevated plasma endothelin-1 levels and vascular dysregulation in patients with rheumatoid arthritis. Med Sci Monit. 2002;8(9):CR616–CR619. | ||
Miyake Y. Focal macular electroretinography. Nagoya J Med Sci. 1998;61(3–4):79–84. |
 © 2017 The Author(s). This work is published and licensed by Dove Medical Press Limited. The
full terms of this license are available at https://www.dovepress.com/terms
and incorporate the Creative Commons Attribution
- Non Commercial (unported, 3.0) License.
By accessing the work you hereby accept the Terms. Non-commercial uses of the work are permitted
without any further permission from Dove Medical Press Limited, provided the work is properly
attributed. For permission for commercial use of this work, please see paragraphs 4.2 and 5 of our Terms.
© 2017 The Author(s). This work is published and licensed by Dove Medical Press Limited. The
full terms of this license are available at https://www.dovepress.com/terms
and incorporate the Creative Commons Attribution
- Non Commercial (unported, 3.0) License.
By accessing the work you hereby accept the Terms. Non-commercial uses of the work are permitted
without any further permission from Dove Medical Press Limited, provided the work is properly
attributed. For permission for commercial use of this work, please see paragraphs 4.2 and 5 of our Terms.