Back to Journals » Journal of Pain Research » Volume 10
How stable are quantitative sensory testing measurements over time? Report on 10-week reliability and agreement of results in healthy volunteers
Authors Nothnagel H, Puta C ![]() , Lehmann T, Baumbach P, Menard MB
, Lehmann T, Baumbach P, Menard MB ![]() , Gabriel B, Gabriel HHW, Weiss T
, Gabriel B, Gabriel HHW, Weiss T ![]() , Musial F
, Musial F
Received 17 March 2017
Accepted for publication 4 July 2017
Published 29 August 2017 Volume 2017:10 Pages 2067—2078
DOI https://doi.org/10.2147/JPR.S137391
Checked for plagiarism Yes
Review by Single anonymous peer review
Peer reviewer comments 3
Editor who approved publication: Dr Katherine Hanlon
Helen Nothnagel,1,2,* Christian Puta,1,3,* Thomas Lehmann,4 Philipp Baumbach,5 Martha B Menard,6,7 Brunhild Gabriel,1 Holger H W Gabriel,1 Thomas Weiss,8 Frauke Musial2
1Department of Sports Medicine and Health Promotion, Friedrich Schiller University, Jena, Germany; 2Department of Community Medicine, National Research Center in Complementary and Alternative Medicine, UiT, The Arctic University of Norway, Tromsø, Norway; 3Center for Interdisciplinary Prevention of Diseases Related to Professional Activities, 4Department of Medical Statistics, Computer Sciences and Documentation, Friedrich Schiller University, 5Department of Anesthesiology and Intensive Care Medicine, University Hospital Jena, Germany; 6Crocker Institute, Kiawah Island, SC, 7School of Integrative Medicine and Health Sciences, Saybrook University, Oakland, CA, USA; 8Department of Biological and Clinical Psychology, Friedrich Schiller University, Jena, Germany
*These authors contributed equally to this work
Background: Quantitative sensory testing (QST) is a diagnostic tool for the assessment of the somatosensory system. To establish QST as an outcome measure for clinical trials, the question of how similar the measurements are over time is crucial. Therefore, long-term reliability and limits of agreement of the standardized QST protocol of the German Research Network on Neuropathic Pain were tested.
Methods: QST on the lower back and hand dorsum (dominant hand) were assessed twice in 22 healthy volunteers (10 males and 12 females; mean age: 46.6±13.0 years), with sessions separated by 10.0±2.9 weeks. All measurements were performed by one investigator. To investigate long-term reliability and agreement of QST, differences between the two measurements, correlation coefficients, intraclass correlation coefficients (ICCs), Bland–Altman plots (limits of agreement), and standard error of measurement were used.
Results: Most parameters of the QST were reliable over 10 weeks in healthy volunteers: Almost-perfect ICCs were observed for heat pain threshold (hand) and mechanical pain sensitivity (back). Substantial ICCs were observed for heat pain threshold (back), pressure pain threshold (back), mechanical pain sensitivity (hand), and vibration detection threshold (back and hand). Some QST parameters, such as cold detection threshold, exhibited low ICCs, but also very low variability. Generally, QST measures exhibited narrow limits of agreement in the Bland–Altman plots.
Conclusion: The standardized QST protocol of the German Research Network on Neuropathic Pain is feasible to be used in treatment trials. Moreover, defining a statistically meaningful change is possible, which is a prerequisite for the use of QST in clinical trials as well as in long-term investigations of disease progression.
Keywords: QST, healthy volunteers, test–retest reliability, intraclass correlations, Bland–Altman plot, limits of agreement, standard error of measurement, minimum detectable difference
Introduction
Quantitative sensory testing (QST) investigates the submodalities of the somatosensory system, such as temperature, touch, vibration, and pain. It provides information on the state of peripheral sensory nerves, as well as pain perception and central sensitization. The method allows for the evaluation of the functional status of the small (Aδ, C) and large (Aβ) fiber sensor systems.1,2
Over the past decade, QST has achieved a unique position within the field of pain diagnostics.3–9 However, heterogeneity of the protocols remains a challenge. Recently, a highly standardized QST protocol was established by the German Research Network on Neuropathic Pain (DFNS), including a reference database with age- and gender-matched normative data from healthy volunteers for face, hand, and foot.2,10,11 Additional reference values for the back were established.12 Consequently, QST has been proven to discriminate between pathological states reliably from among those found in a normal population.13,14 Because of its unique discriminative properties, it can be assumed that QST is likewise able to detect changes over time. This is obviously relevant regarding the detection of pathological changes and functional deterioration, such as those observed in diabetes, and could also be relevant for quantification of treatment effects in a clinical trial on pain. However, a crucial precondition for the usefulness of QST as an outcome measure in clinical trials is that repeated measures of QST are principally stable over time.
While the reliability of QST has been investigated before, available data only include several QST parameters and submodalities measured within a few days up to 1 month.15–25 These studies found generally high test–retest reliabilities. The test–retest reliability of the complete QST protocol of the DFNS has only been investigated in a few studies.26–29 Geber et al29 analyzed 60 QST profiles from patients with sensory disturbances in a multicenter study. They found a high test–retest reliability for all parameters over a period of 2 days. Moreover, Pigg et al28 found acceptable intraoral reliabilities between 6 and 21 days. Hirschfeld et al27 conducted QST in a cohort of children and adolescents over a period of 15 months and found a systematic decrease in pain sensitivity, most likely related to maturation. However, information about its stability over time under most ideal circumstances is required in order to establish QST as a valid instrument for clinical trials. In our understanding, optimal circumstances would include an investigation over several weeks with a highly standardized protocol in healthy, pain-free subjects. To our knowledge, there is only one paper available addressing this point.30
A particular, methodological problem of repeated measures is the fact that data can correlate highly yet may not present a stable repetition of a measurement. As Bland and Altman31 point out: “If one measurement is always twice as big as the other, they are highly correlated, but they do not agree.” They suggest statistically defining the limits of agreement (LoAs) between two measurements. Moreover, it is most likely the agreement between two measurements that determines the usefulness for detecting meaningful changes over time for quantifying a treatment effect or documenting pathological deterioration. To date, no information about the LoAs under optimized conditions is available for QST. Therefore, the present study aims to determine the long-term reliability and agreement for a period of 10 weeks in adult healthy volunteers using the standardized QST protocol of the DFNS.
Methods
Participants
Twenty-two healthy volunteers, 10 males (38.2±13.1 years, mean ± SD) and 12 females (54.2±6.8 years, mean ± SD), were investigated between March 2013 and September 2014 (Table 1). All participants were free of pain (numerical rating scale, NRS =0). In addition, they self-reported no use of any pain medication for at least 48 hours before the first QST session. The participants were volunteers recruited from a participant database and student population of the Department of Sports Medicine and Health Promotion and the Department of Biological and Clinical Psychology of the University of Jena through a telephone survey. The local ethics committee of the University of Jena approved the study protocol; the study was performed in accordance with the Helsinki Declaration. All volunteers provided written informed consent prior to participation.
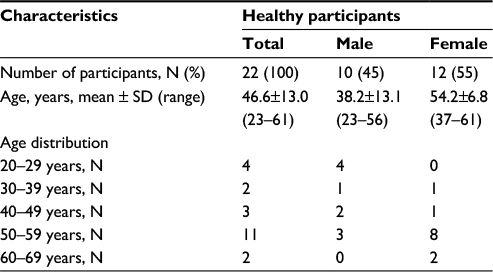 | Table 1 Descriptive characteristics of all participants (N=22) Abbreviation: N, number of participants. |
Study design
A repeated-measures design was performed. Each subject participated in two QST sessions (measurement session 1: T1; and measurement session 2: T2) separated by 10.0±2.9 weeks (mean ± SD). The whole QST test battery was conducted on two anatomical locations: on the lower back (paraspinal lumbar area) and the dorsum of the dominant hand. The area of measurement for the lower back was between vertebrae L2 and L5 with a mean distance of 4.4±1.8 cm (mean ± SD) lateral from the spinous process. The two areas measured (lower back and hand dorsum) correspond with the contact area of the thermode (3×3 cm). The size of the area was marked using a skin marker. All participants were right-handed. The test instructions were given by reading the standard QST instructions for all subjects. The measurements were performed in a quiet room (room temperature: 23.0°C±2.2°C, mean ± SD). To control for the influence of skin temperature, the skin temperatures of the lower back and hand dorsum were recorded before administering the QST. All data were collected by one examiner (HN), trained by the DFNS. The laboratory is certified by the DFNS (registration number: 36180814).
QST protocol
QST was performed according to the standardized protocol of the DFNS.2,10
Thermal detection and pain thresholds as well as the number of paradoxical heat sensations (PHS)
Thermal testing was conducted using the thermal stimulator Thermal Sensory Analyzer II (TSA; Medoc, Ramat Yishai, Israel) with a contact area of the thermode equaling 9 cm2. Cold detection threshold (CDT), warm detection threshold (WDT), number of PHS using the thermal sensory limen (TSL) procedure of alternating cold and warm stimuli, cold pain threshold (CPT), and heat pain threshold (HPT) were each assessed using the standard protocol of DFNS. The baseline temperature was 32°C, with a lower cutoff temperature at 0°C and upper cutoff temperature at 50°C, and the ramp rate for all thermal stimuli was 1°C/s.2,10
Mechanical detection threshold (MDT)
MDT for touch was assessed by using a standardized set of modified von Frey filaments (diameter 0.5 mm, Optihair2-Set Marstock Nervtest, Schriesheim, Germany), which exert forces between 0.25 mN and 512 mN (factor two progression). Using the “method of limits”, the final threshold was defined as the geometric mean of five series of ascending and descending stimulus intensities.32
Mechanical pain threshold (MPT)
MPT was measured using a set of standard pinprick stimulators (cylindrical tip, 250 µm tip diameter) with fixed stimulus intensities that exerted forces of 8, 16, 32, 64, 128, 256, and 512 mN (MRC Systems GmbH, Heidelberg, Germany). The stimulators were applied in ascending order until the first perception of sharpness was detected. MPT was determined using the “method of limits”. The final threshold was the geometric mean of five series of ascending and descending stimuli intensities.
Mechanical pain sensitivity (MPS) and dynamic mechanical allodynia (DMA)
Pain induced by punctate mechanical stimuli was measured using the same standard pinprick stimulators as for MPT. To obtain MPS for pinprick-evoked pain, all seven pinprick stimuli were applied in balanced order, five times each stimulus. MPS was defined as the geometric mean of the given stimuli as in the standard protocol. To avoid effects of sensitization or fatigue, the successive stimuli were not applied at the same spot of skin, but some millimeters away from the previously stimulated spot. Following each stimulus, participants were asked to rate the experienced pain intensity for each stimulus on an NRS, with zero indicating “no pain” and 100 indicating “maximal imaginable pain”. Pain to light touch (DMA) was assessed by light stroking with a cotton wisp (3 mN), a Q-tip fixed to an elastic strip (100 mN), and a soft makeup brush (200–400 mN). The set of the three light tactile stimulators were intermingled with the pinprick stimuli in balanced order. If the stroking stimuli were perceived as painful, participants were asked to give a rating for the amount of perceived pain using the same NRS (0–100).
Wind-up ratio (WUR)
The perceptual correlate of temporal pain summation to repetitive pinprick stimuli (WUR) was assessed by a series of 10 pinprick stimuli (256 mN) with 1 Hz repetition rates. The participants were asked to give a pain rating representing the pain at the end of the stimuli series using the 0–100 NRS. The pain ratings to single pinprick stimulation were compared with those of 10 repeated stimuli. To determine the WUR, the ratio of the mean pain rating of the series divided by the mean pain rating of a single stimulus was calculated after five trials.
Vibration detection threshold (VDT)
VDT was measured using a standardized Rydel–Seiffer graded tuning fork (64 Hz, 8/8 scale) that was placed over a bony prominence (back: spinous processes of the vertebrae between L2 and L5, hand: ulnar styloid process) according to the protocol of DFNS.2,10,11 Volunteers reported the disappearance of the vibration. VDT was determined as the average of three consecutive measurements of the amount of time to disappearance.
Pressure pain threshold (PPT)
PPT was assessed over a muscle on the test areas (back: lumbar paraspinal, hand: pollicis muscles/thenar eminence) using a pressure gauge device (FDN200, Wagner Instruments, Greenwich, CT, USA) with a probe area of 1 cm2 and that exerts pressure up to 2000 kPa. The PPT was determined with three series of ascending stimulus intensities, each applied at an increasing ramp of 50 kPa/s.
Data analysis
QST data analysis was performed as recommended and described previously.2,10,12 The mean thresholds for each subject were calculated using Microsoft Excel (Microsoft Office 2013; Microsoft Corporation, Redmond, WA, USA). These results were summarized in a single-sheet QST report form for each subject and were used for further statistical analysis.
All QST parameters (except CPT, HPT, and VDT) were logarithmically transformed (base 10) to achieve a (secondary) normal distribution.10 A small constant (0.1) was added to pain ratings for pinprick (MPS) prior to log-transformation to avoid a loss of values due to zero rating.33 It has been already shown that QST parameters were normally (or log-normally) distributed in a healthy population.2
Analysis of reliability and agreement
The investigation of how similar two tests are is complex and reaches beyond the commonly used test–retest reliability.34 Following recommendations34 and previous methodology,27 we investigated the following: differences between measurements T1 and T2, correlations, intraclass correlation coefficients (ICCs), and Bland–Altman plots.
- Differences between measurements (T1 – T2): Quantitative differences between both QST sessions (T1 and T2) were investigated with paired samples t-test.
- Correlations between T1 and T2: Pearson’s product–moment correlation coefficient was used to determine the strength of correlation between T1 and T2. Correlation coefficients were interpreted as follows: |r| ≤0.29 negligible, 0.30–0.49 low, 0.50–0.69 moderate, 0.70–0.89 high, and >0.90 very high.35 Additionally, Tables S3 and S4 report the Pearson’s product–moment correlation coefficient for normally distributed QST parameters and Spearman’s rank correlation coefficient for nonnormally distributed parameters.
- IC coefficient (ICC): ICC was calculated using the two-way random-effects analysis of variance (ANOVA) model, type absolute agreement. The ICC values were interpreted as follows: ICC ≤0.20 slight, 0.21–0.40 fair, 0.41–0.60 moderate, 0.61–0.80 substantial, and >0.80 almost perfect.36
- Bland–Altman plots: Bland–Altman plots were used in order to assess the level of agreement between T1 and T2.31,37 These plots give a transparent visual presentation of potential bias of the data and the so-called LoAs.34 The plots display differences between both QST measurements (T1 – T2) against the mean values of both QST measurements (T1 + T2)/2) for each subject. These plots represent the average bias: if differences are systematically greater than zero, then the QST measurement in T1 is systematically higher than the QST measurement in T2; conversely, if differences are systematically less than zero, then the measurement in T1 is systematically lower than that in T2. The LoAs (mean differences ±1.96× SD) of the Bland–Altman plots were used as a central outcome for the determination of the agreement between the two QST assessments. These LoAs can be interpreted in the following way. If the study were to be repeated, the difference between measurements should lie within these limits in 95% of all cases. Conclusions about reliability should be drawn from the mean of differences (average bias) as well as the LoAs: if the differences are small (ie, the LoAs are small) and the mean of the differences is near zero, the test can be considered reliable.
In addition, the standard error of measurement (SEM) and the minimum detectable difference (MDD) were calculated. SEM was determined as the square root of the mean square error term from the repeated-measures ANOVA. The MDD was calculated using the following formula: MDD (SEM ×1.96×21/2).30,38
Confirming our findings of our primary statistical analysis, we performed an additional statistical analysis without outliers of each parameter (Tables S5 and S6, Figures S1 and S2). The outliers were defined as the values that were more than 1.5 × interquartile range (IQR) beyond the 25th and 75th percentiles.
All statistical calculations were performed using SPSS Statistics 22 (IBM Corporation, Armonk, NY, USA). We considered the analysis of each parameter as a separate hypothesis, and therefore, no adjustment for multiple comparisons was needed. Hence, the significance level was set to 0.05 for each statistical test. For the Bland–Altman plots, the software package R (version 3.2.4; R Core Team, Vienna, Austria) was used.
Results
All participants completed the study. Tables 2 and 3 show the results for the QST variables (log-transformed data for CDT, WDT, TSL, PPT, MPT, MPS, WUR, MDT, and raw data for CPT, HPT, and VDT) of the lower back and dominant hand for the total sample size (N=22). The results present the differences between the measurements T1 and T2, their mean, SD, and 95% CI of mean. In addition, the results of the statistical analysis of differences between both measurements (T1 and T2), correlations, ICCs, LoAs for the Bland–Altman plot, SEMs, and MDDs are reported (Tables 2 and 3).
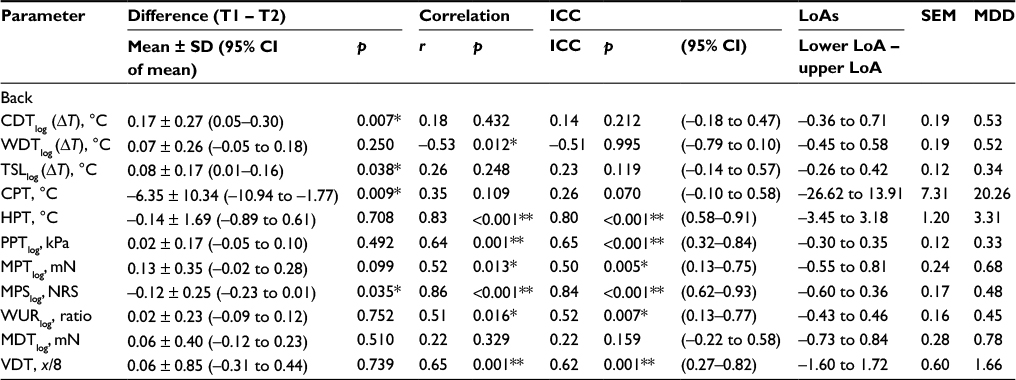 | Table 2 Statistical analysis of QST values for the lower back in healthy volunteers (N=22) Notes: QST parameters were logarithmically transformed (except for CPT, HPT, and VDT), according to recommendations of Rolke et al.2 Indexlog denotes QST parameters for which calculations are based on log-transformed data. T1, measurement session 1; T2, measurement session 2; ΔT, difference in temperature to the 32°C baseline; level of significance: *p≤0.05; **p≤0.001. Abbreviations: QST, quantitative sensory testing; N, number of participants; CDT, cold detection threshold; WDT, warm detection threshold; TSL, thermal sensory limen; CPT, cold pain threshold; HPT, heat pain threshold; PPT, pressure pain threshold; MPT, mechanical pain threshold; MPS, mechanical pain sensitivity; WUR, wind-up ratio; MDT, mechanical detection threshold; VDT, vibration detection threshold; NRS, numerical rating scale; ICC, intraclass correlation coefficient; LoA, limits of agreement according to Bland and Altman;31 MDD, minimum detectable difference. |
Additionally, we analyzed our data concerning outliers for each test parameter and for each test area (back and hand). Tables S5 and S6 outline the statistical analysis without outliers for all calculations (differences in terms of T1 – T2, correlations, ICCs, LoAs, SEM, and MDD). Furthermore, Tables S3 and S4 outline the correlation analysis by Pearson’s product–moment correlation (normal distribution) and the Spearman’s rank correlation (nonnormal distribution).
Differences between measurements (T1 – T2)
Back
The comparison of the means of T1 and T2 showed significant differences (p≤0.05) for CDT, TSL, CPT, and MPS (Table 2).
Hand
On the dominant hand dorsum, significant differences were observed for MPT only (Table 3).
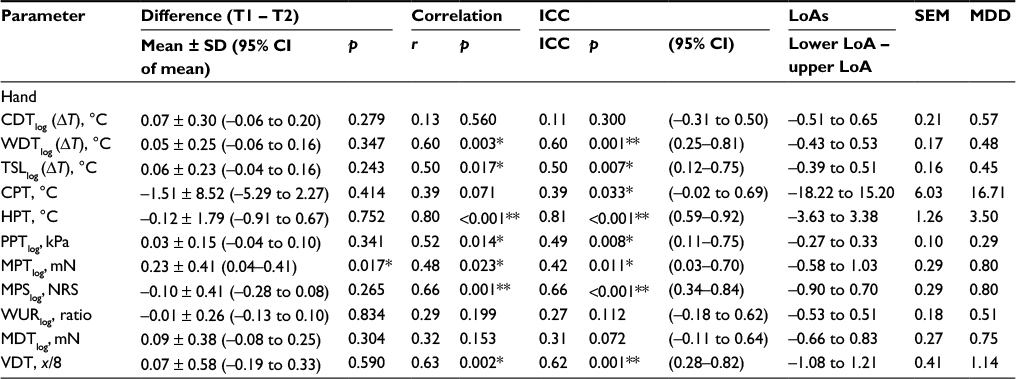 | Table 3 Statistical analysis of QST values for the dominant hand in healthy volunteers (N=22) Notes: QST parameters were logarithmically transformed (except for CPT, HPT, and VDT), according to recommendations of Rolke et al.2 Indexlog denotes QST parameters for which calculations are based on log-transformed data. T1, measurement session 1; T2, measurement session 2; ΔT, difference in temperature to the 32°C baseline; level of significance: *p≤0.05; **p≤0.001. Abbreviations: QST, quantitative sensory testing; N, number of participants; CDT, cold detection threshold; WDT, warm detection threshold; TSL, thermal sensory limen; CPT, cold pain threshold; HPT, heat pain threshold; PPT, pressure pain threshold; MPT, mechanical pain threshold; MPS, mechanical pain sensitivity; WUR, wind-up ratio; MDT, mechanical detection threshold; VDT, vibration detection threshold; NRS, numerical rating scale; ICC, intraclass correlation coefficient; LoA, limits of agreement according to Bland and Altman;31 MDD, minimum detectable difference. |
Correlations between T1 and T2
Back
The correlation analysis revealed significant high correlations (r≥0.70; p≤0.001) for HPT and MPS, as well as moderate correlations (r≥0.50; p≤0.013) for WDT, PPT, MPT, WUR, and VDT (Table 2).
Hand
A significant high correlation between T1 and T2 was shown for HPT (r=0.80; p<0.001; Table 3). Moderate correlations were found for WDT, TSL, PPT, MPS, and VDT (ranging from r=0.50 to r=0.66; all p<0.017). Lower, but still significant, correlation was found for MPT (r=0.48; p<0.023). Tables S3 and S4 outline the correlation analysis of QST on the lower back and on the dominant hand in healthy volunteers (N=22) according to the normal distribution.
ICC analysis
Back
The ICC analysis demonstrated an almost-perfect ICC for MPS (ICC: 0.84; p<0.001) at the lower back (Table 2). HPT, PPT, and VDT achieved substantial ICCs (ranging from ICC 0.62 to ICC 0.80; p≤0.001), and moderate ICCs were observed for MPT and WUR (ICC 0.50 and ICC 0.52; p≤0.011).
Hand
An almost-perfect ICC was shown for HPT (ICC 0.81; p<0.001), while the ICCs for MPS and VDT (ICC 0.66 and ICC 0.62; p≤0.001) were substantial. Moderate ICCs were observed for WDT, TSL, PPT, and MPT (ranging from ICC 0.42 to ICC 0.60; p≤0.011) on the hand dorsum (Table 3). Fair ICC was found for CPT (ICC =0.39; p≤0.033).
Bland–Altman plots
Figures 1 and 2 depict the Bland–Altman plots for all QST parameters. The LoAs of all parameters contained the number zero for all variables on lower back and hand dorsum.
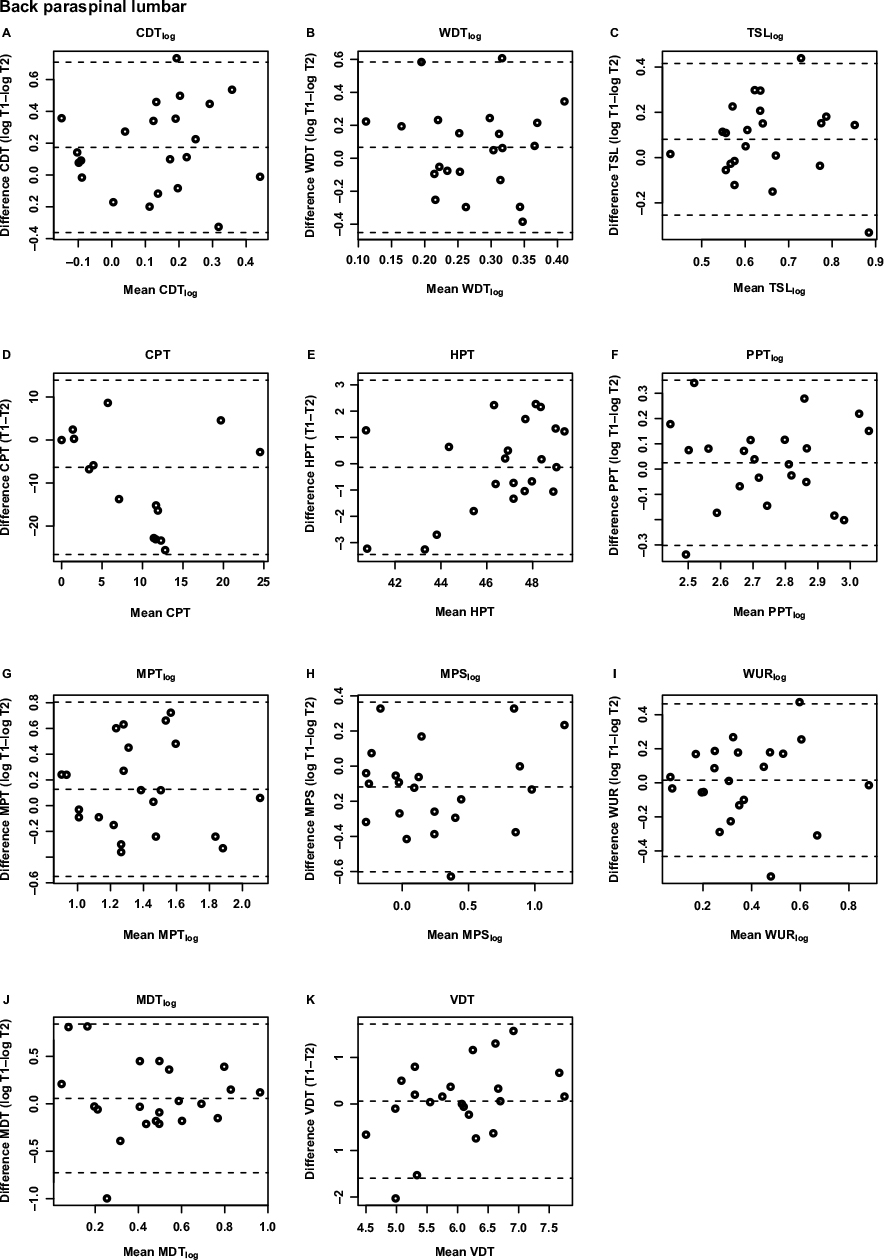 | Figure 1 Bland–Altman plots of the QST parameters for the lower back of healthy volunteers (N=22). Notes: (A) CDTlog; (B) WDTlog; (C) TSLlog; (D) CPT; (E) HPT; (F) PPTlog; (G) MPTlog; (H) MPSlog; (I) WURlog; (J) MDTlog; (K) VDT; T1, measurement session 1; T2, measurement session 2. Bland–Altman plots with the differences between T1 and T2 values (vertical axis) plotted against the mean of each T1 and T2 value (horizontal axis) of each participant. The middle horizontal dashed line represents the mean difference between T1 and T2 of all subjects; upper and lower dashed lines indicate the limits of agreement (upper and lower limits of agreement, mean difference ±1.96× SD). Abbreviations: CDT, cold detection threshold; WDT, warm detection threshold; TSL, thermal sensory limen; CPT, cold pain threshold; HPT, heat pain threshold; PPT, pressure pain threshold; MPT, mechanical pain threshold; MPS, mechanical pain sensitivity; WUR, wind-up ratio; MDT, mechanical detection threshold; VDT, vibration detection threshold. |
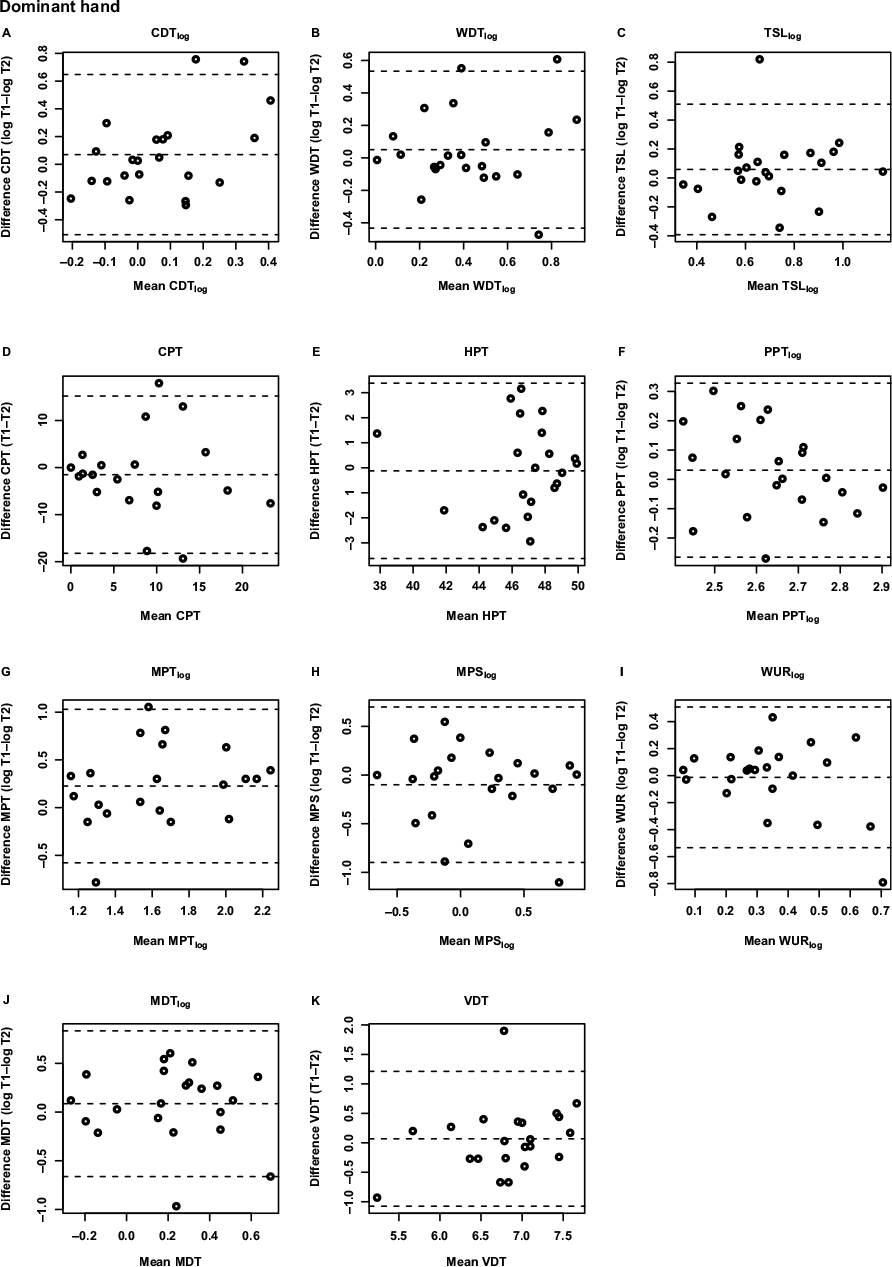 | Figure 2 Bland–Altman plots of the QST parameter for the dominant hand of healthy volunteers (N=22). Notes: (A) CDTlog; (B) WDTlog; (C) TSLlog; (D) CPT; (E) HPT; (F) PPTlog; (G) MPTlog; (H) MPSlog; (I) WURlog; (J) MDTlog; (K) VDT; T1, measurement session 1; T2, measurement session 2. Bland–Altman plots with the differences between T1 and T2 values (vertical axis) plotted against the mean of each T1 and T2 value (horizontal axis) of each participant. The middle horizontal dashed line represents the mean difference between T1 and T2 of all subjects; upper and lower dashed lines indicate the limits of agreement (upper and lower limits of agreement, mean difference ±1.96 × SD). Abbreviations: CDT, cold detection threshold; WDT, warm detection threshold; TSL, thermal sensory limen; CPT, cold pain threshold; HPT, heat pain threshold; PPT, pressure pain threshold; MPT, mechanical pain threshold; MPS, mechanical pain sensitivity; WUR, wind-up ratio; MDT, mechanical detection threshold; VDT, vibration detection threshold. |
Back
The LoAs varied substantially between QST parameters, being lowest for WUR (–0.27 to 0.35) and highest for the thermal pain thresholds (CPT: –26.62 to 13.91; HPT: –3.45 to 3.18).
Hand
The LoAs varied between the QST parameters, being the lowest for PPT (–0.27 to 0.33) and highest for the thermal pain threshold (CPT: –18.22 to 15.20; HPT: –3.63 to 3.38).
All QST values in original units (raw data) with mean, SD, 95% CI of mean, median, 25th and 75th percentiles for T1, T2, the differences of both measurements (T1 and T2), the SEM, and the MDD are presented in Tables S1 and S2 for the back and the hand, respectively.
SEM results
SEM and MDD are given in Tables 2 and 3 as complements to the reliability and agreement measures. These measures are important as they determine the clinically significant measures for each of the QST parameters. As can be seen in Tables 2 and 3, the SEM values were lower for the hand compared to those for the back for WDT, CPT, PPT, MDT, and VDT, indicating that these QST parameters are precise at the hand over a 10-week period. In contrast, the SEM values for CDT, TSL, HPT, MPT, MPS, and WUR are lower at the back compared to the hand, indicating that these parameters are more precise at the back than at the hand over the 10-week period.
Discussion
The primary aim of this study was to undertake a detailed analysis of reliability and agreement, with a time interval of 10 weeks, for the standardized QST procedure according to the German Research Network on Neuropathic Pain (DFNS). To our knowledge, the present study is the first indicating the normal variations for each parameter of the broadly used QST protocol of the DFNS2,8,10–12,14,39,40 over a standard intervention time (10 weeks). This helps to define ranges of normal variation to provide a basis for using QST as a tool in 10-week interventional trials and to assess interventional outcomes on an individual basis.
ICC values
High ICC values were found for some QST parameters, such as HPT, at the back. This is in accordance with previous reports.20,30 However, these findings were not confirmed in all of the available studies (eg, only fair reliability for CPT17,22). Wasner and Brock41 investigated three different measuring points and ascertained a better ICC for CPT for an interval of 1 day versus an interval of 21 days. Those results are in line with our findings on the CPT, showing lower reliabilities for a time interval of 10 weeks.
Moderate-to-substantial ICCs for the PPT on the hand and back over 10 weeks suggest that the mechanical QST parameters are stable over time. Previous studies reported good-to-excellent ICCs over short-term intervals for the PPT on the face, neck, forearm, finger, and knee.16,25,28,42 Andersen et al,43 who investigated QST changes before and 1 year after breast cancer surgery, describe a good reliability for MPT determined 1 week apart. One study revealed substantial reliability for VDT on the back and hand, as well as moderate reliability for MPS and slight reliability for WUR on the face.28 Felix and Widerstrom-Noga17 even showed an excellent ICC for VDT within a short-term interval, while good-to-excellent ICCs were reported for MDT.17,25 Overall, our results are in line with lower ICCs for the mechanical QST parameters, when tested over short-term intervals.38
In conclusion, test–retest reliability is sufficient for most of the QST measures.
Agreement
Our data show smaller as well as larger LoAs for different QST parameters. LoAs have been investigated only rarely with regard to QST parameters. Hirschfeld et al27 reported LoAs for repeated QST measures for the hands at the same day in a longitudinal investigation of developmental changes in somatosensation in children. Another study investigated some QST parameters in the course of breast cancer surgery, reporting the LoAs for forearm, leg, and breast.43 The reported LoA (Table 5 in the study by Andersen et al43) are larger or in the same range as our data. This is surprising as the time difference between QST examinations in our study was larger. Possible reasons for the narrower limits in our study might be due to the population examined (patients in some studies vs healthy subjects in our study) and the highly standardized procedures used in our laboratory (standardized QST protocol, standardized test instructions, meeting the extensive requirements for certification of our QST laboratory).44 While ICCs are often nonsignificant, LoAs exhibit rather favorably small and consistent 95% CIs, which appear to be counterintuitive. Bland–Altman plots (Figures 1 and 2) reveal that many of the individual QST values are located within a small interval, suggesting the existence of a mean value with a small, but random variation (eg, CPT on the lower back; Figure 1D). This lack of systematic variation alone is sufficient to explain the lack of a significant correlation. However, it is exactly this small data range of some of the QST parameters, particularly in healthy subjects, which makes QST a suitable measure to detect both deviations from the norm, as may be seen in patients,8,39,40 as well as changes induced by treatments. The question of how stable a measure is can be answered by analyzing how similar two measurements are, and this question is best answered by using the LoAs.45,46
SEM results
SEM as an absolute reliability index that reflects the agreement between repeated measures within each individual is suitable in interventional trials to calculate the MDD values for determining the sample sizes.30 To our knowledge, there is only one study30 providing SEMs for time intervals longer than 1 week for four QST parameters, namely, CPT, HPT, PPT, and WUR. Our SEM values are mainly in line with the results of Marcuzzi et al.30 Thus, our data confirm the lower SEM values at the hand for CPT and PPT, indicating that CPT and PPT are more precise when conducted at the hand than at the back. Accordingly, HPT showed lower SEM values at the back in comparison to the hand, both in our study and in the study by Marcuzzi et al.30 In contrast to that study,30 SEM values for WUR were higher at the hand in comparison to those of the back, indicating that WUR in our study is more precise at the back than at the hand. This difference cannot be explained by outliers (Tables S5 and S6).
As we used the comprehensive QST protocol of the DFNS network, we provide, for the first time, SEMs for all QST parameters expected. Our data indicate that SEM values for CDT, TSL, MPT, and MPS were lower at the back compared to those at the hand, indicating that these QST parameters are precise measures when conducted at the back over a 10-week period. In contrast, SEM values for WDT, MDT, and VDT were lower at the hand compared to the back for this period.
Future directions and limitations
Knowledge of the variability of QST parameters is a prerequisite to assess meaningful changes of any kind of intervention on these parameters (which should be larger than the variability). One strength of our study is the application of the comprehensive QST protocol, including detection thresholds (CDT, WDT, TSL, MDT, and VDT), as well as pain thresholds and related pain parameters (HPT, PPT, MPT, MPS, and WUR), over a period of 10 weeks. Our data indicate that QST parameters are suitable for individual monitoring over 10 weeks. Furthermore, our study provides a set of useful items to depict reliability and agreement. Beyond the estimation of effects from interventional trials, our data might contribute to the expression of a treatment effect on QST with regard to the LoAs. The data for each subtest may serve as the norms in order to evaluate the deviation of a patient’s value. The effects of an intervention would then be expressed as the possible change in the deviation, or, ideally, if the subject’s values lie within the LoAs after intervention, as normalization. The use of the LoAs would overcome some of the issues of all correlation-based measures, such as test–retest reliability, namely, that the absolute values may well decrease or increase over time, but as long as the ranking of the individual within the cohort is similar between the two measurements, the correlation is high. With regard to the estimation of a treatment effect, this phenomenon may represent a challenge. One example of a QST subtest where this could be relevant is the PPT, which has been shown to change from the first to the second measurement in particular, while still exhibiting high test–retest reliabilities.30,42 Even though we did not find such dramatic differences between T1 and T2, a similar trend was seen in our data. Here, the LoAs may be more suitable to detect an intervention-induced effect.
A DFNS-trained researcher (HN) performed the QST assessment in all subjects at both T1 and T2. Our approach was similar to a recent study on long-term reliability on some QST parameters,30 where one investigator performed the QST measurements. Since the aim of our study was to determine the stability (test–retest reliability and agreement) over longer periods under ideal conditions, we chose 1) a highly standardized protocol, namely, the DFNS protocol, 2) healthy, pain-free volunteers, and 3) one, highly trained investigator. The rationale for this approach was the assumption that, if QST did not show sufficient long-term reliability and agreement under these highly standardized conditions, further investigation of this research question would be obsolete as QST would not be a suitable measure for interventional trials on pain. Moreover, a highly standardized approach represents also the method of choice within a clinical trial. Nonetheless, it can be questioned whether such an approach achieves a sufficient degree of ecological validity for clinical practice, where often several clinicians perform the tests. However, this question was not the focus of the present study. It would be of interest to assess the interrater long-term reliability, similarly to short-term reliability.29
Generally, our results as well as the data from Marcuzzi et al30 do not necessarily reflect the results from literature discussed herein. Both studies investigate healthy volunteers, while the results on reliability and agreement in most of the studies are derived from patient populations, or, as in the case of the data from Hirschfeld et al,27 from somewhat atypical populations such as children. Thus, generalizability of our results to a patient population remains to be confirmed. Similar to the data of Marcuzzi et al,30 some of the QST parameters seem to show considerable adjustments over time and it remains unclear whether this is an effect related to learning. Since Marcuzzi et al30 found the strongest differences between T1 and T2, it may be recommended to assess two baseline measurements in a clinical trial setting, in order to avoid a confounding effect within the treatment phase of the trial.
Even though our results are to a large extent in line with a recent published study with a larger sample,30 one relevant limitation of this study is its small sample size (N=22). Nonetheless, assuming a power of 80%, large effects with Cohen’s d>0.6 could be sufficiently detected by our study. Our study asks whether QST is suitable for monitoring individuals over 10 weeks, which might be useful for monitoring the effects of interventions in clinical trials on pain. Within a clinical trial, the most relevant question is whether the difference found between two interventions is clinically meaningful. This is usually measured with a visual analogue scale or other markers as main outcomes, directly related to the patients’ experience of pain. A clinically meaningful effect may well represent a 30%–50% change of the main outcome with regard to baseline,47 which can be considered a strong effect. The power of a clinical trial may be increased by investigating a large number of patients, so that smaller changes also of the main outcomes, eg, a 10% change from baseline, become statistically significant. Such a trial would be able to detect small effect sizes. However, the results, even though statistically significant, would clinically not be relevant. In conclusion, within a clinical trial setting, the achieved power may well be sufficient to detect a clinically significant change. However, further studies, in particular within relevant patient groups, are urgently needed.
There are some technological limitations. These limitations are inherent to the equipment and not related to the particular protocol used. The CPT normally has a cutoff temperature of 0°C. Some participants do not push the button before the thermode stops the cooling automatically, which means no painful cold experience is reported. Frey filaments are limited in their range from 0.25 mN to 512 mN.2,10 Some healthy participants are able to detect the thinnest hair with a force of 0.25 mN. These limitations may induce a ceiling effect.
To date, test–retest reliability and agreement of QST are inconclusive. Inconsistent results ranging from poor reliability to excellent reliability are related to lack of standardization of the procedures, including the use of different equipments, algorithms, populations, and statistical methods.5 Moreover, studies are often selective in their use of tests, investigating the reliability of only thermal QST modalities20,22,41 or of some selected parameters of the QST.17,25,43 The time interval is also rather inconsistent and ranges from 3 days to 3 weeks.17,20,22,25,43 To avoid the standardization issues, we followed the standard QST protocol according to the German Research Network on Neuropathic Pain (DFNS)2,10 and used an interval similar to that often used in clinical trials on pain.
A major problem is that the synonymous use of the terms reliability and agreement is inappropriate.48 The different statistical approaches make a comparative interpretation of results almost impossible. A critical review on test–retest studies in QST identified considerable heterogeneity in statistical evaluations and recommends minimal methodological requirements and a protocol for reporting test–retest data.34
Conclusion
This study presents test–retest data, SEMs, MDDs, and LoAs for two highly standardized QST measurements for the comprehensive QST protocol over a period of 10 weeks. With regard to the additionally tested retest reliability, the results are generally in line with recently published data.30 Our data constitute the first step to define LoAs for each subtest of the standardized QST. Such data are a prerequisite when QST should serve as a basis for interventional trials as an outcome, which might be relevant for clinical research.
Acknowledgments
Jan Vollert is acknowledged for his help in statistical analysis of the QST data. We thank all the healthy volunteers for their participation in our study.
Disclosure
The authors report no conflicts of interest in this work.
References
Pavlakovic G, Petzke F. The role of quantitative sensory testing in the evaluation of musculoskeletal pain conditions. Curr Rheumatol Rep. 2010;12(6):455–461. | ||
Rolke R, Baron R, Maier C, et al. Quantitative sensory testing in the German Research Network on Neuropathic Pain (DFNS): standardized protocol and reference values. Pain. 2006;123(3):231–243. | ||
Vollert J, Attal N, Baron R, et al. Quantitative sensory testing using DFNS protocol in Europe: an evaluation of heterogeneity across multiple centers in patients with peripheral neuropathic pain and healthy subjects. Pain. 2016;157(3):750–758. | ||
Backonja MM, Attal N, Baron R, et al. Value of quantitative sensory testing in neurological and pain disorders: NeuPSIG consensus. Pain. 2013;154(9):1807–1819. | ||
Chong PS, Cros DP. Technology literature review: quantitative sensory testing. Muscle Nerve. 2004;29(5):734–747. | ||
Cruccu G, Sommer C, Anand P, et al. EFNS guidelines on neuropathic pain assessment: revised 2009. Eur J Neurol. 2010;17(8):1010–1018. | ||
Shy ME, Frohman EM, So YT, et al; Therapeutics and Technology Assessment Subcommittee of the American Academy of Neurology. Quantitative sensory testing: report of the therapeutics and technology assessment subcommittee of the American Academy of Neurology. Neurology. 2003;60(6):898–904. | ||
Puta C, Schulz B, Schoeler S, et al. Somatosensory abnormalities for painful and innocuous stimuli at the back and at a site distinct from the region of pain in chronic back pain patients. PLoS One. 2013;8(3):e58885. | ||
Spohn D, Musial F, Rolke R. Naturopathic reflex therapies for the treatment of chronic pain – part 2: quantitative sensory testing as a translational tool. Forsch Komplementmed. 2013;20(3):225–230. | ||
Rolke R, Magerl W, Campbell KA, et al. Quantitative sensory testing: a comprehensive protocol for clinical trials. Eur J Pain. 2006;10(1):77–88. | ||
Magerl W, Krumova EK, Baron R, Tolle T, Treede RD, Maier C. Reference data for quantitative sensory testing (QST): refined stratification for age and a novel method for statistical comparison of group data. Pain. 2010;151(3):598–605. | ||
Pfau DB, Krumova EK, Treede RD, et al. Quantitative sensory testing in the German Research Network on Neuropathic Pain (DFNS): reference data for the trunk and application in patients with chronic postherpetic neuralgia. Pain. 2014;155(5):1002–1015. | ||
Vollert J, Mainka T, Baron R, et al. Quality assurance for quantitative sensory testing laboratories: development and validation of an automated evaluation tool for the analysis of declared healthy samples. Pain. 2015;156(12):2423–2430. | ||
Maier C, Baron R, Tölle TR, et al. Quantitative sensory testing in the German Research Network on Neuropathic Pain (DFNS): somatosensory abnormalities in 1236 patients with different neuropathic pain syndromes. Pain. 2010;150(3):439–450. | ||
Agostinho CM, Scherens A, Richter H, et al. Habituation and short-term repeatability of thermal testing in healthy human subjects and patients with chronic non-neuropathic pain. Eur J Pain. 2009;13(8):779–785. | ||
Cathcart S, Pritchard D. Reliability of pain threshold measurement in young adults. J Headache Pain. 2006;7(1):21–26. | ||
Felix ER, Widerstrom-Noga EG. Reliability and validity of quantitative sensory testing in persons with spinal cord injury and neuropathic pain. J Rehabil Res Dev. 2009;46(1):69–83. | ||
Heldestad V, Linder J, Sellersjo L, Nordh E. Reproducibility and influence of test modality order on thermal perception and thermal pain thresholds in quantitative sensory testing. Clin Neurophysiol. 2010;121(11):1878–1885. | ||
Jones DH, Kilgour RD, Comtois AS. Test-retest reliability of pressure pain threshold measurements of the upper limb and torso in young healthy women. J Pain. 2007;8(8):650–656. | ||
Knutti IA, Suter MR, Opsommer E. Test-retest reliability of thermal quantitative sensory testing on two sites within the L5 dermatome of the lumbar spine and lower extremity. Neurosci Lett. 2014;579:157–162. | ||
Lowenstein L, Jesse K, Kenton K. Comparison of perception threshold testing and thermal-vibratory testing. Muscle Nerve. 2008;37(4):514–517. | ||
Moloney NA, Hall TM, O’Sullivan TC, Doody CM. Reliability of thermal quantitative sensory testing of the hand in a cohort of young, healthy adults. Muscle Nerve. 2011;44(4):547–552. | ||
Moloney NA, Hall TM, Doody CM. Reliability of thermal quantitative sensory testing: a systematic review. J Rehabil Res Dev. 2012;49(2):191–208. | ||
Peltier A, Smith AG, Russell JW, et al. Reliability of quantitative sudomotor axon reflex testing and quantitative sensory testing in neuropathy of impaired glucose regulation. Muscle Nerve. 2009;39(4):529–535. | ||
Wylde V, Palmer S, Learmonth ID, Dieppe P. Test-retest reliability of quantitative sensory testing in knee osteoarthritis and healthy participants. Osteoarthritis Cartilage. 2011;19(6):655–658. | ||
Gehling J, Mainka T, Vollert J, Pogatzki-Zahn EM, Maier C, Enax-Krumova EK. Short-term test-retest reliability of conditioned pain modulation using the cold-heat-pain method in healthy subjects and its correlation to parameters of standardized quantitative sensory testing. BMC Neurol. 2016;16:125. | ||
Hirschfeld G, Zernikow B, Kraemer N, et al. Development of somatosensory perception in children: a longitudinal QST-study. Neuropediatrics. 2012;43(1):10–16. | ||
Pigg M, Baad-Hansen L, Svensson P, Drangsholt M, List T. Reliability of intraoral quantitative sensory testing (QST). Pain. 2010;148(2):220–226. | ||
Geber C, Klein T, Azad S, et al. Test-retest and interobserver reliability of quantitative sensory testing according to the protocol of the German Research Network on Neuropathic Pain (DFNS): a multi-centre study. Pain. 2011;152(3):548–556. | ||
Marcuzzi A, Wrigley PJ, Dean CM, Adams R, Hush JM. The long-term reliability of static and dynamic quantitative sensory testing in healthy individuals. Pain. 2017;158(7):1217–1223. | ||
Bland JM, Altman DG. Agreed statistics: measurement method comparison. Anesthesiology. 2012;116(1):182–185. | ||
Baumgärtner U, Magerl W, Klein T, Hopf HC, Treede RD. Neurogenic hyperalgesia versus painful hypoalgesia: two distinct mechanisms of neuropathic pain. Pain. 2002;96(1–2):141–151. | ||
Magerl W, Wilk SH, Treede RD. Secondary hyperalgesia and perceptual wind-up following intradermal injection of capsaicin in humans. Pain. 1998;74(2–3):257–268. | ||
Werner MU, Petersen MA, Bischoff JM. Test-retest studies in quantitative sensory testing: a critical review. Acta Anaesthesiol Scand. 2013;57(8):957–963. | ||
Mukaka MM. Statistics corner: a guide to appropriate use of correlation coefficient in medical research. Malawi Med J. 2012;24(3):69–71. | ||
Landis JR, Koch GG. The measurement of observer agreement for categorical data. Biometrics. 1977;33(1):159–174. | ||
Bland JM, Altman DG. Statistical methods for assessing agreement between two methods of clinical measurement. Lancet. 1986;1(8476):307–310. | ||
Weir JP. Quantifying test-retest reliability using the intraclass correlation coefficient and the SEM. J Strength Cond Res. 2005;19(1):231–240. | ||
Franz M, Spohn D, Ritter A, Rolke R, Miltner WH, Weiss T. Laser heat stimulation of tiny skin areas adds valuable information to quantitative sensory testing in postherpetic neuralgia. Pain. 2012;153(8):1 687–1694. | ||
Puta C, Schulz B, Schoeler S, et al. Enhanced sensitivity to punctate painful stimuli in female patients with chronic low back pain. BMC Neurol. 2012;12:98. | ||
Wasner GL, Brock JA. Determinants of thermal pain thresholds in normal subjects. Clin Neurophysiol. 2008;119(10):2389–2395. | ||
Walton DM, Levesque L, Payne M, Schick J. Clinical pressure pain threshold testing in neck pain: comparing protocols, responsiveness, and association with psychological variables. Phys Ther. 2014;94(6):827–837. | ||
Andersen KG, Kehlet H, Aasvang EK. Test-retest agreement and reliability of quantitative sensory testing 1 year after breast cancer surgery. Clin J Pain. 2015;31(5):393–403. | ||
Geber C, Scherens A, Pfau D, et al. Zertifizierungsrichtlinien für QST-Labore. [Procedure for certification of QST laboratories]. Schmerz. 2009;23(1):65–69. German. | ||
Bartlett JW, Frost C. Reliability, repeatability and reproducibility: analysis of measurement errors in continuous variables. Ultrasound Obstet Gynecol. 2008;31(4):466–475. | ||
de Vet HC, Terwee CB, Knol DL, Bouter LM. When to use agreement versus reliability measures. J Clin Epidemiol. 2006;59(10):1033–1039. | ||
Turner JA, Turk DC. The significance of clinical significance. Pain. 2008;137(3):467–468. | ||
Kottner J, Audige L, Brorson S, et al. Guidelines for reporting reliability and agreement studies (GRRAS) were proposed. Int J Nurs Stud. 2011;48(6):661–671. |
 © 2017 The Author(s). This work is published and licensed by Dove Medical Press Limited. The
full terms of this license are available at https://www.dovepress.com/terms
and incorporate the Creative Commons Attribution
- Non Commercial (unported, 3.0) License.
By accessing the work you hereby accept the Terms. Non-commercial uses of the work are permitted
without any further permission from Dove Medical Press Limited, provided the work is properly
attributed. For permission for commercial use of this work, please see paragraphs 4.2 and 5 of our Terms.
© 2017 The Author(s). This work is published and licensed by Dove Medical Press Limited. The
full terms of this license are available at https://www.dovepress.com/terms
and incorporate the Creative Commons Attribution
- Non Commercial (unported, 3.0) License.
By accessing the work you hereby accept the Terms. Non-commercial uses of the work are permitted
without any further permission from Dove Medical Press Limited, provided the work is properly
attributed. For permission for commercial use of this work, please see paragraphs 4.2 and 5 of our Terms.