Back to Journals » Integrated Pharmacy Research and Practice » Volume 10
How is Information from ABC–VED–FNS Matrix Analysis Used to Improve Operational Efficiency of Pharmaceuticals Inventory Management? A Cross-Sectional Case Analysis
Received 11 March 2021
Accepted for publication 31 May 2021
Published 24 June 2021 Volume 2021:10 Pages 65—73
DOI https://doi.org/10.2147/IPRP.S310716
Checked for plagiarism Yes
Review by Single anonymous peer review
Peer reviewer comments 2
Editor who approved publication: Professor Jonathan Ling
Tafesse Gizaw,1 Awol Jemal2
1Quantification and Market Shaping Office, Ethiopian Pharmaceuticals Supply Agency, Jimma, Ethiopia; 2Department of Social and Administrative Pharmacy, School of Pharmacy, Institute of Health, Jimma University, Jimma, Ethiopia
Correspondence: Tafesse Gizaw
Quantification and Market Shaping Office, Ethiopian Pharmaceuticals Supply Agency, PO Box 359, Jimma, Ethiopia
Tel +251910550003
Email [email protected]
Purpose: The categorization of inventories using various techniques optimizes the efficiency of warehouse operations. The ABC (always, better, and control); VED (vital, essential, and desirable); and FNS (fast-, normal-, and slow-moving) analyses provide items according to cost significance, criticality value, and consumption rate respectively. Thus, this study aimed to identify the categories of items requiring focused managerial control, priority, and replenishment intervals, as well as to evaluate whether the ABC–VED–FNS matrix is fit for effective and efficient inventory control of the Ethiopian Pharmaceutical Supply Agency (EPSA).
Methods: An institution-based cross-sectional descriptive study was conducted on 393 pharmaceuticals distributed by the EPSA-Jimma hub. The annual sales list with respective total quantity and unit price was collated from the logistics data records to perform the ABC analysis. The VED data were generated from the agency’s pharmaceutical procurement list. To perform FNS analysis, we take into account the number of issue transactions as well as the average monthly consumption pattern for each item. Microsoft office Excel 2013 statistical functions were used to analyse the collated data.
Results: The ABC-VED analysis revealed that 187 (47.58%) of category I items account for 90% annual sales value; of which the highest proportion (63%) was AV items (36, 9%). Remarkably, there was no desirable (D) commodity that belongs to Class A. From the ABC–VED–FNS matrix analysis, category I consisted of 12 combinations with 187 (47.6%) items. Moreover, 28 (7.13%) items (CDN = 4 and CDS = 24) constituted category-III.
Conclusion and Recommendation: The ABC–VED–FNS matrix analysis can help organization implement inventory control policies and techniques, narrow down a group of items that require more managerial monitoring and control, prioritize a storage location (pick-face) plan, minimize the time and labor cost of put-away, picking, and packing, and dictate when products should be reordered or replenished.
Keywords: ABC–VED–FNS matrix analysis, operational efficiency, pharmaceuticals inventory management, Ethiopian pharmaceuticals supply agency
Introduction
As a part of the logistics system, pharmaceutical inventory management is a process of controlling the storage and distribution of pharmaceuticals from source of supply to storage facilities and from these facilities to point-of-sales at the lowest possible cost.1–3 Being the core process of the pharmaceuticals logistics system, inventory management involves ordering, receiving, storing, issuing, and reordering of products to maintain proper stock to meet customers’ requests.4,5 An efficient and effective inventory management avoids overstocking, under-stocking, and stock-outs; minimizes wastage of product from damage and expiry; decreases the inventory holding cost; simplifies inventory control decision making, and aids demand forecasting.6,7
Inherent uncertainties in demand and supply make inventory unpredictable for the pharmaceuticals logistics system.7–13 More than half of an organization’s working capital will normally be spent in the inventory.14–16 Without well-planned inventory control techniques, the proactive management of large inventories becomes a tedious task, resulting in rapidly increasing inventory levels combined with critical shortages of vital items.4,6,17 In view of that, it has become imperative for pharmaceutical companies to use efficient inventory control techniques to track the flow of products and maintain an optimum inventory to serve customers.4,5,18
Inventories can be classified by various techniques to optimize the operating efficiency of warehouse operations and the cost of investment. The commonly described inventory control techniques are the ABC (Always, Better, and Control); VED (Vital, Essential and Desirable), FNS (Fast, Normal, and Slow-moving), XYZ (based on value of items on storage), SDE (Scarce, Difficult, and Easy to obtain), and HML (High, Medium, and Low unit price of the material) categorization methods.11,17,19 In this study, we focused on the first three techniques.
The ABC analysis (the Pareto principle of the “80/20 rule”) is a method of classifying inventory based on annual inventory value to identify which items account for the greatest proportion of the budget. The analysis classifies the items into three categories: the first 10–20% of the low-quantity items that account for the 70–80% cumulative cost (category A items); category B items make up the next group of items (10–20%) that account for a further 15–20% of the cumulative value, and the remaining 60–80% are category C items - consist of low-value and high-quantity items - amounting for 5–10% of the total cost.6,11,14,15,20–23
The ABC analysis is based on annual sales with a priority on controlling the inventory levels of high-sales items. Some pharmaceuticals, still negligible in monetary value, maybe vital for service providers necessitating frequent attention. Thus, the importance of these items cannot be ignored simply because they are not in “category A” high-value goods. Therefore, an additional parameter of assessment is product criticality by VED analysis. The VED analysis prioritizes items based on critical service values and the item’s shortage cost. The method is used to categorize items into three groups: vital, essential, and desirable. Vital items (V) are potentially life-saving, crucial for basic services, and a stock-out, even for a short period of time, will halt service provision with the cost of stock-out being very high. The items that may be somehow substituted and which are essential for the service to continue being recognized as essentials items (E). Desirable items (D) are items that are needed but their absence for even a week will not lead to a stoppage of services.5,6,16,20
The items in the inventory can be classified as Fast-moving (F), Normal-moving (N), and Slow-moving (S) based on the consumption pattern or average stay of item in the warehouse as well as issue counts. F-items comprise products that transact in and out of stock most often and they have the highest consumption rate. N-items consist of inventories with moderate transactions and consumption rates. The slow-moving category encompasses the least moving portion of inventory and it may also include dead stocks.2,16,24
Optimized inventory meets customer demand with the desired service level while lowering related costs.7,23 Inventory management decisions, on the other hand, continue to be a weak link in service provision of developing countries such as Ethiopia. In the country’s public pharmaceutical supply system, inefficiency in inventory management contributes to the tying up of resources in slow-moving stock, shortages (stock-out) of some essential medicines, or overstocks of others, resulting in expiration and a decline in healthcare quality.25,26 The country’s largest hospital, Tikur Anbessa specialized hospital, found that less than 5% of medicines consumed more than 75% of the total drug budget, indicating the necessity for effective inventory systems.22
The objective of this study is to identify the types of items that require focused managerial control, priority, and replenishment intervals, as well as to evaluate whether the ABC–VED–FNS matrix is fit for effective and efficient inventory control of the Ethiopian Pharmaceuticals Supply Agency (EPSA).
Materials and Methods
Study Context
The research was carried out at the EPSA Jimma hub. Jimma is located in the southwest part of Oromia Regional State, about 350 kilometers from Ethiopia’s capital, Addis Ababa. Jimma hub, one of Ethiopia’s 19 EPSA hubs, is the responsible governmental organization with the mandate of providing quality pharmaceuticals in a sustainable manner to approximately 9.2 million people. The hub distributes health program commodities (donated in kind or purchased by international agencies) as well as purchased commodities (revolving drug fund – RDF) to public health facilities, private hospitals, drugstores, and private pharmacies.
The agency uses a Minimum-Maximum (Min-Max) inventory system that requires forced ordering. The Min-Max system enables objective resupply decisions based on need and takes established levels of safety stock into account. In forced-ordering, requests are placed at regular intervals; all products are ordered/resupplied to the maximum stock level. The trigger for ordering is the end of the review period. Inventory managers must be careful not to run out of stock. Therefore, in addition to applying the decision rule for ordering, they are given emergency order points. To manage warehousing and inventory management activities, the agency employs electronic health commodity management information system (HCMIS) software.27
Study Design and Period
A retrospective cross-sectional descriptive study was conducted between July 7 and October 9, 2020.
Source Population
The source population included all healthcare commodities managed by the EPSA Jimma hub and the HCMIS.
Study Population
The study population included all RDF commodities distributed by Jimma hub, the HCMIS, and the bin-cards used to track RDF commodities transactions in the 2019/2020 fiscal year (between August 2019 and June 2020). In Ethiopia, annual stock verification is usually done in July. As a result, the study took 11 months of transaction data into account in the fiscal year.
Study Units
All RDF commodities handled by the EPSA Jimma hub were included in the study. The analysis takes into account RDF commodities issued (distributed) to service delivery points in the 2019/20 fiscal year (FY). We gave all RDF commodities the same opportunity to take part in this study.
Inclusion and Exclusion Criteria
For the 2019/20 FY transactions, analyses of RDF transactions data from the electronic HCMIS and bin-cards were performed. Due to their capital cost nature, we excluded sales transactions involving medical equipment.
Data Collection Procedure and Instrument
The annual sales list with respective total quantity, unit price, frequency of issue transaction counts, and days out of stock in 2019/20 FY were collected from the electronic HCMIS and stock-keeping records (bin cards). The EPSA-Jimma hub’s pharmaceutical report and requisition list was used to generate VED data. The list is the result of a series of stakeholder consultations with relevant public health experts. A structured data abstraction format in a Microsoft office Excel 2013 was adapted from management science for Health to collect the required data.23
Data Analysis
Microsoft Excel was used to compile the data. The descriptive analysis was carried out with the help of the Excel statistical functions.
The procedures undertaken in our study to categorize ABC–VED–FNS analysis and matrix involve the following steps:
Step 1: The ABC classification was computed based on the total annual sales values. The total price (multiplying total quantity by unit price) was calculated for each item and rearranged in descending order by total value. We computed the percentage of the total cost, the cumulative percentage by costs and items. The cut-off points for class A, B, and C were determined based on the Pareto principle.
Step 2: We inserted the VED category of each item in the product sales list.
Step 3: The ABC and VED analyses were combined by cross-tabulation to get an ABC/VED matrix. From the resulting matrix, three categories were framed (I, II, and III). Category I consists of products belonging to either the A or V groups (AV, AE, AD, BV, and CV subcategories) for focused managerial control since these items are expensive or vital; category II consists of the BE, BD, and CE subcategories, and category III consists of the remaining items in the CD subcategory.
Step 4: In FNS Analysis, we consider the number of issue transactions, annual sales quantity, and the average monthly consumption (AMC) for each item. The AMC was computed by dividing the total quantity sold by the number of months the item is available in the warehouse for the 2019/20 FY. The lists of items were sorted in a descending order based on the AMC values. Then, we computed the 15th, 30th, and 45th percentiles from the AMC data.28 The highest AMC items in the inventory (issue transaction counts greater than 200 and AMC values greater than the 15th percentile) are classified as Fast-moving items, items which are moderately issued (AMC values between 15th and 45th percentile and issue counts between 50–199) to customers denoted as Normal-moving items, and the remaining items with the lowest number of issue counts (< 50 issue counts in a year) and the AMC values less than the 45th percentile were denoted as Slow-moving products.
Step 5: The ABC–VED–FNS matrix analysis was framed by concatenating the ABC, VED, and FNS analysis. The resulting 27 combinations (3*3*3) are grouped into three (3) major categories. Category I comprises of items belonging to category “A” or “V” with “FNS” matrices; the BE, BD, and CE with “FNS” matrices constituted category II, and the other items in the CDF, CDN and CDS matrix constituted category-III. In these matrices, the first alphabet represents its place in the ABC analysis, the second alphabet stands for its place in the VED analysis, while the third alphabet stands for FNS analysis. The results were presented using tables and charts.
Results
ABC Analysis
The result of the analysis indicated that 393 items were transacted in the 2019/20 FY to the customers. The findings (Figure 1) shows that 58 (14.8%) items were found to be Class A, 78 (19.8%) items belong to Class B, and 257 (65.4%) items belong to Class C. The analysis indicated that only 58 (14.8%) items accounted for 79.9% of ASV (A-class items) whereas, 257 (65.4%) items accounted for only 6% of ASV (C-class items).
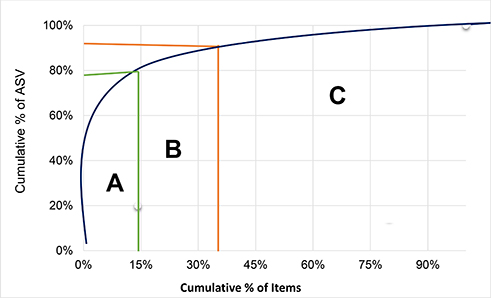 |
Figure 1 ABC analysis by cumulative curve, 2020 (N = 393 items). |
VED Analysis
The findings in Table 1 revealed that 165 (42%) of the items were Vital, 194 (49%) items classified as Essential and only 34 (9%) of the items classified as the desirable items. Interestingly, vital items constituted most of the annual sales value (73%) and desirable items only 2% of the annual sales value.
 |
Table 1 ABC, and VED Analysis and ABC-VED Matrix Analysis of the EPSA Pharmaceuticals (N = 393) |
ABC-VED Matrix
ABC and VED analyses of 393 items revealed that 36 (9%), 42 (11%), and 87 (22%) of AV, BV, and CV category items account for 63%, 8%, and 2% annual sales value respectively. There was no desirable (D) commodity that belongs to Class A.
The study explored three categories that would require different inventory control techniques. Category I Commodities (AV, AE, BV and CV) making a total of 187 (47.58%) items amounted to 90% ASV. The category II Commodities (BE, CE and BD) with a total of 178 (45.29%) items accounted for 9% ASV. The least priority items (Category III) comprises CD with 28 (7.13%) items accounted for only 1% ASV (Table 1).
FNS Analysis
We undertake FNS analysis based on the number of issue transactions and the average monthly consumption for each item. We employed the 15th and 45th percentiles to determine the cut-off points. The analyses revealed 60 (15.30%) products were classified as Fast-moving items accounted for 73.1% in ASV in the FY. One hundred-twelve (28.5%) items were Normal-moving items amounted to 20.30% ASV in the 2019/20 FY. About 221 (56.20%) items were Slow-moving items with an ASV of 6.6% (Table 2).
 |
Table 2 FNS Analysis of Pharmaceuticals in the Study Area, 2020 (N = 393) |
ABC–VED–FNS Matrix Analyses
Having concatenated the three different inventory classification techniques (ABC, VED, and FNS classification) to generate a coupled matrix, the 27 different combinations were grouped into three main categories (I, II, and III). From the resulting matrix, category I consisted of 12 sub-groups (AVF, AVN, AVS, AEF, AEN, AES, BVF, BVN, BVS, CVF, CVN, and CVS) with 187 (47.6%) items whereas 28 (7.13%) items in the CDN and CDS matrix constituted category-III (Table 3).
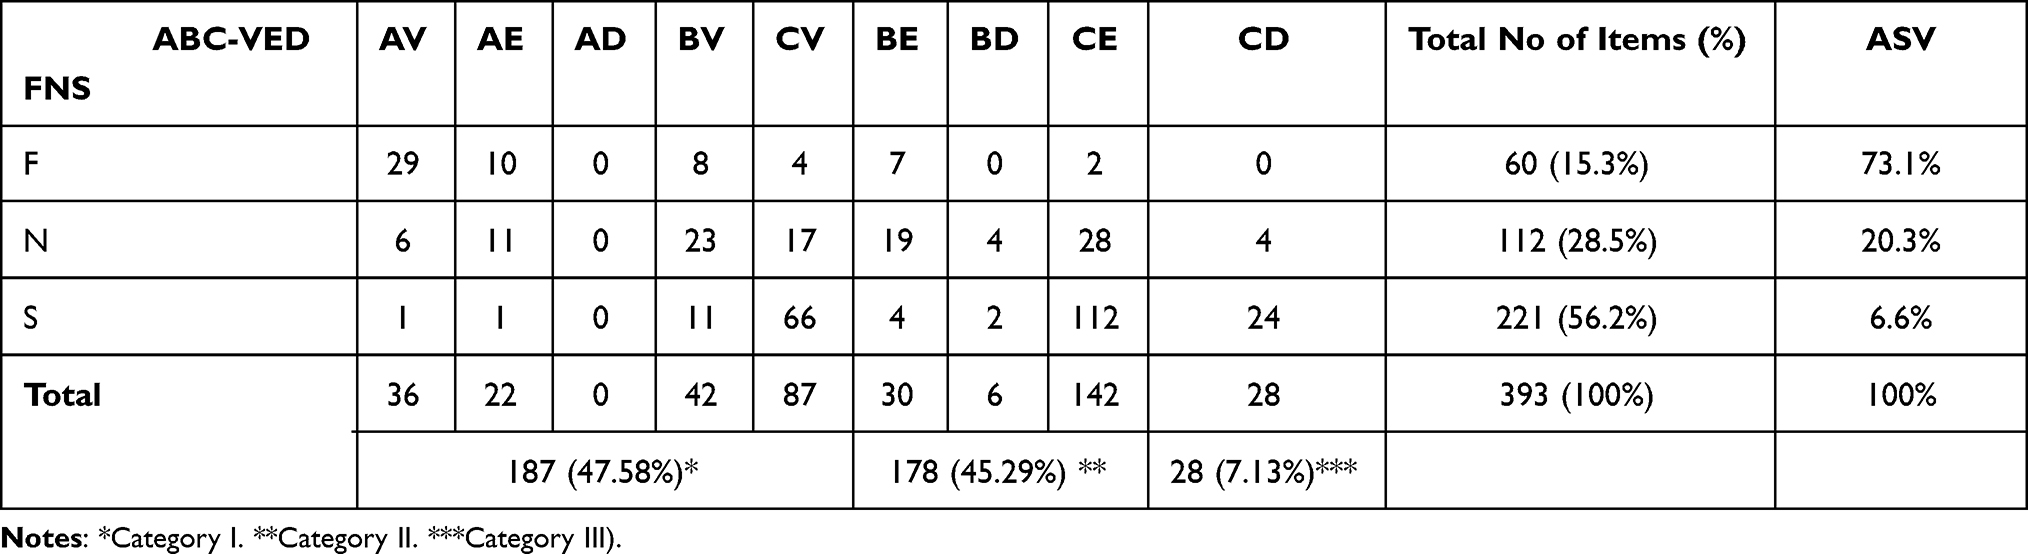 |
Table 3 ABC, VED, and FNS Analysis and ABC–VED–FNS Matrix Analysis in the Study Area (N = 393) |
Table 4 shows that the maximum issue frequency in a fiscal year is 838 times. The inventory managers should pay particular attention for managing the 29 AVF inventories storage, order size, and movement to ensuring availability and minimizing wastage.
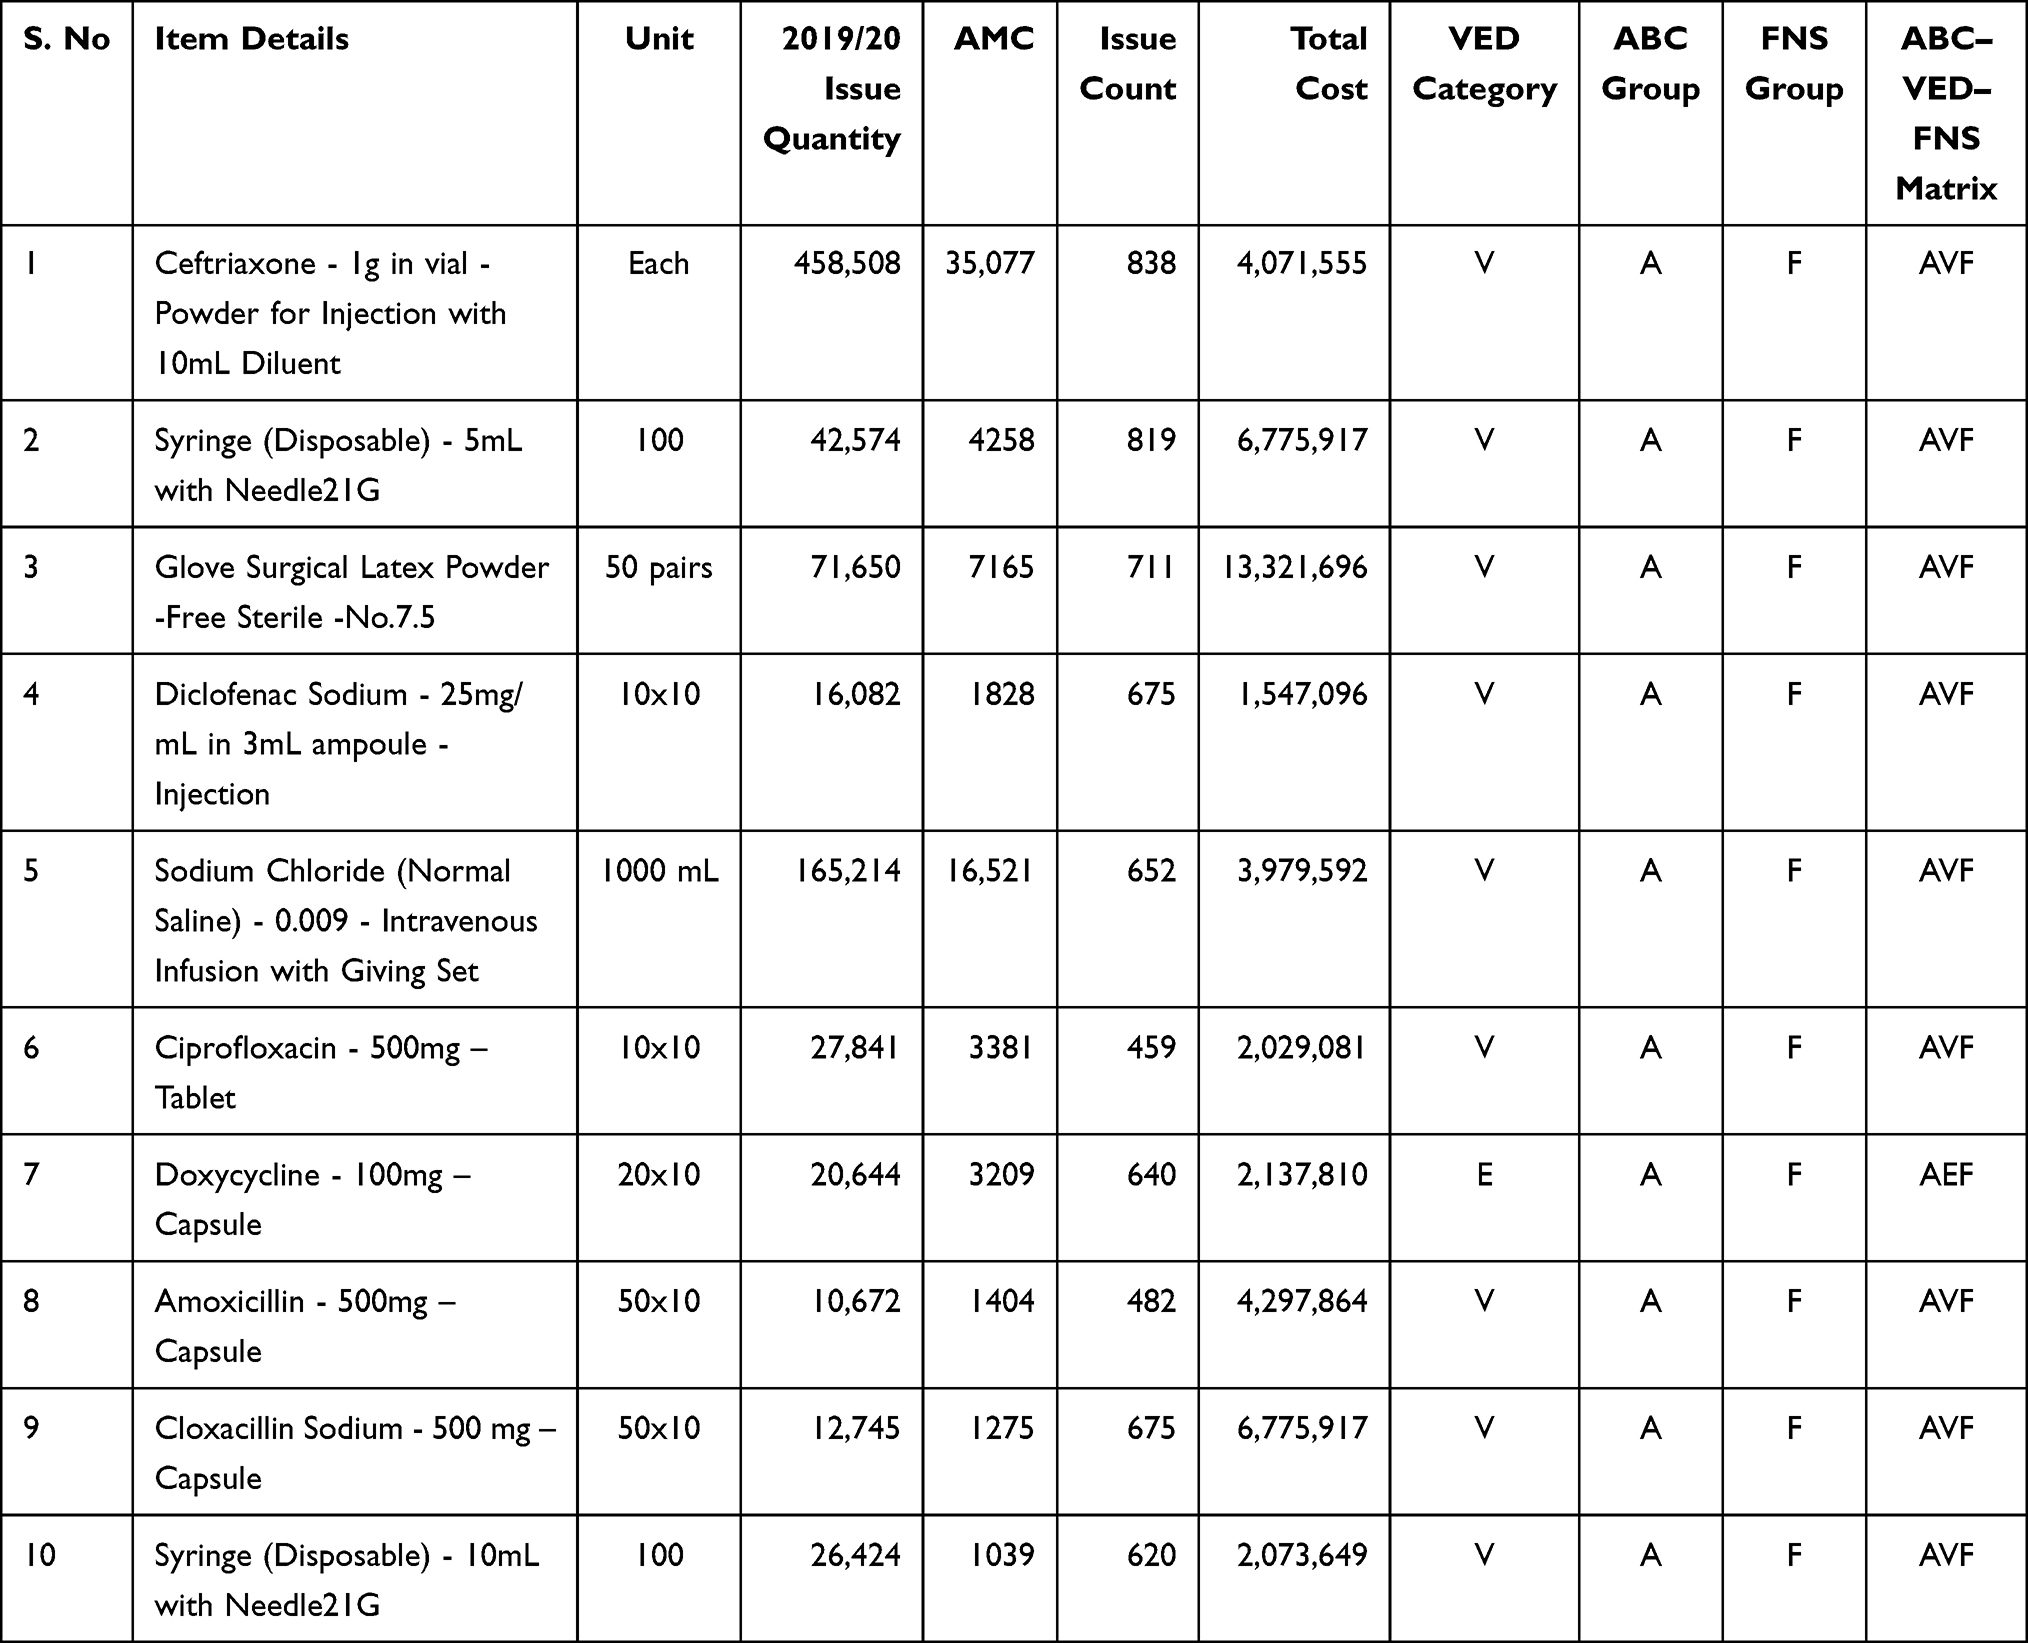 |
Table 4 Top-Ten “AVF” Pharmaceuticals from ABC–VED–FNS Matrix Analysis in the Study Area (N = 393) |
Discussions
Service-providing organizations should maintain an appropriate level of inventory to satisfy customers’ requests while reducing associated costs. Selective inventory control techniques and classification are paramount for efficient utilization and management of pharmaceutical inventory. In this study, we focused on the ABC, VED, and FNS analyses and matrix. The ABC analysis provides a mechanism for identifying items that have a significant impact on overall inventory cost. The findings in the ABC analysis revealed 58 (14.8%) class A-items that represent 79.9% of ASV; 78 (19.8%) class B-items that represent a further 14.2% of ASV, and 257 (65.4%) items with only 5.9% of ASV constituted category C-items. Our findings are consistent with previous studies conducted in India, Turkey, and Ethiopia, which found that class A-items contributed to 72.9%, 80%, and 80.1% of annual drug expenditures, respectively.17,29,30 This analysis would enable managers to focus more on class A-items with tight control and no inventory discrepancy, while class C-items would have very little control. As a result, the analysis can assist logistics managers in developing inventory count policies (class A-items can be counted once every week, B-items biweekly, and C-items monthly), and stocking levels (arrange more frequent purchases or delivery of smaller quantities of class A-items).
The VED analysis of this study indicates 165 (42%) vital items, 194 (49%) essential items and 34 (9%) desirable items. Interestingly, vital items constituted most (73%) of the ASV and desirable items only 2% of the ASV. This implies that the agency in consultations with stakeholders and relevant experts from health facilities tried the best on ensuring that most of the budget is allocated for the vital and essential items rather than the desirable ones. In comparison to other studies conducted in Baghdad, India, and Ethiopia, the proportion of vital items and ASV was very high.14,21,29 According to the findings, V–items amounted to 18.1%, 19.49%, and 35.1% of total item expenditure in their studies. The difference could be that the agency manages a compiled list of medications from customers with varied levels and preferences.
Cross-tabulation of the ABC with VED provides a critical analysis of each category of items according to cost significance and criticality since equal attention cannot be devoted to the entire inventory. The analysis revealed that 187 (47.58%), 178 (45.29%), and 28 (7.13%) of category I, II, and III items account for 90%, 9%, and 1% ASV as per the orders. However, studies conducted by Mathew et al, 2016; Sushil and Chakravarty, 2014 showed variations with this study.14,20 This could be the difference in the study setting, as well as different institutions have varying service profiles depending on the specialty services available.
The 187 (47.58%) items in category I should be given high priority by top management. The operational efficiency of the warehouses can be substantially improved by focusing on 47.58% of items (amounted to 90% ASV). Directing staff activities, accurate demand forecasting, safety stock levels, and consumption trends should be monitored continuously for these groups of items.
Category II items (178, 45.29%) accounted for 9% of the ASV. These items should be ordered once or twice a year and should be monitored and controlled on a periodic basis. Category III items (28, 7.13%) contained 1% of the ASV. These items should also be ordered once or twice a year, thereby reducing ordering cost and carrying cost without tying up substantial capital.
The analyses revealed 60 (15.30%) products were classified as Fast-moving F items accounted for the greatest proportion (73.10%) of total value in the budget year. This result also showed the maximum issue frequency of 838 times per year; most of them had an issue frequency above 200 times per year. This result is lower than that of Manivel, Ranganathan, 2016, and Jobira et al, 2020, who uncovered that 46.03% and 35.3% of F-class items accounted for 56.30% and 78.4% of total value, respectively.24,29 The variations can be attributed to the nature and numbers of items analyzed and differences in the study setting and methodology employed as pharmaceutical needs vary by situation and country. To minimize the time and labor cost of put-away, picking and packing, and effective use of material handling equipment, the F items should be placed nearest to the order marshalling and dispatch areas in the warehouse.
In the current work, 112 (28.50%), and 221 (56.20%) products were classified as N and S items accounted for 20.30% and 6.60% of ASV in the budget year. This implies the majority of items (56.20%) were in the S category.
Slow-moving stocks have come from managing items with diminishing consumer demand, quality defects, regimen shifts, switching to new equipment or technology, holding seldom used medicines (eg, snake venom antiserum, amphotericin B 50mg injection) in case-specific rare events, or stocking of products to provide patients with rare diseases (eg, Amiodarone, L-Asparaginase). As a result, slow-moving items should be studied further to control obsolescence, products with diminishing consumer demand should be tracked in the system, safety stock levels and reorder points should be adjusted downwardly, and these products also require prior planning and flexibility as well as promotions to minimize inventory carrying cost. They should be stored in a warehouse far away from order marshalling and dispatch areas in order to devise an effective inventory policy.
Logistics managers and advisors have been challenged with handling hundreds of pharmaceutical items, each with their characteristics, requiring complex and time-consuming inventory control techniques. The combined approach provides results based on total cost, criticality value, and the rate of consumption of products. This study revealed 60 (15.3%) F-items with nine (9) subclasses [AVF =29, AEF = 10, BEF = 10, CVF =4, CEF = 2, CDF = 9, ADF =0, BDF =0, and CDF =0). Thus, the 29 AVF products should be arranged in the warehouse closest to the order marshalling and dispatch area (pick-face area) so that warehouse personnel can inspect, access, pick, track, and deliver the product in a timely manner for order fulfilment.
Moreover, 28 (7.13%) items (4 = CDN and 24 = CDS) constituted category-III. Owing to the low stock level, and slow/non-moving nature of these items, they should be redistributed to other hubs, considered disposal ways, or donated to charity to minimize disposal costs.
Despite its ability to improve inventory control policies by allowing for the identification of active or dead-stocks for effective inventory management, the ABC-VED-FNS analysis has limitations. Sometimes, organizations may choose to stockpile products with a high risk of shortages or for emergency situations to deal with supply chain disruptions, but this may significantly impact inventory carrying costs as well as its flow. In this particular instance, the ABC-VED-FNS analysis is completely irrelevant.
Conclusion and Recommendation
Instigating combined inventory control techniques (ABC–VED–FNS) can assist supply chain managers in realizing substantial financial and operational benefits. The ABC-VED-FNS matrix classifies pharmaceuticals based on their cost significance, relative public health value, and average warehouse flow/stay respectively. Implementing the ABC–VED–FNS matrix analysis can help organizations to develop inventory control policies and techniques, narrows down a categories of items requiring greater managerial monitoring and control, prioritizes storage location (pick-face) plan, minimizes the time and labor cost of put-away, picking, and packing, prioritizes products to be reordered or replenished, as well as useful in directing staff activities. Thus, the inventory analysis needs to be adopted as a routine practice for optimal inventory control of pharmaceuticals.
Abbreviations
ABC, Always Better Control; AMC, Average Monthly Consumption; ASV, Annual Sales Value; EPSA, Ethiopian Pharmaceutical Supply Agency; FNS, Fast-, Normal-, and Slow-moving; FY, Fiscal Year; HCMIS, Health Commodities Management Information System; VED, Vital, Essential, and Desirable.
Data Sharing Statement
The dataset(s) generated and/or analyzed during the current study are available from the corresponding author on reasonable request.
Ethics Approval and Consent to Participate
The ethics committee of the Research and Postgraduate Office (RPO), College of Business and Economics, Jimma University (Reference No: RGS/199/2020) provided an ethical clearance letter. Following a debriefing on the study objective, we obtained a formal letter of support from the EPSA Jimma hub. Before beginning data collection, we copied the official support letter to the employees in the hub, which included desired data. After that, in compliance with the RPO, the employees’ informed consent was sought.
Acknowledgments
We are thankful to EPSA-Jimma Hub for providing us necessary data/information, suggestion & guideline.
Funding
There is no funding to report.
Disclosure
The authors report no conflicts of interest in this work.
References
1. Douglas LM, Stock JR, Ellram LM. Fundamentals of Logistics Management.
2. Kushwaha S, Sohani N, Kumar S. Effectiveness of logistics, distribution & customer satisfaction in courier company. Int J Sci Res Dev. 2017;5(05):1832–1834.
3. The Chartered Institute of Logistics and Transport UK. Glossary of terms and dictionaries; 2019. Available from: https://ciltuk.org.uk/knowledge/knowledge-bank/resources/other-resources/useful-glossaries.
4. USAID | DELIVER PROJECT. The Logistics Handbook: A Practical Guide for the Supply Chain Management of Health Commodities; 2011.
5. USAID | DELIVER PROJECT. Guidelines for Warehousing Health Commodities.
6. Rushton A, Croucher P, Baker P. The Handbook of Logistics and Distribution Management.
7. Chopra S, Meindl P. Supply Chain Management: Strategy, Planning, and Operation.
8. Wang M. Logistics capability, supply chain uncertainty and risk, and logistics performance: an Empirical Analysis of the Australian Courier Industry. Int J Innov Manag. 2016;20(07):1650070.
9. Harrison A, Van Hoek RI. Logistics Management and Strategy: Competing Through the Supply Chain.
10. Shan H, Li Y, Shi J. Influence of supply chain collaborative innovation on sustainable development of supply chain: a Study on Chinese Enterprises. MDPI Sustain. 2020;12:1–19. doi:10.3390/su12072978
11. Wisner JD, Tan KC, Leong GK. Principles of Supply Chain Management.
12. Frazelle E. Supply Chain: The Logistics of Supply Chain Management. New York, USA: McGraw-Hill Companies, Inc; 2002. doi:10.1036/0071418172
13. Cohen S, Roussel J. Strategic Supply Chain Management: The 5 Disciplines for Top Performance.
14. Mathew B, Panavila L, Sindhu K, Rajaneesh P, Bharath. V, Doddayya H. A study on inventory management by ABC, VED and ABC-VED Matrix analysis in pharmacy department of a tertiary teaching hospital. Asian J Pharm Health Sci. 2016;6(4):1563–1568.
15. Fitriana I, Gagak R, Satria D, Cahyo D, Setiawan B. Medicine inventory management by ABC-VED analysis in the pharmacy store of veterinary Hospital, Yogyakarta, Indonesia. Asian J Anim Vet Adv. 2018;13(1):85–90. doi:10.3923/ajava.2018.85.90
16. Brindha G. Inventory Management. Int J Innov Res Sci Eng Technol. 2014;3(1):8163–8176.
17. Nigah R, Devnani M, Gupta AK. ABC and VED analysis of the pharmacy store of a Tertiary Care Teaching, Research and Referral Healthcare Institute of India. Young Pharm Manag. 2010;2(2):201. doi:10.4103/0975-1483.63170
18. Blecker T, Kersten W. Operational Excellence in Logistics and Supply Chains: Optimization Methods, Data-Driven Approaches and Security Insights.
19. Santhi G, Karthikeyan K. Recent review article on Pharmaceutical Inventory Models. Int J Pharm Tech Res. 2016;9(5):435–443.
20. Sushil M, Chakravarty BA. ABC-VED analysis of expendable medical stores at a tertiary care hospital. Med J Armed Forces India. 2014;7:24–27. Elseviier. doi:10.1016/j.mjafi.2014.07.002
21. Al-najjar SM, Jawad MK, Saber OA. Application of ABC-VED matrix analysis to control the inventory of a central pharmacy in a public hospital: a Case Study. Int J Sci Res. 2020;9(1):1333–1334. doi:10.21275/ART20204180
22. Abate SM. Assessment of pharmaceuticals inventory management systems for the years (2008, 2009, 2010) using ABC-VEN matrix analysis at Addis Ababa University College of Health Sciences Tikur Anbessa (Black Lion) Specialized Hospital, Advances in Pharmacoepid. Adv Pharmacoepidemiol Drug Saf. 2013;2(3):2012–2013. doi:10.4172/2167-1052.100013
23. Management Science for Health. MDS-3: managing access to medicines and health technologies. Arlington, USA; 2012.
24. Manivel P, Ranganathan R. Prioritized ABC – FSN analysis of inventory management in private and hospital pharmacy followed by questionnaire. Int Res J Pharm. 2016;7(12):111–113. doi:10.7897/2230-8407.0712155
25. Gurmu TG, Ibrahim AJ. Inventory management performance of key essential medicines in health facilities of East Shewa Zone, Oromia Regional State, Ethiopia. Cukurova Med J. 2017;42(2):282–285. doi:10.17826/cutf.322908
26. Ethiopian Pharmaceuticals Supply Agency. Ethiopia: National Survey of the Integrated Pharmaceutical Logistics System (IPLS): AIDSFree, and Pharmaceutical Supply Agency (EPSA). Addis Ababa, Ethiopa; 2019.
27. Ethiopian pharmaceuticals Supply Agency (PFSA). Integrated Pharmaceuticals Logistics System (IPLS) in Health Facilities of Ethiopia; 2017.
28. Ben Hmida J, Parekh S, Lee J. Integrated inventory ranking system for oilfield equipment industry. J Ind Eng Manag. 2014;7(1):120. doi:10.3926/jiem.511
29. Jobira T, Abuye H, Jemal A, Gudeta T. Evaluation of pharmaceuticals inventory management in selected health facilities of West Arsi Zone, Oromia, Ethiopia. Integr Pharm Res Pract. 2021;10:5. doi:10.2147/IPRP.S298660
30. Günergören H, Dağdeviren Ö. An excel-based inventory control system based on ABC and VED analyses for pharmacy: a Case Study. Galore Int J Health Sci Res. 2017;2(1):14–16.
 © 2021 The Author(s). This work is published and licensed by Dove Medical Press Limited. The
full terms of this license are available at https://www.dovepress.com/terms
and incorporate the Creative Commons Attribution
- Non Commercial (unported, 3.0) License.
By accessing the work you hereby accept the Terms. Non-commercial uses of the work are permitted
without any further permission from Dove Medical Press Limited, provided the work is properly
attributed. For permission for commercial use of this work, please see paragraphs 4.2 and 5 of our Terms.
© 2021 The Author(s). This work is published and licensed by Dove Medical Press Limited. The
full terms of this license are available at https://www.dovepress.com/terms
and incorporate the Creative Commons Attribution
- Non Commercial (unported, 3.0) License.
By accessing the work you hereby accept the Terms. Non-commercial uses of the work are permitted
without any further permission from Dove Medical Press Limited, provided the work is properly
attributed. For permission for commercial use of this work, please see paragraphs 4.2 and 5 of our Terms.