Back to Journals » Risk Management and Healthcare Policy » Volume 15
How Efficient are Basic Public Health Services Between Urban and Rural in Shandong Province, China? A Data Envelopment Analysis and Panel Tobit Regression Approach
Authors Cao F, Xi Y, Zheng C, Bai T, Sun Q
Received 18 December 2021
Accepted for publication 28 March 2022
Published 19 April 2022 Volume 2022:15 Pages 727—738
DOI https://doi.org/10.2147/RMHP.S354758
Checked for plagiarism Yes
Review by Single anonymous peer review
Peer reviewer comments 3
Editor who approved publication: Professor Mecit Can Emre Simsekler
Fankun Cao,1,2 Yan Xi,3 Chao Zheng,1,2 Tongyu Bai,4 Qiang Sun1,2
1Center for Health Management and Policy Research of Public Health School, Shandong University, Jinan, Shandong Province, People’s Republic of China; 2NHC Key Lab of Health Economics and Policy Research (Shandong University), Shandong University, Jinan, Shandong Province, People’s Republic of China; 3Health Commission of Shandong Province, Jinan, Shandong Province, People’s Republic of China; 4Primary Health Department, Health Commission of Shandong Province, Jinan, Shandong Province, People’s Republic of China
Correspondence: Qiang Sun, Email [email protected]
Background: Improving basic public health services efficiency becomes priority to guarantee its sustainability for Chinese government. This study aimed to explore basic public health services efficiency and its influencing factors between urban and rural in Shandong Province, China, providing policy implications to improve efficiency.
Methods: This research assessed basic public health services efficiency of 54 districts (representing urban) and 83 counties (representing rural) in Shandong, China, from 2014 to 2019. The data were obtained from Medical Management Service Center of Shandong Health Commission and Statistical Yearbooks. Input variables were subsidy funds, public health staffs and material expenditures. Output variables were assessment indicators covered all service contents from national standard. The data envelopment analysis and panel tobit regression were used to measure efficiency scores and efficiency influencing factors.
Results: Basic public health services efficiency scores of urban were higher than those of rural during 2014 to 2019. Scale efficiency change and technological change promoted basic public health services total factor productivity change of urban and rural respectively. Panel tobit regression indicated that proportion of health expenditures in general public budget expenditures (P< 0.01), subsidy funds (P< 0.01), public health personnel expenditures (P< 0.01) and the frequency of professional health institutions’ guidance (P< 0.01) were positively associated with efficiency in both urban and rural. The number of primary medical and health institutions and public health personnel were positively associated with urban (P< 0.01), but those did not affect rural (P> 0.10).
Conclusion: To improve basic public health services efficiency, urban should focus on health resource structure, especially increasing primary medical and health institutions and public health personnel. Rural should expand the input scale, paying more attention to subsidy funds and public health personnel expenditures. The government should also care strengthening the guidance to primary medical and health institutions from professional health institutions.
Keywords: basic public health services efficiency, urban, rural, data envelopment analysis, panel tobit regression
Introduction
Basic Public Health Services (BPHS) is a public service product in China, focusing on the populations’ health and aiming to narrow the gap in the fairness of health services and health resources between urban and rural areas. BPHS is a non-profit health service program provided by government and implemented by the primary health care institutions. BPHS targets vital groups such as children, pregnant women, the elderly, patients with chronic diseases, etc. BPHS includes health education, women and children’s care, elderly care, immunizations and so on, which integrates Western and traditional Chinese medicine.
BPHS funds continue to go up, increased from RMB 15 per capita in 2009 to RMB 79 per capita in 2021 and rose more than five times.1 The COVID-19 outbreak of 2019 led to a new urgency to increase public health funds in China. The government paid more attention to BPHS and released nearly 85% of BPHS subsidy funds in advance. Total central government budget reached to RMB 60.33 billion in 2020.
However, the growth rate of BPHS expenditures far exceeded that of GDP and fiscal revenue in China. Compared with 2009, the growth rate of GDP and fiscal revenue increased by 3 percentage points and −2.3 percentage points respectively in 2019. The per capita expenditure for BPHS in 2019 increased by an average of 36% compared with 2009 (official data from the National Bureau of Statistics). Improving BPHS efficiency becomes one effective way to ensure its sustainable development.
Few studies investigated BPHS efficiency systematically due to the availability of data. Most of the previous studies limited in the status of technical efficiency,2–10 and some studies concerned about BPHS technical efficiency influencing factors,11–13 and a few studies paid attention to the difference of BPHS efficiency between urban and rural.13 Those previous studies showed that BPHS technical efficiency was not fully effective. The reason for the inefficiency technical efficiency of BPHS was mostly concentrated on the scale efficiency, which was mainly reflected in the lack of investment. What’s more, only available data were considered and some indicators based on the relevance of service program activities were not included in most studies.4–12 This situation would lead to the incomplete inclusion of input-output indicators, and the scientific and accuracy of existed researches are remained to be discussed.
Shandong Province had more than 100 million permanent residents (accounting for 7.2 percentage of the total population in the Chinese mainland) in 2020, and the population of Shandong ranked second in China (China National Bureau of Statistics). The proportion of urban and rural population in Shandong was equal compared with other province (taking Jiangsu Province as an example, the proportion was 6 to 2). It is worth noting that Shandong Province is nationally representative in China, so analysis on BPHS efficiency of this province could be more practical and meaningful. Whereas, the evidence observed in previous studies may not totally generalize to the context of Shandong Province.
How efficient is the BPHS? What are the influencing factors of BPHS efficiency? Are there differences in BPHS efficiency between urban and rural? Those questions are important issues thought by policy makers, practitioners and academic researchers. This study conducted a comprehensive BPHS efficiency evaluation in Shandong, China. We focused on the status and influencing factors of BPHS efficiency between urban and rural, and expecting to provide policy implications to improve the efficiency.
Methods
Study Design
The research was a comparative study. This study evaluated the status and the influencing factors of BPHS efficiency between urban and rural in Shandong, China, from 2014 to 2019.
According to the standards of 2020 China Health Statistical Yearbook, urban areas include municipalities directly under the central Government and prefecture-level city districts, and rural areas include counties and county-level cities. Thus 54 districts represent urban and 83 counties represent rural in Shandong.
Data Sources
Input and Output Data
To assist primary medical and health institutions in keeping track of information on BPHS, Medical Management Service Center of Shandong Health Commission collects data from district- and county-level primary medical and health institutions in de-identifiable format on an annual basis. In the present study, the input-output data of 137 units were obtained from the collection during 2014 to 2019, shown in Table 1.
 |
Table 1 The Average of the Input-Output Data and Influencing Factors Data of BPHS in 137 Areas of Shandong from 2014 to 2019 |
Total expenditures for BPHS were included in the input variables, containing subsidy funds for BPHS, public health personnel and material expenditures. Input variables focused on the district- and county-level information about primary medical and health institutions of 137 units (54 districts and 83 counties).
To provide technical guidance and assess implement effect of all 13 types of BPHS contents, Chinese government issued National Basic Public Health Services Specifications (Third Edition). There are 24 assessment indicators in the specification. All assessment indicators of BPHS were included in the output variables. Output variables focused on the district- and county-level information about permanent residents serviced by primary medical and health institutions of 137 units (54 districts and 83 counties).
All input and output data of nominal variables were deflator-adjusted using the Consumer Price Index (official data from the National Bureau of Statistics).
BPHS Efficiency Influencing Factors Data
According to Organization Environment Theory and the previous studies, we explored BPHS efficiency influencing factors.11–14 Regional economic development level (GDP per capita), population (number of permanent residents at the end of the year), geographic location, time changes, fiscal expenditure structure (proportion of health expenditures in general public budget expenditures), government investment (subsidy funds for BPHS, public health personnel expenditures), guidance from professional health institutions (frequency of professional health institutions’ guidance) and health resources (number of primary medical and health institutions, number of public health personnel) were included in BPHS efficiency influencing factors. Influencing factors variables were shown in Table 1, and some of them (subsidy funds for BPHS and number of public health personnel) were shown in the input variables part. Influencing factors variables focused on the district- and county-level information about 137 units (54 districts and 83 counties).
The data of 137 units were obtained from Statistical Yearbooks of 16 cities in Shandong Province during 2014 to 2019, as well as Medical Management Service Center of Shandong Health Commission. All BPHS efficiency influencing factors data of nominal variables were deflator-adjusted using the Consumer Price Index (official data from the National Bureau of Statistics).
Data Analysis
Data Envelopment Analysis (DEA)
In order to make full and effective use of data, we conducted principal component analysis and efficiency coefficient transformation analysis on the 24 original output indicators of BPHS before the efficiency analysis.
The principal component analysis could reduce the dimensionality and classify the data of original output indicators, revealing the profound internal laws of things in a simply and intuitively way.15 The fundamental of principal component analysis was to explain the original variables by reducing the dimensionality, achieving the purpose of common index extraction. Principal component analysis could standardize the data, eliminating the effect of variables on an order of magnitude or dimension. The original variable got the principal component score after principal component analysis. If the cumulative variance contribution rate of the extracted principal component was more than 85%, we believed that it retained the original information and could be used as the newly extracted principal component in the subsequent analysis.
After principal component analysis, we used efficiency coefficient transformation analysis to ensure that the data met the application conditions of DEA.16 The principal component scores were converted in the range of 0.1 to 1 by efficiency coefficient transformation analysis, which were all positive. The data of the newly extracted principal components represented the data of original output indicators finally, which were entered into the relevant models of DEA for subsequent efficiency analysis.
With the method of DEA, BPHS efficiency was measured. DEA determined the weight of each indicator from the point of view that was most beneficial to the decision-making unit (DMU). This method used a data planning model to evaluate the relative effectiveness of units with multiple inputs and multiple outputs. DEA did not need to establish production function expression, and it could calculate any process multiple input indexes and output indexes simultaneously.
The CCR model and BCC model in DEA were used to measure efficiency.17,18 The CCR model assumed constant returns to scale, and the obtained technical efficiency included the components of scale efficiency.
The nonlinear programming model of the CCR model was expressed as


Then let  and
and  , the nonlinear model (1) was transformed into an equivalent linear programming model


The dual model of the linear programming model (2) was expressed as


In the dual model (3),  represented the linear combination coefficient of DMU, and the optimal solution
  of the model represented the efficiency score.
The BCC model assumed variable returns to scale, and obtained technical efficiency excluded the influence of scale efficiency, called pure technical efficiency. The BCC model was based on the CCR dual model with additional constraint  , which made the production scale of projection point at the same level as that of DMU evaluated.
The nonlinear programming model of the BCC model was expressed as


The dual model of the nonlinear programming model (4) was expressed as


After the analysis of the CCR model and BCC model in DEA, 3 efficiency indices scores could be got: technical efficiency score, scale efficiency score and pure technical efficiency score.

Efficiency scores included all ranges from 0 to 1 through DEA. The efficiency of the DMU was considered effective when the score was “1”, and it was deemed to be ineffective when the score was less than “1”.
The Malmquist productivity index took into account the productivity changes of BPHS in a time-series setting.19 Total factor productivity change could be decomposed into technical efficiency changes and technological changes. In the Malmquist productivity index, 5 indices could be generated: total factor productivity change (TFPC), technical efficiency change (TEC), technological change (TC), pure technical efficiency change (PTEC) and scale efficiency change (SEC).20

When the Malmquist productivity index was less than “1”, BPHS efficiency was indicated deterioration in productivity. When the Malmquist productivity index was greater than “1”, BPHS efficiency was indicated growth in productivity. When the Malmquist productivity index was “1”, BPHS efficiency had no change in productivity.
The principal component analysis and the efficiency coefficient transformation analysis were calculated by SPSS, version 20.0. Max DEA 8 software was used to identify efficiency scores and the Malmquist productivity index.
Panel Tobit Regression
The technical efficiency scores ranged from 0 to 1, so it was preferable to use panel tobit regression analyzing BPHS efficiency influencing factors.21
Among BPHS efficiency influencing factors, GDP per capita (PGDP), number of permanent residents at the end of the year (NPR), geographic location and time changes were control variables. Proportion of health expenditures in general public budget expenditures (FES), subsidy funds for BPHS (FE), public health personnel expenditures (SP), frequency of professional health institutions’ guidance (GF), number of primary medical and health institutions (NI) and number of public health personnel (NP) were core influencing factors variables.
Considering the regional differences in Shandong, we introduced a dummy variable geographical location. The eastern area (D1) was assigned the value “1”, and the others were “0”. The central and western areas (D2) were assigned the value “1”, and the others were “0”. In order to explore the impact of time changes on BPHS efficiency during 2014 to 2019, another dummy variable period (T) was introduced, with a value of “1” in and after 2017, and a value of “0” before 2017.
Taking the technical efficiency score as the dependent variable and the influencing factors as the independent variables, a tobit regression model of BPHS efficiency influencing factors was established.

Where  was the technical efficiency score, i represented DMUs, and t was the year.
  ~
~  respectively represented the parameter vectors of 11 influencing factors variables.
  represented a cross-sectional specific effected that varies with the individual and did not vary with time, which was not related to the influencing factors variable.
  represented a random variable that changed independently with time and individuals.
This study performed Hausman test of econometric model on model (8). The statistical value of the test result was 80.35. The test results rejected the null hypothesis of the random effects model, thus the fixed effects model was established.21 To address the worry about multi-collinearity in the explanatory variables, we conducted the detection using Variance Inflation Factor.
The panel tobit regression model with fixed effects was conducted using Stata 13.0 software.
Results
Descriptive Analysis
Table 1 showed the average of the input-output data and influencing factors data of BPHS in 137 areas (54 districts and 83 counties) of Shandong from 2014 to 2019.
In terms of input indicators, subsidy funds for BPHS increased the most. Compared with 2014, it reached RMB 37.88 million in 2019, an increase of 59.93%. The number of public health personnel did not change significantly, fluctuating around 29.
In terms of output indicators, Traditional Chinese Medicine health management rate for the elderly and Traditional Chinese Medicine health management rate of children aged 0 to 36 months increased the most, reaching 60.94% and 64.09% respectively in 2019. However, the standardized management rate of hypertension patients and patients with type 2 diabetes showed a downward trend. The two indicators were 66.13% and 66.51% in 2019.
In terms of efficiency influencing factors, the frequency of professional health institutions’ guidance was doubled and public health personnel expenditures had an increase of 82.13%. The number of primary medical and health institutions increased by 8.1 percentage points during 2014 to 2019. The proportion of health expenditures in general public budget expenditures fluctuated around 8.6%.
DEA Analysis
We conducted the principal component extraction and standardization of 24 original output indicators and got 7 newly principal components indicators. The cumulative total variance contribution rate was 90.12%, meaning that the 7 principal components indicators extracted could appropriate summarize the main information of the 24 original output indicators. The 7 newly extracted principal components represented the 24 original output indicators, which were entered into the relevant models of DEA for subsequent efficiency calculations. The 7 principal components extracted from the 24 original output indicators were shown in Table 2.
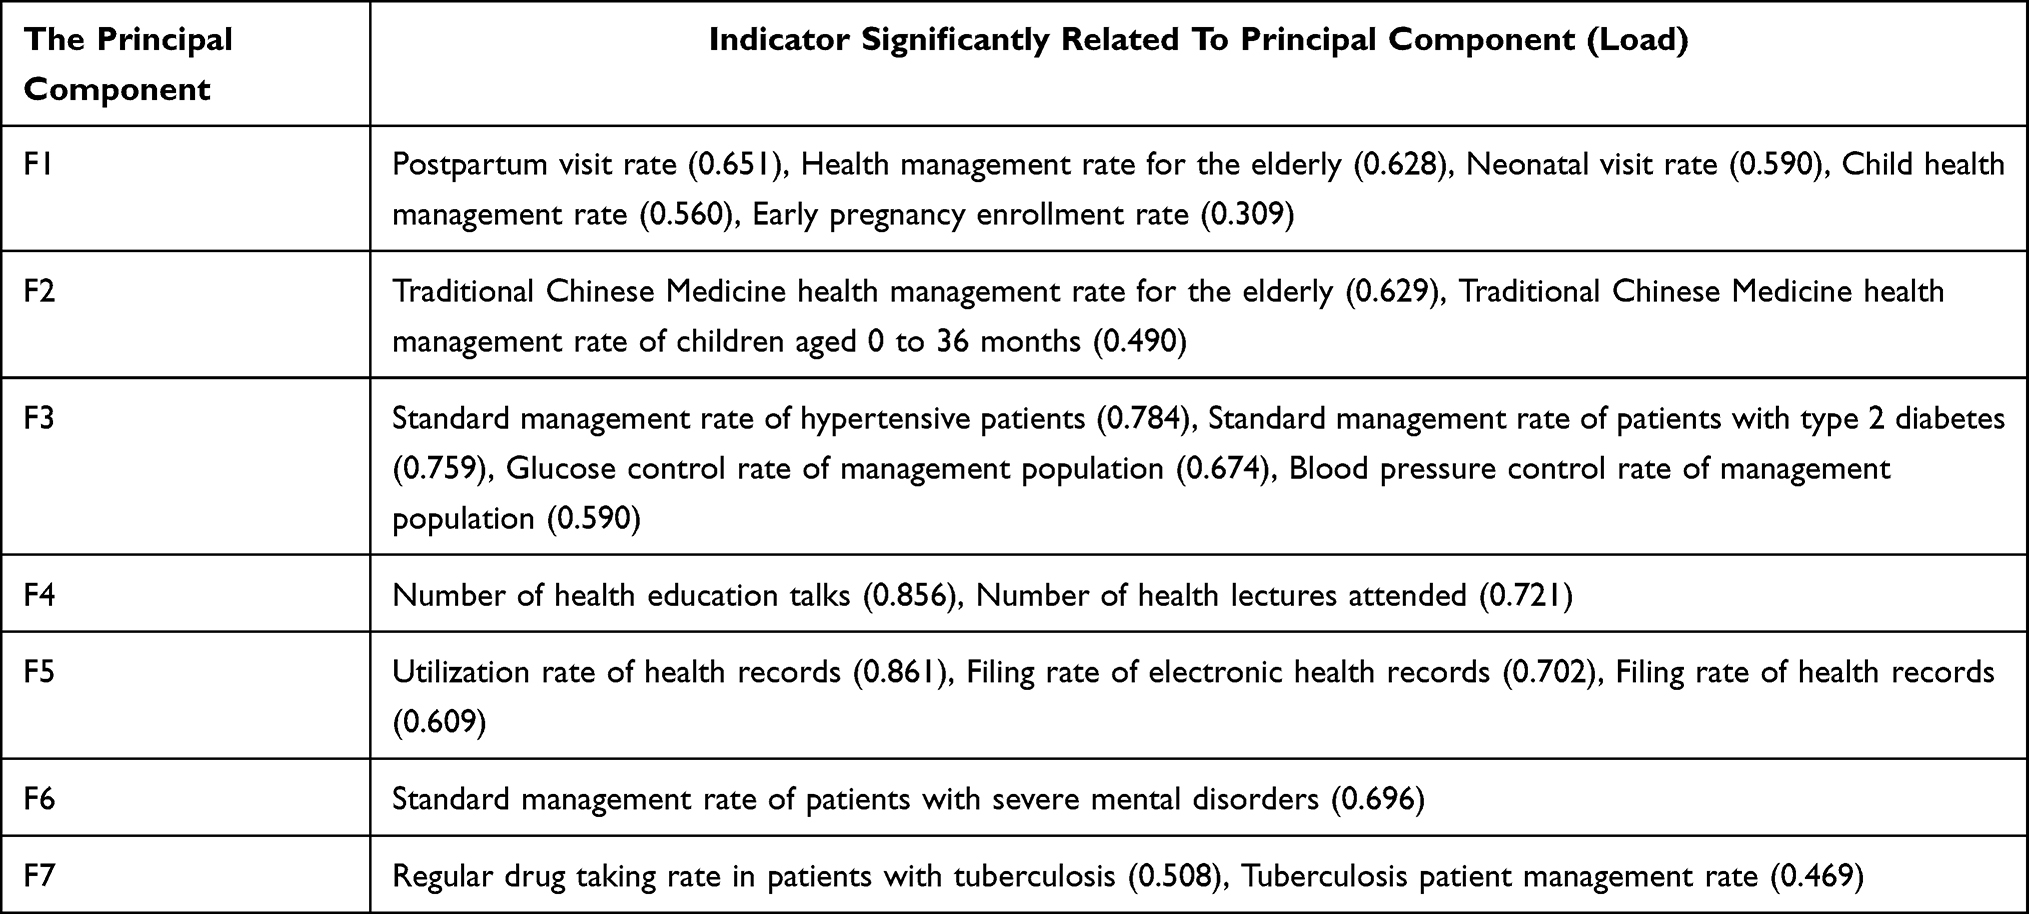 |
Table 2 The 7 Principal Components Extracted from the 24 Original Output Indicators |
As shown in Table 3, the average BPHS efficiency scores of urban was higher than that of rural, and both of them showed an upward trend from 2014 to 2019. The improvement speed of the technical efficiency in rural was higher than those of urban. The urban technical efficiency scores increased from 0.892 in 2014 to 0.929 in 2019, and rural increased from 0.882 in 2014 to 0.923 in 2019. The good performance of urban technical efficiency was mainly due to scale efficiency, with an average score of 0.901. The pure technical efficiency scores of rural improved significantly, almost closing to 1 by 2019.
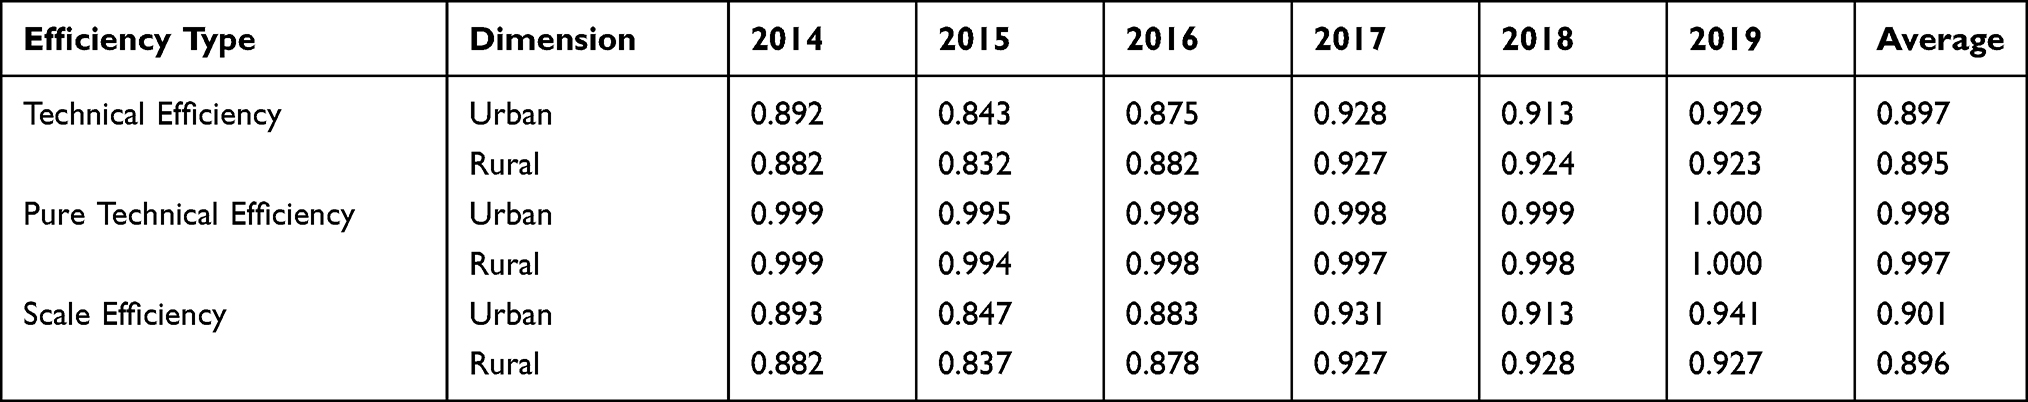 |
Table 3 The Average BPHS Efficiency Scores of Urban and Rural in Shandong from 2014 to 2019 |
Malmquist productivity index was applied to analyse the changes in productivity over the 2014–2019 period, shown in Table 4. On average, urban total factor productivity change increased by 5.2%, among which, technical efficiency change increased by 4.1% and technological change increased by 1.0%. Thus, the increase of technical efficiency change was the main contributor for the improvement of BPHS total factor productivity change in urban. Among technical efficiency change, pure technical efficiency change increased by 1.8% and scale efficiency change increased by 2.3%. Scale efficiency change promoted the improvement of BPHS total factor productivity change in urban finally. In rural, total factor productivity change, technical efficiency change and technological change increased by 3.7%, 1.5% and 2.2% on average respectively. Thus, technological change mainly promoted the improvement of BPHS total factor productivity change in rural.
 |
Table 4 The Malmquist Productivity Index Between Urban and Rural Over the 2014–2019 Period |
Panel Tobit Regression of BPHS Efficiency
The tobit regression analysis results of BPHS efficiency influencing factors between urban and rural were shown in Table 5. Proportion of health expenditures in general public budget expenditures (P<0.01), subsidy funds for BPHS (P<0.01), public health personnel expenditures (P<0.01) and the frequency of professional health institutions’ guidance (P<0.01) were positively associated with BPHS efficiency in both urban and rural. The number of primary medical and health institutions (P<0.01) and the number of public health personnel (P<0.01) were positively associated with urban BPHS efficiency, but those did not affect rural BPHS efficiency (P>0.10). There was not multi-collinearity in the explanatory variables (the largest Variance Inflation Factor was 2.41, much less than 10).
 |
Table 5 Panel Tobit Regression Results of BPHS Efficiency Influencing Factors Between Urban and Rural in Shandong |
In terms of the control variables, influencing factors such as regional economic development level and geographic location had a significant impact on BPHS efficiency in both urban and rural. GDP per capita (P<0.01) and east area (P<0.01) were positively associated with BPHS efficiency, while central and western areas (P<0.01) were negatively associated. The number of permanent residents at the end of the year was negatively associated with BPHS efficiency, but it was significant in urban (P<0.01) and was not significant in rural (P>0.10). The factor of time changes (Period) had not a significant impact on BPHS efficiency in both urban (P>0.10) and rural (P>0.10).
Discussion
Under the background of medium-low speed economic development, improving BPHS efficiency becomes the priority to guarantee its sustainability in China. However, the previous researches were not enough to fully explore BPHS efficiency and its influencing factors between urban and rural. This study used DEA and panel tobit regression approach to analysis these issues.
The study found that BPHS efficiency scores of urban were higher than those of rural. However, this result did not square with another study finding in Guangzhou Province.13 The reason for the inconsistency might be that the existed research only included the quantity indicators of output (eg, standard management rate of hypertensive patients) into the analysis, while the present study covered both all quantity indicators of output (eg, standard management rate of hypertensive patients) and all quality indicators of output (eg, blood pressure control rate of management population) from national standard into the analysis. Thus, the different indicators included led to different research results.
The results also showed that although BPHS technical efficiency scores of urban were higher than those of rural, the gap was gradually narrowing. The main reasons were the high level of scale efficiency scores of urban and the rapid improvement of pure technical efficiency scores of rural. High scale efficiency score represented a sufficient scale of investment in the implementation of BPHS, that was, the funds and personnel invested could fully meet the operation of BPHS.8,9 High pure technical efficiency score represented standardized project management, excellent personnel training and suitable service mechanisms, providing professional technical support for the implementation of BPHS.22 It could be seen that the scale of resource investment for BPHS in urban was better than that in rural, and the management and technical level of BPHS were being rapidly improved in rural. The conclusion was consistent with the existed study.12 According to these findings, rural areas should pay attention to scale of resource investment.
The Malmquist productivity index indicated that technological change contributed to BPHS total factor productivity change in rural, which verified the conclusion before. Scale efficiency change was the main reason for the improvement of BPHS total factor productivity change in urban of Shandong Province. It was consistent with a finding in Anhui Province.23
Through the analysis of BPHS efficiency influencing factors, we found that regional health resource factors had different effects on BPHS efficiency in urban and rural. The number of primary medical and health institutions and the number of public health personnel had a positive effect on BPHS efficiency in urban, but no significant impact in rural. The previous study in Guangzhou, China also showed that more primary medical and health institutions and public health personnel could promote urban BPHS efficiency.13 There were more large hospitals and clinicians and less primary medical and health institutions and public health personnel in urban. Therefore, if the number of BPHS implementation agencies (primary medical and health institutions) and service personnel (public health personnel) were increased, BPHS efficiency would be significantly promoted in urban. A result found in UK was similar to the present finding, which the increasing of public health personnel redounded to public health.24 The primary medical and health institutions and public health personnel were relatively sufficient in rural, thus those health resource factors had no obvious impact on BPHS efficiency. Above findings hinted that the urban BPHS efficiency could be improved by increasing the number of primary medical and health institutions and public health personnel.
Panel tobit regression analysis also found that proportion of health expenditures in general public budget expenditures, subsidy funds for BPHS and public health personnel expenditures were positively associated with BPHS efficiency in both urban and rural. Similarly, a study in Fuzhou found that BPHS performed more efficiently after increasing proportion of health expenditures in general public budget expenditures, subsidy funds for BPHS and public health personnel expenditures.11 The subsidy funds for BPHS were arranged through the transfer payment method of common fiscal power. The funds could not be used for other expenditures, such as basic construction projects and large-scale equipment. The increasing of subsidy funds for BPHS and proportion of health expenditures in general public budget expenditures could obviously promote BPHS efficiency. Increasing public health personnel expenditures could create material incentives, inspiring public health personnel to provide better services and ultimately improving BPHS efficiency. The empirical evidence did exist suggesting that public health were boosted by economic input.25,26
In the present study, the frequency of professional health institutions’ guidance was also positively associated with BPHS efficiency in both urban and rural. It found that professional health institutions’ guidance could promote BPHS efficiency in both urban and rural. The BPHS included many services for priority groups, such as health management services for patients with severe mental disorders, tuberculosis patients, hypertension patients and type 2 diabetes patients. These services required service personnel to have specialized knowledge and expertise in related diseases. More guidance and training from professional health institutions were beneficial to the professional quality and competence of service personnel in primary health care institutions, which facilitating BPHS efficiency. This result was similar with some study findings in developing countries, showed that training the public health workforce was an importance way to improve implementation effect of public health.27,28 The important finding suggested that government should more concern about the guidance to primary medical and health institutions from professional health institutions.
Compared with previous researches, the contribution and innovation of this study were knowable. This research fully explored the situation and its influencing factors of BPHS efficiency, narrowing the knowledge gaps and contributing to our understanding of what variables influence BPHS efficiency between urban and rural. The limitations of the present study were as follows. Firstly, only BPHS efficiency in Shandong Province was analyzed in this study, so the results of other provinces could not be known. Secondly, this study lacked of data analysis relevant to health outcomes in the population, which would be part of the panel of variables that could shed light on comparable outcomes of BPHS in urban and rural. There are many gaps in the research on BPHS efficiency at present. Future research should pay more attention to the influencing factors of BPHS efficiency. In addition, input-output indicators should be included comprehensively to improve the scientific and accuracy of the research when carrying out efficiency analysis.
Conclusions
BPHS efficiency scores of urban were higher than that of rural. Scale efficiency change and technological change promoted urban and rural BPHS total factor productivity change respectively. BPHS efficiency influencing factors were different between urban and rural. For urban, BPHS health resource structure should be adjusted properly, especially increasing primary medical and health institutions and public health personnel. For rural, input scales should be expanded, especially BPHS subsidies and public health personnel expenditures. The government should also pay more attention to strengthen the guidance to primary medical and health institutions from professional health institutions.
Availability of Data and Materials
The data that support the findings of this study are available from Medical Management Service Center of Shandong Health Commission but restrictions apply to the availability of these data, which were used under license for the current study, and so are not publicly available. Data are however available from the authors upon reasonable request and with permission of Medical Management Service Center of Shandong Health Commission. Data sharing statement.
The data can be requested from Qiang Sun and Fankun Cao. Qiang Sun’s email address is [email protected]. Fankun Cao’s email address is [email protected].
Acknowledgments
The authors thank Medical Management Service Center of Shandong Health Commission, for their willingness to provide the data.
Author Contributions
All authors made a significant contribution to the work reported, whether that is in the conception, study design, execution, acquisition of data, analysis and interpretation, or in all these areas; took part in drafting, revising or critically reviewing the article; gave final approval of the version to be published; have agreed on the journal to which the article has been submitted; and agree to be accountable for all aspects of the work.
Funding
There is no funding to report.
Disclosure
All authors declare that they have no competing interests in this work.
References
1. Qian W, Kong Y, Sun J, et al. What are the challenges faced by village doctors in provision of basic public health services in Shandong, China? A Qualitative Study. Int J Environ Res Public Health. 2019;16:2519. doi:10.3390/ijerph16142519
2. Peng W, Xianxian Y, Xipeng Z, et al. Analysis on the efficiency of basic public health service projects in Chongqing in 2014. J Shanghai Jiaotong Univ. 2016;7:1054–1058.
3. Huijie L, Ye ZH, Zhengrong CH. Comparison of the efficiency difference of the multiple supply of basic public health services—based on the survey of four types of subjects in Urumqi. Chin Health Serv Manag. 2018;35:231–235.
4. Wei W. Evaluation of the efficiency of basic public health services in Shandong Province based on DEA model. Chin Admin. 2014;12:86–89.
5. Denan L, Liang L, Shi L, et al. Evaluation of the efficiency of basic public health services in Shenzhen community based on data envelopment analysis. Chin Health Stats. 2017;34:284–287.
6. Chun Y, Junshuang W. Evaluation of fund utilization efficiency of community basic public health services in Tianjin Binhai new area based on data envelopment analysis. Chin Gen Pract. 2015;13:1510–1513.
7. Yanshang LW, Xinfeng Wet al. Research on the resource efficiency of basic public health allocation in Tianjin based on super-efficiency DEA.Chin Rural Health Serv Manag. 2020;40:246–250.
8. Yi C, Ming J. Analysis on the efficiency of basic public health services in primary medical and health institutions in Wuhan. Chin J Health Inf Manag. 2017;14:589–593.
9. Weiwen L, Deyun L. Evaluation of the efficiency of basic public health service items of community health service institutions in Zhuhai City based on data envelopment analysis. Mod Med Health. 2020;36:1781–1784.
10. Manqi F, Jingli B, Fuquan G, et al. Evaluation of the efficiency of basic public health services in various towns and districts of Zhongshan City. Cmty Med J. 2019;17:46–48.
11. Ling L. Analysis of the efficiency of basic public health services and its influencing factors: taking Fuzhou City as an example. J Health Econ. 2016;3:43–47.
12. Wei L, Xiaohuixia W. Spatial analysis of factors affecting the efficiency of basic public health services in rural areas. Chin Health Serv Manag. 2020;37:687–691.
13. Xian ZH, Junting OY, Li K, et al. Research on the efficiency evaluation and influencing factors of basic public health services in Guangzhou. J Health Econ. 2015;3:47–50.
14. Min L, Yongqiang L. A review of organizational environment theory under collaborative networks. J Univ Electron Sci Technol China. 2003;5:29–32.
15. Haiming L, Zifang D. Issues that should be paid attention to in the comprehensive evaluation of principal component analysis. J Stat Res. 2013;30:25–31.
16. Decui ZH, Guo ZH, Liying J, et al. Comprehensive evaluation on anti-inflammatory and anti-angiogenic activities in vitro of fourteen flavonoids from Daphne Genkwa based on the combination of efficacy coefficient method and principal component analysis. J Ethnopharmacol. 2021;268:113683. doi:10.1016/j.jep.2020.113683
17. Farrell MJ. The measurement of Production efficiency. J R Stat Soc. 1957;3:253–293. doi:10.2307/2343100
18. Sarrico CS. Data envelopment analysis: a comprehensive text with models, applications, references and DEA-Solver software. J Oper Res Soc. 2001;52:1408–1409. doi:10.1057/palgrave.jors.2601257
19. Fare R, Grosskopf S, Norris M, et al. Productivity growth, technical progress, and efficiency change in industrialized countries. Am Econ Rev. 1994;84:66–83.
20. Lovell C. The decomposition of malmquist productivity indexes. J Product Anal. 2003;20:437–458. doi:10.1023/A:1027312102834
21. Kirjavainen T, Loikkanent HA. Efficiency differences of Finnish senior secondary schools: an application of DEA and tobit analysis. Econ Educ Rev. 1996;17:377–394. doi:10.1016/S0272-7757(97)00048-4
22. Guilin ZH, Xilong P. Evaluation of Beijing rural basic public health service project efficiency based on data envelopment analysis method. J Peking Univ. 2013;45:264–268.
23. Binsong W, Qiyou ZH. Evaluation of county basic public health service efficiency based on DEA method: a case study of Anqing City, Anhui Province. Acad J Luoyang Normal Univ. 2021;40:91–96.
24. Heller RF, Edwards R, Patterson L, et al. Public health in primary care trusts: a resource needs assessment. Public Health. 2003;117:157–164. doi:10.1016/S0033-3506(03)00081-7
25. Graham H, White P. Social determinants and lifestyles: integrating environmental and public health perspectives. Public Health. 2016;141:270–278. doi:10.1016/j.puhe.2016.09.019
26. Roemer MI. Comment: the globalization of public health. Am J Public Health. 1998;88:744. doi:10.2105/AJPH.88.5.744
27. Wang C, Xiang H, Xu Y, et al. Improving emergency preparedness capability of rural public health personnel in China. Public Health. 2010;124:339–344. doi:10.1016/j.puhe.2010.02.020
28. Edward C, Dayna M, Regina L, et al. Training the public health workforce from Albany to Zambia: technology lessons learned along the way. Public Health Rep. 2010;125:61–69. doi:10.1177/00333549101250S509
 © 2022 The Author(s). This work is published and licensed by Dove Medical Press Limited. The
full terms of this license are available at https://www.dovepress.com/terms
and incorporate the Creative Commons Attribution
- Non Commercial (unported, 3.0) License.
By accessing the work you hereby accept the Terms. Non-commercial uses of the work are permitted
without any further permission from Dove Medical Press Limited, provided the work is properly
attributed. For permission for commercial use of this work, please see paragraphs 4.2 and 5 of our Terms.
© 2022 The Author(s). This work is published and licensed by Dove Medical Press Limited. The
full terms of this license are available at https://www.dovepress.com/terms
and incorporate the Creative Commons Attribution
- Non Commercial (unported, 3.0) License.
By accessing the work you hereby accept the Terms. Non-commercial uses of the work are permitted
without any further permission from Dove Medical Press Limited, provided the work is properly
attributed. For permission for commercial use of this work, please see paragraphs 4.2 and 5 of our Terms.