Back to Journals » Journal of Inflammation Research » Volume 18
Host Circulating Immunometabolism-Associated Biomarkers for Early Diagnosis of Active Tuberculosis: Multi-Omics Screening with Experimental Validation
Authors Yang Z, Dong Y, Shang Y ![]() , Li H, Ren W, Li S
, Li H, Ren W, Li S ![]() , Pang Y
, Pang Y ![]()
Received 2 May 2025
Accepted for publication 29 July 2025
Published 9 August 2025 Volume 2025:18 Pages 10723—10740
DOI https://doi.org/10.2147/JIR.S533116
Checked for plagiarism Yes
Review by Single anonymous peer review
Peer reviewer comments 2
Editor who approved publication: Dr Tara Strutt
Zeliang Yang,* Yu Dong,* Yuanyuan Shang, Haoran Li, Weicong Ren, Shanshan Li, Yu Pang
Department of Bacteriology and Immunology, Beijing Chest Hospital, Capital Medical University/Beijing Tuberculosis and Thoracic Tumor Research Institute, Beijing, 101149, People’s Republic of China
*These authors contributed equally to this work
Correspondence: Yu Pang, Email [email protected]
Background: Accurate diagnosis of active tuberculosis (TB) remains challenging when facing with no clinical symptom and negative pathogen tests. Metabolic reprogramming is the main characteristic of Mycobacterium tuberculosis (Mtb) infection and has the potential to be used as a diagnostic biomarker for active TB.
Methods: Datasets including healthy donors (HCs) and active TB patients were obtained from the Gene Expression Omnibus database. Machine learning methods were used to identify the metabolism-related hub genes. Correlation analysis between gene expression and immune cell infiltration was performed using the CIBERSORT algorithm. Single-cell RNA-seq analysis was performed to explore the expression of hub genes in the different immune cells.
Results: In this study, we first obtained 41 differentially expressed metabolism-related genes in active TB patients compared to HCs through bulk transcriptomic analysis. Four metabolism-related hub genes (GCH1, GK, MTHFD2, and SLC7A6) were identified using machine learning algorithms for the diagnosis of active TB with high accuracy and verified using external datasets. A nomogram was constructed to comprehensively predict the risk of active TB. Mechanistically, protein–protein interactions and gene set enrichment analysis revealed that four hub genes affected pteridine and lipid metabolism and were associated with the innate immune pathways. Immune cell infiltration and single-cell sequencing analyses showed that GCH1, GK, and MTHFD2 were mainly expressed in M1 macrophages and were significantly upregulated after Mtb infection, suggesting that they might participate in macrophage-mediated anti-Mtb immune responses. Furthermore, the expression levels of GCH1, GK, and MTHFD2 in macrophages showed a strong correlation with the course and efficacy of antituberculosis therapy. Changes in the expression of these hub genes were validated in active TB samples and Mtb-infected mouse models.
Conclusion: Our results demonstrate that changes in immunometabolism-related genes are associated with TB pathogenesis and could serve as biomarkers for the evaluation of active TB.
Keywords: active tuberculosis, metabolism reprogramming, biomarkers, macrophages, single-cell transcriptomic analysis
Introduction
Tuberculosis (TB) is a chronic infectious disease caused by Mycobacterium tuberculosis (Mtb). In 2023, TB has returned to the uppermost cause of death from a single infectious disease as deaths from coronavirus disease (COVID-19) have gradually slowed down and started to stabilize.1 The Global Tuberculosis Report in 2024 showed that 10.8 million people were newly diagnosed with TB in 2023, and 1.25 million deaths occurred. Acting as the third-highest TB burden country, China still warrants better diagnostic strategies and curative therapies.2 Although interferon gamma release assay (IGRA) and tuberculin skin test (TST) have been widely used to screen for Mtb infection, they cannot discriminate between active TB patients and latent TB infection (LTBI).3 Currently, the diagnostic methods for active TB mainly depend on pathogen detection and radiographic examination; however, none of these methods have high sensitivity and specificity for active TB.4 Therefore, a rapid and effective strategy should be developed to diagnose active TB.
After coevolution with humans for thousands of years, Mtb has developed a series of methods to escape host immune responses and maintain intracellular survival.5–7 One of the notable features induced by Mtb infection is metabolic reprogramming.8 Mtb infection upregulates host fatty acid catabolism and cholesterol metabolism to facilitate the cell wall synthesis.9 Mtb enhances glutamine and arginine metabolism to inhibit effector T cell function and to create a suppressive microenvironment for long-term persistence.10,11 In a previous study, we reported that Mtb infection upregulated IDO1 expression and increased kynurenine production, thereby reducing chemokine CXCL9/CXCL10 secretion and T cell infiltration in the lung.12 To combat Mtb invasion, host immune cells regulate metabolic pathways to initiate antibacterial immune responses.13 Enhanced glycolysis and oxidative phosphorylation (OXPHOS) during Mtb infection contributes to the rapid production of ATP and biosynthesis of effector cytokines.14 Metabolomic analysis showed that Mtb leads to increased intracellular levels of NAD+, creatine, and glutathione.15 These changes in metabolites may affect the antioxidant capacity of cells, helping them to cope with infectious stress. Given the metabolic adaptation mediated by Mtb infection, it is promising to investigate metabolism-related gene markers to identify active TB patients.
In this study, we focused on the differences in metabolic gene expression between patients with active TB and healthy donors. We performed differentially expressed gene and pathway enrichment analyses, and identified candidate metabolism-related hub genes. Using two machine learning algorithms, four genes, GCH1, GK, MTHFD2, and SLC7A6, were utilized for the diagnosis of active TB with high sensitivity and specificity in internal and external datasets. We also found that changes in the expression levels of these four genes were associated with the course and treatment efficacy of patients with TB. Multifactor regulatory networks were constructed to identify critical transcription factors, microRNAs, and small molecules that regulate hub gene levels. Immune cell infiltration analysis showed that the expression of these four genes is mainly associated with the abundance of monocytes/macrophages. Single-cell RNA sequencing analysis revealed that Mtb infection increased the expression levels of GCH1, GK, and MTHFD2 in monocytes/macrophages, which were downregulated following anti-TB treatment. Furthermore, the expression of the four hub genes was verified using collected samples and mouse infection models. Taken together, our study provides novel combined metabolism-related markers for the diagnosis and treatment of active TB.
Methods
Acquirement of Expression Data and Metabolism-Related Genes
The data used in this project were downloaded from GEO datasets under accession numbers GSE83456, GSE107991, GSE31348, GSE89403, GSE157657, GSE218065, and GSE214237. Metabolism-related genes and annotation pathways were obtained from the previous studies16,17 and shown in Table S1.
Differentially Expressed Gene Analysis
After gaining the expression matrices from GSE83456 datasets, R package “limma” was utilized to analyze differentially expressed genes based on the screen criteria of p < 0.05 and |fold change| > 1.5. The volcano plot of gene changes was visualized using the R packages “ggplot2”. A heatmap of metabolism-related genes was plotted using the R package “pheatmap”.
Pathway Enrichment Analysis
The differentially expressed genes were employed for enrichment analysis using the Gene Ontology (GO) database through the R package “clusterProfiler”. The enrichment pathways were visualized by the R function “barplot”. Gene set enrichment analysis (GSEA) was conducted utilizing the Molecular Signatures Database.
LASSO Regression Analysis
The Least Absolute Shrinkage and Selection Operator (LASSO) regression model was constructed using the R package “glmnet” with lambda = 100. A 10-fold cross-validation was used to screen the optimal lambda to fit a binomial regression model with parameter alpha = 0.99. The model with minimum lambda was employed to identify hub genes between healthy donors and patients with TB.
Random Forest Model
The R package “randomForest” was used to establish a random forest model. The features with MeanDecreaseGini above 4.0 were selected as important candidate genes.
The Construction of the Nomogram
The multifactor regression model was constructed and the nomogram was plotted to comprehensively evaluate the risk of tuberculosis patients by the R package “rms”. In the nomogram, each gene expression value corresponded to one point, and the total points of the four hub genes were used to diagnose patients with TB.
Area Under ROC Curve (AUC) Analysis
The R package “pROC” was used to perform the receiver operating characteristic (ROC) analysis. The area under the ROC curve (AUC) was calculated to evaluate the sensitivity and specificity of the predictive model.
Immune Cell Infiltration Analysis and Consensus Clustering Analysis
The LM22 files including the expression characteristics of 22 types of immune cells were downloaded and gene expression matrices were analyzed to evaluate the proportions of different immune cells through the R package “CIBERSORT”.18 The correlation of immune cell abundance and each hub gene was analyzed by R function “cor.test” using spearman test and visualized through the R package “ggplot2”. Clustering analysis using hub genes in active TB samples was conducted using the R package “ConsensusClusterPlus”.
Multifactor Regulatory Network Construction
Protein–protein interaction (PPI) network analysis was performed using GeneMANIA (https://genemania.org/). TF-mRNA-miRNA regulatory network and small-molecule interaction prediction were conducted using NetworkAnalyst website (https://www.networkanalyst.ca/). The network was visualized using Cytoscape software.
Single-Cell RNA Sequencing Analysis
The R package “Seurat” was used to analyze the single-cell RNA sequencing data.19 In GSE218065 dataset, cells expressing less than 200 genes, more than 6,000 genes, or more than 20,000 counts were filtered. Cells with mitochondrial-encoded counts greater than 10% were removed. After quality control, 4,186 cells from normal PBMCs and 3,159 cells from Mtb-infected PBMCs were utilized to perform further analysis. In GSE214237 dataset, cells expressing more than 3,500 genes or 10,000 counts were filtered. Cells with mitochondrial-encoded counts greater than 6% were removed. After quality control, 4,521 cells from patient 1 and 5,064 cells from patient 2 were employed to the following analysis. Two thousand highly variable genes were selected for principal component analysis (PCA). The R function “IntegrateData” was used to integrate individual samples. Subsequently, 30 PCs were selected for dimension reduction using UMAP and unsupervised K-nearest neighbor clustering. Cell clusters were annotated based on the expression levels of the feature markers. The expression values of hub genes in cell subsets were gained by R function “FetchData” and were analyzed by two-tail unpaired Student’s t-test. To evaluate the differentiation state of monocytes/macrophages, we calculated the mean expression value of M1 (including FCGR3A and IL1B) and M2 (including CD163, MRC1, and CD209) marker genes as M1 and M2 signature scores, respectively.
THP-1 Cell Induction and Mtb Infection
THP-1 cells were induced with 100 ng/mL phorbol 12-myristate 13-acetate (PMA) for 12 h and washed twice with 1 × PBS buffer. Polarized THP-1 cells were infected with Mtb strain H37Rv at a multiplicity of infection (MOI) of five for 24 h, followed by RNA isolation.
Mtb-Infected Mouse Model
Mtb strain H37Rv was aerosolized to infect C57BL6/N mice at a dose of 100 colony forming units (CFUs). After 4 weeks, lung tissues were collected for RNA isolation and real-time quantitative PCR (RT-qPCR) assays.
Recruitment of Participants and Isolation of Peripheral Blood Mononuclear Cells (PBMCs)
Peripheral blood samples derived from healthy donors and patients with active TB who provided informed consent, were collected from the Beijing Chest Hospital. Patients with active TB were clinically diagnosed through significant clinical symptoms, positive IGRA test results, and Mtb culture. Healthy donors were identified based on negative IGRA and PPD skin reactivity test results. The PBMCs were isolated by density gradient centrifugation using human leukocyte separation medium followed by red blood cell lysis.
RNA Purification and RT-qPCR Analysis
Cells were washed with PBS, and RNA was purified using the TRIzol reagent (Invitrogen). Reverse transcription was performed using the GoScriptTM Reverse Transcription System (Promega) following the manufacturer’s instructions. The cDNA was used for RT-qPCR analysis on an ABI 7500 system (Applied Biosystems) using the Taq Pro Universal SYBR qPCR Master Mix (Vazyme). Primers used in this study are listed in Table S2.
Statistical Analysis
Statistical analyses were performed using GraphPad Prism (v8.0.2). A two-tailed unpaired Student’s t-test was used to calculate the differences between the two groups. The differences were considered statistically significant at * p < 0.05, ** p < 0.01, *** p < 0.001, and **** p < 0.0001. Data are shown as mean ± SEM.
Results
Metabolism-Related Differentially Expressed Gene Analysis
The flowchart of the study is presented in Figure 1. Dataset GSE83456, containing 61 healthy control (HC) donors and 92 active TB patients, was used as the training set. Differentially expressed gene (DEG) analysis showed that, compared with HC samples, 546 upregulated genes and 239 downregulated genes were identified in TB patients, separately (Figure 2A and Table S3). The Gene ontology (GO) enrichment analysis revealed that these DEGs were mainly enriched in pathways associated with antipathogenic and innate immune responses (Figure 2B). To clarify the changes in metabolism-related genes after Mtb infection, we intersected 1932 well-known metabolism-related genes16,17 with 785 DEGs, obtaining 41 metabolism-related DEGs (MRDEGs), in which 7 genes were downregulated and 34 genes were upregulated (Figure 2C and D). The Gene Oncology (GO) enrichment results suggested that these MRDEGs were significantly enriched in pathways related to metabolite transport and cellular detoxification (Figure 2E). These data indicate that metabolic changes in patients with active TB provide promising clues for exploring potential diagnostic and treatment biomarkers.
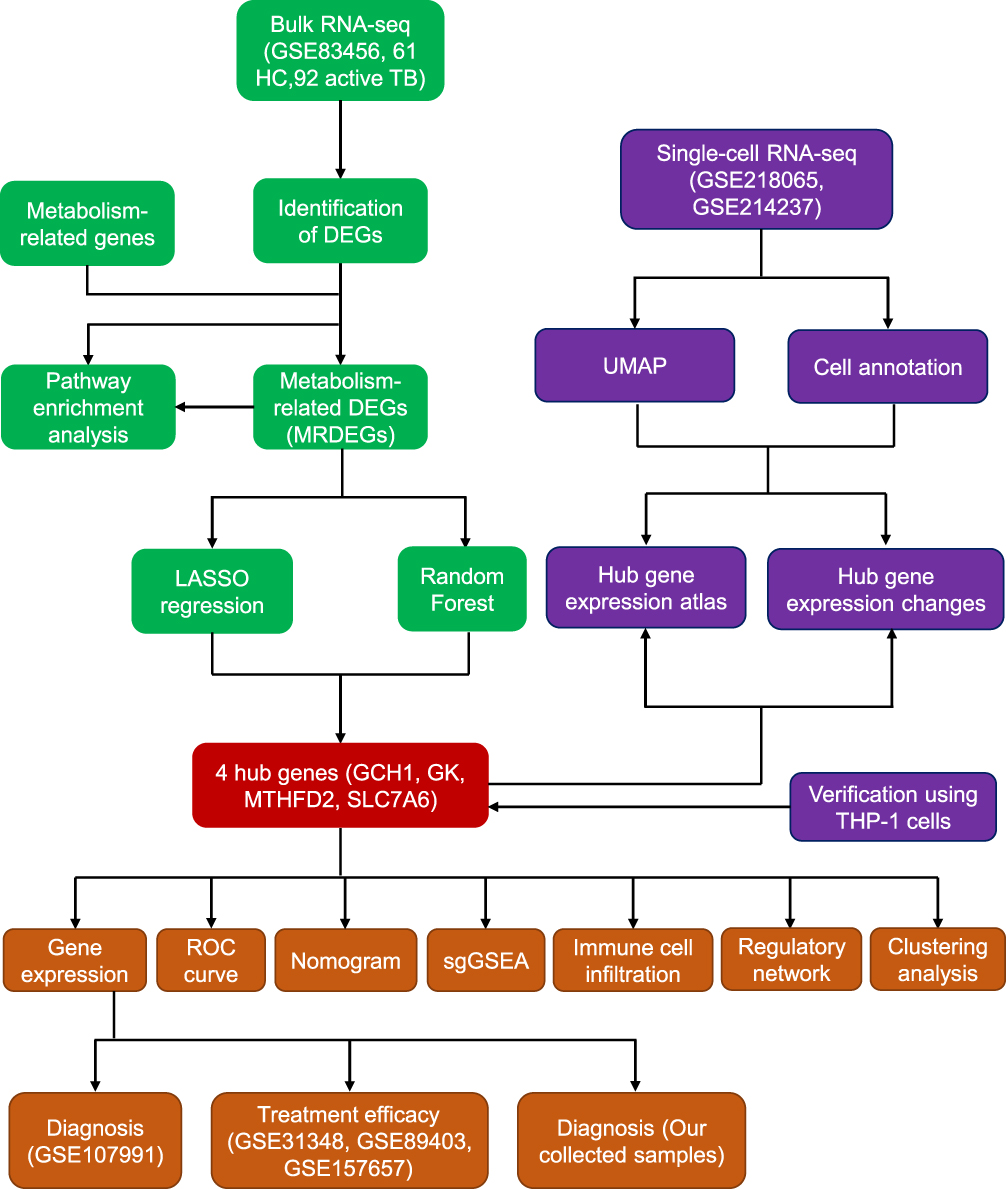 |
Figure 1 Flow diagram of this study. |
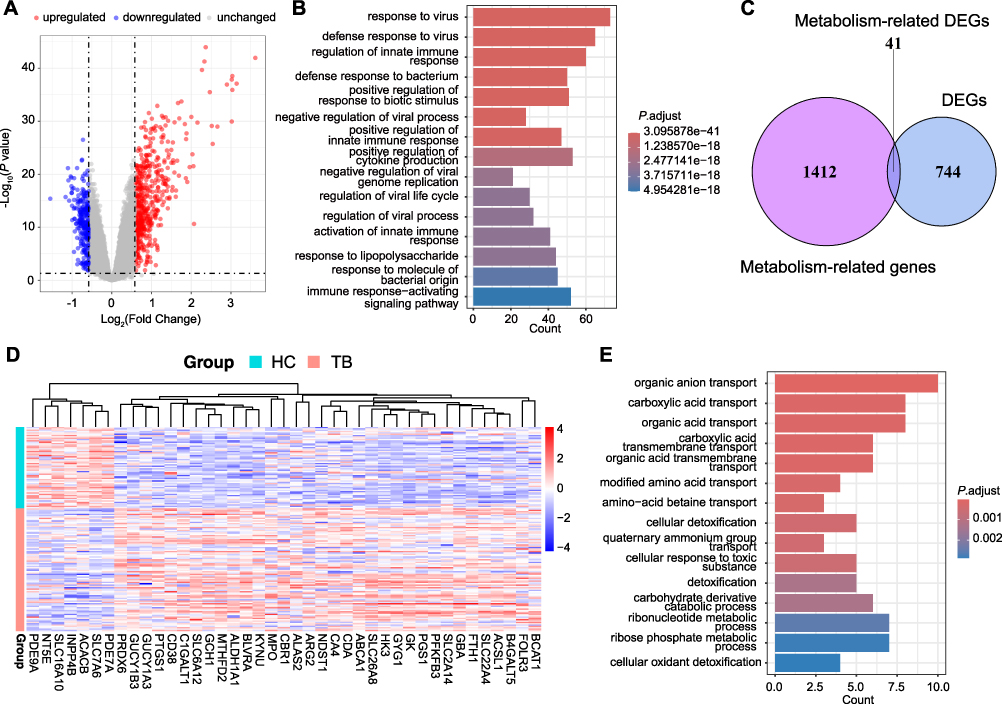 |
Figure 2 Screening of differentially expressed genes (DEGs) and metabolism-related DEGs in active TB patients. (A) Volcano plot of the changes of gene expression in PBMCs derived from active TB patients compared with healthy controls (HCs). (B) GO enrichment analysis of DEGs. (C) Venn diagram showing the overlap of DEGs and metabolism-related genes. (D) Heatmap of metabolism-related DEGs. (E) Top 15 enrichment pathways in metabolism-related genes using the GO database. |
Screening of Metabolism-Related Hub Genes Using LASSO Regression and Random Forest Model
To further identify the key metabolism-related genes for TB diagnosis, two machine learning models consisting of LASSO regression and random forest were constructed using 41 MRDEGs. As shown in Figure 3A and B, LASSO regression analysis identified 12 candidate genes with a diagnostic value under a minimum lambda of 0.0167. Meanwhile, the random forest model clarified that 6 genes with importance scores above 4.0 were associated with TB patients (Figure 3C and D). After converging the two machine learning algorithms, we identified four hub metabolism-related genes, including GCH1, GK, MTHFD2, and SLC7A6, with the potential for TB diagnosis (Figure 3E). The curated metabolic pathways related to these hub genes are summarized in Table 1.
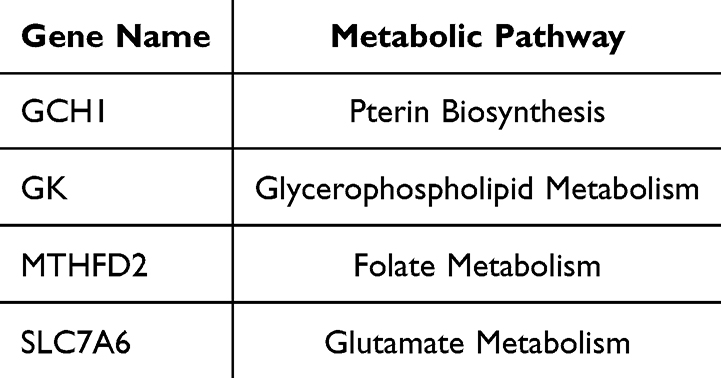 |
Table 1 Four Hub Genes and Curated Metabolic Pathways |
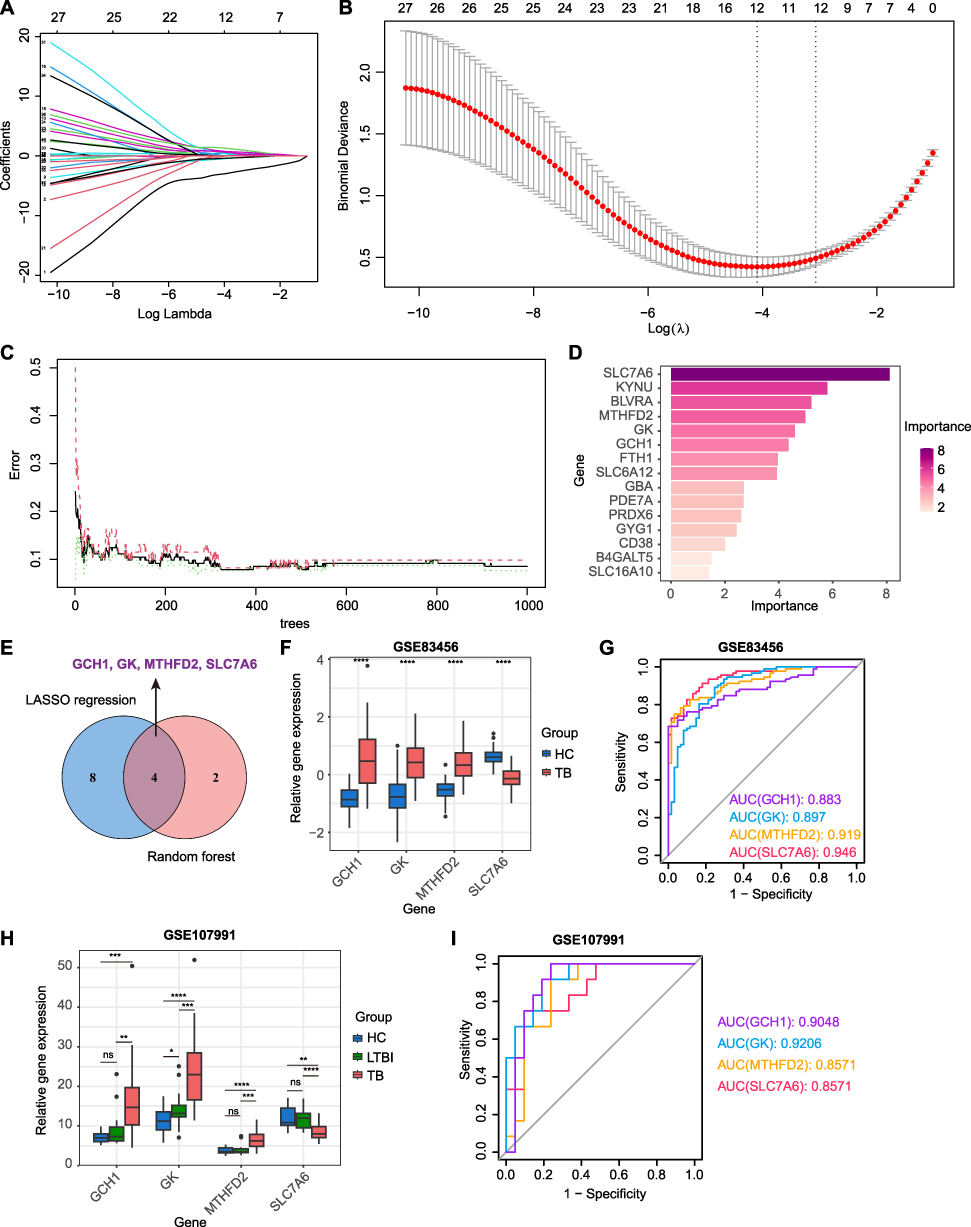 |
Figure 3 Identification of metabolism-related hub genes for TB diagnosis using machine-learning models. (A) Path plot of LASSO coefficient showing the change curves of each independent variable coefficient. (B) Cross-validation curve of LASSO regression model identifying the minimum lambda. (C) Error rate and confidence intervals of random forest models. (D) Bar plot showing the relative importance of candidate genes in the random forest model. (E) Venn diagram showing the overlapping of candidate hub genes using LASSO regression and random forest analysis. (F) Gene expression levels of four hub genes in HC and TB groups in the GSE83456 dataset. (G) ROC curves of four hub genes used for TB diagnosis in the GSE83456 dataset. (H) Gene expression levels of four hub genes in HC, LTBI, and TB groups in the GSE107991 dataset. (I) ROC curves of four hub genes used for TB diagnosis in the GSE107991 dataset. Statistical significance was assessed using a two-tailed unpaired Student’s t test. *p < 0.05, **p < 0.01, ***p < 0.001, ****p < 0.0001. Abbreviation: ns, not significant. |
Additionally, we analyzed the expression levels of these hub genes in the training set. Compared with HC donors, GCH1, GK, and MTHFD2 were upregulated, whereas SLC7A6 was downregulated in patients with TB (Figure 3F). A receiver operating characteristic (ROC) curve was plotted to evaluate the prognostic value of each hub gene. The areas under the ROC curves (AUCs) for GCH1, GK, MTHFD2, and SLC7A6 were 0.883, 0.897, 0.919, and 0.946, respectively (Figure 3G). We also used the external dataset GSE107991 to assess the predictive capacity of the four hub genes. Similar to the training set, GCH1, GK, and MTHFD2 exhibited higher expression levels, and SLC7A6 showed lower expression levels in the active TB group than in the HC and LTBI groups (Figure 3H). The AUC values of the ROC curves were 0.9048 for GCH1, 0.9206 for GK, 0.8571 for MTHFD2, and 0.8571 for SLC7A6 between HC and active TB patients (Figure 3I). Additionally, the four hub genes also showed the diagnostic ability to distinguish active TB from LTBI donors (Figure S1). These data indicated that the four hub genes exhibited ideal diagnostic efficacy for active TB.
Construction of Nomogram for Diagnosis of Active Tuberculosis
To precisely evaluate the risk of TB using these four metabolism-related hub genes, we constructed a diagnostic nomogram using the training set. As shown in Figure 4A and B, each gene expression level was converted to a score, and the scores of the four hub genes were aggregated to predict the possibility of TB. The AUC value of the ROC curve was 0.979 (Figure 4C), indicating that the combination of all four genes showed excellent diagnostic performance. Meanwhile, in the validation dataset, the nomogram also achieved high prediction accuracy with an AUC value of 0.940 (Figure 4D). These results further underscore the diagnostic potential of these four genes for active TB.
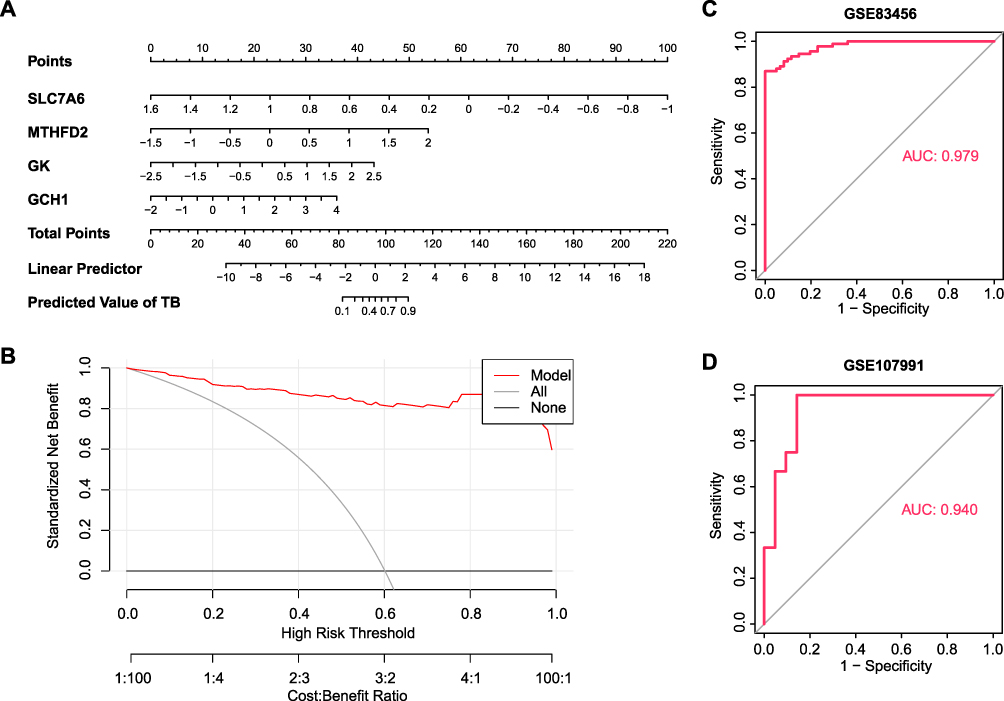 |
Figure 4 Establishment of nomogram for TB prediction. (A) Nomogram plot based on four hub genes. (B) Decision curve analysis for nomogram. (C and D) ROC curve of the combination of four hub genes in the dataset numbered GSE83456 (C) and GSE107991 (D). |
Relationship Between Four Hub Gene Expressions and Antituberculosis Treatment Efficacy
To explore the changes in the four hub genes after antituberculosis therapy, we compared the expression levels of GCH1, GK, MTHFD2, and SLC7A6 in 27 patients with TB at diagnosis and after 1, 2, 4, and 26 weeks of treatment. As anticipated, in the process of TB treatment, GCH1, GK, and MTHFD2 exhibited a significant decrease in their expression levels, and SLC7A6 transcription levels gradually increased (Figure 5A–D). We also analyzed the expression of these genes in 50 healthy controls, 36 cured patients after 4, 8, 12, and 24 weeks of antituberculosis therapy, and 14 patients who failed treatment. As shown in Figure 5E–H, patients with a longer disease course exhibited higher GCH1, GK, and MTHFD2 levels and lower SLC7A6 expression at the time of TB diagnosis. Patients who were not cured had the highest levels of GCH1, GK, and MTHFD2 and the lowest levels of SLC7A6. Furthermore, we used another dataset that included 38 HC donors, 15 cured patients who received short-term anti-TB therapy, and 30 cured patients who received long-term anti-TB therapy. The results showed that patients expressing higher levels of GCH1, GK, and MTHFD2, and lower levels of SLC7A6, required longer treatment durations (Figure 5I–L). The above analysis suggests that these four genes could serve as potential indications for antituberculosis therapy.
 |
Figure 5 Association between four hub gene levels and anti-TB treatment durations. (A–D) GCH1 (A), GK (B), MTHFD2 (C), and SLC7A6 (D) expression levels in TB patients at diagnosis and 1, 2, 4, and 26 weeks after receiving anti-TB treatment in the GSE31348 dataset. (E–H) GCH1 (E), GK (F), MTHFD2 (G), and SLC7A6 (H) mRNA levels in PBMC samples derived from healthy controls, cured patients after 4 weeks, 8 weeks, 12 weeks, and 24 weeks of antituberculosis therapy, and patients who had failed treatment in the GSE89403 dataset. (I–L) Violin plot showing the expression levels of GCH1 (I), GK (J), MTHFD2 (K), and SLC7A6 (L) in PBMCs derived from HC donors and cured patients after short-term or long-term anti-TB therapy in the GSE157657 dataset. Statistical significance was assessed using a two-tailed unpaired Student’s t test. *p < 0.05, **p < 0.01, ***p < 0.001, ****p < 0.0001. Abbreviation: ns, not significant. |
Correlation of Hub Genes with Immune Cells
Considering the remarkable enrichment of immune-related pathways in TB, we explored the proportion of immune cells in blood samples. The CIBERSORT analysis showed that Mtb infection contributed to a significant change in immune status (Figure 6A). Patients with TB exhibit higher proportions of myeloid cells, including monocytes, macrophages, M1 macrophages, M2 macrophages, activated dendritic cells, eosinophils, and neutrophils. However, lymphoid cells, such as CD8+ T cells, resting memory CD4+ T cells, and follicular T helper cells, were poorly enriched in TB patients compared with healthy controls. To better understand the relationship between the four hub genes and changes in immune cell infiltration, we analyzed the correlation between the expression levels of the four genes and immune cell scores. As shown in Figure 6B–E, GCH1 expression showed a positive correlation with M1 macrophages, activated dendritic cells, monocytes, M2 macrophages, neutrophils, and γδT cells, while there was a negative correlation between GCH1 levels and follicular T helper cells, CD8+ T cells, naïve B cells, and resting memory CD4+ T cells; GK expression exhibited a positive correlation with neutrophils, M1 macrophages, activated dendritic cells, macrophages, monocytes, γδT cells, and activated mast cells, while there was a negative correlation between GK levels and follicular T helper cells, CD8+ T cells, resting dendritic cells, activated memory CD4+ T cells, activated NK cells, resting mast cells, and resting memory CD4+ T cells; MTHFD2 level had a positive correlation with M1 macrophages, activated dendritic cells, monocytes, neutrophils, M2 macrophages, γδT cells, plasma cells, and macrophages, meanwhile there was a negative correlation between MTHFD2 expression and follicular T helper cells, CD8+ T cells, and resting memory CD4+ T cells; there was a positive correlation between SLC7A6 level and follicular T helper cells, naïve B cells, resting memory CD4+ T cells, resting dendritic cells, naïve CD4+ T cells, and CD8+ T cells, while SLC7A6 exhibited a negative correlation with monocytes, neutrophils, M1 macrophages, activated dendritic cells, macrophages, and γδT cells.
 |
Figure 6 The correlation analysis of immune cell infiltration and hub genes and the construction of a multifactor regulatory network. (A) The immune cell proportion in HC and TB groups. (B–E) The association between different immune cell abundances and the expression of GCH1 (B), GK (C), MTHFD2 (D), and SLC7A6 (E). (F) PPI network analysis of four hub gene-interacted proteins and pathways. (G) Regulatory network among transcription factors, miRNA, and four hub genes. (H) Interaction between small molecules and four hub genes. Statistical significance was assessed using a two-tailed unpaired Student’s t test. *p < 0.05, **p < 0.01, ***p < 0.001, ****p < 0.0001. Abbreviation: ns, not significant. |
Regulatory Network Analysis of Hub Genes
To illustrate the regulatory pathways of the hub genes, we constructed a protein–protein interaction (PPI) network using the GeneMANIA database. As shown in Figure 6F, these genes were mainly involved in a series of metabolic processes, including the pteridine, folic acid, dicarboxylic acid, and lipid metabolic pathways. Next, we employed the NetworkAnalyst website to identify transcription factors and miRNAs that regulate the expression levels of the four hub genes. The TF–mRNA and miRNA–mRNA interactions were visualized using Cytoscape (Figure 6G). The transcription factor PPARG simultaneously affected GCH1 and GK expression, and has-miR-1 could bind to GCH1, MTHFD2, and SLC7A6 mRNA. Small-molecule compounds bound to GCH1, GK, MTHFD2, and SLC7A6 proteins were also predicted using the NetworkAnalyst website. Six small molecules, including copper sulfate, cyclosporine, and valproic acid, simultaneously acted on the four hub gene-coded proteins (Figure 6H).
Single-Gene GSEA and Consensus Clustering Analysis
Consistent with the immune cell infiltration analysis, single-gene GSEA showed that the four hub genes were mainly enriched in pathways associated with antiviral and antibacterial immune responses and interferon-mediated signaling activation (Figure 7A–D), which collectively illustrated that these metabolism-related hub genes might be involved in host immune responses against Mtb. Unsupervised clustering analysis was conducted to evaluate active TB samples based on the four hub genes. The cumulative distribution function (CDF) curve of the consensus index was used to determine the optimal K value (Figure 7E). The changes in the area under the CDF curve are shown in Figure 7F. At K = 2, these active TB samples were divided into two subgroups: subgroup 1 (60 samples) and subgroup 2 (32 samples) (Figure 7G). Compared with subgroup 2, subgroup 1 exhibited higher GCH1, GK, and MTHFD2 and lower SLC7A6 levels (Figure 7H). Immune cell infiltration analysis showed a higher percentage of monocytes and macrophages and a lower proportion of follicular T helper cells in subgroup 1 (Figure 7I), which was similar to the immune cell infiltration analysis between healthy donors and active TB samples.
 |
Figure 7 Single-gene GSEA and clustering analysis based on four hub genes. (A–D) Top five pathways associated with GCH1 (A), GK (B), MTHFD2 (C), and SLC7A6 (D) expression through single-gene GSEA utilizing the GO dataset. (E) Consensus clustering cumulative distribution function (CDF) for k = 2–8. (F) The consensus matrix when k = 2. (G) Relative change in area under CDF curve when k = 2–8. (H) The expression value of GCH1, GK, MTHFD2, and SLC7A6 between subgroup 1 and subgroup 2. (I) Immune cell infiltration analysis showing the differences of the proportion of each group of immune cells between subgroup 1 and subgroup 2. Statistical significance was assessed using a two-tailed unpaired Student’s t test. *p < 0.05, **p < 0.01, ***p < 0.001, ****p < 0.0001. Abbreviation: ns, not significant. |
Identification of Hub Genes in Immune Cells Using Single-Cell Transcriptional Atlas
To further clarify the expression of these four genes in immune cells, we employed single-cell RNA sequencing data of PBMCs infected with Mtb. After quality control, dimension reduction and unsupervised clustering, PBMCs were divided into five subclusters, which were separately annotated as CD4+ T cells, CD8+ T cells, NK cells, B cells, and monocytes/macrophages according to marker gene expression (Figure S2A, S2B, Figure 8A, and Table S4). We observed that GCH1, GK, and MTHFD2 were predominantly expressed in monocytes/macrophages, which was consistent with the bulk RNA-seq analysis, while SLC7A6 exhibited low expression levels in all cells (Figure 8B–D). Furthermore, under Mtb infection, the expression levels of GCH1 and GK in monocytes/macrophages were significantly increased (Figure 8E), suggesting that they might participate in the anti-Mtb process. Correlation analysis showed that the expression levels of GCH1 and GK were positively correlated with the M1 macrophage signature rather than the M2 macrophage signature (Figure 8F). These data suggest that GCH1 and GK expression in macrophages is associated with differentiation of M1 macrophages and anti-Mtb immune responses.
 |
Figure 8 The single-cell expression atlas of four hub genes. Single-cell sequencing analysis of human PBMCs stimulated with Mtb or unstimulated downloaded from the GSE218065 dataset. (A) UMAP plot showing five subclusters of PBMCs. (B) UMAP plots illustrating the expression levels of GCH1, GK, MTHFD2, and SLC7A6 in different subclusters of PBMCs. (C) Violin plot showing the expression values of GCH1, GK, MTHFD2, and SLC7A6 in different subclusters of PBMCs. (D) Dot plot showing the average expression value and expression percentage of each gene in different subclusters. (E) GCH1 and GK expression levels in monocytes/macrophages. (F) Correlation analysis between the expression levels of GCH1 and GK and M1/M2 signature scores in the monocyte/macrophage subset. Statistical significance was assessed using a two-tailed unpaired Student’s t test (E) and Pearson’s correlation test (F). ****p < 0.0001. |
The Expression Changes of Four Hub Genes in Monocytes/Macrophages After Anti-TB Treatment
Additionally, we analyzed another single-cell RNA-sequencing dataset, including two paired PBMC samples at TB diagnosis and at the end of TB treatment. After performing quality control and clustering into T cells and monocytes/macrophages (Figure S2C, S2D, Figure 9A, and Table S5), we found that GCH1, GK, and MTHFD2 were highly expressed in monocytes/macrophages, whereas SLC7A6 was sporadically expressed in the T cells (Figures 9B and S2E). Notably, GCH1, GK, and MTHFD2 expression levels significantly decreased in monocytes/macrophages after anti-TB treatment (Figure 9C), further confirming that these genes are associated with the efficacy of anti-TB therapy.
 |
Figure 9 Single-cell sequencing analysis illustrating the prognostic value of hub genes. Single-cell sequencing analysis of sorted monocytes/macrophages and T cells derived from PBMCs of two active TB patients at diagnosis and at the end of treatment downloaded from the GSE214237 dataset. (A) UMAP plot showing two subclusters of PBMCs. (B) Dot plot illustrating the average expression value and expression percentage of each gene in two subclusters. (C) The expression level of GCH1, GK, MTHFD2, and SLC7A6 genes in monocytes/macrophages in two paired active TB patients at diagnosis and at the end of treatment. (D) Expression value of four hub genes in PMA-polarized THP-1 cells under Mtb infection or not. Statistical significance was assessed using a two-tailed unpaired Student’s t test. **p < 0.01, ***p < 0.001, ****p < 0.0001. |
Given that all of these hub genes had a significant relationship with the abundance of macrophages, which play a pivotal role in defense against Mtb, we also evaluated the expression levels of four genes in Mtb-infected differentiated THP-1 cells. Similar to blood samples from patients with active TB, GCH1, GK, and MTHFD2 expressions were upregulated, whereas SLC7A6 level was downregulated in THP-1 cells after Mtb infection (Figure 9D). These results indicated that changes in the expression of the four hub genes in macrophages could partially explain the predictive value of these genes in blood samples.
Verification of Hub Gene Expressions in Our Collected PBMC Samples and Mtb-Infected Mouse Models
To further confirm the changes in hub gene expression levels, we collected clinical PBMC samples derived from patients with active TB and HC donors, followed by RNA purification and RT-qPCR analysis. As shown in Figure 10A–D, in comparison with HC donors, the PBMCs of TB patients exhibited elevated expression levels of GCH1, GK, and MTHFD2 and decreased expression levels of SLC7A6. ROC analysis also exhibited excellent prediction performance whether utilizing single gene or combined four genes (Figures 10E and S3), which corroborated the diagnostic potential of these hub genes in patients with active TB.
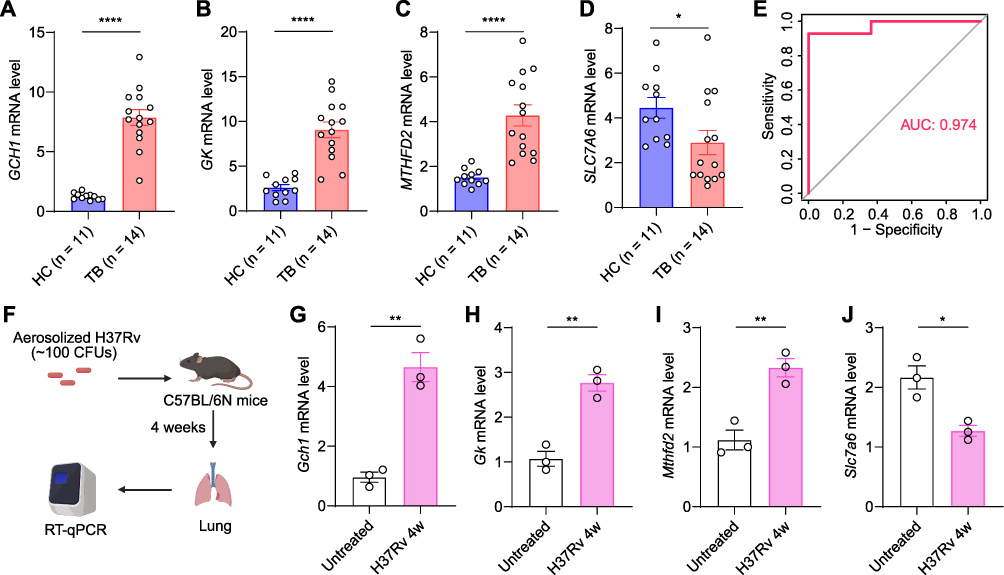 |
Figure 10 Confirmation of hub gene expressions in PBMCs and Mtb-infected mouse models. (A–D) RT-qPCR analysis of GCH1 (A), GK (B), MTHFD2 (C), and SLC7A6 (D) mRNA expression levels in PBMCs derived from HC donors and TB patients. (E) ROC curve based on four hub gene expressions. (F) Diagram illustrating the construction of H37Rv-infected mouse models. (G–J) Gch1 (G), Gk (H), Mthfd2 (I), and Slc7a6 (J) mRNA levels in lungs of untreated and H37Rv-infection mice. Statistical significance was assessed using a two-tailed unpaired Student’s t test. *p < 0.05, **p < 0.01, ****p < 0.0001. |
We established the Mtb-infected mouse model to evaluate the expression of these four hub genes in the lungs (Figure 10F). At Four weeks after Mtb infection, compared with uninfected lung tissues, Gch1, Gk, and Mthfd2 exhibited higher expression levels and Slc7a6 showed lower transcription levels (Figure 10G–J), suggesting that the four hub genes might participate in antituberculosis immune responses in situ.
Discussion
Metabolic reprogramming is a functional characteristic of Mtb infection that provides the possibility of serving as a diagnostic biomarker.20 In the present study, four metabolism-related genes (GCH1, GK, MTHFD2, and SLC7A6) were identified for the diagnosis of active TB through bioinformatic analysis. Subsequently, a nomogram with high predictive value was created. Immune infiltration analysis showed that myeloid cell enrichment occurred in patients with active TB and was strongly associated with the expression of the four hub genes. Single-cell sequencing results suggested that GCH1, GK, and MTHFD2 were predominantly expressed in monocytes/macrophages and their expression decreased after anti-TB treatment. Finally, Mtb-infected macrophage and TB patient data further confirmed the diagnostic potential of the four hub genes. This study is the first to construct a prediction model using metabolism-related genes for the diagnosis and treatment of active TB.
To accurately diagnose TB when microbiological cultures and tests are negative, blood transcriptomics, proteomics, and metabolomics are used to screen for biomarkers of active TB. For example, three ferroptosis-related genes, ACSL4, CTSB, and TLR4, are associated with TB progression and have been employed to differentiate active TB from latent infection with high AUC value.21 However, this study did not assess its predictive value in the new cohort. Shen et al found that seven programmed cell death-related genes exhibited high efficacy in TB diagnosis and showed a significant relationship with immune-related pathways.22 However, the expression of these genes was unstable in different datasets. Based on the metabolic changes during Mtb infection, we illustrated the differences in metabolism-related genes between patients with active TB and healthy donors. Using the LASSO regression and random forest models, four hub genes, GCH1, GK, MTHFD2, and SLC7A6, were identified for the diagnosis of active TB with high sensitivity and specificity. In addition, the combination of these four genes showed a higher accuracy than any single gene. Our results highlight an important role for metabolic reprogramming in TB progression.
GCH1, also known as DYT5, is a metabolic enzyme that converts GTP to 7,8-dihydroneopterin 3’-triphosphate, thus regulating the synthesis of tetrahydrobiopterin (BH4).23 GCH1 is mainly expressed in monocytes and is induced by cytokines. A series of transcription factors, such as specificity protein 1 (Sp1), nuclear factor κB (NF-κB), and activator protein 1(AP-1), can regulate GCH1 transcription. Given that BH4 can act as a cofactor for NO synthases, GCH1 may participate in antibacterial responses by induction of nitric oxide.23 The synthesis of BH4 by GCH1 could also remodel lipid metabolism and selectively prevent the depletion of phospholipids with two polyunsaturated fatty acyl tails, thus inhibiting ferroptosis.24–26 As Mtb can produce the mycobacterial effector PtpA to promote ferroptosis-mediated pathogenicity and expansion,27 upregulated GCH1 levels in active TB patients could be a protective strategy to counter Mtb-induced ferroptosis.
GK, a glycerol kinase, catalyses glycerol phosphorylation to produce sn-glycerol 3-phosphate, thus playing an important role in the synthesis of glycerophospholipids.28 GK is mainly expressed in the kidneys, esophagus, and liver. GK mutations can cause hypoglycemia.29 Kornfeld et al found that Mtb can utilize glycerol as a carbon source to survive and persist in the host cells.30 After Mtb infection, immune cells upregulate GK expression to decrease glycerol concentrations, which may provide protective immunity against Mtb.
MTHFD2 is a mitochondrial NADP+-dependent methylenetetrahydrofolate dehydrogenase, which produces NADPH for cellular detoxification. Overexpression of MTHFD2 occurs in many types of tumors, including thyroid, lung, colorectal, renal, and breast cancers, and predicted poor survival.31–33 However, its role in the host defense against Mtb remains unclear. We discovered that MTHFD2 expression levels were significantly increased in active TB patients and were positively correlated with M1 macrophage enrichment. This result suggested that MTHFD2 may reshape metabolic pathways and influence the differentiation of M1 macrophages. However, the precise mechanism of this phenomenon requires further investigation.
SLC7A6, when combined with SLC7A7 to form a heterodimer, acts as an amino acid transporter to export L-arginine in exchange for neutral amino acids containing L-glutamine and L-leucine. Recent research has shown that overexpression of SLC7A6 can induce robust uptake of glutamine into tumor cells, resulting in the activation of mTORC1 and progression of cancer.34,35 In the present study, we noticed that SLC7A6 expression was mainly associated with the abundance of follicular T helper cells and was downregulated in patients with TB, accompanied by poor follicular T helper cell enrichment. This result indicates that decreased SLC7A6 levels and reduced L-glutamine transportation might affect the antigen presentation by follicular T helper cells and the induction of humoral immunity, thus resulting in the dissemination of Mtb.
Single-cell RNA sequencing technology has been widely used to clarify the immune state and characteristics of Mtb-infected cells. However, changes in metabolism-related genes at the single-cell level have not received sufficient attention.36,37 In this study, we noticed that metabolism-related genes, including GCH1, GK, and MTHFD2, were highly expressed in active TB patient-derived monocytes/macrophages, suggesting that these genes may play an indispensable role in macrophage-mediated anti-Mtb immune responses. In future studies, we will further elucidate the precise mechanisms of these genes in the process of Mtb infection.
In conclusion, based on metabolism-related gene analysis using bulk and single-cell transcriptomics, we constructed a four-gene predictor model with high accuracy for the diagnosis and treatment efficacy in active TB patients. Given the limited size of our validation cohort, it will be beneficial to build the larger clinical datasets for further exploration of the predictive value of the four hub genes.
Conclusion
Changes in metabolism-related pathways are critical in Mtb infection. Our study identified four metabolism-related genes, GCH1, GK, MTHFD2, and SLC7A6, for the diagnosis and treatment evaluation of active TB with high accuracy, thus providing a new strategy for early TB detection. We found that the expression levels of these four genes showed a noticeable relationship with the enrichment of monocytes/macrophages, and GCH1, GK, and MTHFD2 expressions in monocytes/macrophages were significantly upregulated after Mtb infection and downregulated after anti-TB treatment, highlighting the indispensable role of metabolism-related genes in the anti-Mtb immune responses of monocytes/macrophages. This research not only deepens our knowledge of immunometabolic changes in the TB process but also offers new targets for TB diagnosis and intervention.
Data Sharing Statement
All data mentioned in this study are available from the corresponding author upon reasonable request.
Ethical Approval
The human experiments involved in our study have been ethically approved by the Ethics Committee of Beijing Chest Hospital, Capital Medical University under the number 2020KY030, and all procedures were conducted following the Declaration of Helsinki principles. Written informed consent was obtained from all volunteers. Mouse experiments in our study were performed in accordance with the National Institute of Health’s Guidelines for the Care and Use of Laboratory Animals and approved by the Ethics Committee of Beijing Chest Hospital, Capital Medical University under the number 2020-23.
Author Contributions
All authors made a significant contribution to the work reported, whether that is in the conception, study design, execution, acquisition of data, analysis and interpretation, or in all these areas; took part in drafting, revising or critically reviewing the article; gave final approval of the version to be published; have agreed on the journal to which the article has been submitted; and agree to be accountable for all aspects of the work.
Funding
This research was supported by the National Natural Science Foundation of China (grant number 82072243), the Beijing Hospitals Authority Ascent Plan (grant number DFL20221401), the Beijing Municipal Science & Technology Commission (grant number Z221100007422064 and Z221100007422056) and the Science and Technology Plan Project of Tongzhou District, Beijing (KJ2024CX028).
Disclosure
The authors declare no conflicts of interest in this work.
References
1. WHO. Global tuberculosis report 2024. 2024.
2. Xu J. Calling a step by step holistic integrative medical diagnosis roadmap for tuberculosis in China. J Transl Med. 2024;22(1):ARTN822. doi:10.1186/s12967-024-05610-z
3. Hamada Y, Gupta RK, Quartagno M, et al. Predictive performance of interferon-gamma release assays and the tuberculin skin test for incident tuberculosis: an individual participant data meta-analysis. Eclinicalmedicine. 2023;56:ARTN101815. doi:10.1016/j.eclinm.2022.101815
4. Yao FS, Zhang R, Lin Q, et al. Plasma immune profiling combined with machine learning contributes to diagnosis and prognosis of active pulmonary tuberculosis. Emerg Microbes Infec. 2024;13(1):Artn2370399. doi:10.1080/22221751.2024.2370399
5. Mittal E, Prasad GVRK, Upadhyay S, et al. Mycobacterium tuberculosis virulence lipid PDIM inhibits autophagy in mice. Nature Microbiology. 2024;9(11):2970–2984. doi:10.1038/s41564-024-01797-5
6. Chai Q, Yu S, Zhong Y, et al. A bacterial phospholipid phosphatase inhibits host pyroptosis by hijacking ubiquitin. Science. 2022;378(6616):153–+,ARTNeabq0132. doi:10.1126/science.abq0132
7. Chakraborty P, Bajeli S, Kaushal D, Radotra BD, Kumar A. Biofilm formation in the lung contributes to virulence and drug tolerance of Mycobacterium tuberculosis. Nat Commun. 2021;12(1):ARTN1606. doi:10.1038/s41467-021-21748-6
8. Smulan LJ, Martinez N, Kiritsy M, et al. Sirtuin 3 downregulation in mycobacterium tuberculosis-infected macrophages reprograms mitochondrial metabolism and promotes cell death. Mbio. 2021;12:ARTNe03140–20. doi:10.1128/mBio.03140-20
9. Kalam H, Chou C-H, Kadoki M, et al. Identification of host regulators of Mycobacterium tuberculosis phenotypes uncovers a role for the MMGT1-GPR156 lipid droplet axis in persistence. Cell Host Microbe. 2023;31(6):978–+. doi:10.1016/j.chom.2023.05.009
10. Sadiya Parveen JS, Lun S, Zhao L, et al. Glutamine metabolism inhibition has dual immunomodulatory and antibacterial activities against Mycobacterium tuberculosis. Nat Commun. 2023;14(1):7427. doi:10.1038/s41467-023-43304-0
11. Tiwari S, Van Tonder AJ, Vilchèze C, et al. Arginine-deprivation-induced oxidative damage sterilizes. P Natl Acad Sci USA. 2018;115:9779–9784. doi:10.1073/pnas.1808874115
12. Liu X, Yang M, Xu P, et al. Kynurenine-AhR reduces T-cell infiltration and induces a delayed T-cell immune response by suppressing the STAT1-CXCL9/CXCL10 axis in tuberculosis. Cellular Molecular Immunol. 2024;21(12):1426–1440. doi:10.1038/s41423-024-01230-1
13. Paez R, Chauhan S, Naqvi K, et al. Macrophage galactose-type lectin modulates host immunometabolism during Mycobacterium tuberculosis infection. J Immunol. 2024;212:ARTN01305863. doi:10.4049/jimmunol.212.supp.0130.5863
14. Pacl HT, Chinta KC, Reddy VP, et al. NAD(H) homeostasis underlies host protection mediated by glycolytic myeloid cells in tuberculosis. Nat Commun. 2023;14(1):ARTN5472. doi:10.1038/s41467-023-40545-x
15. Chandra P, Coullon H, Agarwal M, Goss CW, Philips JA. Macrophage global metabolomics identifies cholestenone as host/pathogen cometabolite present in human Mycobacterium tuberculosis infection. J Clin Invest. 2022;132(3):ARTNe152509. doi:10.1172/JCI152509
16. Gaude E, Frezza C. Tissue-specific and convergent metabolic transformation of cancer correlates with metastatic potential and patient survival. Nat Commun. 2016;7(1):ARTN13041. doi:10.1038/ncomms13041
17. Zhou Z, Dong D, Yuan Y, et al. Single cell atlas reveals multilayered metabolic heterogeneity across tumour types. Ebiomedicine. 2024;109:ARTN105389. doi:10.1016/j.ebiom.2024.105389
18. Newman AM, Liu CL, Green MR, et al. Robust enumeration of cell subsets from tissue expression profiles. Nat Methods. 2015;12(5):453–+. doi:10.1038/Nmeth.3337
19. Butler A, Hoffman P, Smibert P, Papalexi E, Satija R. Integrating single-cell transcriptomic data across different conditions, technologies, and species. Nat Biotechnol. 2018;36(5):411–+. doi:10.1038/nbt.4096
20. Howard NC, Khader SA. Immunometabolism during Mycobacterium tuberculosis Infection. Trends Microbiol. 2020;28(10):832–850. doi:10.1016/j.tim.2020.04.010
21. Yang BF, Zhai F, Li Z, et al. Identification of ferroptosis-related gene signature for tuberculosis diagnosis and therapy efficacy. Iscience. 2024;27(7):ARTN110182. doi:10.1016/j.isci.2024.110182
22. Shen J, Zhao C, Zhang H, Zhou PP, Li ZP. Classification of tuberculosis-related programmed cell death-related patient subgroups and associated immune cell profiling. Front Immunol. 2023;14:ARTN1159713. doi:10.3389/fimmu.2023.1159713
23. Gupta P, Kumar R. GTP cyclohydroxylase1 (GCH1): role in neurodegenerative diseases. Gene. 2023;888:ARTN147749. doi:10.1016/j.gene.2023.147749
24. Kraft VAN, Bezjian CT, Pfeiffer S, et al. GTP cyclohydrolase 1/tetrahydrobiopterin counteract ferroptosis through lipid remodeling. Acs Central Sci. 2020;6(1):41–53. doi:10.1021/acscentsci.9b01063
25. Du J, Zhu X, Zhang Y, et al. CTRP13 attenuates atherosclerosis by inhibiting endothelial cell ferroptosis via activating GCH1. Inter Immunopharmacol. 2024;143:ARTN113617. doi:10.1016/j.intimp.2024.113617
26. Jiang XJ, Stockwell BR, Conrad M. Ferroptosis: mechanisms, biology and role in disease. Nat Rev Mol Cell Bio. 2021;22(4):266–282. doi:10.1038/s41580-020-00324-8
27. Qiang LH, Zhang Y, Lei Z, et al. A mycobacterial effector promotes ferroptosis-dependent pathogenicity and dissemination. Na Commun. 2023;14(1):ARTN1430. doi:10.1038/s41467-023-37148-x
28. Ouyang SY, Zhuo S, Yang M, et al. Glycerol kinase drives hepatic de novo lipogenesis and triglyceride synthesis in nonalcoholic fatty liver by activating SREBP-1c transcription, upregulating DGAT1/2 expression, and promoting glycerol metabolism. Adv Sci. 2024;11(46). doi:10.1002/advs.202401311
29. Ying F, Chen XY, Lv LH. Glycerol kinase enzyme is a prognostic predictor in esophageal carcinoma and is associated with immune cell infiltration. Sci Rep-UK. 2024;14(1):ARTN3922. doi:10.1038/s41598-024-54425-x
30. Martinez N, Smulan LJ, Jameson ML, et al. Glycerol contributes to tuberculosis susceptibility in male mice with type 2 diabetes. Nat Commun. 2023;14(1):ARTN5840. doi:10.1038/s41467-023-41519-9
31. Shang M, Yang H, Yang R, et al. The folate cycle enzyme MTHFD2 induces cancer immune evasion through PD-L1 up-regulation. Nat Commun. 2021;12(1):ARTN1940. doi:10.1038/s41467-021-22173-5
32. Lee SE, Park S, Yi S, et al. Unraveling the role of the mitochondrial one-carbon pathway in undifferentiated thyroid cancer by multi-omics analyses. Nat Commun. 2024;15(1):ARTN1163. doi:10.1038/s41467-024-45366-0
33. Bonagas N, Gustafsson NM, Henriksson M, et al. Pharmacological targeting of MTHFD2 suppresses acute myeloid leukemia by inducing thymidine depletion and replication stress. Nat Cancer. 2022;3(2):156–+. doi:10.1038/s43018-022-00331-y
34. Chen XX, Wang Z, Zhao X, et al. STAT5A modulates CDYL2/SLC7A6 pathway to inhibit the proliferation and invasion of hepatocellular carcinoma by targeting to mTORC1. Oncogene. 2022;41(17):2492–2504. doi:10.1038/s41388-022-02273-2
35. Yang C, Ou Y, Zhou Q, et al. Methionine orchestrates the metabolism vulnerability in cisplatin resistant bladder cancer microenvironment. Cell Death Dis. 2023;14(8):ARTN525. doi:10.1038/s41419-023-06050-1
36. Pan JH, Chang Z, Zhang X, et al. Research progress of single-cell sequencing in tuberculosis. Front Immunol. 2023;14:ARTN1276194. doi:10.3389/fimmu.2023.1276194
37. Hillman H, Khan N, Singhania A, et al. Single-cell profiling reveals distinct subsets of CD14+ monocytes drive blood immune signatures of active tuberculosis. Front Immunol. 2023;13:ARTN1087010. doi:10.3389/fimmu.2022.1087010
 © 2025 The Author(s). This work is published and licensed by Dove Medical Press Limited. The
full terms of this license are available at https://www.dovepress.com/terms
and incorporate the Creative Commons Attribution
- Non Commercial (unported, 4.0) License.
By accessing the work you hereby accept the Terms. Non-commercial uses of the work are permitted
without any further permission from Dove Medical Press Limited, provided the work is properly
attributed. For permission for commercial use of this work, please see paragraphs 4.2 and 5 of our Terms.
© 2025 The Author(s). This work is published and licensed by Dove Medical Press Limited. The
full terms of this license are available at https://www.dovepress.com/terms
and incorporate the Creative Commons Attribution
- Non Commercial (unported, 4.0) License.
By accessing the work you hereby accept the Terms. Non-commercial uses of the work are permitted
without any further permission from Dove Medical Press Limited, provided the work is properly
attributed. For permission for commercial use of this work, please see paragraphs 4.2 and 5 of our Terms.