Back to Journals » Cancer Management and Research » Volume 12
Homer1 is a Potential Biomarker for Prognosis in Human Colorectal Carcinoma, Possibly in Association with G3BP1 Signaling
Authors Cui X ![]() , Liang H, Hao C, Jing X
, Liang H, Hao C, Jing X
Received 4 December 2019
Accepted for publication 31 March 2020
Published 28 April 2020 Volume 2020:12 Pages 2899—2909
DOI https://doi.org/10.2147/CMAR.S240942
Checked for plagiarism Yes
Review by Single anonymous peer review
Peer reviewer comments 2
Editor who approved publication: Dr Kenan Onel
Xiangrong Cui,1 Hongping Liang,2 Chonghua Hao,2 Xuan Jing2
1Reproductive Medicine Center, Children’s Hospital of Shanxi and Women Health Center of Shanxi, Affiliated of Shanxi Medical University, Taiyuan 030001, People’s Republic of China; 2Clinical Laboratory, Shanxi Provincial People’s Hospital, Affiliated of Shanxi Medical University, Taiyuan 030001, People’s Republic of China
Correspondence: Xuan Jing Tel +86-351-3360725
Email [email protected]
Background: Homer scaffolding protein 1 (Homer1) is a postsynaptic scaffold protein that regulates the structure and function of excitatory synaptic as well as its intracellular signal transduction. However, the role of Homer1 in colorectal cancer as well as the underlying molecular mechanisms has not been elucidated.
Materials and Methods: To evaluate the alternations of gene expression during colorectal cancer, Homer1 expression was analyzed using the gene expression profiling interactive analysis and Oncomine analyses. The prognostic value of Homer1 expression was validated by our own colorectal cancer specimens using RT-PCR. Then, the cell viability, migration and invasion of colorectal cancer cell lines were detected by CCK-8 and transwell assay.
Results: We obtained the following important results. (1) Homer1 expression was significantly higher in colorectal cancer than normal samples. (2) Among patients with colorectal cancer, those with higher Homer1 expression had a lower survival rate. (3) The major mutation type of Homer1 in colorectal cancer samples was missense mutation. (4) Homer1 was able to promote colorectal cancer cell proliferation, migration, and invasion through up-regulating G3BP1 in vitro.
Conclusion: Our findings suggest that Homer1 may play a role in malignancy of colorectal cancer mainly through the G3BP1 signaling pathway, which might be a potential indicator of poor prognosis.
Keywords: Homer1, colorectal cancer, prognosis, G3BP1
Introduction
Colorectal cancer is the most common malignancies of the digestive tract, with about one million new cases being diagnosed and more than 0.5 million deaths occurring yearly according to the World Health Organization.1,2 Colonoscopy, surgery, chemotherapy, and radiotherapy have been effective for colorectal cancer.3 However, patients may lose the opportunity because of metastasis, which leads to poor prognosis. Therefore, the progress in molecular diagnostic and recognition of prognostic value biomarkers in patients are desired in the medical field.
Homer1 belongs to a family of postsynaptic scaffolding proteins, prominently interacts with postsynaptic density (PSD) proteins.4 Previous studies have reported that a significant amount of Homer1 protein expressed is observed in various tumor cells (such as HCT116, HeLa, HEK 293, A549, and DU145) originated from tissues of colon, cervix, lung and kidney, suggesting that Homer1 may play some roles in these tumor cells.5–9 However, the precise role of Homer1 in colorectal cancer and the molecular mechanisms underlying its effects have not been elucidated.
In this report, we hypothesized that Homer1 might be a promising candidate as a diagnostic and prognostic marker for colorectal cancer. To test this hypothesis, we performed a bioinformatics method to determine the expression and prognostic value of Homer1 in colorectal cancer overall and its subtypes. Furthermore, we used human colorectal cancer cell lines to investigate the molecular mechanisms for the effect of increased Homer expression on colorectal cancer. Our results demonstrated that Homer1 is highly expressed in colorectal cancer and plays a role in malignant transformation mainly through the G3BP1 signaling pathway. These observations will contribute to the development and optimization of novel diagnosis and therapeutics for colorectal cancer.
Materials and Methods
Patients
This study enrolled 80 consecutive series of patients with colorectal cancer from Shanxi province of China. As a control, we used 40 non-tumor-adjacent tissues. Frozen tissues were collected at the Department of Oncology from Shanxi Provincial People’s Hospital (China). The patients ranged in age from 31 to 80 years with a mean age of 51.33 years. Informed written consent was obtained from each patient and the study was approved by the Ethics Committee of the Shanxi Medical University (Ethical code: 201922021).
GEPIA
GEPIA (Gene Expression Profiling Interactive Analysis; http://gepia.cancer-pku.cn/) is a web server specialized for analyzing the RNA sequencing expression data of 9736 tumours and 8587 normal samples from TCGA and Genotype-Tissue Expression (GTEx) project data, using a standard processing pipeline. We explored GEPIA data to obtain the expression of Homer1 in various types of human cancer and adjacent normal tissues, as well as validated the differential expression of Homer1 in colorectal cancer and corresponding normal tissues.10
Oncomine Database
Oncomine is a tumor microarray database and integrated data mining platform, through which people facilitate new and significant discoveries across genome-wide expression analyses.11 In our study, Student’s t-test was performed to calculate a p-value for comparing cancer samples and normal control. The fold change was defined as 2, and the p-value was set as 0.05.
PrognoScan Online Platform
To determine the prognostic value of Homer1 expression in colorectal cancer patients, we perform the PrognoScan online platform which provides the opportunity for linking gene transcriptional changes to prognosis (http://www.prognoscan.org).12 PrognoScan database could automatically calculate P-value, HR and 95% confidence intervals based on a certain gene expression, which last updated in March 2013.
cBioPortal Database
The cBio Cancer Genomics Portal (cBioPortal) is a publicly accessible visual resource (http://www.cbioportal.org/),13,14 which provides free and open access to data from more than 5000 tumor samples from 232 cancer studies in the TCGA database. The term “Homer1” was adopted to search the cBioPortal database and Colorectal Adenocarcinoma (TCGA, Nature 2012, n=276) cohort was adopted.15 The search parameters included putative copy-number aberrations and co-expression from RNA-seq data with default setting.
University of California Santa Cruz Cancer Genomics Browser
We assessed the association between the expression of Homer1 and G3BP1 using the colon cancer cohort in TCGA (The Cancer Genome Atlas) database (TCGA-COAD). To access and analyze the data we used the University of California Santa Cruz (UCSC) Xena browser (http://xena.ucsc.edu/), which included 551 cases of COAD with genomic and clinical data.
COSMIC Analysis for Homer1 Mutations
The COSMIC (Catalogue of Somatic Mutations in Cancer) database (http://cancer.sanger.ac.uk) was performed to analysis mutations in Homer1.16 An overview of the distribution of mutations and substitution types on the codogenic strand in large intestine cancer samples was generated, and the results are present in a pie chart.
Cell Lines and Cell Culture
Human colorectal carcinoma cell lines (DLD-1 and HT-29) were obtained from the American Type Culture Collection (ATCC, Rockville, MD, USA). These cells were cultured in DMEM/F12 medium supplemented with 10% fetal bovine serum, 100U/mL penicillin and 100 mg/mL streptomycin.
CCK-8 Detection of Viability
Cell viability was assayed by Cell Counting Kit-8 (CCK-8, ATgene, Taiwan, China) following manufacturer’s instructions. Cells were seeded in 96-well plates (104 cells/well) and cultured in 100µl serum-free medium for 24, 48, 72, and 96 hours. Subsequently, cells were incubated with 10% CCK-8 solution for 2h and the absorbance value (A) was measured at 450 nm using the microplate reader (BioTek, Epoch, VT). All measurements were carried out eight replicate, and each experiment was repeated at least three times.
Cell Migration and Invasion Ability Assay
The cell invasion and migration abilities were detected through Boyden assay. The cells in serum-free DMEM/F12 medium were planted into the upper chambers (Millipore, Burlington, MA, USA) that coated with or without 15μg Matrigel (BD Biosciences, Boston, MA, USA), respectively. Under the upper chamber were lower chambers that filled with 500μL DMEM/F12 supplemented with 10% FBS. After incubation for 24h at 37°C, the cells remaining on the upper membrane were removed with cotton wool. Cells were then fixed and stained with 0.2% crystal violet solution for 30 min. An inverted microscope (Eclipse Ti2; Nikon Corporation) was performed to count (five high-power fields per chamber) the invading and migratory cells attached to the adaxial surface of the filter were counted.
Western Blot Analysis
Proteins from colorectal cancer cell lines were extracted with lysis buffer follow instructions (Nanjing KeyGen Biotech Co., Ltd., Nanjing, China). The BCA Protein Assay kit (Nanjing KeyGen Biotech Co., Ltd., Nanjing, China) was applied to detect the protein concentration. Protein lysate was separated on SDS-PAGE gels and transferred subsequently onto polyvinylidene fluoride membranes (EMD Millipore). TBS containing 0.1% Tween-20 was performed to block the membrane. Then, membranes were incubated with rabbit anti Homer1 monoclonal antibody (ab184955; Abcam, Cambridge, MA, USA), G3BP1 (ab181150; Abcam, Cambridge, MA, USA) or GAPDH (cat. no. T0004; 1:5000; Affinity Biosciences) overnight, and were cultured with goat anti-rabbit IgG horseradish peroxidase-conjugated secondary antibodies (1:5000; cat. no. SA00001-2; ProteinTech Group, Inc., Chicago, IL, USA) for 2 h at 37°C. Enhanced chemiluminescence (ECL) reagents (cat. no. KGP1127; Nanjing KeyGen Biotech Co., Ltd) were utilized to reveal protein bands. The protein levels were normalized to the GAPDH protein levels.
Statistical Analysis
Statistical analysis was using GraphPad Prism 7.0 (GraphPad Software, San Diego, CA). Student’s t-test was applied to identify differences between two groups. OS was analyzed by Kaplan-Meier survival curves and the statistical comparisons were performed through Log-rank test. All statistical examines were two-sided. P-values of less than 0.05 were considered to indicate statistical significance.
Results
Homer1 Transcript Expression Status in Human Colorectal Cancer
The expression profile of Homer1 was determined through gene expression profiling interactive analysis (GEPIA). GEPIA data showed that Homer1 was highly expressed in colon cancer samples compared with matched normal samples (Figure 1). To further confirm this result, the Oncomine database was performed to analyze the expression of Homer1. Elevated mRNA levels of Homer1 were determined in various human tumors, including colorectal cancer, gastric cancer, head and neck cancer, liver cancer, myeloma, and pancreatic cancer (Figure 2A). Homer1 expression was significantly higher in colorectal carcinoma, colon carcinoma epithelia, colon carcinoma, and rectal adenocarcinoma than in normal samples (Table 1, Figure 2B).
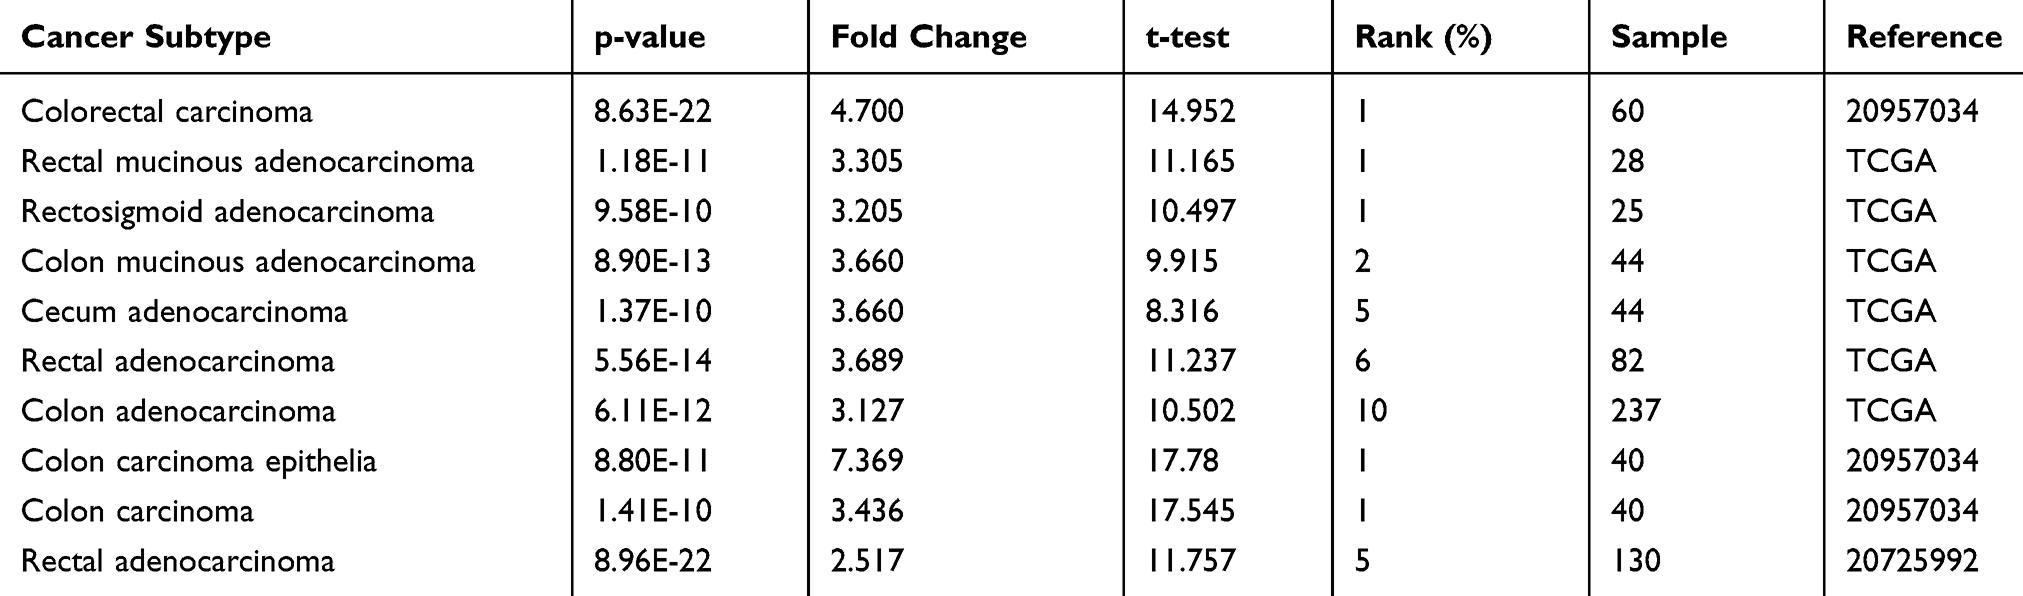 |
Table 1 Homer1 Expression in Colorectal Carcinoma |
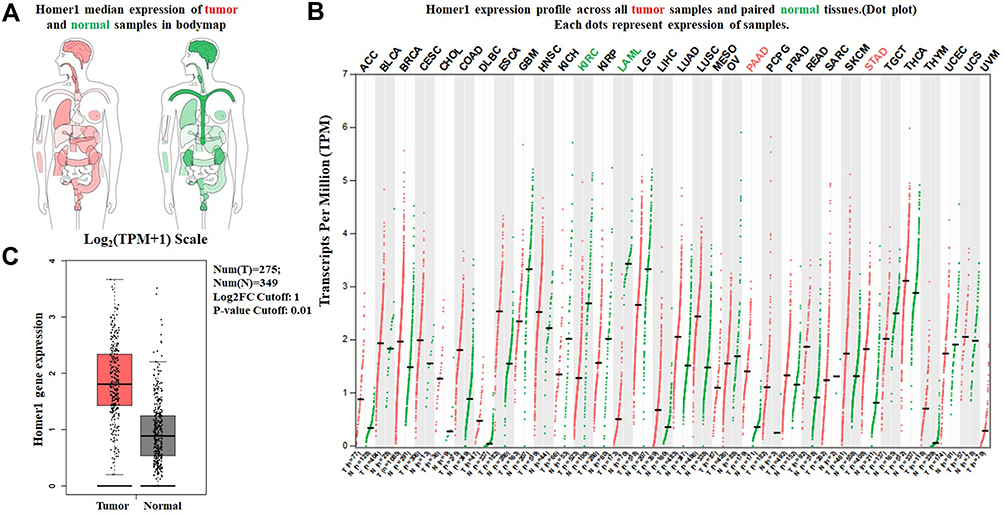 |
Figure 1 Expression of Homer1 in colorectal cancer and normal tissues from GEPIA. (A) Homer1 median expression of tumor (red) and normal (green) samples in body map. (B) Homer1 expression profile across all tumor (red) and paired normal (green) tissues. Each dot represents the expression of sample. (C) The expression of Homer1 mRNA in colorectal cancer tissues (red box) and paired normal tissues (black box) from GEPIA. |
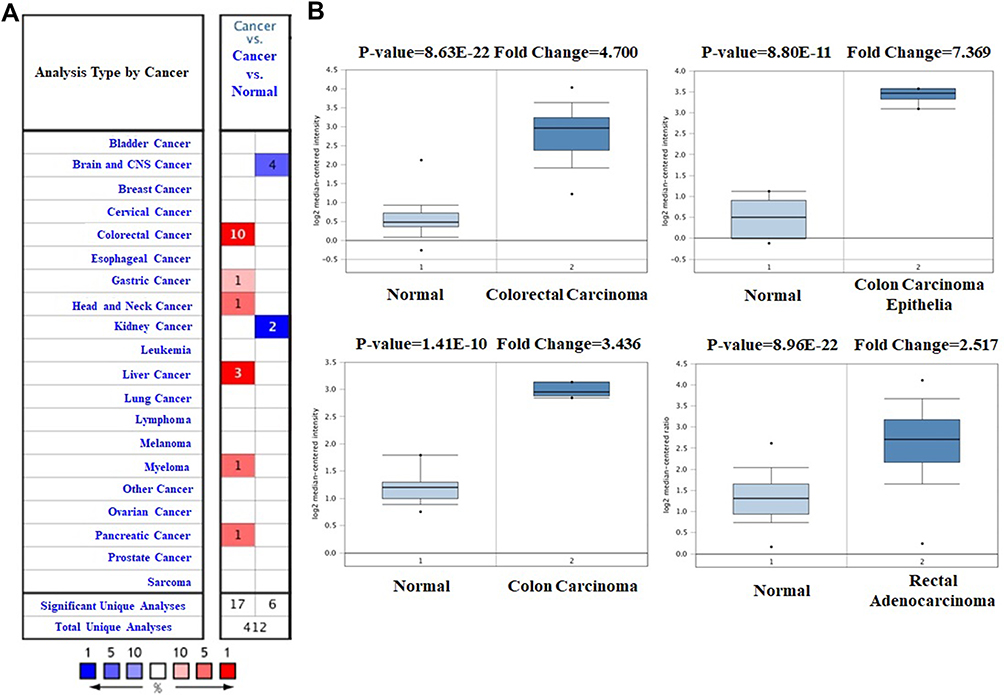 |
Figure 2 Homer1 analysis in colorectal cancer (Oncomine database). (A) The online Oncomine analysis tool (red: overexpression, blue: down expression) was performed to compare Homer1 expression levels in colorectal cancer specimens with matched normal specimens. The thresholds for significant probes for each microarray dataset included a two-fold difference in expression between cancer and normal samples and P<0.0001. (B) The box plot compares Homer1 expression in cancer samples (right) and matches normal (left) samples generated from the Oncomine database. |
Homer1 Mutation in Colorectal Cancer
The pie chart in Figure 3 generated through COSMIC summarizes the mutation types of Homer1 in colorectal cancer. Mutations in colorectal cancer samples included 11.63% nonsense substitutions, 34.88% missense substitutions, 11.63% synonymous substitutions, and 2.33% inframe deletions (Figure 3A). Homer1 mutations in colorectal cancer samples were 28.00% A > G, 4.00% A > T, 4.00% C> A, 36.00% C > T, 20.00% G > A, 4.00% G > T, and 4.00 T > G (Figure 3A). As identified using cBioPortal, the Homer1 mutation frequency was less than 3.5% in colorectal cancer patients. A total of 24 mutation sites (including 19 missense mutations, 1 in-frame mutation, and 4 truncating mutations) were detected between amino acids 0 and 354. (Figure 3B).
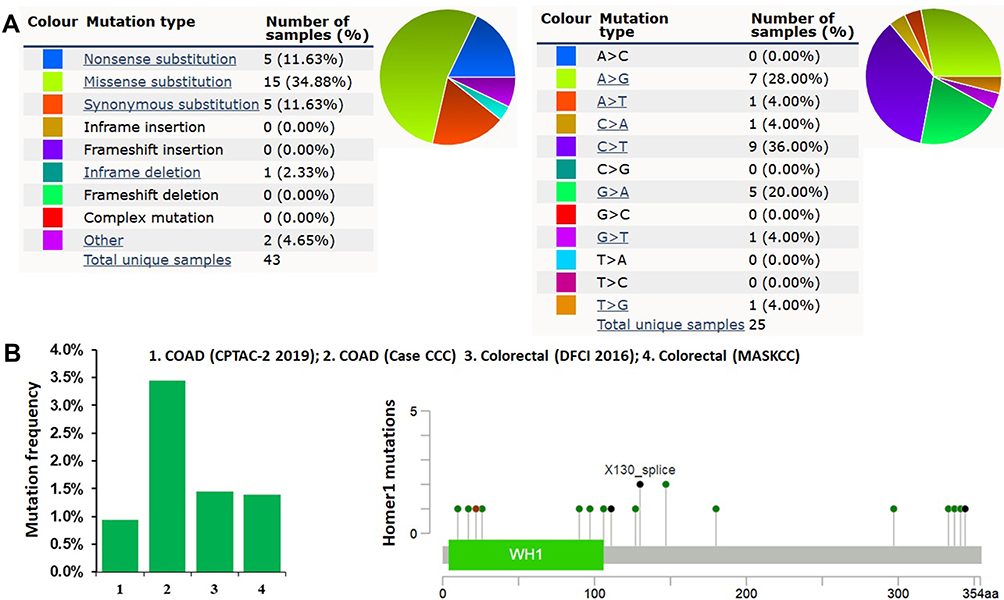 |
Figure 3 Homer1 mutations in human colorectal cancer. (A) The pie chart generated by COSMIC summarizes the observed mutation types, including nonsense substitutions, missense substitutions, synonymous substitutions, inframe insertions, frameshift insertions, inframe deletions, frameshift deletions, and complex mutations. (B) As determined by cBioPortal, the Homer1 mutation frequency was less than 3.5% in patients with colorectal cancer. A total of 24 mutation sites (including 19 missense mutations, 1 in-frame mutation, and 4 truncating mutations) were detected between amino acids 0 and 354. |
Relationship of Homer1 Expression and Prognosis in Colorectal Cancer
To evaluate whether the expression level of Homer1 has predictive value for colorectal cancer prognosis, we applied the online survival analysis software PrognoScan tool. The tool allowed us to identify the expression of Homer1 as dichotomized values. Homer1 was observed to be negatively correlated with overall survival (HR=1.53 [1.05–2.24], p=0.01875) and disease-specific survival (HR=2.08 [0.99–4.38], p=0.035537), as suggested by the survival curve (Figure 4A and B). Our own results demonstrated the overexpression of Homer1 mRNA and worse probabilities of survival in colorectal cancer (Figure 5A and B).
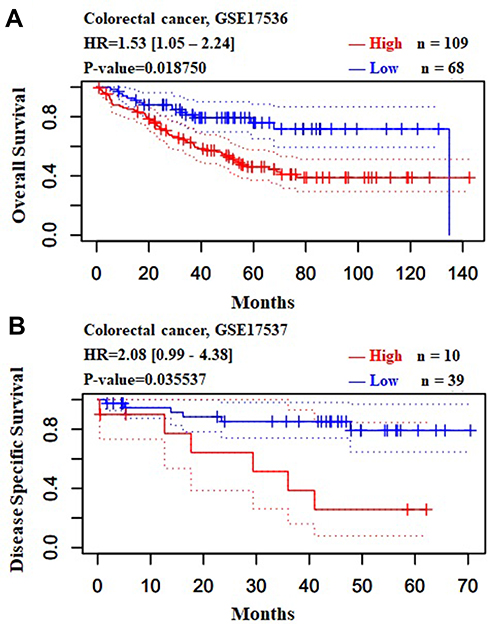 |
Figure 4 Relationship of Homer1 expression and prognosis in colorectal cancer. (A) Overall survival (OS) curves calculated by PrognoScan tool. (B) Disease-specific survival (DSF) curves calculated by PrognoScan tool. Survival probability is displayed on the y-axis, time (in months) on the x-axis. Blue curves represent low Homer1 expression, and red curves represent hing Homer1 expression. |
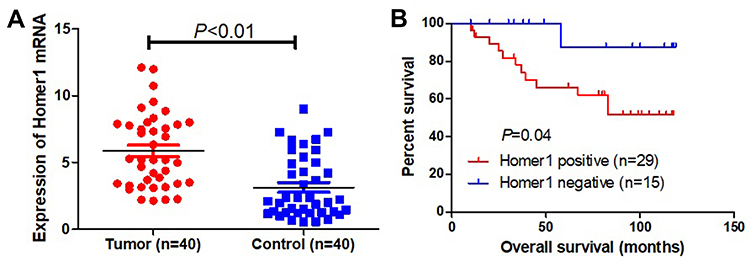 |
Figure 5 Homer1 as a prognosis marker in breast cancer. (A) Expression of Homer1 in tumor (40 cases) and adjacent normal mammary epithelium (40 cases). (B) Kaplan–Meier curves based on Homer1 expression were drawn for overall survival in 40 patients. |
Co-Expression of Homer1 Gene
To further identify the regulatory mechanisms underlying the role of Homer1 in colorectal cancer, data mining was performed for a colorectal cancer cohort using cBioPortal. G3BP1 is a highly correlated gene (Figure 6A); it drives growth in a variety of tumour tissues and cancers through regulating multiple signaling pathways that promote tumor growth.17 A regression analysis using cBioPortal revealed that Homer1 and G3BP1 levels are highly correlated (Figure 6B). The positive correction between Homer1 and G3BP1 mRNA expression was identified using data from GEPIA (Figure 6C). By investigating colorectal cancer data was confirmed (Figure 6D and E). This data informed that Homer1 could be associated with the G3BP1 pathway in colorectal cancer.
 |
Figure 6 (A) Co-expression of Homer1 gene as determined by cBioPortal. (B) Regression analysis between Homer1 and G3BP1 in colorectal performed by cBioPortal. (C) Relationship between Homer1 and G3BP1 in colorectal determined through GEPIA. (D) Heat map of Homer1 and G3BP1 mRNA expression in colorectal cancer identified by UCSC Xena. (E) Correlation between Homer1 and G3BP1 mRNA expression in the TCGA database, identified through UCSC Xena. |
G3BP1 mRNA Expression and Prognosis in Patients with Colorectal Cancer
To investigate the genetic alterations of G3BP1, the GEPI tool was performed to identify the expression profiles of G3BP1. The results of G3BP1 analysis informed that G3BP1 highly expressed in colon cancer tissues compared with matched normal tissues (Figure 7A). Subsequently, the prognostic value of G3BP1 in breast cancer was identified by PrognoScan database. It was demonstrated that G3BP1 mRNA expression was significantly associated with reduced disease-free survival (DFS) time in colorectal cancer (Figure 7B).
 |
Figure 7 (A) The expression of G3BP1 mRNA in colorectal cancer tissues (red box) and paired normal tissues (black box) from GEPIA. (B) Disease-Free Survival (DFS) curves calculated by PrognoScan tool. |
Homer1 Accelerated the Cell Growth, Invasion and Migration of Colorectal Cancer Cells Through Up-Regulating G3BP1
To explore the function of Homer1 in the development of colorectal cancer cells, CCK-8 assay was carried out. si-Homer1, non-targeting control siRNA or their corresponding NCs were transfected into DLD-1 and HT-29 colorectal cell lines. Figure 8A demonstrates that growth of colorectal cancer cells was significantly inhibited by si-Homer1 (P<0.05). Furthermore, si-Homer1 also inhibited migrated, invasion ability of colorectal cancer cells (Figure 8B and C). In addition, the G3BP1 expression was inhibited by down-regulation of Homer1 in colorectal cancer cells (Figure 9). Then, down-regulation of G3BP1 by transfecting si-G3BP1 in colorectal cancer cells also inhibited growth, invasion and migration ability of colorectal cells (Figure 10A–C). All these results manifested that Homer1 was able to promote colorectal cancer cell progression through up-regulating G3BP1 in vitro.
 |
Figure 8 Homer1 accelerated the cell growth, invasion and migration of colorectal cancer cells. (A) The cell proliferation of colorectal cancer cell lines DLD-1 and HT-29 transfected with different interference sequences, cell proliferation was the weakest in si-Homer1 group. (B) Invasion assays of two kinds of cancer cells under different interference conditions. (C) Migration assays of two kinds of cancer cells under different interference conditions. **P<0.01, compared with NC group. |
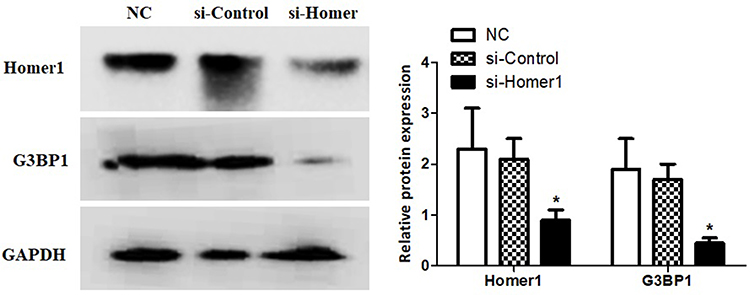 |
Figure 9 Homer1 regulates the expression of G3BP1. The Western blot showed G3BP1 expression was significantly decreased in si-Homer1 group in DLD-1 cells. *P<0.05, compared with NC group. |
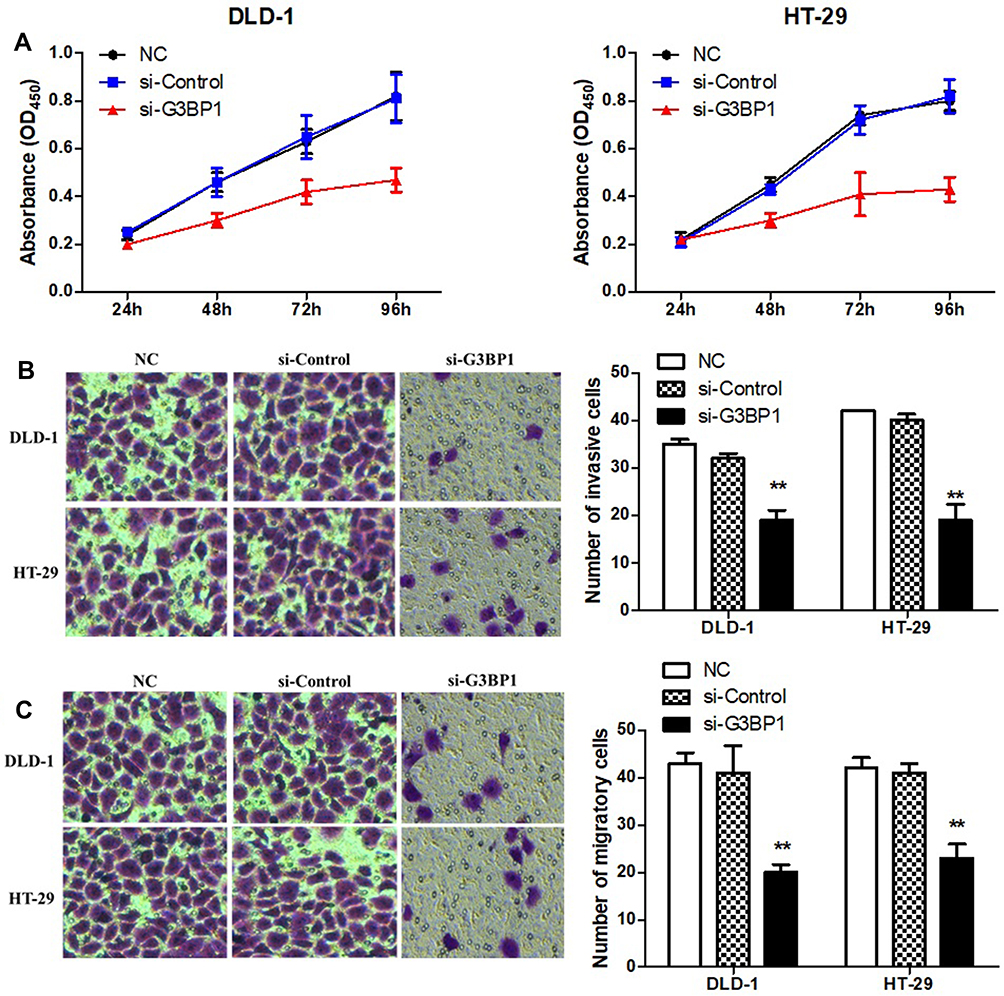 |
Figure 10 G3BP1 accelerated the cell growth, invasion and migration of colorectal cancer cells. (A) The cell proliferation of colorectal cancer cell lines DLD-1 and HT-29 transfected with different interference sequences, cell proliferation was the weakest in si-G3BP1 group. (B) Invasion assays of two kinds of cancer cells under different interference conditions. (C) Migration assays of two kinds of cancer cells under different interference conditions. **P<0.01, compared with NC group. |
Discussion
Homer1, a postsynaptic scaffold protein, has two isoforms, short variant Homer1a and long variant Homer1b/c, playing an essential role in the regulation of excitatory synaptic structure and function as well as transduction of intracellular signaling.18,19 Numerous researches suggested that Homer's expression is not only observed in nervous system but also observed in various peripheral tissues, including skeletal muscle, myocardium and vascular endothelium.4,20-22 Shin et al revealed that Homer1 protein accumulates significantly in the various tumor cells originated from tissues of colon, lung, kidney, and cervix, indicating that Homer1 may play some roles in tumorigenesis.23 Furthermore, overexpressed Homer1 has also been verified could promote lymphatic invasion and associate with poor prognosis of hepatocellular carcinoma and intrahepatic cholangiocarcinoma.8,9 However, the prognostic significance of Homer1 expression in colorectal cancer is still unclear.
To determine the role of Homer1 in the development, metastasis, and prognosis of colorectal cancer, we evaluated extensive gene expression profiling with well-defined parameters in colorectal cancer. Using GEPIA, we verified that Homer1 expression is significantly higher in colorectal cancer tissues than in normal controls. Using Oncomine, we found that Homer1 is overexpressed in colorectal carcinoma, colon carcinoma epithelia, colon carcinoma, and rectal adenocarcinoma. Subsequently, the frequencies of alterations and mutations of Homer1 were evaluated by COSMIC and cBioPortal databases. We found that the main type of mutation of Homer1 in colorectal cancer was missense mutations. Survival analysis demonstrated that overexpressed Homer1 related significantly with reduced OS and DSS time. We further use our own results demonstrated the overexpression of Homer1 and worse probabilities of survival in colorectal cancer, which revealed that the mRNA level of Homer1 may be a valuable biomarker for the prognosis of patients with colorectal cancer.
By mining co-expression and correlation data, we found that G3BP1 was co-overexpressed with Homer1 in colorectal cancer. G3BP1, a conserved, containing two RNA-binding motifs in C-terminal region, regulates various biological processes, including cell growth, apoptosis, RNA metabolism, differentiation, and metastasis. Multiple studies have revealed that G3BP1 is closely related to the occurrence and development of various solid malignancies. Thus, we further investigated the expression and survival association of G3BP1 in colorectal cancer. The results revealed that G3BP1 mRNA was significantly increased in colorectal cancer which associated with reduced DFS time in colorectal cancer. These results indicate that the expression of Homer1 may regulate tumor invasion and metastasis related to G3BP1 transcription.
Subsequently, we adopt siRNA technology to knock down the expression of Homer1 in colorectal cancer cells. The experiment demonstrated that Homer1 might be a potent factor promoting the proliferation, migration, and invasion of colorectal cancer. Furthermore, we detected the expression level of G3BP1 after Homer1 knockdown in colorectal cancer cell lines. Meanwhile, down-regulation of G3BP1 by transfecting si-G3BP1 in colorectal cancer cells also inhibited growth, invasion and migration ability of colorectal cancer cells. The results preliminarily confirmed our hypothesis that Homer1 plays a role in promoting cancer through the G3BP1 signaling pathway.
In summary, Homer1 is highly expressed in colorectal cancer and is an independent risk factor for poor prognosis in colorectal cancer patients. Homer1 has a role in malignancy mainly through the G3BP1 signaling pathway, which is a potential therapeutic target for colorectal cancer. However, our understanding of the regulatory mechanism of Homer1 in colorectal cancer is limited and requires further exploration.
Disclosure
The authors report no conflicts of interest in this work.
References
1. Nishiumi S, Kobayashi T, Kawana S, et al. Investigations in the possibility of early detection of colorectal cancer by gas chromatography/triple-quadrupole mass spectrometry. Oncotarget. 2017;8:17115–17126. doi:10.18632/oncotarget.15081
2. Ferlay J, Soerjomataram I, Dikshit R, et al. Cancer incidence and mortality worldwide: sources, methods and major patterns in GLOBOCAN 2012. Int J Cancer. 2015;136:E359–E386. doi:10.1002/ijc.29210
3. Kuipers EJ, Grady WM, Lieberman D, et al. Colorectal cancer. Nat Rev Dis Primers. 2015;1:15065. doi:10.1038/nrdp.2015.65
4. Rybchyn MS, Islam KS, Brennan-Speranza TC, et al. Homer1 mediates CaSR-dependent activation of mTOR complex 2 and initiates a novel pathway for AKT-dependent beta-catenin stabilization in osteoblasts. J Biol Chem. 2019;294:16337–16350. doi:10.1074/jbc.RA118.006587
5. Soloviev MM, Ciruela F, Chan WY, McIlhinney RA. Molecular characterisation of two structurally distinct groups of human homers, generated by extensive alternative splicing. J Mol Biol. 2000;295:1185–1200. doi:10.1006/jmbi.1999.3436
6. Soloviev MM, Ciruela F, Chan WY, McIlhinney RA. Mouse brain and muscle tissues constitutively express high levels of Homer proteins. Eur J Biochem. 2000;267:634–639. doi:10.1046/j.1432-1327.2000.01078.x
7. Dai X, Zhang N, Cheng Y, et al. RNA-binding protein trinucleotide repeat-containing 6A regulates the formation of circular RNA circ0006916, with important functions in lung cancer cells. Carcinogenesis. 2018;39:981–992. doi:10.1093/carcin/bgy061
8. Luo P, Feng X, Jing W, et al. Clinical and diagnostic significance of Homer1 in hepatitis B virus-induced hepatocellular carcinoma. J Cancer. 2018;9:683–689. doi:10.7150/jca.22279
9. Wu SY, Yu MX, Li XG, et al. Identification of Homer1 as a potential prognostic marker for intrahepatic cholangiocarcinoma. Asian Pac J Cancer Prev. 2014;15:3299–3304. doi:10.7314/APJCP.2014.15.7.3299
10. Tang Z, Li C, Kang B, Gao G, Li C, Zhang Z. GEPIA: a web server for cancer and normal gene expression profiling and interactive analyses. Nucleic Acids Res. 2017;45(W1):W98–W102. doi:10.1093/nar/gkx247
11. Rhodes DR, Yu J, Shanker K, et al. ONCOMINE: a cancer microarray database and integrated data-mining platform. Neoplasia. 2004;6:1–6. doi:10.1016/S1476-5586(04)80047-2
12. Mizuno H, Kitada K, Nakai K, Sarai A. PrognoScan: a new database for meta-analysis of the prognostic value of genes. BMC Med Genomics. 2009;2:18. doi:10.1186/1755-8794-2-18
13. Gao J, Aksoy BA, Dogrusoz U, et al. Integrative analysis of complex cancer genomics and clinical profiles using the cBioPortal. Sci Signal. 2013;6:pl1. doi:10.1126/scisignal.2004088
14. Wu P, Heins ZJ, Muller JT, et al. Integration and analysis of CPTAC proteomics data in the context of cancer genomics in the cBioPortal. Mol Cell Proteomics. 2019;18:1893–1898. doi:10.1074/mcp.TIR119.001673
15. Cancer Genome Atlas N. Comprehensive molecular characterization of human colon and rectal cancer. Nature. 2012;487:330–337. doi:10.1038/nature11252
16. Tate JG, Bamford S, Jubb HC, et al. COSMIC: the catalogue of somatic mutations in cancer. Nucleic Acids Res. 2019;47:D941–D947. doi:10.1093/nar/gky1015
17. Zhang CH, Wang JX, Cai ML, Shao R, Liu H, Zhao WL. The roles and mechanisms of G3BP1 in tumour promotion. J Drug Target. 2019;27:300–305.
18. Brakeman PR, Lanahan AA, O’Brien R, et al. Homer: a protein that selectively binds metabotropic glutamate receptors. Nature. 1997;386:284–288. doi:10.1038/386284a0
19. Salanova M, Volpe P, Blottner D. Homer protein family regulation in skeletal muscle and neuromuscular adaptation. IUBMB Life. 2013;65:769–776. doi:10.1002/iub.1198
20. Jing X, Chen SS, Jing W, Tan Q, Yu MX, Tu JC. Diagnostic potential of differentially expressed Homer1, IL-1beta, and TNF-alpha in coronary artery disease. Int J Mol Sci. 2014;16:535–546.
21. Zhu L, Zhu J, Guo SW. Homer1/mGluR1-mediated ER stress contributes to lysophosphatidic acid-induced neurotoxicity in cortical neurons. Neurochem Int. 2019;129:104515. doi:10.1016/j.neuint.2019.104515
22. Pang S, Li Y, Chen W, et al. Pb exposure reduces the expression of SNX6 and Homer1 in offspring rats and PC12 cells. Toxicology. 2019;416:23–29. doi:10.1016/j.tox.2019.02.002
23. Shin JN, Piya S, Yun CW, et al. Homer1 regulates the susceptibility to TRAIL. Exp Cell Res. 2009;315:2249–2255.
 © 2020 The Author(s). This work is published and licensed by Dove Medical Press Limited. The
full terms of this license are available at https://www.dovepress.com/terms
and incorporate the Creative Commons Attribution
- Non Commercial (unported, 3.0) License.
By accessing the work you hereby accept the Terms. Non-commercial uses of the work are permitted
without any further permission from Dove Medical Press Limited, provided the work is properly
attributed. For permission for commercial use of this work, please see paragraphs 4.2 and 5 of our Terms.
© 2020 The Author(s). This work is published and licensed by Dove Medical Press Limited. The
full terms of this license are available at https://www.dovepress.com/terms
and incorporate the Creative Commons Attribution
- Non Commercial (unported, 3.0) License.
By accessing the work you hereby accept the Terms. Non-commercial uses of the work are permitted
without any further permission from Dove Medical Press Limited, provided the work is properly
attributed. For permission for commercial use of this work, please see paragraphs 4.2 and 5 of our Terms.