")
Back to Journals » International Journal of Nanomedicine » Volume 12
Highly sensitive voltamperometric determination of pyritinol using carbon nanofiber/gold nanoparticle composite screen-printed carbon electrode
Authors Apetrei IM, Apetrei C
Received 6 April 2017
Accepted for publication 24 May 2017
Published 21 July 2017 Volume 2017:12 Pages 5177—5188
DOI https://doi.org/10.2147/IJN.S138978
Checked for plagiarism Yes
Review by Single anonymous peer review
Peer reviewer comments 3
Editor who approved publication: Dr Thomas Webster
Irina Mirela Apetrei,1 Constantin Apetrei2
1Department of Pharmaceutical Sciences, Medical and Pharmaceutical Research Center, Faculty of Medicine and Pharmacy, 2Department of Chemistry, Physics and Environment, Faculty of Sciences and Environment, “Dunarea de Jos” University of Galati, Galati, Romania
Abstract: A novel and highly sensitive electrochemical method for the detection of pyritinol in pharmaceutical products and serum samples has been accomplished based on voltamperometric response of pyritinol in carbon nanofiber-gold nanoparticle (CNF-GNP)-modified screen-printed carbon electrode (SPCE). The electrochemical response of pyritinol to CNF-GNP-modified SPCE was studied by cyclic voltammetry and square-wave voltammetry (SWV). Under optimized working conditions, the novel sensor shows excellent voltamperometric response toward pyritinol. The SWV study shows significantly enhanced electrochemical response for pyritinol in CNF-GNP-modified SPCE providing high sensitivity to the novel sensor for pyritinol detection. The peak current for pyritinol is found to be linear with the concentration in the range 1.0×10⁻⁸–5.0×10⁻⁵ M with a detection limit of 6.23×10⁻⁹ M using SWV as the detection method. The viability of the new developed sensor for the analytical purposes was studied by performing experiments on various commercial pharmaceutical products and blood serum samples, which yielded adequate recoveries of pyritinol. The novel electrochemical sensor provides high sensitivity, enhanced selectivity, good reproducibility and practical applicability.
Keywords: pyritinol, carbon nanofiber, gold nanoparticle, sensor, square-wave voltammetry
Introduction
Pyritinol (pyrithioxine), 5,5′-[dithiobis(methylene)]bis[4-(hydroxymethyl)-2-methylpyridin-3-ol], Chemical Abstracts Service (CAS) number 1098-07-1, is a semi-synthetic drug structurally related to vitamin B6 containing two vitamin B6 molecules bonded by a disulfide bridge.1,2
Pyritinol and its dihydrochloride derivative are recognized as cognition-enhancing agents and used to improve cerebral microcirculation in ischemic regions.3–5 It reduces permeability of blood–brain barrier to phosphate ions.6 Additionally, it enhances permeability of blood–brain barrier to glucose and protects the neurons against hypoxia and glucose metabolism disorder.7
Pyritinol dihydrochloride is as a nootropic drug commercialized as Encephabol® (Merck KGaA, Darmstadt, Germany) and used mainly in the treatment of several cerebrovascular and cognitive disorders.8 Until recently, pyritinol dihydrochloride has been used for patients with cerebral functional disorders,9 dementia,10,11 Alzheimer’s disease,12 rheumatoid arthritis,13 hypoxic hypoxidosis,14 alcoholism,15 dyslexia,16 Tourette’s syndrome,17 behavioral disorders in children18 and general cognitive decline.19,20 Additionally, in animals, pyritinol dihydrochloride has shown to improve or facilitate restoration of age-related brain deficits,21 the recovery of cortical cholinergic deficits,22 sleep,23 learning and memory24 and epilepsy.25 Furthermore, pyritinol has shown to have anti-aging effects,2 and to reduce oxidative stress in vitro.7,26 However, overdose may cause adverse effects, such as anorexia, epigastric distress, fatigue, headache, sleep disturbances, skin rash, acute pancreatitis and increased excitement.3,27 Therefore, its detection and quantification in pharmaceutical and biological samples are of utmost importance.
Various analytical methods, such as colorimetric,28,29 spectrophotometric,30,31 high-performance thin-layer chromatographic32 and high-performance liquid chromatographic,33 methods have been performed for the determination of pyritinol. These classical methods present the advantage of high precision, but they also have some drawbacks, such as being complex, expensive and time consuming. Therefore, these methods are difficult to perform in routine analysis or on-site monitoring.34
Taking into account the low level of analytes in biological fluids, as well as in pharmaceutical samples, and the complexity of such samples, new rapid, simple and portable methods with high sensitivity and selectivity and reduced costs are required.
Electrochemical techniques could meet these requirements, being characterized by high sensitivity and rapidity, low cost instrumentation, simplicity and portability for on-line, in-line or real-time monitoring. However, at present and to the best of our knowledge, only few studies related to detection of pyritinol by electrochemical methods based on polarographic,35,36 potentiometric37 and conductometric38 methods are reported. To the best of our knowledge, this paper is the first study related to the detection of pyritinol by means of voltamperometric sensors.
Among voltamperometric sensors, the ones based on sensitive nanomaterials have recently received remarkable attention.39 The most frequently studied sensitive materials used in sensor development are nanocomposites, which are mixtures of carbonaceous nanomaterials (ie, nanotubes, nanofibers and graphene) with other molecular compounds or nanoscaled materials, for example, metallic nanoparticles.40–42
Carbon nanofibers (CNFs) are of great interest in sensitive nanocomposite development because their main characteristic is the assembling of graphene sheets of different shapes, producing more active sites on the outer graphitic wall, which accelerates the electron transfer of electrochemically active species to the surface.43 At the same time, gold nanoparticles (GNPs) have also been shown to display great conductivity, enhanced electrocatalytic activity and biocompatibility.44 Therefore, it can be expected that a synergistic effect of both CNFs and GNPs (CNF-GNP) together can lead to a highly sensitive voltamperometric sensor for the determination of pyritinol.
In this study, a novel sensor based on CNF-GNP nanocomposite was designed for electrochemical detection of pyritinol. This nanocomposite was developed by mixing CNFs with water, followed by in situ synthesis of GNPs from precursors by chemical reduction. The CNF-GNP nanocomposite was used to modify the working electrode surface of screen-printed carbon electrode (SPCE). The developed sensor was electrochemically characterized, and then used for determination and quantification of pyritinol. Square-wave voltammetry (SWV) technique was optimized in order to improve the sensitivity and selectivity of the sensor. The sensor was used to quantify the amount of pyritinol in pharmaceutical products and blood serum samples in order to test its applicability.
Materials and methods
Materials and reagents
All chemical products used in the experimental studies were of analytical grade and used as such without any additional purification. CNFs (D [diameter] × L [length]: 100 nm ×20–200 μM) were purchased from Sigma-Aldrich Co. (St Louis, MO, USA). L-ascorbic acid was acquired from Riedel-de Haën, Seelze, Germany. Tetrachloroauric (III) acid (HAuCl4), sodium citrate, sodium dihydrogen phosphate, disodium hydrogen phosphate, hydrochloric acid, sodium hydroxide, ethanol absolute, potassium ferricyanide, potassium ferrocyanide, potassium chloride, potassium nitrite, calcium carbonate, uric acid, glucose and pyridoxine hydrochloride were procured from Sigma-Aldrich.
Pyritinol (Figure 1) was purified from tablets as pyritinol dihydrochloride (Figure 1) following the procedure described later in the text, and it was characterized by determination of melting point, ultraviolet (UV) spectroscopy and Fourier transform infrared (FT-IR) spectrometry (subsection Separation and purification of pyritinol).
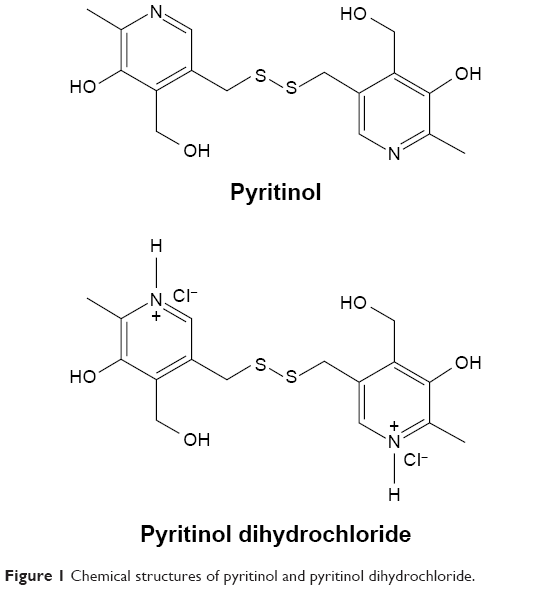 | Figure 1 Chemical structures of pyritinol and pyritinol dihydrochloride. |
Pharmaceutical products (tablets and oral suspension) were obtained from local pharmacies. Human blood serum samples were obtained from a local pathology laboratory from Galati, Romania. The ultrapure water (Millipore® EMD Millipore, Billerica, MA, USA) was used throughout the study.
The stock solution of 10−3 M pyritinol was prepared in 0.1 M HCl aqueous solution. A 0.1 M phosphate-buffered solution (PBS; pH 7.0) was used as electrolyte solution in the analysis. The PBS was prepared by blending appropriate quantity of NaH2PO4 and Na2HPO4 and dissolving the solid substances in ultrapure water. The pH was adjusted by using sodium hydroxide solution or hydrochloric acid, and the pH value was monitored with a pH meter.
Pyritinol solutions of various concentrations were prepared by diluting the stock solution to the appropriate volume with PBS. All voltamperometric measurements were carried out at a constant temperature of 25°C±2°C.
Apparatus
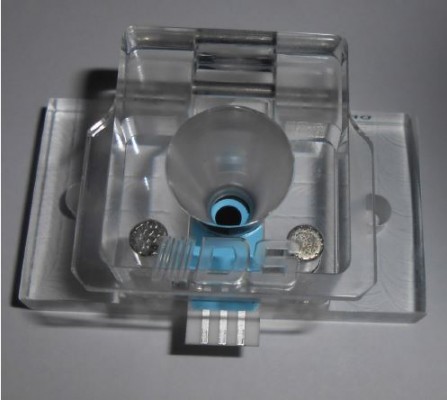
Electrochemical experiments were performed using the Biologic SP 150 potentiostat/galvanostat (Bio-Logic Science Instruments SAS, Seyssinet-Pariset, France). The electrochemical cell (CFLWCL-CONIC®) used in the electrochemical measurements was purchased from DropSens Ltd. (Llanera, Spain). Only 2 mL of samples are necessary for the measurements on this electrochemical cell, which is an advantage, especially in the case of biological samples. The images of the electrochemical cell and connection setup are presented in Figure 2.
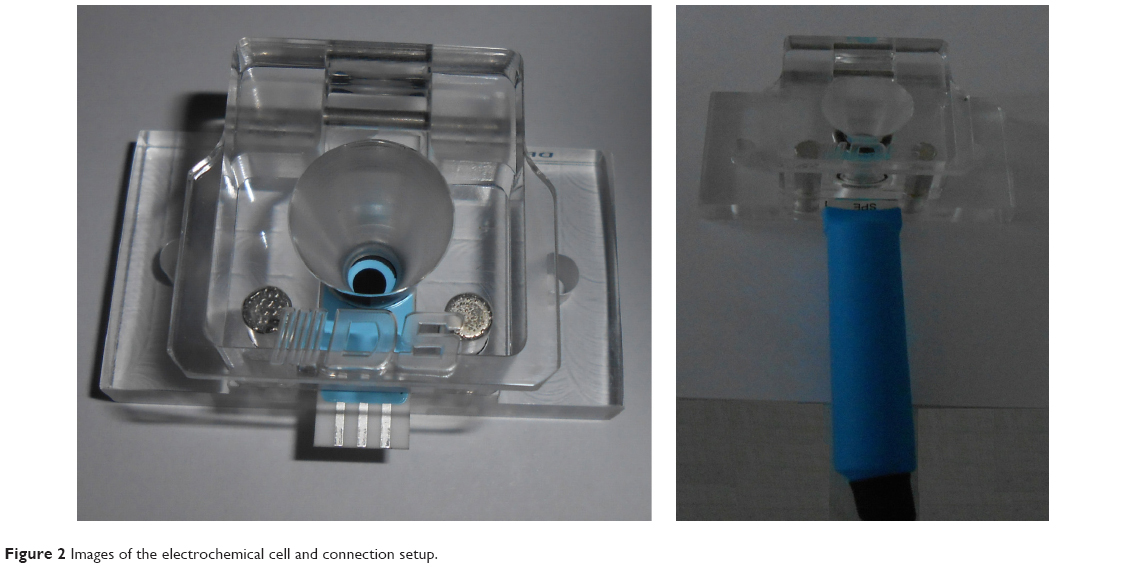 | Figure 2 Images of the electrochemical cell and connection setup. |
The SPCEs, 110 DRP model electrodes, were purchased from DropSens Ltd. A special cable from DropSens Ltd. was utilized for connecting the SPCEs to the potentiostat/galvanostat. The SPCEs consist of a working electrode (carbon electrode, diameter of 4 mm), a carbon counter electrode and an Ag pseudo-reference electrode printed on an alumina substrate.57
UV spectra were carried out using a Rayleigh UV-1601 spectrophotometer in UV range from 250 nm to 400 nm. FT-IR measurements in the attenuated total reflectance (ATR) mode were performed for the samples using a Bruker ALPHA FT-IR spectrophotometer with spectral resolution of 4 cm−1 and 128 scans. In order to estimate the surface area of CNF and CNF-GNP nanocomposites, Brunauer – Emmett – Teller (BET) measurements were carried out using multipoint technique. The surface area was determined by adsorption of N2 at low temperature. A Radwag analytical balance (model AS 220/C/2) was used for weighing the solid materials. INOLAB pH 7310 pH meter was employed for performing pH measurements and it was calibrated with standard buffers of specific pH. Elmasonic S10H ultrasonic bath was used for the ultrasonic dispersion of nanoparticles and nanofibers. Cencom II centrifuge was used in real sample pretreatment.
Synthesis of CNF-GNP nanocomposite
For the preparation of CNF-GNP composite, HAuCl4 was used as a precursor for GNPs, and trisodium citrate was employed as a reducing agent (Turkevich method).45 In a typical synthesis, the dispersion of CNF in liquid phase was prepared by adding 25 mg CNF in 20 mL water, which was followed by addition of 0.5 mM HAuCl4 (20 mL). To this mixture, 10 mM trisodium citrate (20 mL) was slowly added, and the reaction was carried out by stirring for 24 h. During this step, the reduction of HAuCl4 to GNPs took place along with the formation of CNF-GNP nanocomposite. The solid phase obtained was filtered and washed with ethanol and ultrapure water. Finally, the residue was dried in an oven at 50°C for 12 h.
Preparation of modified screen-printed carbon electrodes
Prior to the modification of SPCE, the surface of working electrode was cleaned with ultrapure water/ethanol solution and dried in a desiccator. Then, 5 mg of CNF-GNP nanocomposite was dispersed in 1 mL ethanol absolute via ultrasonic bath to get a homogenous suspension. A total of 10 μL of the prepared suspension was casted on the working electrode (part of the SPCE) and it was left to dry at room temperature for 2 h.
Electrochemical procedure
The voltamperometric behavior of pyritinol in PBS (0.1 M, pH 7.0) was studied by cyclic voltammetry (CV) and SWV. An appropriate aliquot of stock solution of pyritinol was taken in standard volumetric flask and then diluted up to the mark with PBS in order to record the voltammograms. The diluted solution (2 mL) was placed in the electrochemical cell to register the electrochemical signals.
The CV plots were recorded by sweeping the potential from −0.4 V to 1.0 V vs Ag pseudo-reference electrode at various scan rates. The SWV plots were recorded under the optimized parameters (pulse height of 90 mV, scan increment of 5 mV and frequency of 15 Hz) and the current measurements were carried out in the potential range from 0.2 V to 0.7 V vs Ag pseudo-reference electrode.
Separation and purification of pyritinol
Separation and purification of pyritinol were carried out from the pharmaceutical formulation Encephabol (sugar-coated tablet, 200 mg). The sugar-coating layer of ten tablets was mechanically removed and the remaining parts of the tablets were grinded to a powder in an agate mortar. The powder was dissolved in 25 mL of 0.1 M hydrochloric acid aqueous solution. The heterogeneous mixture was ultrasonicated for 30 minutes and then filtered. The water was removed by evaporation in a rotary evaporator and the solid residue was collected, washed with ethanol, dried in an oven and characterized by the determination of melting point, UV spectroscopy and FT-IR spectrometry.
Capillary melting point in oil bath was used for the determination of the pyritinol dihydrochloride melting point. The value obtained was 133°C–135°C, in agreement with the value reported for pyritinol dihydrochloride.46
Purified pyritinol dihydrochloride was weighed and dissolved in 0.1 M HCl aqueous solution at an appropriate dilution, and the UV spectra was recorded in 250–400 nm wavelength range toward 0.1 M HCl aqueous solution. The UV spectrum obtained for a 10−5 M pyritinol in 0.1 M HCl aqueous solution is presented in Figure 3.
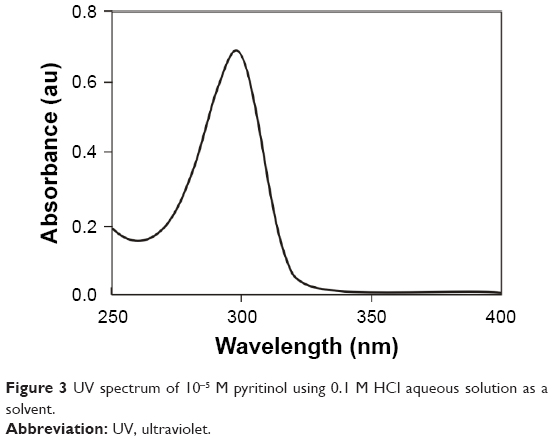 | Figure 3 UV spectrum of 10−5 M pyritinol using 0.1 M HCl aqueous solution as a solvent. |
The UV spectrum shows one maximum peak at 296 nm and one minimum peak at 260 nm. The peak at 296 nm is characteristic for pure pyritinol dihydrochloride.30,47,48 The results are in agreement with the results reported in the literature for pure pyritinol dihydrochloride.30,47,48 This result confirms the effectiveness of the purification process of pyritinol from tablets.
FT-IR spectrum of pyritinol dihydrochloride registered in ATR mode has shown the principal bands assigned as follows: 572 cm−1 (S-S stretching), 667 cm−1 (C-S stretching), 1,021 cm−1 (C-N stretching from pyridine ring), 2,640 cm−1 (N+-H stretching), 3,086 (–OH alcoholic, stretching), 3,308 (–OH phenolic, stretching).49,50 The aforementioned FT-IR data indicate that the purification process was effective and that the compound could be used as reference in electrochemical experiments.48
Determination of pyritinol in real samples
To find out recovery of the proposed method, detection and quantification of pyritinol were carried out in pharmaceutical products, namely Encephabol (sugar-coated tablets, 100 mg; Merck KGaA), Encephabol (sugar-coated tablets, 200 mg; Merck KGaA), Encephabol (oral suspension, 80.5 mg/5 mL; Merck KGaA) and blood serum. All procedures and experimental protocols employed for the researches presented in the manuscript are in compliance with the European Communities Council Directive of 24 November 1986 (86/609/EEC). The procedure consists of processing of ten tablets of the solid pharmaceutical samples as follows. The tablets were grinded to a powder in an agate mortar. A suitable amount of powdered sample was weighed and mixed with 25 mL of 0.1 M hydrochloric acid aqueous solution. The heterogeneous mixture was ultrasonicated for 30 minutes and then filtered through filter paper (Whatman no 1). A suitable aliquot of the filtrated solution was then diluted to the final volume with PBS. The oral suspension was centrifuged at 4,000 rpm and the supernatant solution was diluted to final volume with PBS. For the recovery study of serum samples, 1 mL of each sample was prepared separately by dilution with 4 mL of PBS. No pretreatment stage was carried out for the samples. Quantitative determinations of pyritinol were carried out directly and by standard addition method. The recovery studies were carried out by spiking standard solutions of pyritinol into pharmaceutical products and blood serum samples.
Results and discussion
Electrochemical properties of CNF-GNP/SPCE
To understand the electrochemical properties of CNF-GNP/SPCE, [Fe(CN)6]3−/4− was used as the electrochemical redox probe.
Figure 4 shows the cyclic voltammograms of 10 mM [Fe(CN)6]3−/4− containing 0.1 M KCl at the surface of SPCE, CNF/SPCE and CNF-GNP/SPCE. The cyclic voltammograms of [Fe(CN)6]3−/4− couple show a peak-to-peak separation (ΔEp=Epa–Epc) of 197 mV, 162 mV and 136 mV at the surface of SPCE, CNF/SPCE and CNF-GNP/SPCE, respectively. Epa is the anodic peak potential, and Epc is the cathodic peak potential. The reduction in ΔEp value at CNF-GNP/SPCE clearly indicated the more-reversible charge-transfer process of CNF-GNP/SPCE than others.
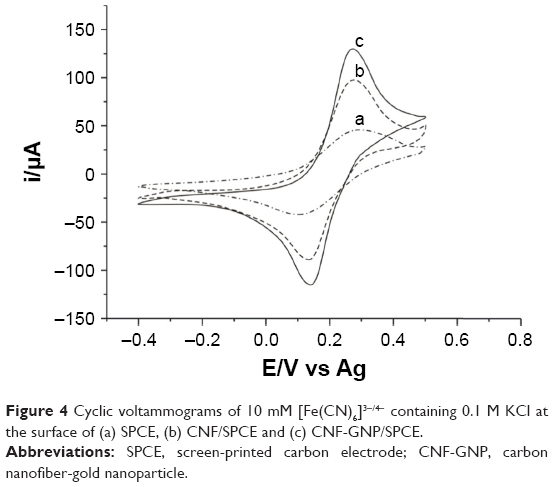 | Figure 4 Cyclic voltammograms of 10 mM [Fe(CN)6]3−/4− containing 0.1 M KCl at the surface of (a) SPCE, (b) CNF/SPCE and (c) CNF-GNP/SPCE. |
Figure 4 shows that the magnitude of redox peak current for [Fe(CN)6]3−/4− couple has been enhanced at CNF-GNP/SPCE, when compared to CNF/SPCE and SPCE. The anodic peak currents were 47.2 μA, 98.9 μA and 127.8 μA for SPCE, CNF/SPCE and CNF-GNP/SPCE, respectively. The superior sensitivity of CNF-GNP/SPCE toward [Fe(CN)6]3−/4− can be highlighted more than in the case of other electrodes.
In fact, the results confirmed that the presence of GNPs and CNFs in nanocomposite improved the efficiency of the electrode, the reversibility of redox process and the sensitivity. This fact can be related to an increase in electroactive surface area due to CNFs, with high surface to volume ratio, improved conductivity and ease of electron transfer property. Moreover, CNFs prevent self-aggregation of GNPs, which determine an enhancement in accessible sites of nanocomposite.43,44 Therefore, it can be concluded that CNFs and GNPs have synergistic effects.
The surface area of the chemically modified electrode was obtained by CV using a 10 mM [Fe(CN)6]3−/4− aqueous solution containing KCl 0.1 M. The CVs were performed at different sweep rates, ranging from 50 to 450 mV × s−1. The CV plots show an increase in the anodic peak current when the scan rate increases and a shift in the peak potential to more positive potential values. Further, the anodic peak current depends linearly on the square root of scan rate, suggesting the electrochemical oxidation of [Fe(CN)6]3−/4− system at the electrode surface to be diffusion controlled. For a reversible process, the following Randles–Sevcik formula (Eq. 1) can be used:51
ipa = 2.69 × 10⁵n3/2AD1/2Cν1/2 |
(1) |
where ipa, n, A, D, ν and C refer to anodic peak current, number of electrons exchanged in the redox process, active surface area of electrode, diffusion coefficient, scan rate and the concentration of [Fe(CN)6]3−/4−, respectively. For 10 mM [Fe(CN)6]3−/4− in 0.1 M KCl aqueous solution, diffusion coefficient is D =7.26×10⁻⁶ cm2 × s−1.52 Due to the results obtained from cyclic voltammograms, the electrode surface areas were calculated to be 0.6365 cm2, 1.3336 cm2 and 1.7233 cm2 for SPCE, CNF/SPCE and CNF-GNP/SPCE, respectively. The BET surface areas were characterized by 39 m2 × g−1 and 43 m2 × g−1 for the CNF and CNF-GNP samples, respectively. The BET results are consistent with the effective surface area of the electrodes.
It can be concluded that the presence of CNF leads to an enlargement in effective surface area in two ways, the first one being the high surface to volume ratio of the CNF and the second one being the prevention of self-aggregation of GNP, which leads to the enhancement in accessible site for the electroactive compounds.43,44
Electrochemical behavior of pyritinol
The electrochemical behavior of pyritinol was studied by carrying out CV in a solution of 5.0×10⁻⁶ M pyritinol at three different electrodes. The cyclic voltammograms recorded at SPCE, CNF/SPCE and CNF-GNP/SPCE are shown in Figure 5.
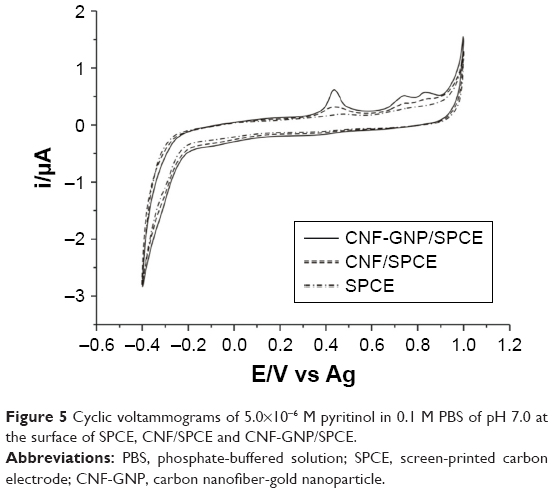 | Figure 5 Cyclic voltammograms of 5.0×10⁻⁶ M pyritinol in 0.1 M PBS of pH 7.0 at the surface of SPCE, CNF/SPCE and CNF-GNP/SPCE. |
The CV plots of pyritinol show three anodic peaks at 0.430 V, 0.740 V and 0.840 V, while no cathodic peaks are observed in the reverse scan, indicating irreversible oxidations processes of pyritinol at the electrode surface. This electrochemical behavior corresponds with previous results reported for pyritinol in aqueous alcoholic solutions using dropping mercury electrode as the working electrode.35,36 The electrochemical processes involve redox processes of thiol-disulfide groups adsorbed on electrode surface.35,36 This similarity is reasonable because the gold presents high affinity for thiol-disulfide groups.53
The results observed by CV can be explained by Scheme 1 of the electrochemical processes at the sensitive surface. The dicationic form of pyritinol protonated at the nitrogen atoms is denoted by H2+R-S-S-R+H2 and the neutral form by HR-S-S-RH.
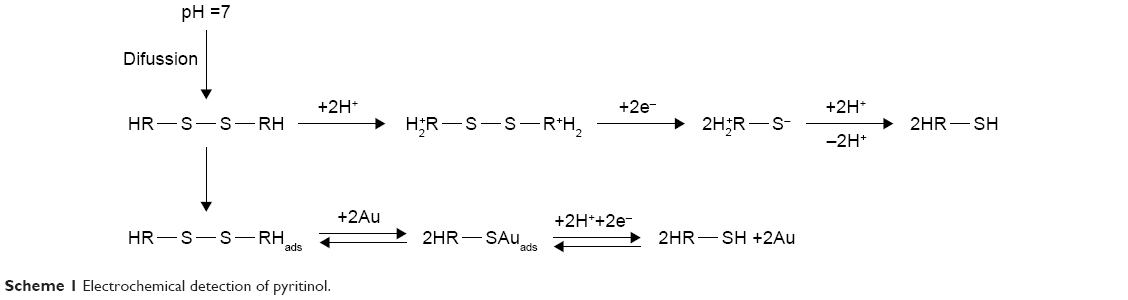 | Scheme 1 Electrochemical detection of pyritinol. |
At the pH 7, pyritinol is not protonated in the nitrogen atoms. The electrochemical process takes place after the protonation of nitrogen atoms by the exchange of two electrons and two protons in two-process stages. Furthermore, the electrochemical reactions take place by adsorption of pyritinol onto Au nanoparticles with the formation of a reaction product, followed by the exchange of two electrons and two protons. This electrochemical behavior is in agreement with previously reported results and it is similar to the one proposed for the reduction of some aromatic disulfides.35,36,54,55
One may also observe from Figure 5 that the electrochemical response of pyritinol in CNF-GNP/SPCE is considerably improved in terms of both peak current and peak shape, compared to that in case of CNF/SPCE and SPCE. This suggests that the oxidation of pyritinol is more favorable on the surface of CNF-GNP/SPCE than on other two electrodes used.
The results pointed out that the GNP-CNF nanocomposites have synergistic effect. Indeed, GNP-CNF nanocomposites could determine a significant increase of the anodic peak current and a low decrease of the anodic peak potential.
In view of studying the process of electron transfer on the surface of the electrode, cyclic voltammograms were recorded on CNF-GNP/SPCE at different scan rates (Figure 6A). All anodic peaks increase when scan rates increase. At high scan rates, small and broad reduction peaks could be observed. By plotting the values of anodic peak currents vs scan rates, a linear correlation was obtained (Figure 6B). This linear relationship was observed for all anodic peaks, and the corresponding equations are as follows:
ipa1(μA) = 0.0068ν (mV × s−1) + 0.307 (R2 = 0.9932) |
(2) |
ipa2(μA) = 0.0094ν (mV × s−1) − 0.12 (R2 = 0.9899) |
(3) |
ipa3(μA) = 0.0106ν (mV × s−1) − 0.0744 (R2 = 0.995) |
(4) |
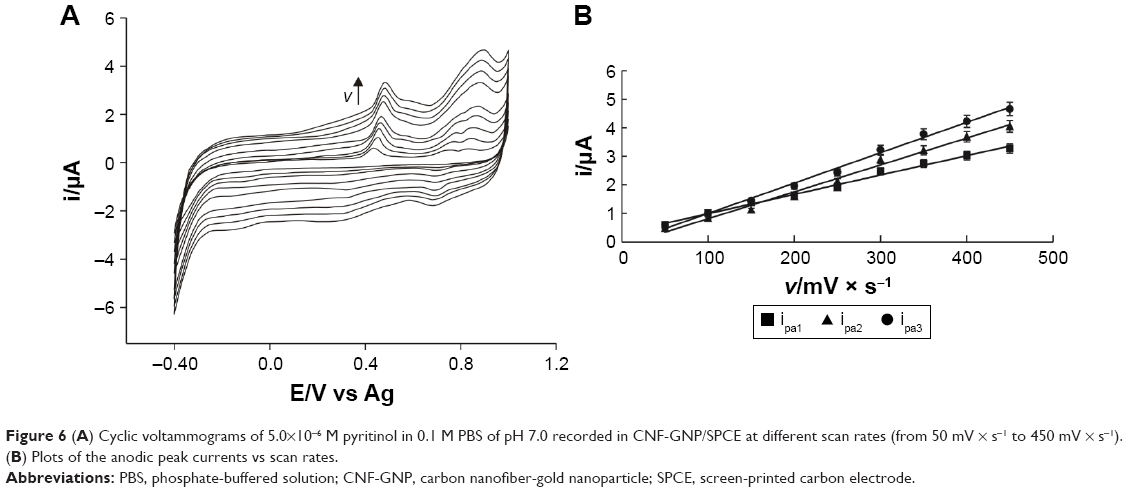 | Figure 6 (A) Cyclic voltammograms of 5.0×10⁻⁶ M pyritinol in 0.1 M PBS of pH 7.0 recorded in CNF-GNP/SPCE at different scan rates (from 50 mV × s−1 to 450 mV × s−1). (B) Plots of the anodic peak currents vs scan rates. |
These linear correlations between the anodic peak currents and the scan rates indicate that there is no diffusion limitation and that redox processes are controlled by the electron transfer of the adsorbed electroactive species at the sensitive electrode surface.56 Furthermore, it is supported by the detection mechanism of pyritinol at the sensitive surface.35,36
Determination of pyritinol by SWV
SWV was used with the purpose to enhance the electrochemical response for pyritinol in CNF-GNP-modified SPCE. The rationale for this study was the exceptional sensitivity of SWV in the determination of the electroactive organic compounds compared with other voltammetric techniques.51 The parameters of SWV were optimized, focusing on the anodic peak from 0.430 V, the sharper and higher peak being observed in the cyclic voltammogram.
The effect of pulse height, scan increment and frequency on peak current of 5.0×10⁻⁶ M pyritinol was studied by SWV in the potential range from 0.2 V to 0.7 V. The optimization was carried out in such a manner that each parameter was modified, while others were maintained constant. With increase in pulse height from 10 mV to 90 mV, peak current increased. Afterward, the peak broadening starts affecting the sharpness of square-wave voltammograms. Therefore, pulse height of 90 mV was chosen in this study. The effect of scan increment and frequency on peak current of pyritinol was studied in the range 1–10 mV and 5–20 Hz, respectively. The maximum peak current was obtained at scan increment =5 mV and frequency =15 Hz. Quantitative determination of pyritinol was performed by SWV (pulse height of 90 mV, scan increment of 5 mV and frequency of 15 Hz). A comparative study was carried out for 5.0×10⁻⁶ M pyritinol on SPCE, CNF-SPCE and CNF-GNP/SPCE, as shown in Figure 7.
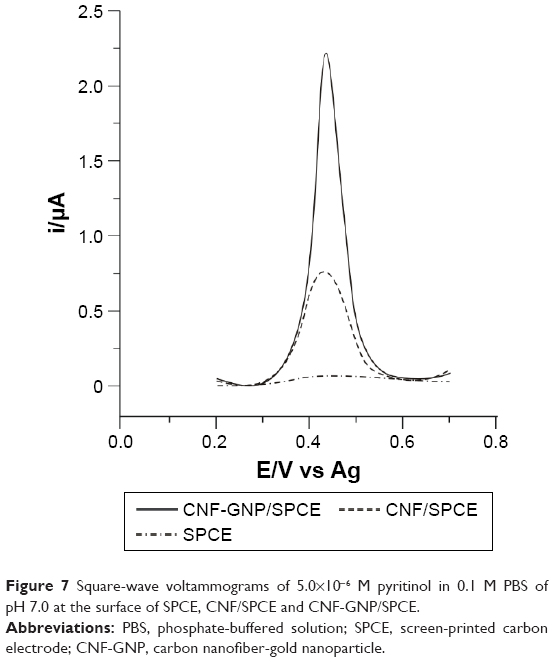 | Figure 7 Square-wave voltammograms of 5.0×10⁻⁶ M pyritinol in 0.1 M PBS of pH 7.0 at the surface of SPCE, CNF/SPCE and CNF-GNP/SPCE. |
It is clear that the maximum peak current is obtained in CNF-GNP/SPCE among the electrodes taken for measurements. The motives for such remarkable sensitivity of the developed nanocomposite-based sensor can be explained in the following manner. The nanocomposite material contains CNFs, which display attractive properties, such as nanoscale structure and textures, large surface area and high electrical conductivity. The GNPs show high electrocatalytic activity, which facilitates the electron transfer at the electrode surface.43,44 Hence, the synergistic effect of CNFs and GNPs leads to a highly sensitive voltamperometric sensor for pyritinol.
A simple and sensitive voltammetric method was developed using these results. The electrochemical signals of the increasing amounts of pyritinol were studied using SWV. The effect of the concentration in the voltammetric responses is shown in the range of concentration from 1.0×10⁻⁸ M to 1.0×10⁻⁴ M (not all shown; Figure 8A).
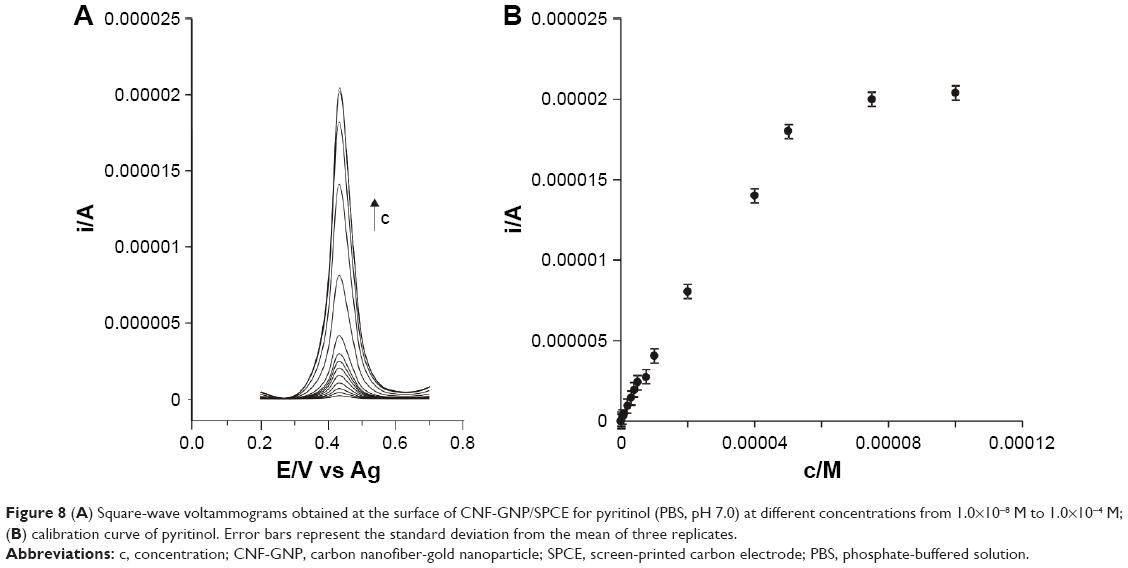 | Figure 8 (A) Square-wave voltammograms obtained at the surface of CNF-GNP/SPCE for pyritinol (PBS, pH 7.0) at different concentrations from 1.0×10⁻⁸ M to 1.0×10⁻⁴ M; (B) calibration curve of pyritinol. Error bars represent the standard deviation from the mean of three replicates. |
As observed in Figure 8, the intensity of peak increased with the concentration of pyritinol. The anodic peak current of the CNF-GNP/SPCE sensor is linear with the pyritinol concentration in a range from 1.0×10⁻⁸ M to 5.0×10⁻⁵ M, indicating that the electrochemical oxidation process is a first-order reaction. Pyritinol concentrations higher than 5.0×10⁻⁵ M cause a modification of linearity: the current slowly increases and the electrochemical process displays a change from first- to zero-order reaction. Linear range was used for calculating the detection limit (limit of detection [LOD] =3× STD/s, where STD is the standard deviation of the blank and “s” is the slope of the linear calibration plot).34 Linear regression equation and determination coefficient were also achieved. Therefore, the peak current was found to be directly proportional to the pyritinol concentration in the wide range from 1.0×10⁻⁸ M to 5.0×10⁻⁵ M (Figure 8B), with a very low detection limit of 6.23×10⁻⁹ M. The calculated value of the determination coefficient (R2) was 0.997 (confidence level of 99%), indicating the quality of the regression model.
The detection limit indicates that the sensor developed here is very sensitive to pyritinol. The analytical performance characteristics are superior to those reported for ion-selective membrane electrodes.37 This fact could be related to different detection principle (potentiometric vs voltamperometric) and to the usage of nanostructurate sensitive materials for the sensor reported here. At present and to our knowledge, voltamperometric sensors for detection of pyritinol are not reported in the literature.
Interference tests
In order to estimate the interferences of foreign species on the determination of pyritinol at the 5.0×10⁻⁶ M level, some interference studies were carried out by SWV. Those such as 200-fold of K+, Cl−, PO43−, Ca2+, NO3−, CO32−, 50-fold of ascorbic acid, 50-fold of uric acid, 100-fold of glucose and 70-fold of pyridoxine have almost no influence on the current response of pyritinol (signal change below 5%). The sensor revealed reduced sensitivity to the various interfering species present in multicomponent real samples and high selectivity for the pyritinol.
This study confirmed that the sensor can be used for the quantification of pyritinol in multicomponent real samples in the presence of interfering chemical species, even at high concentration levels. These results also confirmed that the peak current of pyritinol is insignificantly affected by commonly interfering cations, anions and organic compounds.
Repeatability, reutilizability, reproducibility and stability
The repeatability of the CNF-GNP/SPCE was studied by repeating the measurement of 5.0×10⁻⁶ M pyritinol. After each measurement, the used CNF-GNP/SPCE undergoes ten successive CV sweeps between −0.4 V and 1.3 V at 0.1 V × s−1 in the PBS (0.1 M, pH 7) to clean the electrode surface. The five measurements achieved a good repeatability with the relative standard deviation (RSD) of 1.08%.
The reusability of the CNF-GNP/SPCE was also investigated. The CNF-GNP/SPCE was alternatively exposed to pyritinol solution with different concentrations (5.0×10⁻⁶ M and 1.0×10⁻⁵ M) and the SWV curves were registered. The initial and final measurements were carried out in PBS (0.1 M, pH 7). The signals recorded are plotted in Figure 9.
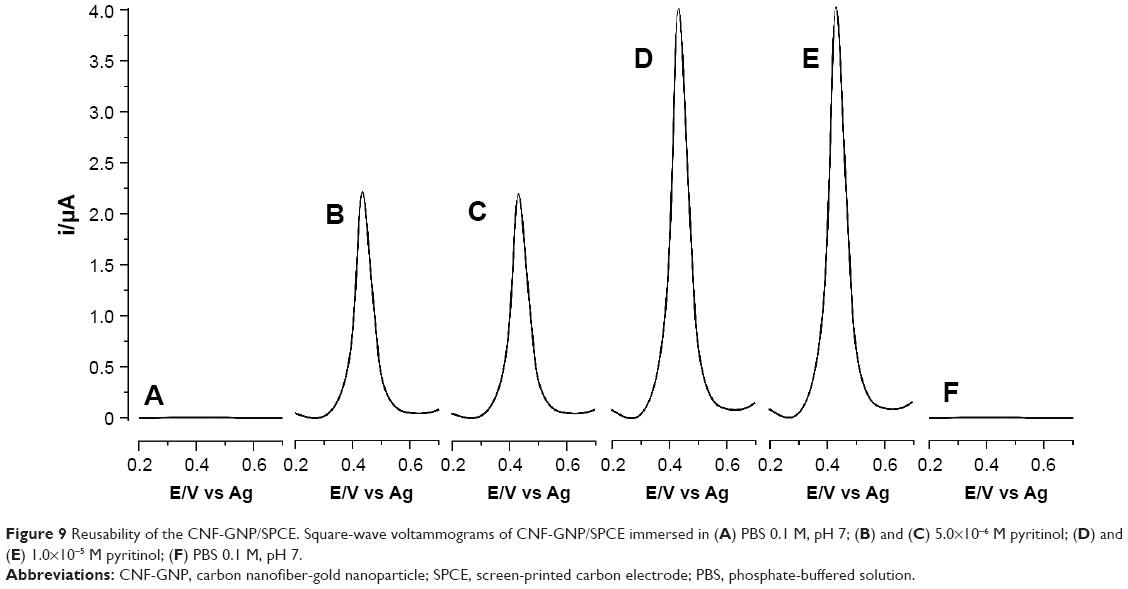 | Figure 9 Reusability of the CNF-GNP/SPCE. Square-wave voltammograms of CNF-GNP/SPCE immersed in (A) PBS 0.1 M, pH 7; (B) and (C) 5.0×10⁻⁶ M pyritinol; (D) and (E) 1.0×10⁻⁵ M pyritinol; (F) PBS 0.1 M, pH 7. |
Evidently, the peak current increases and decreases as the sensor is exposed to pyritinol solution with different concentrations. The fluctuation of the signals, both in the support electrolyte solution and in pyritinol solution, is of only 0.05 μA, which indicates the excellent reusability of the CNF-GNP/SPCE sensor.
The reproducibility of the CNF-GNP/SPCE was achieved by fabrication of five similar electrodes to detect the response of 5.0×10⁻⁶ M pyritinol, and the RSD was calculated to be 2.45%. The results indicated that the CNF-GNP/SPCE exhibited good reproducibility in the detection of pyritinol.
The long-term stability of the developed sensor was tested by monitoring voltammetric response of 5.0×10⁻⁶ M pyritinol for 30 days (Figure 10).
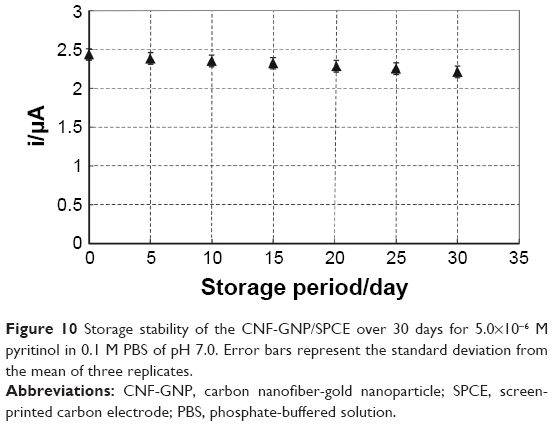 | Figure 10 Storage stability of the CNF-GNP/SPCE over 30 days for 5.0×10⁻⁶ M pyritinol in 0.1 M PBS of pH 7.0. Error bars represent the standard deviation from the mean of three replicates. |
Even after 30 days, a reduced decrease was observed in the anodic peak current, from 2.43 μA to 2.21 μA, representing a 9.05% decay, which confirms the high stability of the sensor.
Quantification of pyritinol in real samples
The developed sensor based on SWV detection method was employed for the quantitative determination of pyritinol in pharmaceutical samples (Table 1). The amount of pyritinol obtained by the current method was found in agreement with the label contents.
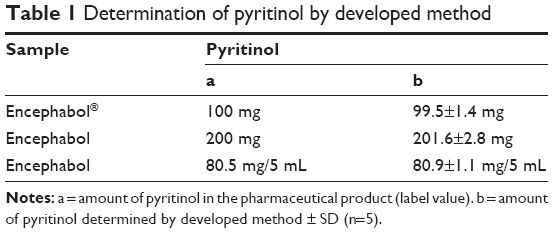 | Table 1 Determination of pyritinol by developed method |
The validity of the developed sensor based on SWV detection method was proved by performing five replicate measurements for standard pyritinol over a single day (intra-day assay) (n=5) and for 10 days over a period of 2 weeks (inter-day assay) (Table 2). The recovery investigations were performed by standard addition method. They are summarized in Table 2. The results confirm a high precision of the method and the stability of the pyritinol solutions.
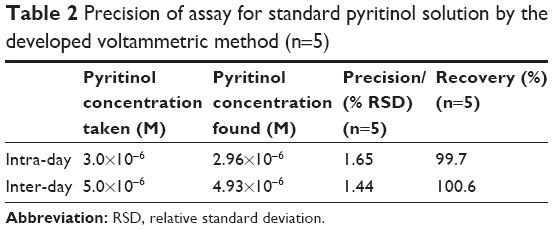 | Table 2 Precision of assay for standard pyritinol solution by the developed voltammetric method (n=5) |
For an additional evaluation of the validity, the recovery study was performed on pharmaceutical samples and spiked blood serum samples (Table 3). The recovery of pyritinol was close to 100%, providing support to the precision of the voltamperometric method as assay in complex matrices.
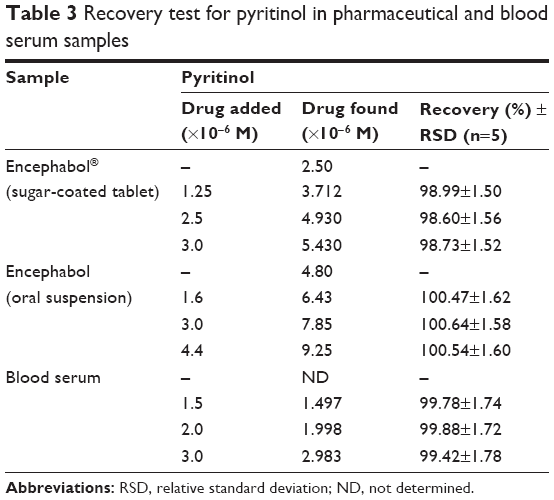 | Table 3 Recovery test for pyritinol in pharmaceutical and blood serum samples |
Conclusion
In this paper, the proposed CNF/GNP nanocomposite was employed to modify SPCE, and this chemically modified sensor was applied for the determination of pyritinol. The CNF-GNP/SPCE sensor exhibited an increase in peak currents, a fast electron transfer kinetics and a decrease in the peak potential for the oxidation reactions of pyritinol. Under optimized conditions, the anodic peak current is linear to pyritinol concentration in the work range of 1.0×10⁻⁸ M to 5.0×10⁻⁵ M, and the detection limit is 6.23×10⁻⁹ M (R2=0.997). This voltamperometric sensor presents advantages of an easy fabrication process, low volumes for analysis, reduced interferences and high sensitivity. The applicability of CNF-GNP/SPCE sensor was proved by quantification of pyritinol in pharmaceutical products and blood serum samples.
Acknowledgment
This work was supported by a grant of the Romanian National Authority for Scientific Research and Innovation, CNCS – UEFISCDI, project number PN-II-RU-TE-2014-4-1093.
Disclosure
The authors report no conflicts of interest in this work.
References
Herrschaft H. Pyritinol. Chapter 13. In: Neuro-Psychopharmaka. Wien: Springer-Verlag; 1992:201–209. | ||
Kapoor VK, Dureja J, Chadha R. Synthetic drugs with anti-ageing effects. Drug Discov Today. 2009;14(17–18):899–904. | ||
Singh S. Pharmacology for Dentistry. New Delhi: New Age International Limited Publishers; 2007. | ||
Hindmarch I, Coleston DM, Kerr JS. Psychopharmacological effects of pyritinol in normal volunteers. Neuropsychobiology. 1990–1991;24(3):159–164. | ||
DeLucia R, Buscariolo IA, Aizenstein ML. Habituation of exploratory activity in aged rats: effects of pyritinol. Braz J Pharm Sci. 2005;41(1):67–72. | ||
Sastry CSP, Murali Krishna D. New spectrophotometric methods for the determination of pyrithioxine. Indian J Pharm Sci. 1995;57(3):130–132. | ||
Jiménez-Andrade GY, Reyes-García G, Sereno G, Ceballos-Reyes G, Vidal-Cantú GC, Granados-Soto V. Pyritinol reduces nociception and oxidative stress in diabetic rats. Eur J Pharmacol. 2008;590(1–3):170–176. | ||
Martin KJ. On the mechanism of action of Encephabol. J Int Med Res. 1983;11(2):55–65. | ||
Elferink JG, de Koster BM. Differential stimulation of neutrophil functions by Pyrithioxine. Int J Immunopharmacol. 1993;15(5):641–646. | ||
Cooper AJ, Magnus RV. A placebo-controlled study of pyritinol (‘Encephabol’) in dementia. Pharmatherapeutica. 1980;2(5):317–322. | ||
Branconnier RJ. The efficacy of the cerebral metabolic enhancers in the treatment of senile dementia. Psychopharmacol Bull. 1983;19(2): 212–219. | ||
Fischhof PK, Saletu B, Rüther E, Litschauer G, Möslinger-Gehmayr R, Herrmann WM. Therapeutic efficacy of pyritinol in patients with senile dementia of the Alzheimer type (SDAT) and multi-infarct dementia (MID). Neuropsychobiology. 1992;26(1–2):65–70. | ||
Lemmel EM. Comparison of pyritinol and auranofin in the treatment of rheumatoid arthritis. The European Multicentre Study Group. Br J Rheumatol. 1993;32(5):375–382. | ||
Saletu B, Anderer P, Gruenberger J. EEG brain mapping in gerontopsychopharmacology: on protective properties of pyritinol against hypoxic hypoxidosis. Psychiatry Res. 1989;29(3):387–390. | ||
Pittler MH, Verster JC, Ernst E. Interventions for preventing or treating alcohol hangover: systematic review of randomised controlled trials. BMJ. 2005;331(7531):1515–1518. | ||
Wälti U, Kuenzler M, Schild J, et al. Pyritinol hydrochloride and cognitive functions: influence on children in slow learner classes. Pediatr Res. 1975;9(9):717–721. | ||
Zykov VP, Komarova IB, Nazarova EK, Begasheva OI, Kabanova SA. [Autonomic cardiovascular regulation in patients with tics and Tourette syndrome]. Zh Nevrol Psikhiatr Im S S Korsakova. 2005;105(9):18–22. Russian [with English abstract]. | ||
Herrmann WM, Kern U, Röhmel J. On the effects of pyritinol on functional deficits of patients with organic mental disorders. Pharmacopsychiatry. 1986;19(5):378–385. | ||
Zasler N, Katz D, Zafonte RD. Brain Injury Medicine: Principles and Practice. New York: Demos Medical Publishing; 2007. | ||
van Os Y, de Vugt ME, van Boxtel M. Cognitive interventions in older persons: do they change the functioning of the brain? Biomed Res Int. 2015;2015:438908. | ||
Hartmann H, Cohen SA, Müller WE. Effects of subchronic administration of pyritinol on receptor deficits and phosphatidylinositol metabolism in the brain of the aged mouse. Neuropharmacology. 1993; 32(2):119–125. | ||
Toledano A, Bentura ML. Pyritinol facilitates the recovery of cortical cholinergic deficits caused by nucleus basalis lesions. J Neural Transm Park Dis Dement Sect. 1994;7(3):195–209. | ||
Wetzel W. Effect of repeated application of nootropic drugs on sleep in rats. Biomed Biochim Acta. 1990;49(5):405–411. | ||
Jaiswal AK, Upadhyay SN, Bhattacharya SK. Effect of pyritinol, a cerebral protector, on learning and memory deficits induced by prenatal undernutrition and environmental impoverishment in young rats. Indian J Exp Biol. 1990;28(7):609–615. | ||
Abhishek S, Sankari M, Chitra V. Reversal of phenytoin-induced impairment of spontaneous alternation by pyritinol in mice: involvement of cholinergic system. Int J Pharm Pharm Sci. 2010;2(1):47–51. | ||
Pavlík A, Pilar J. Protection of cell proteins against free-radical attack by nootropic drugs: scavenger effect of pyritinol confirmed by electron spin resonance spectroscopy. Neuropharmacology. 1989;28(6):557–561. | ||
Straumann A, Bauer M, Pichler WJ, Pirovino M. Acute pancreatitis due to pyritinol: an immune-mediated phenomenon. Gastroenterology. 1998;115(2):452–454. | ||
Sane RT, Samant RS, Nayak VG. Colorimetric determination of pyrithioxine from pharmaceutical preparations. Indian J Pharm Sci. 1988;50(3):161–162. | ||
Sane RT, Ghorpade UA, Nadkarni AD, Banavalikar VJ. Colorimetric determination of pyrithioxine from its pharmaceutical preparation. Indian Drugs. 1986;23(5):306–309. | ||
Hassan SM, El Ashry SM, El Kerdawy MM. Spectrophotometric determination of pyrithioxin in pharmaceutical preparations. J Spectrosc Lett. 1990;23(10):1273–1284. | ||
Shehata MA, el-Sayed MA, el-Bardicy MG, el-Tarras MF. Stability-indicating methods for determination of pyritinol dihydrochloride in the presence of its precursor and degradation product by derivative spectrophotometry. J AOAC Int. 2005;88(1):80–86. | ||
Aranda M, Morlock GE. Quantification of pyritinol in solid pharmaceutical formulation by high-performance thin-layer chromatography-ultraviolet detection and selectivity evaluation by mass spectrometry. J Liq Chromatogr Relat Technol. 2010;33(7–8):957–971. | ||
Belal F. Ion-pairing high-performance liquid chromatographic determination of pyridoxine and pyrithioxine in dosage forms. Anal Lett. 1989;22(8):1897–1907. | ||
Arvand M, Ghodsi N, Zanjanchi MA. A new microplatform based on titanium dioxide nanofibers/graphene oxide nanosheets nanocomposite modified screen printed carbon electrode for electrochemical determination of adenine in the presence of guanine. Biosens Bioelectron. 2016; 77:837–844. | ||
López Fonseca JM, Valcarce JC, Sanz Pedrero P. Polarographic determination of pyrithioxine in pharmaceutical preparations. Analyst. 1975;100(1190):334–338. | ||
Lopez Fonseca JM, Perez del Molino ML. Polarographic reduction of pyrithioxine in water-ethanol (50%) buffered media. Electrochim Acta. 1984;29(4):503–507. | ||
El-Bardicy MG, Lotfy HM, El-Sayed MA, El-Tarras MF. Stability-indicating electrochemical methods for the determination of meclophenoxate hydrochloride and pyritinol dihydrochloride using ion-selective membrane electrodes. Yakugaku Zasshi. 2007;127(1):201–208. | ||
El-Ashry SM, Shehata IA, El-Sherbeny MA, El-Sherbeny DT, Belal F. Conductometric determination of some drugs acting on the central nervous system. Chem Analityczna. 2000;45(6):859–866. | ||
Zaporotskova IV, Boroznina NP, Parkhomenko YN, Kozhitov LV. Carbon nanotubes: sensor properties. A review. Modern Electron Mater. 2016;2(4):95–105. | ||
Bagheri S, Sadegh Amiri I, Termeh Yousefi A, Bee Abd Hamid S. Nanocomposites in Electrochemical Sensors. Boca Raton: CRC Press; 2016. | ||
Pandikumar A, Soon How GT, Peik See T, et al. Graphene and its nanocomposite material based electrochemical sensor platform for dopamine. RSC Adv. 2014;4(108):63296–63323. | ||
Priftis D. Polyelectrolyte-graphene nanocomposites for biosensing applications. Curr Org Chem. 2015;19(18):1819–1827. | ||
Kalambate PK, Rawool CR, Karna SP, Srivastava AK. Highly sensitive and selective determination of methylergometrine maleate using carbon nanofibers/silver nanoparticles composite modified carbon paste electrode. Mat Sci Eng C. 2016;69:453–461. | ||
Zhang Y, Chu W, Dibaji Foroushani A, et al. New gold nanostructures for sensor applications: a review. Materials. 2014;7(7):5169–5201. | ||
Tyagi H, Kushwaha A, Kumar A, Aslam M. A facile pH controlled citrate-based reduction method for gold nanoparticle synthesis at room temperature. Nanoscale Res Lett. 2016;11(1):362. | ||
Chemicalland21.com. Pyritinol dihydrochloride. Available from: http://www.chemicalland21.com/lifescience/uh/PYRITINOL%20DIHYDROCHLORIDE.htm. Accessed March 30, 2017. | ||
El-Sayed MA, Abdul-Azim Mohammad M. Stability-indicating chemometric methods for the determination of pyritinol dihydrochloride. Drug Test Anal. 2009;1(5):228–233. | ||
Farmacopeea Romana Romanian Pharmacopoeia Editia a X-a. Bucuresti: Editura Medicala; 1993 [Pharmacopoeia Romana. Romanian Pharmacopoeia. 10th ed. Bucharest: Medicala Publishing House; 1993]. Romanian. | ||
Coates J. Interpretation of infrared spectra. A practical approach. In: Meyers RA, editor. Encyclopedia of Analytical Chemistry. Chichester: John Wiley & Sons Ltd; 2000:10815–10837. | ||
Florey K, editor. Profiles of Drug Substances, Excipients and Related Methodology. Vol. 13. Milford: Academic Press; 1984. | ||
Riley T, Tomlinson C. Principles of Electroanalytical Methods. New York: John Wiley & Sons; 1987. | ||
Apetrei C, Apetrei IM, De Saja JA, Rodriguez-Mendez ML. Carbon paste electrodes made from different carbonaceous materials: application in the study of antioxidants. Sensors (Basel). 2011;11(2):1328–1344. | ||
Wang LH, Huang WS. Electrochemical oxidation of cysteine at a film gold modified carbon fiber microelectrode its application in a flow-through voltammetric sensor. Sensors (Basel). 2012;12(3):3562–3577. | ||
Cristensen TB, Daasbjerg K. Investigation of the direct and indirect reduction processes of some disulfides by electrochemical means. Acta Chem Scand. 1997;51:307–317. | ||
Benaīchouche M, Bosser G, Paris J, Auger J, Plichon V. Formation of stable aryldisulphide ions in dimethylacetamide from the reaction of sulphur with thiolate ions. J Chem Soc Perkin Trans. 1990;2(1):31–36. | ||
Apetrei C, de Saja JA, Zurro J, Rodríguez-Méndez ML. Advantages of the biomimetic nanostructured films as an immobilization method vs. the carbon paste classical method. Catalysts. 2012;2(4):517–531. | ||
DropSens. Screen-printed carbon electrodes. Available from: http://www.dropsens.com/pdfs_productos/new_brochures/110-c110.pdf. Accessed June 29, 2017. |
 © 2017 The Author(s). This work is published and licensed by Dove Medical Press Limited. The full terms of this license are available at https://www.dovepress.com/terms.php and incorporate the Creative Commons Attribution - Non Commercial (unported, v3.0) License.
By accessing the work you hereby accept the Terms. Non-commercial uses of the work are permitted without any further permission from Dove Medical Press Limited, provided the work is properly attributed. For permission for commercial use of this work, please see paragraphs 4.2 and 5 of our Terms.
© 2017 The Author(s). This work is published and licensed by Dove Medical Press Limited. The full terms of this license are available at https://www.dovepress.com/terms.php and incorporate the Creative Commons Attribution - Non Commercial (unported, v3.0) License.
By accessing the work you hereby accept the Terms. Non-commercial uses of the work are permitted without any further permission from Dove Medical Press Limited, provided the work is properly attributed. For permission for commercial use of this work, please see paragraphs 4.2 and 5 of our Terms.