Back to Journals » International Journal of Nanomedicine » Volume 17
Highly Sensitive Lanthanide-Doped Nanoparticles-Based Point-of-Care Diagnosis of Human Cardiac Troponin I
Authors Chen L, Zhou SY, Zhu W, Liu SP, Zhang JX, Zhuang H, Zhang JL, Li YS, Gao F
Received 31 October 2021
Accepted for publication 22 January 2022
Published 9 February 2022 Volume 2022:17 Pages 635—646
DOI https://doi.org/10.2147/IJN.S346415
Checked for plagiarism Yes
Review by Single anonymous peer review
Peer reviewer comments 2
Editor who approved publication: Professor Farooq A. Shiekh
Lu Chen,1 Shan-Yong Zhou,2 Wei Zhu,3 Sheng-Ping Liu,4 Jing-Xi Zhang,5 He Zhuang,5 Jing-Ling Zhang,5 Yong-Sheng Li,6 Fei Gao4
1Department of paediatrics, Fujian Maternity and Child Health Hospital, Fuzhou, 350000, People’s Republic of China; 2Fujian Key Laboratory of Nanomaterials, Fujian Institute of Research on the Structure of Matter, Chinese Academy of Sciences, Fuzhou, 350002, People’s Republic of China; 3Department of Urology, Fujian Provincial Hospital, Shengli Clinical Medical College of Fujian Medical University, Fuzhou, 350001, People’s Republic of China; 4Fujian Institute of Hematology, Fujian Provincial Key Laboratory on Hematology, Fujian Medical University Union Hospital, Fuzhou, 350001, People’s Republic of China; 5Department of Clinical Laboratory, Fujian Medical University Union Hospital, Fuzhou, 350001, People’s Republic of China; 6Department of Urology, Fujian Medical University Union Hospital, Fuzhou, 350001, People’s Republic of China
Correspondence: Fei Gao; Yongsheng Li, Tel/Fax +86 591-83357896-8242
, Email [email protected]; [email protected]
Introduction: Cardiac troponin I (cTnI) has been regarded as a gold standard for early diagnosis and prognosis monitoring of acute myocardial infarction (AMI) in clinical practice. Owing to its low concentration in blood, accurate determination of cTnI often requires high sensitivity. However, current established point-of-care (POC) assays are insufficient to meet clinically analytical requirements due to their low sensitivity.
Methods: To this end, we established a highly sensitive and reliable POC lateral flow strip based on lanthanide-doped nanoparticles (NPs) for cTnI determination in human blood samples. The capture of cTnI on the lateral flow strip was performed in a sandwich assay, where Eu3+-doped vanadate nanoparticles (GdVO4:30% Eu NPs) were used as luminescent probes to allow quantification.
Results: Our platform realized the analytical sensitivity enhancement with limit-of-detection (LOD) as low as 17 pg mL− 1 for cTnI detection, which was lower than the commercial counterpart; meanwhile, it displayed high specificity, excellent reproducibility and outstanding accuracy for analyzing clinical serum samples.
Conclusion: Overall, this strategy provided an ultrasensitive, cost-effective and user-friendly platform for on-site cTnI detection, demonstrating the prospect of lanthanide-doped NPs-based POC diagnosis of disease-related biomarkers.
Keywords: cardiac troponin I, GdVO4:30% Eu NPs, lateral flow test strip, point-of-care test
Introduction
Acute myocardial infarction (AMI), generally known as heart attack, is caused by prolonged ischemia and has the characteristics of rapid onset, poor prognosis and high fatality rate.1 Regrettably, it is estimated 23.3 million people worldwide, by 2030, will die annually from cardiovascular disease.2 Traditionally, AMI diagnoses mainly rely on patient symptoms, medical history, electrocardiography and medical imaging, which are time-consuming and expensive, and the diagnosis is equivocal. In this regard, the sensitive biomarker appraisal of patients with symptoms suggestive of AMI is urgently needed. According to the 4th edition definition of acute myocardial infarction published in 2018, cardiac troponin I (cTnI) is a significant indicator for AMI, owing to its high clinical sensitivity and specificity as well as prolonged release, in that cTnI remains in the bloodstream for more than 10 days and reaches to peak at ca. 1–2 days.3 As the recommended clinical cut-off of cTnI is as low as 0.03 ng mL−1,4 many commercial kits experience the limitation of low sensitivity. To this end, the affordable, rapid, simple, sensitive and accurate appraisal of cTnI is of great importance to early diagnosis and prognosis of AMI.5
Currently, the role of point-of-care testing (POCT) has been increasingly recognized, since analytical tests can be performed near the patients by both medical professionals and the patients themselves to facilitate health management.6,7 Enormous efforts have been devoted to establish POCT platforms, whose remarkable advantages lie in portability, speediness and straightforward readout.8 Among the reported POCT devices, lateral flow assay (LFA), paper-based simplified sensor format, is the most prevalent means due to one-step analysis and user-friendly operation.9,10 The analysis can qualitatively or quantitatively determine the level of cTnI in body fluid, typically involving conjugation of the target analyte with the probe to form a complex, which generates a readable signal. Such rapid readout can contribute to well-informed clinical decisions and allow for sample-to-answer analysis. However, one drawback is that LFA tests are subjected to poor detection limits compared with those of laboratory tests11,12 and thus are insufficient to meet the clinically analytical requirements. For example, Natarajan et al.13 developed a paper-based LFA platform for the quantitative determination of cTnI with limit of detection (LOD) in the range 1.28–1.40 ng mL−1.
Fluorescence-based LFA is an ideal candidate not only due to its inherently high sensitivity,14 but also because it has good compatibility with the clinically analytical platforms. For LFA sensitivity enhancement, the development of high-performance luminescent nanoprobes is increasingly crucial. Trivalent lanthanide (Ln3+) ions in solids can emit photons efficiently in the spectral region from ultraviolet to visible or infrared due to its distinct electronic configuration. Composed of stable inorganic host and Ln3+ emitters embedded in the host lattice, Ln3+ ions-doped nanoparticles (NPs) typically feature unique properties, such as long photoluminescence lifetime and narrow emission bands, in addition to low-toxicity, photostability, high thermal and chemical stability, when compared with conventional molecular probes (such as organic dyes and lanthanide chelates).15,16 Furthermore, Ln3+ ions-doped NPs based LFA can achieve highly sensitive bioanalysis. For example, Liu et al.17 employed near infrared lanthanide-doped NPs modified FLA platform with low interference and low detection limit. Chen et al.18 reported a lanthanide-doped polystyrene NPs based LFA, and the result was consistent with clinical diagnosis. Another feature is that an antenna needs to be introduced, which can effectively harvest the incident light and sensitize the Ln3+ luminescence.19,20 Different energy transfer schemes from the inorganic matrix and the dopant ions have been employed to enhance the luminescence of lanthanide-doped NPs.21 Vanadate is considered as an excellent optical entity to enhance the global luminescent emission because of its large absorption cross-sections and effective substrate sensitization band.22,23 Moreover, Eu3+ ions in vanadate matrix have been reported to emit strong and stable luminescence.24 The vanadate NPs doped with Eu3+ yielded the typical red luminescence of Eu3+, which can be excited with near-UV light through an energy transfer from the vanadate anion. Lanthanide-doped vanadate NPs have been intensively used in magnetic resonance imaging (MRI),25,26 however, they are still in the infancy stage when applied in bioassay fields, especially in POC diagnosis.
In this work, a facile and green preparation method was developed to synthesize Eu3+ doped vanadate (GdVO4:30% Eu) NPs as the biological fluorescent probes to establish a LFA method (Scheme 1). Owing to the high labeling ratio as well as background-free signal, the developed LFA strip is capable of sensitively, selectively and accurately determining cTnI in human blood, and has significant clinical application prospect due to its merit of low detection limit (17 pg mL−1), which is much lower than that of the commercial POCT kit (LOD > 100 pg mL−1). Moreover, the resulting system is user friendly due to convenient operation, visual fluorescence detection and rapid analysis. Taken together, the lanthanide-doped NPs integrated LFA platform can be a reliable assay for on-site cTnI determination, which is suitable for early screening of patients with AMI.
Materials and Methods
Materials and Apparatus
Materials and apparatus can be referred in Supplementary Information.
Synthesis of Eu3+ Doped Vanadate NPs
The GdVO4 NPs doped with Eu3+ (Eu3+ = 2.5, 5, 10, 20 and 30 mol%) were prepared by a simple and facile coprecipitation method. In a typical synthesis of GdVO4:30% Eu NPs, 0.35 mmol Gd (NO3)3, 0.15 mmol Eu (NO3)3, 1–2.5 mmol sodium citrate and 0.5 mmol Na3VO3 were added to 50 mL round-bottomed flask and dissolved in 20 mL distilled water. Subsequently, the reaction was conducted at 85 °C for 24 h under nitrogen atmosphere. After cooling down to room temperature, the resulting product was collected by centrifugation with speed of 10,000 rpm, washed with distilled water three times and dried to obtain the GdVO4:Eu NPs.
Labeling of Anti-cTnI Antibodies with GdVO4:30% Eu NPs
The antibodies were labeled with GdVO4:30% Eu NPs via the classical covalent linkage method using 1-ethyl-3-(3-dimethylaminopropyl)-carbodiimide hydrochloride (EDC) and N-hydroxy-succinimide (NHS). In brief, 1% solid content of GdVO4:30% Eu NPs was first subjected to ultrasonic dispersion for 2 min, and then 200 μL of solution was taken and centrifugated (14000 rpm, 15 min), and finally re-suspended by 1 mL of 2-(N-morpholino) ethanesulfonic acid (MES) buffer solution (50 mM, pH 5–6). Then, 50 μL of EDC (100 mg mL−1) was added to the above solution and incubated for 5 min, and 150 μL of NHS (100 mg mL−1) was then added and incubated for 15 min. After activation, 1 mL of MES buffer solution was added to re-suspend GdVO4:30% Eu NPs twice. Subsequently, 100–200 μg of primary antibody against the cTnI was added to the activated GdVO4:30% Eu NPs, followed by cross-coupling reaction for 2 h. 500 μL of blocking buffer (containing 50 mM Tris-HCl, 0.5% BSA and 0.1% proclin) was added and reacted for 1 h. Then, the target NPs-labeled antibodies were collected by centrifugation (14,000 rpm, 15 min) and washed twice with Tris buffer solution (50 mM, 1% NaCl, 0.5% BSA, 0.1% tween-20, 0.1% proclin, pH = 8). Finally, the resulting product was re-suspended by 200 μL of Tris buffer solution.
Fabrication of LFA Strip for cTnI Determination
The lateral flow test strip consisted of a sample binding pad, nitrocellulose (NC) membrane and absorbent pad, which were assembled sequentially onto the polyvinyl chloride (PVC) backing for supporting all the components. The sample pad was prepared using glass fiber which was pretreated by PBS containing 2% NaCl, 2% BSA, 0.5% casein, 0.1% tween-20, 0.5% surfactant S9 and 5% sucrose, and then loaded with GdVO4:30% Eu NPs labeled primary antibody against the cTnI. The sample binding pad and absorbent pad were attached on both ends of the NC membrane respectively to form a test area where cTnI antibody of another epitope (1 mg mL−1) and goat anti-mouse IgG antibody (1 mg mL−1) were immobilized in parallel to form a test line and control line, respectively. The time-resolved fluorescence immunochromatographic strip with a width of 4 mm was finally obtained and stored in sealed bag at 4 °C for further use.
The cTnI Determination Based on the LFA Platform
The cTnI detection was conducted in a double-antibody sandwich format. 75 μL of sample solution containing cTnI with known concentration was dropped onto the sample pad and migrated along the strip due to capillary force. After appropriate reaction time, the test strip was subjected to the fluorescent reader under the time-resolved detection mode, followed by recording fluorescent intensity ratio of test line to control line (abbreviated as T/C ratio) against cTnI concentration. A calibration curve can be established to quantitatively indicate the cTnI concentration in real serum sample. Each experiment was repeated three times, and the data were presented as mean standard deviation.
The cTnI Determination Based on Commercial Kit
In order to measure cTnI standard and clinical samples, 50 µL of sample solution and 80 µL of H3NO (10 mM) were added into the test strip involving dried HAuCl4 (30 mM) on a reagent pad. After 20 min of assay time, a smartphone-based reader was used to capture the test strip images, running Image J software to analyze the signal values. Then, serially diluting cTnI antigens with serum-free cTnI were employed to prepare different concentrations of standard cTnI samples. All experiments involving blood samples (n = 86) were approved by the Ethics Committee of Fujian Medical University Union Hospital (Approval No. 2020WSJK032) and all donors signed the informed consent, in accordance with the Declaration of Helsinki. After collection, these clinical samples were measured by AFS-1000 dry-type fluorescence immunoassay analyzer. All clinical samples and cTnI antigens were stored at −80 °C until used.
To appraise the stability of the reagent used for Au-ion amplification, 30 mM HAuCl4 that was dried on reagent pad followed by being vacuum-sealed and 10 mM H3NO solution were stored at 44 °C for 80 days, so as to accelerate test for color stability. Following which Au-ion amplification was performed on a standard test strip by treatment with 0.5 × 40 nm Au NPs-antibodies (Ab) conjugates on test or control line. To evaluate batch reproducibility, three batches of test strips assembled with a 3.0 mm PVA barrier and Au-ion amplification setup were constructed. Additionally, in serum sample, each batch of strips was measured with three varying concentrations, namely 10, 103 and 105 pg mL−1 of standard cTnI. Then smartphone-based reader and Image J software were respectively employed to capture the images and analyse the signals. The stability test of the reagent obtained on the day of preparation was original activity (100%). The relative activity for each day was calculated by dividing the corresponding test result by the level of the original activity.
Statistic Analysis
The two-sample t-test was performed for evaluation of the differences in measured intensity in the cTnI clinical samples (10–40 pg mL−1), and all data are presented as the mean ± standard deviation (SD) of at least three measurements. Experimental replicates are exhibited in respective figure captions. Statistical significance was set at P < 0.05.
Results and Discussion
Principle of the LFA Platform
The detection of cTnI on the lateral flow test strip was performed in a sandwich assay format based on the antigen-antibody reaction. As illustrated in Scheme 1, primary antibody (Ab1) against the cTnI was labeled with GdVO4:30% Eu NPs to form NPs-Ab1 conjugates which were pre-fixed on the conjugate pad. Another antibody (Ab2) against a different epitope of the cTnI antigen and goat anti-mouse IgG were immobilized on the NC membrane as test line and control line, respectively. When the liquid sample was introduced onto the sample pad, cTnI antigens moved along the test strip due to capillary force, and then they were bound with NPs-Ab1 conjugates. The formed complexes migrated to the NC membrane and were first captured by test line (T line), forming a sandwich structure. The excess NPs-Ab1 conjugates continued to migrate along the NC membrane and were finally captured in the control line (C line) by reacting with goat anti-mouse antibodies (IgG). Thus, positive and negative results could be determined by observing the fluorescent appearance in the T line and C line. The appearance of two colored lines suggests a positive result, while a negative test sample is indicated by the appearance of only the C line. One significant advantage of ratiometric quantification is its insensitivity to variation of different strips, enabling a robust readout between intra- and inter-assays. After appropriate reaction time, the strip was subjected to fluorescence detection, and a linear calibration curve can be established by plotting the intensity ratio of T/C against cTnI with known concentration, which can then be used to quantitatively indicate cTnI concentration in the test solution.
 |
Scheme 1 Schematic illustration for configuration and principle of the cTnI determination. |
Characterization of the Fluorescent Probes
In this work, water-soluble GdVO4:30% Eu NPs were synthesized by a simple coprecipitation route. The structure of resulting product was identified by XRD analysis, as shown in Figure S1. All the diffraction peaks appeared to match well with pure GdVO4 (JCPDS: 17–0260) and indicated the sample crystallized in tetragonal phase (space group: I41/amd).27,28 No other phase was observed, indicating the high phase purity of the Eu-doped GdVO4. The enlarged d values (Table S1) of three strong lines can be attributed to the introduction of Eu3+,29 because ionic radius of the Eu3+ ion (0.947Å) is slightly larger than that of Gd3+ ion (0.938Å),16 thus suggesting that the Eu3+ ions had been successfully incorporated into the host (GdVO4) crystal lattice by replacing Gd3+ without destroying the tetragonal zircon type structure of GdVO4.
The morphology and size of obtained GdVO4:30% Eu NPs were investigated by scanning electron microscope (SEM). As shown in Figure 1A and B, it revealed that the resulting product consisted of uniform microerythrocyte-like NPs with diameter in a range of 200–300 nm. The dynamic light scattering (DLS) result also proved the conclusion (inset of Figure 1B). Further details of the sample structure were analyzed by transmission electron microscope (TEM) and high-resolution TEM (HRTEM). Figure 1C displays the TEM image of a typical GdVO4:30% Eu NPs with diameter of ca. 250 nm. In addition, the contrast between the relatively brighter centers and the dark surrounding area implies there was a depression in the center, supporting the claim of microarchitecture-like shape in SEM. As demonstrated by the corresponding HRTEM (inset of Figure 1C), it displayed well-defined lattice fringes with d spacing of 0.362 nm, which is in accordance with the lattice spacing in the (200) crystal planes of tetragonal GdVO4. Furthermore, the energy dispersive X-ray (EDX) result depicted in Figure S2 revealed that this sample was detected with significant quantities of Eu3+ in GdVO4 NPs. To gain better insight into formation of the unique morphology of the GdVO4 sample, we investigated the effect of sodium citrate serving as the chelating agent in the preparation process, as shown in the TEM images of the sample synthesized with different molar ratio of Na3VO4:Na3Cit. When decreasing the amount of Na3Cit, the Cit:Gd3+ molar ratio was increased to 3:1, and the morphology of the sample was deduced to be a quasi-pancake hierarchical structure with a diameter below 200 nm (Figure 1D), with rough surface and evident boundaries of the obtained two-dimensional pancake-like patterns. Further decreasing the molar ratio to 2:1, imperfect microsphere structures were formed (Figure 1E) with rest of small NPs. Accordingly, citrate anions have a significant role in the formation of the GdVO4 microstructure.
 |
Figure 1 SEM images of GdVO4:30% Eu NPs. (A) Scale bar = 1 μm and (B) scale bar = 100 nm. TEM images of GdVO4:30% Eu NPs with different molar of Cit3-/Gd3+ (C) 4:1, (D) 3:1, (E) 2:1. Inset of b: DLS of the GdVO4:30% Eu NPs. Inset of c: HRTEM image of GdVO4:30% Eu NPs (scale bar = 5 nm). |
In order to determine the optimal doping concentration, we varied the content of Eu3+ in the GdVO4 samples. The dependence of the PL emission intensity on Eu3+ doping concentration (x) in Gd (1-x)VO4:xEu3+ samples is displayed in Figure S3. It can be observed that the PL emission intensity of Eu3+ doped GdVO4 intensified with a corresponding increase in doping concentrations, and it leveled off when Eu3+ concentration was over 20%. In view of concentration quenching effect, the optimum doping concentration for Eu3+ was 30%. The PL behaviors of GdVO4:30% Eu NPs are illustrated in Figure 2A. The excitation spectrum consisted of a broad band centered at about 285 nm. The strong absorption in the UV range is ascribed to GdVO4 host (VO43-) excitation band due to V-O charge transfer inside the VO43- groups, followed by transfer from the VO43- groups to the Eu3+ ions.30,31 Sharp and well-resolved peaks ranging from 500–700 nm could be observed in the emission spectrum similar to the characteristic lanthanide luminescence, which originates from the 5D0→7FJ (J = 1, 2, 3, 4) electronic transitions expected for Eu3+. Among them, the dominant red emission at 618 nm due to 5D0→7F2 transition was higher than that associated with other transitions because of the absence of inversion center for the introduction of Eu3+ ions which replace the normal sites of Gd3+ ions in the tetragonal GdVO4 structure.32 In addition, no emission from the VO43- groups was observed, indicating the efficient energy transfer between VO43- groups and Eu3+ ions. A bright red fluorescence could be observed in the GdVO4:30% Eu NPs under a UV-light illumination. The PL lifetime of 5D0 (Eu3+) monitored at 618 nm for GdVO4:30% Eu NPs was determined to be 0.583 ms, as shown in Figure 2B. Such a long lifetime makes it possible for TR technique to improve the sensitivity of detection.
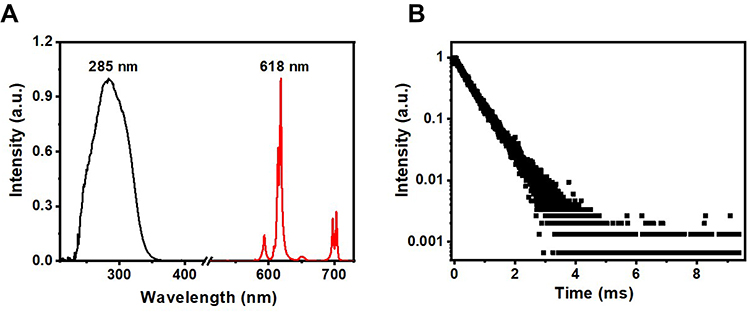 |
Figure 2 (A) The excitation spectrum (black line) and emission spectrum (red line) of GdVO4:30% Eu NPs. (B) The PL decay from 5D0 of the NPs emission monitoring at 618 nm. |
Furthermore, Fourier transform infrared (FTIR) spectrum of the GdVO4:30% Eu NPs sample was recorded in the wave number range of 400–4000 cm−1 (Figure S4). The characteristic absorption peaks of GdVO4 located at 807 and 450 cm−1 can be ascribed to the stretching vibrations of the V-O (from the VO43- group) and Gd-O bond, respectively.33,34 A broad absorption band at 3423 cm−1 and a weak band at 1646 cm−1 can be assigned to the O-H stretching and bending vibration of the water molecule physically absorbed on the sample.14 The band at 1083 cm−1 originates from the C-OH groups,35 and those at 1560 and 1389 cm−1 correspond to the asymmetric (νas) and symmetric (νs) stretching vibrations of the carboxylic group (-COO−), respectively.36 These carboxylic groups were introduced due to some Cit3- molecules on the surface of the particles, which render the GdVO4:30% Eu NPs excellent water solubility and biocompatibility without any further surface functionalization, beneficial to their potential application as luminescent bio-labels. GdVO4:30% Eu NPs were then characterized with ζ-potential measurements (Figure S5). The ζ-potential of GdVO4:30% Eu NPs was −31.9 mV, further indicating the negatively charged carboxylic groups on the surface of GdVO4:30% Eu NPs. The zeta potential value varied to −9.63 mV after the conjugation with the Ab1. The antibody labeling concentration was determined with Bradford kit. Firstly, the calibration curve was established using a series of standards and the absorbance of Ab-conjugated GdVO4:30% Eu NPs with known concentration at 560 nm was measured. Then, according to the linear equation (A = 0.211C + 0.178, R2 = 0.999) in Figure S6, the mass ratio of Ab/NPs was 27 μg mg−1, and the labelling efficiency was calculated to be 40.5–54%.
Analytical Performance of LFA Platform
On the basis of the prepared method, we assessed the working curve for the determination of the cTnI serum samples. The control solution without analytes showed no fluorescent signal on T line, which proved the results were valid (Figure 3A). With target-specific binding, the red PL of the T line gradually intensified with increase in concentrations of target cTnI under 310 nm ultraviolet illumination. Therefore, such a visible color change provides a qualitative or semiquantitative evaluation of cTnI level by the naked eye. It was satisfactory to find that this LFA strip was able to perform a visual readout even when the concentration of cTnI was as low as 0.025 ng mL−1. This visual detection limit was lower than 0.03 ng mL−1 which is recommended as the positive threshold value for clinically applicable AMI diagnoses.4 In order to further determine the sensitivity of the LFA system, standard solutions with known cTnI concentrations ranging from 0.02 to 30 ng mL−1 were measured on the commercial fluorospectrometer. A good linear dependence was found between the fluorescent intensity ratio of T/C and cTnI concentration. The linear equation was fitted to be y = 0.0971x + 0.0371 with a correlation coefficient of 0.998 (Figure 3B). More importantly, LOD reached a value as low as 17 pg mL−1. Compared with other reports related to cTnI determination (Table 1),13,37–45 the prepared lanthanide-doped NPs-based LFA has the merits of relatively low LOD and wide linear range. As for colorimetry, it is hard to distinguish the intermediate color with the naked eye. However, just a portable hand-held fluorescent lamp can realize an objectively qualitative test on the prepared LFA even in an emergency situation or in areas/situations without specialized equipment. As is well known, in healthy individuals, the cTnI concentration is maintained at 0.1–0.3 ng mL−1, however the patients with suspected AMI are identified with the cut-off level of 6 ng mL−1 at 1 hour.13 In this regard, the developed platform is sensitive enough to be employed in clinical application. Also of note, this platform can complete all steps within 15 min for one sample, thus the proposed assay with combined high sensitivity and rapidity has competitive potential for on-site cTnI detection.
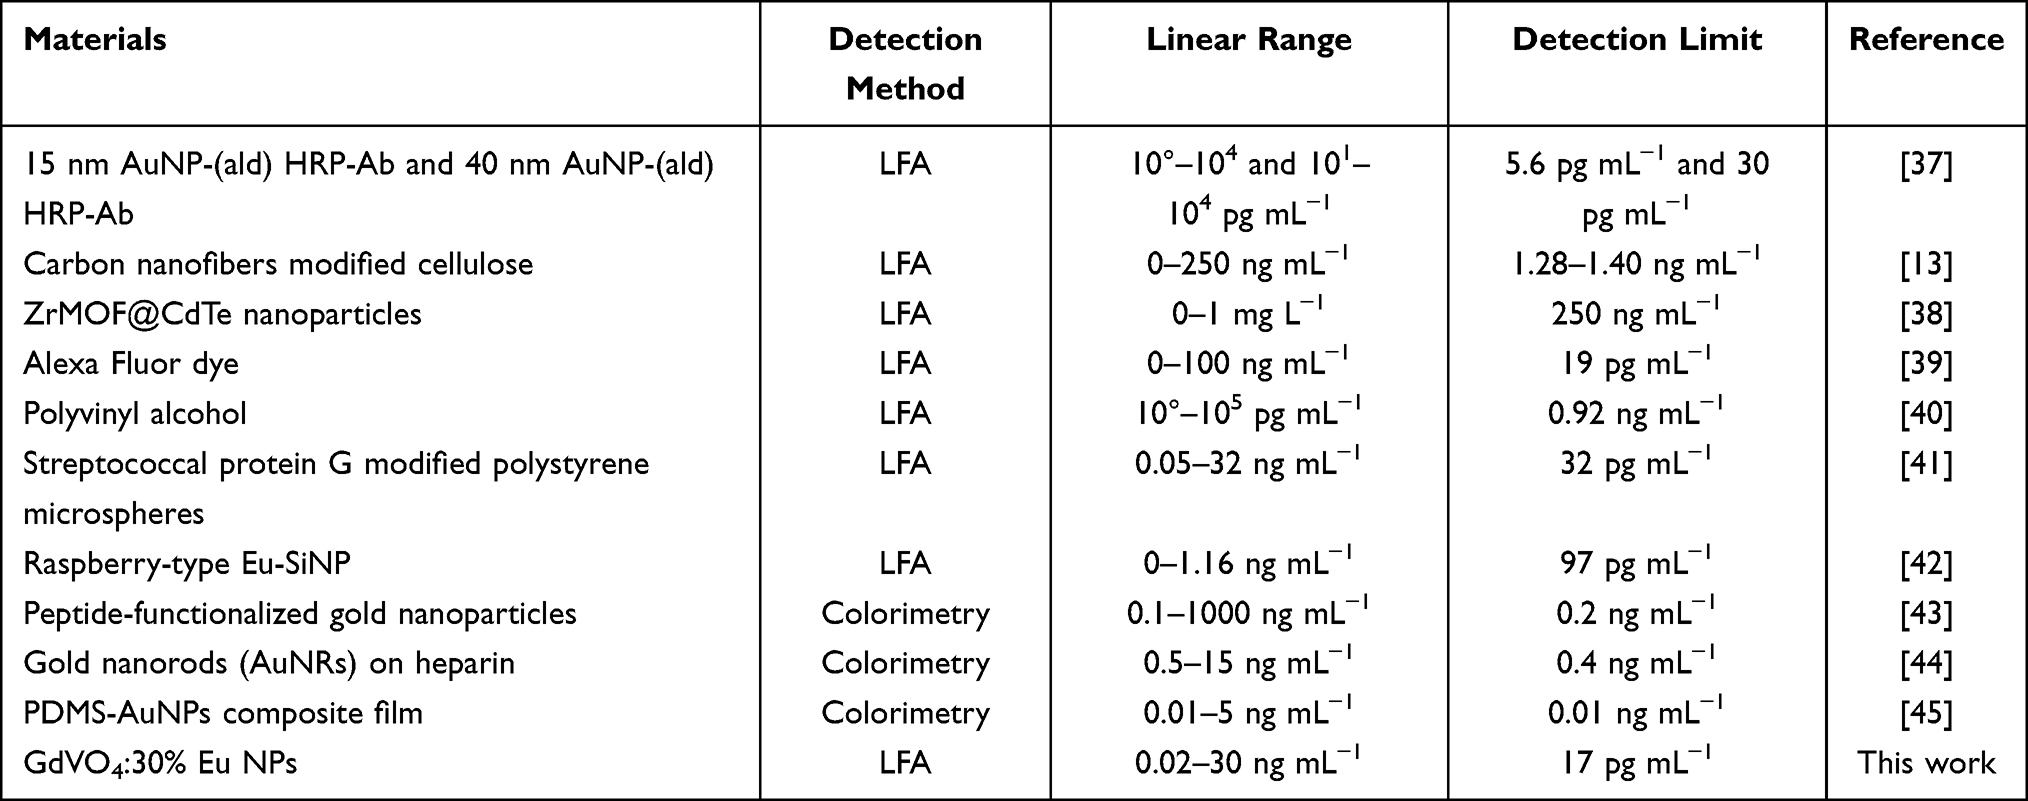 |
Table 1 Comparison of Various Methods for cTnI Determination |
 |
Figure 3 (A) The photos of LFA system toward different-concentration cTnI standards under UV light excitation. From left to right, the concentrations are 2.5, 0.25, 0.025 and 0 ng mL−1 in order. (B) Calibration curve between the relative fluorescence intensity (T/C) versus the cTnI concentration. |
Reproducibility, Specificity and Stability of LFA Platform
The reproducibility, specificity and stability of an immunoassay are important for analytical application. We measured the intra- and inter-assay variations to investigate the bias between different strips. Herein, intra-assay coefficient of variation (CV) and inter-assay CV were calculated as listed in Table 2, ranging from 3.67–6.86% and 4.92–7.92%, respectively. Both CVs were lower than 10%, validating the high precision of our LFA strip. In addition to reproducibility, another important issue that really matters in a newly developed platform is the specificity. To investigate this point, we tested the responses of LFA strip with cTnI samples containing a range of common interferents and cross-reactivity proteins in real serum samples. As depicted in Table 3, two samples with different cTnI concentrations all exhibited relative deviations (RD) within ± 10%, revealing that coexistence of these potential interferents did not show remarkable interference effects. Moreover, as shown in Figure 4, the stability experiment noted that GdVO4:30% Eu NPs retained their bioactivity when used in test strips. The fluorescence intensity decay rate was 1.2% after repeating 100 times, which is better in comparison to 2.4% in regard to polystyrene microsphere-based LFA strip. Therefore, the favorable good reproducibility, anti-interference ability and stability of our LFA strip were well fitted for the accurate determination of cTnI even in complex biological fluids.
 |
Table 2 The Reproducibility Results of the Developed LFA Strip |
 |
Table 3 The Specificity Results of the Developed LFA Strip with Interferents on cTnI Detection |
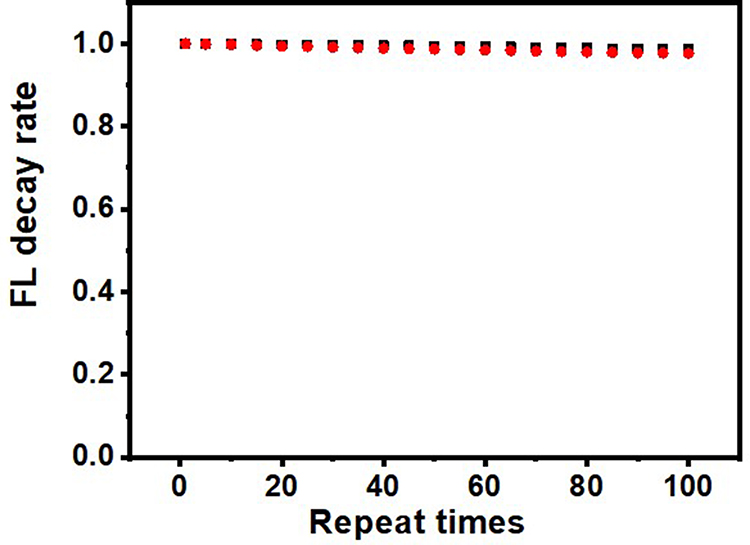 |
Figure 4 Fluorescence intensity decay rate of the LFA strip at different repeat times. Black dots: GdVO4 NPs probe; red dots: Polystyrene microsphere. |
Real Sample Analysis
To demonstrate the reliability of direct quantitation of cTnI in complex media, we also performed in vitro cTnI detection in Beckman quality control serum samples. The fluorescent signal at different sites on the NC membrane was depicted as the scan profile in Figure 5A. The fluorescent signal ratio (T/C ratio) exhibited a good linear dependence on the cTnI concentration as represented in Figure 5B. The linear equation was y = 0.018x + 6.3*10−4, with a correlation coefficient (R2) of 0.997. This result revealed that this LFA strip was capable of reliable cTnI determination in an unknown serum sample. To further evaluate the accuracy of the developed LFA strip, comparisons of the quantitative results between the LFA strip and the commercial chemiluminescence immunoassay kit were made. The results of 86 serum samples were chosen randomly to ensure consistency. Correlation of two methods was evaluated using Passing-Bablok linear regression (y = 0.92 x + 0.25), as shown in Figure 5C, a good agreement could be observed between our results with respect to those measured by commercial kit and a correlation coefficient (R2) of 0.964 was obtained. In addition, bias was investigated by the results from Bland-Altman plots (Figure 5D). The mean relative differences between two sets of analysis results were all less than 10%, validating good consistency between these two approaches.
 |
Figure 5 (A) The fluorescence signals of various concentrations of cTnI ranging from 0.1–30 ng mL−1 spiked in Beckman cTnI quality control serum samples at different sites on the NC membrane. (B) Linear regression analysis of cTnI in Beckman quality control serum samples. (C) Correlation between the LFA kit based on GdVO4:30% Eu NPs and commercial kit for the determination of cTnI in 86 serum samples. (D) The difference between the developed LFA kit value and the commercial kit. |
Conclusion
In this work, we developed a practical GdVO4:30% Eu NPs-based LFA strip for rapid and sensitive detection of cTnI in real blood samples. The unique features of luminescent probe GdVO4:30% Eu NPs, under time-resolved detection mode without short-lived background interferences, allow for high sensitivity in cTnI detection, whose concentration can also be referred just by visual fluorescence readout even in an emergency situation without specialized equipment. The developed POC platform with ultralow detection limit is theoretically applicable to clinical application, and further practically demonstrated satisfactory results to meet the requirements for the determination of cTnI using clinical samples. Furthermore, a high correlation coefficient was achieved between our results with respect to those measured independently by using a commercial kit, demonstrating the accuracy and reliability of the proposed assay. By virtue of the remarkable advantages including visual readout detection, speediness, improved sensitivity, high specificity and good reproducibility, it could be concluded that this lanthanide-doped nanoprobes-based LFA strip would be a good candidate for next-generation POC diagnosis of biomarkers.
Supplementary Materials
Additional figures for XRD, XPS, FTIR, ζ-potentials and calibration curve are provided.
Acknowledgments
The authors thank the Fujian Provincial University-Industry Cooperation Science & Technology Major Program (2019Y4006), Construction project of Fujian medical center of hematology (Min201704), Sponsored by National and Fujian Provincial Key Clinical Specialty Discipline Construction Program, P. R.C for financial support.
Disclosure
The authors declare that they have no known competing financial interests or personal relationships that could have appeared to influence the work reported in this paper.
References
1. Mullins KE, Christenson RH. Optimal detection of acute myocardial injury and infarction with cardiac troponin: beyond the 99th Percentile, into the high-sensitivity era. Curr Cardiol Rep. 2020;22(9):1–10. doi:10.1007/s11886-020-01350-w
2. Fathil MFM, Arshad MM, Gopinath SC, et al. Diagnostics on acute myocardial infarction: cardiac troponin biomarkers. Biosens Bioelectron. 2015;70:209–220. doi:10.1016/j.bios.2015.03.037
3. Han X, Li S, Peng Z, Othman AM, Leblanc RM. Recent development of cardiac troponin I detection. Physiol Plant. 2016;1(2):106–114. doi:10.1021/acssensors.5b00318
4. Huang H, Zhu S, Wang W, et al. Diagnosis of acute myocardial infarction in patients with renal insufficiency using high-sensitivity troponin T. Clin Chem Lab Med. 2015;53(5):723–730. doi:10.1515/cclm-2014-0715
5. Staden SV, Ilie RM, Pogacean F, Pruneanu SM. Needle stochastic sensors for on-site fast recognition and quantification of biomarkers for gastric cancer in biological samples. New J Chem. 2020;44(46):20203–20211. doi:10.1039/D0NJ03847D
6. Regan B, O’Kennedy R, Collins D. Point-of-care compatibility of ultra-sensitive detection techniques for the cardiac biomarker troponin I-challenges and potential value. Biosensors. 2018;8(4):114. doi:10.3390/bios8040114
7. Hassan SU, Tariq A, Noreen Z, Donia A, Zhang X. Capillary-driven flow microfluidics combined with smartphone detection: an emerging tool for point-of-care diagnostics. Diagnostics. 2020;10(8):509. doi:10.3390/diagnostics10080509
8. Wang C, Liu M, Wang Z, Li S, Deng Y, He N. Point-of-care diagnostics for infectious diseases: from methods to devices. Nano Today. 2021;37:101092. doi:10.1016/j.nantod.2021.101092
9. Yang J, Wang K, Xu H, Yan W, Jin Q, Cui D. Detection platforms for point-of-care testing based on colorimetric, luminescent and magnetic assays: a review. Talanta. 2019;202:96–110. doi:10.1016/j.talanta.2019.04.054
10. Jiang N, Ahmed R, Damayantharan M, Nal B, Yetisen AK. Lateral and vertical flow assays for point-of-care diagnostics. Adv Healthcare Mater. 2019;8(14):1900244. doi:10.1002/adhm.201900244
11. Guo J, Chen S, Tian S, Liu K, Ma X, Guo J. A sensitive and quantitative prognosis of C-reactive protein at picogram level using mesoporous silica encapsulated core-shell up-conversion nanoparticle based lateral flow strip assay. Talanta. 2021;230:122335. doi:10.1016/j.talanta.2021.122335
12. Bishop JD, Hsieh HV, Gasperino DJ, Weigl BH. Sensitivity enhancement in lateral flow assays: a systems perspective. Lab Chip. 2019;19(15):2486–2499. doi:10.1039/C9LC00104B
13. Natarajan S, Jayaraj J, Prazeres DMF. A cellulose paper-based fluorescent lateral flow immunoassay for the quantitative detection of cardiac troponin I. Biosensors. 2021;11(2):49. doi:10.3390/bios11020049
14. Li Z, Wang Y, Wang J, Tang Z, Pounds JG, Lin Y. Rapid and sensitive detection of protein biomarker using a portable fluorescence biosensor based on quantum dots and a lateral flow test strip. Anal Chem. 2010;82(16):7008–7014. doi:10.1021/ac101405a
15. Liu Q, Cheng S, Chen R, et al. Near-infrared lanthanide-doped nanoparticles for a low interference lateral flow immunoassay test. ACS Appl Mater Inter. 2020;12(4):4358–4365. doi:10.1021/acsami.9b22449
16. Wilhelm S. Perspectives for upconverting nanoparticles. ACS Nano. 2017;11(11):10644. doi:10.1021/acsnano.7b07120
17. Liu QY, Cheng SM, Chen R, et al. Hybrids of upconversion nanoparticles and silver nanoclusters ensure superior bactericidal capability via combined sterilization. ACS Appl Mater Inter. 2020;12(46):51285–51292. doi:10.1021/acsami.0c15710
18. Chen ZH, Zhang ZG, Zhai XM, et al. Rapid and sensitive detection of anti-SARS-CoV-2 IgG, using lanthanide-doped nanoparticles-based lateral flow immunoassay. Anal Chem. 2020;92(10):7226–7231. doi:10.1021/acs.analchem.0c00784
19. Zheng W, Tu D, Huang P, Zhou S, Chen Z, Chen X. Time-resolved luminescent biosensing based on inorganic lanthanide-doped nanoprobes. Chem Commun. 2015;51(20):4129–4143. doi:10.1039/C4CC10432C
20. da Rosa PPF, Kitagawa Y, Hasegawa Y. Luminescent lanthanide complex with seven-coordination geometry. Coordin Chem Rev. 2020;406:213153. doi:10.1016/j.ccr.2019.213153
21. Liu Y, Tu D, Zhu H, Chen X. Lanthanide-doped luminescent nanoprobes: controlled synthesis, optical spectroscopy, and bioapplications. Chem Soc Rev. 2014;42(16):6924–6958. doi:10.1039/C3CS60060B
22. Escudero A, Carrillo-Carrión C, Zyuzin MV, Parak WJ. Luminescent rare-earth-based nanoparticles: a summarized overview of their synthesis, functionalization, and applications. Top Curr Chem. 2016;374(4):1–15. doi:10.1007/s41061-016-0049-8
23. Mousseau F, Tarisse CF, Simon S, Gacoin T, Alexandrou A, Bouzigues CI. Luminescent lanthanide nanoparticle-based imaging enables ultra-sensitive, quantitative and multiplexed in vitro lateral flow immunoassays. Nanoscale. 2021;13(35):14814–14824. doi:10.1039/D1NR03358A
24. Abdesselem M, Schoeffel M, Maurin I, et al. Correction to multifunctional rare-earth vanadate nanoparticles: luminescent labels, oxidant sensors, and MRI contrast agents. ACS Nano. 2015;9(4):4660. doi:10.1021/acsnano.5b01924
25. Kang X, Yang D, Dai Y, et al. Poly (acrylic acid) modified lanthanide-doped GdVO4 hollow spheres for up-conversion cell imaging, MRI and pH-dependent drug release. Nanoscale. 2013;5(1):253–261. doi:10.1039/c2nr33130f
26. Chen C, Li C, Li T, et al. Water-soluble, monodisperse, lanthanide-doped Y(Gd)VO4 nanocrystals as promising multimodal bioprobe. Eur J Inorg Chem. 2015;2015(19):3108–3115. doi:10.1002/ejic.201500212
27. Song Y, Shao B, Feng Y, et al. Emission enhancement and color tuning for GdVO4: Ln3+ (Ln=Dy, Eu) by surface modification at single wavelength excitation. Inorg Chem. 2017;56(1):282–291. doi:10.1021/acs.inorgchem.6b02125
28. Kaowphong S, Chumha N, Nimmanpipug P, Kittiwachana S. Nanosized GdVO4 powders synthesized by sol-gel method using different carboxylic acids. Rare Met. 2018;37(7):561–567. doi:10.1007/s12598-015-0681-4
29. Jin D, Yang H, Ding G, Yu X, Wang L, Zheng Y. Hydrothermal synthesis and photoluminescence behavior of Eu-doped GdVO4. Inorg Mater. 2008;44(10):1121–1124. doi:10.1134/S002016850810018X
30. Li X, Yu M, Hou Z, et al. One-dimensional GdVO4:Ln3+ (Ln=Eu, Dy, Sm) nanofibers: electrospinning preparation and luminescence properties. J Solid State Chem. 2011;184(1):141–148. doi:10.1016/j.jssc.2010.11.019
31. Szczeszak A, Grzyb T, Śniadecki Z, et al. Structural, spectroscopic, and magnetic properties of Eu3+-doped GdVO4 nanocrystals synthesized by a hydrothermal method. Inorg Chem. 2014;53(23):12243–12252. doi:10.1021/ic500354t
32. Liu Y, Liu G, Dong X, Wang J, Yu W. Tunable photoluminescence and magnetic properties of Dy3+ and Eu3+ doped GdVO4 multifunctional phosphors. Phys Chem Chem Phys. 2015;17(40):26638–26644. doi:10.1039/c5cp04373e
33. Liu G, Hong G, Wang J, Dong X. Deposition of GdVO4:Eu3+ nanoparticles on silica nanospheres by a simple sol-gel method. Nanotechnology. 2006;17(13):3134. doi:10.1088/0957-4484/17/13/009
34. Xu Z, Feng B, Gao Y, et al. Uniform and well-dispersed GdVO4 hierarchical architectures: hydrothermal synthesis, morphology evolution, and luminescence properties. CrystEngComm. 2012;14(17):5530–5538. doi:10.1039/c2ce25521a
35. Gabrienko AA, Ewing AV, Chibiryaev AM, Agafontsev AM, Dubkov KA, Kazarian SG. New insights into the mechanism of interaction between CO2 and polymers from thermodynamic parameters obtained by in situ ATR-FTIR spectroscopy. Phys Chem Chem Phys. 2016;18(9):6465–6475. doi:10.1039/c5cp06431g
36. Yang L, Li L, Zhao M, Li G. Size-induced variations in bulk/surface structures and their impact on photoluminescence properties of GdVO4:Eu3+nanoparticles. Phys Chem Chem Phys. 2012;14(28):9956–9965. doi:10.1039/c2cp41136a
37. Han GR, Kim MG. Highly sensitive chemiluminescence-based lateral flow immunoassay for cardiac troponin I detection in human serum. Sensors. 2020;20(9):2593. doi:10.3390/s20092593
38. Zou J, Liu X, Ren X, et al. Rapid and simultaneous detection of heart-type fatty acid binding protein and cardiac troponin using a lateral flow assay based on metal organic framework@CdTe nanoparticles. Nanoscale. 2021;13(16):7844–7850. doi:10.1039/D1NR00702E
39. Natarajan S, Su F, Jayaraj J, Shah MII, Huang Y. A paper microfluidics-based fluorescent lateral flow immunoassay for point-of-care diagnostics of non-communicable diseases. Analyst. 2019;144(21):6291–6303. doi:10.1039/C9AN01382B
40. Han GR, Koo HJ, Ki H, Kim MG. Paper/soluble polymer hybrid-based lateral flow biosensing platform for high-performance point-of-care testing. ACS Appl Mater Inter. 2020;12(31):34564–34575. doi:10.1021/acsami.0c07893
41. Lou D, Fan L, Cui Y, Zhu Y, Gu N, Zhang Y. Fluorescent nanoprobes with oriented modified antibodies to improve lateral flow immunoassay of cardiac troponin I. Anal Chem. 2018;90(11):6502–6508. doi:10.1021/acs.analchem.7b05410
42. Lee KW, Kim KR, Chun HJ, et al. Time-resolved fluorescence resonance energy transfer-based lateral flow immunoassay using a raspberry-type europium particle and a single membrane for the detection of cardiac troponin I. Biosens Bioelectron. 2020;163:112284. doi:10.1016/j.bios.2020.112284
43. Liu X, Wang Y, Chen P, et al. Peptide functionalized gold nanoparticles with optimized particle size and concentration for colorimetric assay development: detection of cardiac troponin I. Acs Sensors. 2016;1(12):1416–1422. doi:10.1021/acssensors.6b00493
44. Raj V, Alex S. Non-enzymatic colorimetric sensor for cardiac Troponin I (cTnI) based on self-assembly of gold nanorods on heparin. Gold Bull. 2021;54(1):1–7. doi:10.1007/s13404-020-00287-w
45. Wu WY, Bian ZP, Wang W, Zhu JJ. PDMS gold nanoparticle composite film-based silver enhanced colorimetric detection of cardiac troponin I. Sens Actuators B Chem. 2010;147(1):298–303. doi:10.1016/j.snb.2010.03.027
 © 2022 The Author(s). This work is published and licensed by Dove Medical Press Limited. The
full terms of this license are available at https://www.dovepress.com/terms
and incorporate the Creative Commons Attribution
- Non Commercial (unported, 3.0) License.
By accessing the work you hereby accept the Terms. Non-commercial uses of the work are permitted
without any further permission from Dove Medical Press Limited, provided the work is properly
attributed. For permission for commercial use of this work, please see paragraphs 4.2 and 5 of our Terms.
© 2022 The Author(s). This work is published and licensed by Dove Medical Press Limited. The
full terms of this license are available at https://www.dovepress.com/terms
and incorporate the Creative Commons Attribution
- Non Commercial (unported, 3.0) License.
By accessing the work you hereby accept the Terms. Non-commercial uses of the work are permitted
without any further permission from Dove Medical Press Limited, provided the work is properly
attributed. For permission for commercial use of this work, please see paragraphs 4.2 and 5 of our Terms.