Back to Journals » Clinical Ophthalmology » Volume 14
High Prevalence of Abnormal Ocular Surface Tests in a Healthy Pediatric Population
Authors Rojas-Carabali W ![]() , Uribe-Reina P, Muñoz-Ortiz J
, Uribe-Reina P, Muñoz-Ortiz J ![]() , Terreros-Dorado JP
, Terreros-Dorado JP ![]() , Ruiz-Botero ME, Torres-Arias N
, Ruiz-Botero ME, Torres-Arias N ![]() , Reyes-Guanes J
, Reyes-Guanes J ![]() , Rodriguez Zarante A, Arteaga-Rivera JY
, Rodriguez Zarante A, Arteaga-Rivera JY ![]() , Mosos C
, Mosos C ![]() , Gutiérrez AM, Molano-González N, Marroquín G, de-la-Torre A
, Gutiérrez AM, Molano-González N, Marroquín G, de-la-Torre A ![]()
Received 5 June 2020
Accepted for publication 9 September 2020
Published 22 October 2020 Volume 2020:14 Pages 3427—3438
DOI https://doi.org/10.2147/OPTH.S266261
Checked for plagiarism Yes
Review by Single anonymous peer review
Peer reviewer comments 3
Editor who approved publication: Dr Scott Fraser
William Rojas-Carabali,1 Pilar Uribe-Reina,1,2 Juliana Muñoz-Ortiz,2 Juan Pablo Terreros-Dorado,2 María Eugenia Ruiz-Botero,1 Nicolás Torres-Arias,1 Juliana Reyes-Guanes,2 Alejandra Rodriguez Zarante,1 Jose Y Arteaga-Rivera,2 Camilo Mosos,2 Ángela María Gutiérrez,2 Nicolás Molano-González,3 Guillermo Marroquín,4 Alejandra de-la-Torre1
1Research Group in Neurosciences NeURos. Escuela de Medicina y Ciencias de la Salud, Universidad del Rosario, Bogotá, Colombia; 2Escuela Barraquer. research group. Escuela Superior de Oftalmología del Instituto Barraquer de América, Bogotá, Colombia; 3Clinical Research Group. Escuela de Medicina y Ciencias de la Salud, Universidad del Rosario, Bogotá, Colombia; 4Horus Grupo Oftalmológico, Bogotá, Colombia
Correspondence: Alejandra de-la-Torre
NeURos Research Group, Escuela de Medicina y Ciencias de la Salud, Universidad del Rosario, Carrera 24 # 63C 69, Bogotá, Colombia
Tel +57 1 2970200 ext. 3320
Email [email protected]
Purpose: To describe ocular surface characteristics and tests’ results in a healthy pediatric population.
Methods: We performed a cross-sectional study with 60 healthy children, obtaining consent, OSDI and screen use survey and conducting ocular surface tests. Statistical univariate analysis for categorical and quantitative variables was made. To describe the correlation of the results in both eyes, we used a model of random effects. To characterize the possible profiles of device use, we applied the mixed-cluster methodology.
Results: Sixty healthy children between 7 and 17 years old were evaluated. Girl’s proportion was 41.6%. Mean Ocular Surface Disease Index Score was 9.98± 8.49 points. Daily screen time was 5.59± 2.77 hours and the most popular screen was the smartphone. Mean results (with standard deviations or confidence intervals) of ocular surface tests were blink frequency while reading on paper, 6.8± 5.68 times per minute; blink frequency while reading on screen, 8.7± 7.14 times per minute; tear meniscus height, 0.19[0.18– 0.2] mm; non-invasive tear break-up time, 12.44[10.99– 13.9] seconds; nasal conjunctival redness, 0.86[0.77– 0.94]; temporal conjunctival redness, 0.96[0.87– 1.04]; tear osmolarity, 299.3[295.14– 303.45] mmol; and Schirmer test, 23.73[21.28– 26.18] mm. Lid margin was irregular in three eyes; 44.7% had thin lipid layer; lissamine green staining was positive in 70.8%; fluorescein staining was positive in 47.4%; 36.64% exhibited partial meibomian gland loss.
Conclusion: Considering the scarcity of specific pediatric values of ocular surface tests, we performed a clinical investigation involving the complete pool of ocular surface tests in children. Although healthy children were included in this study, we found that all the participants had at least one abnormal result and 33.33% had dry eye disease diagnosis, according to the TFOS DEWS II. It would be relevant to carry out further multicentric studies to compare our ocular surface tests’ results with other groups of children.
Keywords: adolescent, children, dry eye syndrome, ocular surface tests
Plain Language Summary
Tear film has an important role in the ocular surface. It provides the anterior part of the eye with refractive and antimicrobial functions. Multiple factors, such as pollution, use of screens, inadequate blink, and ocular and systemic diseases, can affect it. In this order, the Tear Film and Ocular Surface Society (TFOS) defined standard values for evaluating tear film and ocular surface. The values have been concentrated only in adults. No standard pediatric values were established, thus there is a paucity of data regarding ocular surface tests in children.
Our purpose was to describe ocular surface characteristics and tests’ results in healthy children. We performed a cross-sectional study with 60 healthy children, who completed a symptom questionnaire and eleven ocular surface tests. Unexpectedly, we observed 100% of the children had alteration in at least one test, compared with normal adult values. Additionally, there was a prevalence of 33.33% of dry eye disease, which was higher than the prevalence reported in previous studies performed also in healthy children but using a smaller number of tests.
It is crucial to carry out further multicentric studies involving different pediatric populations to standardize the normal values of the ocular surface tests in healthy children. It is also critical to determine if these tests can be commonly altered in healthy children from different groups and what could be the factors influencing these results. This study provides basis to compare ocular surface tests’ results with other groups of children.
Introduction
Maintenance of the tear film (TF) is a complex process that involves various ocular structures (eg, meibomian glands, lacrimal glands, tear ducts, eyelids, cornea, and conjunctiva). The TF has important refractive and antimicrobial functions and plays a primary role in the trophic support of epithelial cells in the cornea and conjunctiva.1 The TF can be affected by multiple factors such as pollution, use of smartphones and other screens, inadequate blink, ocular and systemic diseases, among others. Alterations in ocular surface can be reflected in clinical manifestations that correspond to dry eye symptoms.2
In 2017, the Tear Film and Ocular Surface Society (TFOS) published the Dry Eye Workshop (DEWS) II Diagnostic Methodology report, which identified the most appropriate order and technique for diagnosis and monitoring of dry eye disease (DED); it also provided guidelines for establishing differential diagnosis.3 This report offered a mechanism for recognizing DED in the adult population. It did not include specific considerations for the pediatric population, in which DED has been described as a rapidly growing problem.4
The lack of investigation and consensus regarding normal TF function parameters and ocular surface characteristics in children has created a gap in the early diagnosis of DED in this population. Moreover, DED studies in children generally use the TFOS DEWS criteria for adults and subjective symptoms are difficult to evaluate in pediatric patients.5,6 It is important to characterize ocular surface tests in pediatric population because of the reportedly high prevalence rates of DED in younger individuals and in schoolchildren.4 In addition, various pediatric conditions (eg, congenital disorders and autoimmune/inflammatory diseases) have been associated with DED.7
Overall, there is a paucity of data regarding DED in children; to the best of our knowledge, no such studies have been conducted in Latin America. The purpose of the current study was to describe ocular surface characteristics and ocular surface tests’ results in a healthy pediatric population.
Materials and Methods
Design
This observational descriptive noncomparative cross-sectional ocular surface function study was conducted in a healthy pediatric population from three schools in Bogotá, Colombia.
Selection Criteria
Healthy children between 7 and 17 years of age were included. Exclusion criteria consisted of previous diagnosis of dry eye, lagophthalmos, any eyelid disorders (eg, blepharitis, keratosis, trauma history, hordeolum), autoimmune diseases, thyroid disease; history of ocular trauma, allergic diseases; treatment with isotretinoin, antihistamines, antidepressants, steroids, attention deficit and hyperactive disorder medications, oral contraceptives, and other drugs; low weight, malnutrition; and use of contact lenses.
Study Population
As this was a preliminary study, a convenience sample was established, with similar proportions for age and sex. To recruit our sample, we invited 250 children from 3 schools in Bogotá, Colombia and their parents to an informative meeting about ocular surface in children. After reviewing selection criteria compliance (first filter), interested parents and children were included in a data base. A total of 85 children were recruited in this first phase. A second filter was applied through parent phone interviews in order to reassure inclusion-exclusion criteria. After the second filter, a total of 63 children were included. A final filter was applied through a personal interview at Horus Centro Oftalmológico, before the ocular surface tests were performed. A final sample of 60 children was obtained.
Data Collection
Evaluations were performed by two trained optometrists in Horus Grupo Oftalmológico eye clinic from August 2019 to September 2019. They were supervised by three specialized ophthalmologists, who are as well, authors of this paper. On first instance, written informed consent, demographic data (age, sex, school grade and birth region), Ocular Surface Disease Index Score (OSDI), and a short screen use survey were collected by the authors from each participant. Then, ocular surface tests were performed, including evaluation of the lid margin, blink frequency measurement (while reading on paper and reading on-screen), lacrimal meniscus measurement, non-invasive tear break-up time (NITBUT) mapping and analysis, lipid layer thickness evaluation, conjunctival redness measurement, lacrimal osmolarity measurement, four-eyelid meibography, and vital staining of conjunctival and corneal epithelium (using fluorescein and lissamine green). All tests were performed in a temperature-and-humidity-controlled setting by two trained optometrists based on the TFOS DEWS II Diagnostic Methodology report3 and the Oculus Keratograph workshop 2016.8 Additional information regarding ocular surface tests techniques used is available in Annex 1. Equipment used included Oculus Keratograph 5M, Topcon anterior segment camera DS3, and Tear Lab Osmolarity System. Interviews, data collection and tests results were recorded by the authors in a Microsoft Excel (Microsoft Corp., Redmond, WA, USA) database.
Statistical Analysis
In this study both eyes of each subject were evaluated, therefore a hierarchical structure is present. The first level of this hierarchy is the eye which is nested in the second level: the subject. This nested structure implies correlation of measures between eyes of the same subject, which should be taken into account for the analysis.9
For subject-level characteristics (gender, age, etc.), relative and absolute frequencies are reported in the case of categorical variables, whereas for quantitative variables mean and standard deviations are reported if normality of the distribution is verified (by means of Shapiro–Wilk test), otherwise median and interquartile range are provided.
For eye-level characteristics, a different approach was used to report descriptive statistics. Means and proportions were estimated using a random effects model, which takes into account the correlation of both eyes inside subjects.10 Supplementary material is provided for details about the specification of these models in Annex 2. Using these models, we can obtain estimations of means and proportions with their correspondingly 95% confidence intervals along with estimation of the intraclass correlation coefficient,11 an index that, for this case, can be considered as the effective correlation of the measures between eyes of a given subject.
In order to characterize the use of different electronic devices by the children in this study, we used the mixed-cluster methodology proposed by Lebart et al (1995). In short, we were searching for groups of children with similar times of exposure to different devices (smartphones, television, tablets, computers, other devices, and overall time of screen exposure). Since these characteristics are present at the subject-level, there is no need to account for any correlation between measures, and the classical cluster methods can be applied freely. From this analysis, we obtained groups of patients that represent different profiles of device use.
Finally, in order to assess possible relations of the previously obtained profiles of device use with subject-level and eye-level characteristics, the following strategy was used: for subject-level quantitative characteristics, the statistical associations with profiles of device use were evaluated by means of a linear model with heterogenous variance.12 In short, this model assesses differences of the mean quantitative characteristic of all profiles against one selected as reference. From this model, we reported mean differences as effect measure. This model is very similar to the traditional ANOVA model; however, the assumption of homoscedasticity is no longer required since different variances are allowed per group. In the case of categorical characteristics, the statistical associations with profiles of device use were evaluated by means of chi-square test of independence. In this case, conditional proportions are the effect measure presented for each profile of device use.
To assess relations of eye-level characteristics with the profiles of device use, generalized linear mixed models were used.10 These models are very similar to the random effects models presented previously, however a set of fixed terms are included now to account for differences due to profiles of device use. See supplementary material (Annex 2) for details about the specification of these models. From these, we obtained mean differences of all profiles against one selected as reference for quantitative eye-level characteristics and odds ratios for dichotomic qualitative eye-level characteristics, along with their correspondingly 95% confidence intervals. For these generalized linear mixed models, p-values for significance of terms related to profiles of device use were derived using the likelihood ratio test.
All these analyses are exploratory, due to the nature of the study design and the results cannot be extrapolated to any population. Significance level for all test was set to 5%. All statistical analyses were done using R software version 4.0.2.13 Generalized linear mixed models were fitted using lme4 R package.14 Linear models with heterogenous variance were fitted using R package nlme.14 Intraclass correlation coefficient for generalized mixed models were calculated following Nakagawa et al 2017, implemented in R package performance.15
Results
We evaluated 60 healthy children between 7 and 17 years of age (mean age, 12 years). The proportions of girls and emmetropes were 41.6% and 51.6%, respectively. Eighty-five percent of the participants were born in the Andes Regions and all the participants lived in the urban area of Bogotá. The average OSDI result was 9.98 ± 8.51 points. Additional demographic data information is shown in Table 1.
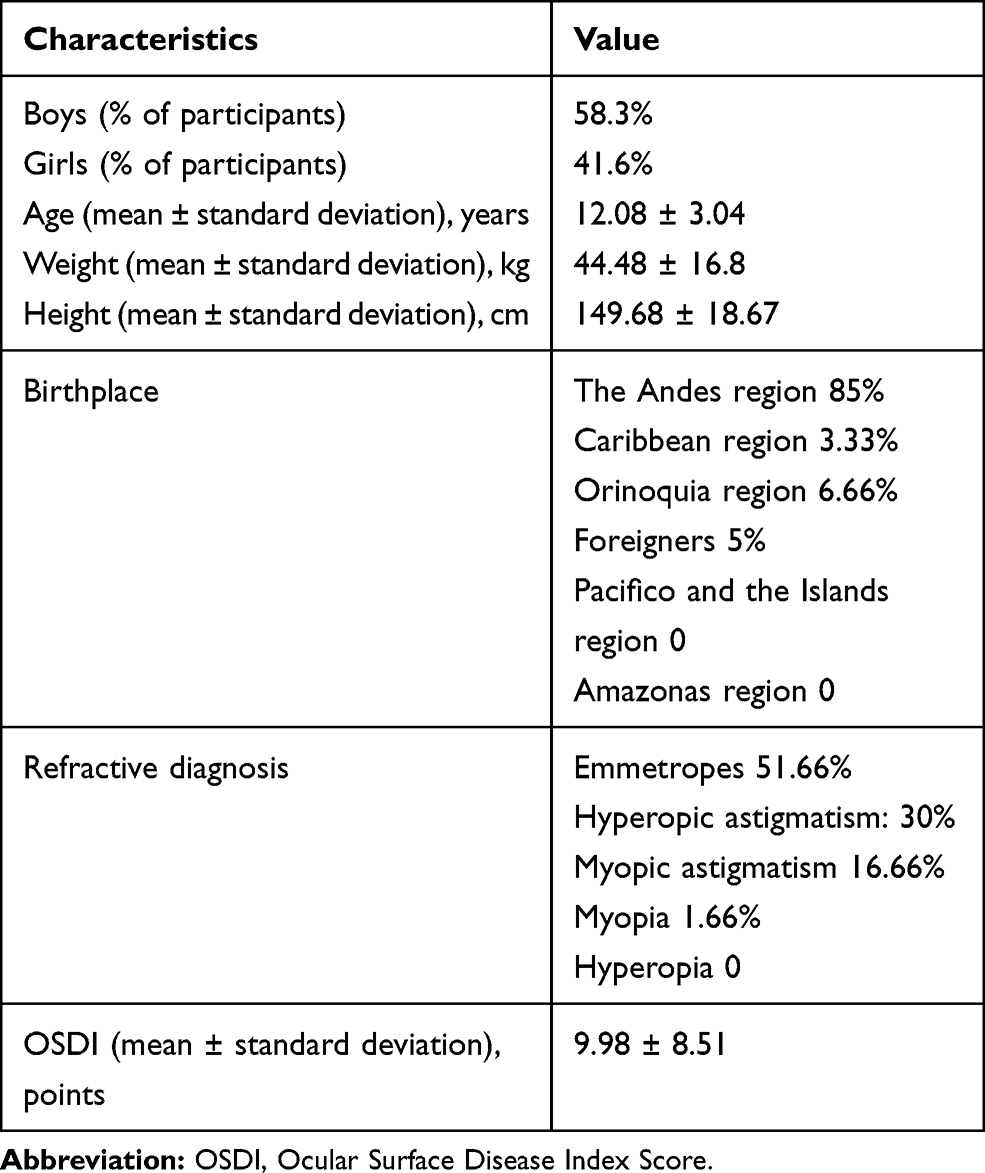 |
Table 1 Demographic Characteristics of the Participants |
Interviews revealed that daily screen time use was approximately 5.59 ± 2.77 hours; smartphones were the most popular type of screen, followed by television, computer, tablet, and other screens. More detailed information regarding screen use is shown in Table 2.
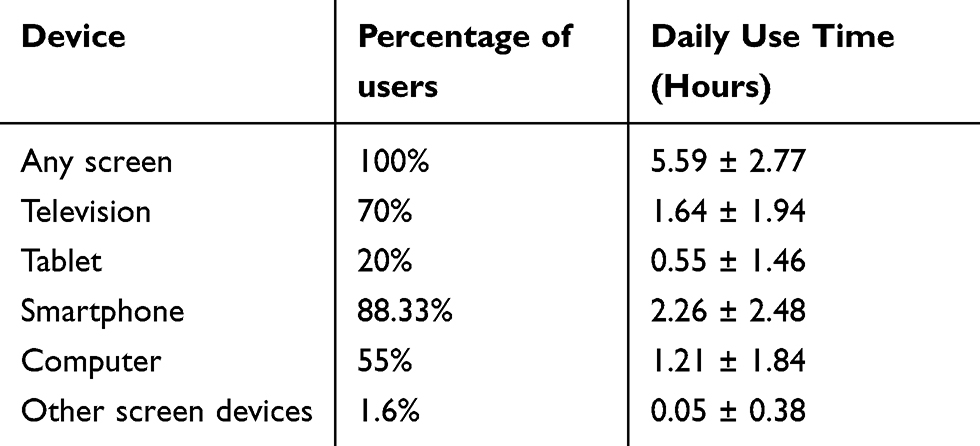 |
Table 2 Device Profiles |
The mean results of the ocular surface tests are shown in Table 3 and Figure 1-6, compared with adult normal values established by TFOS DEWS criteria.
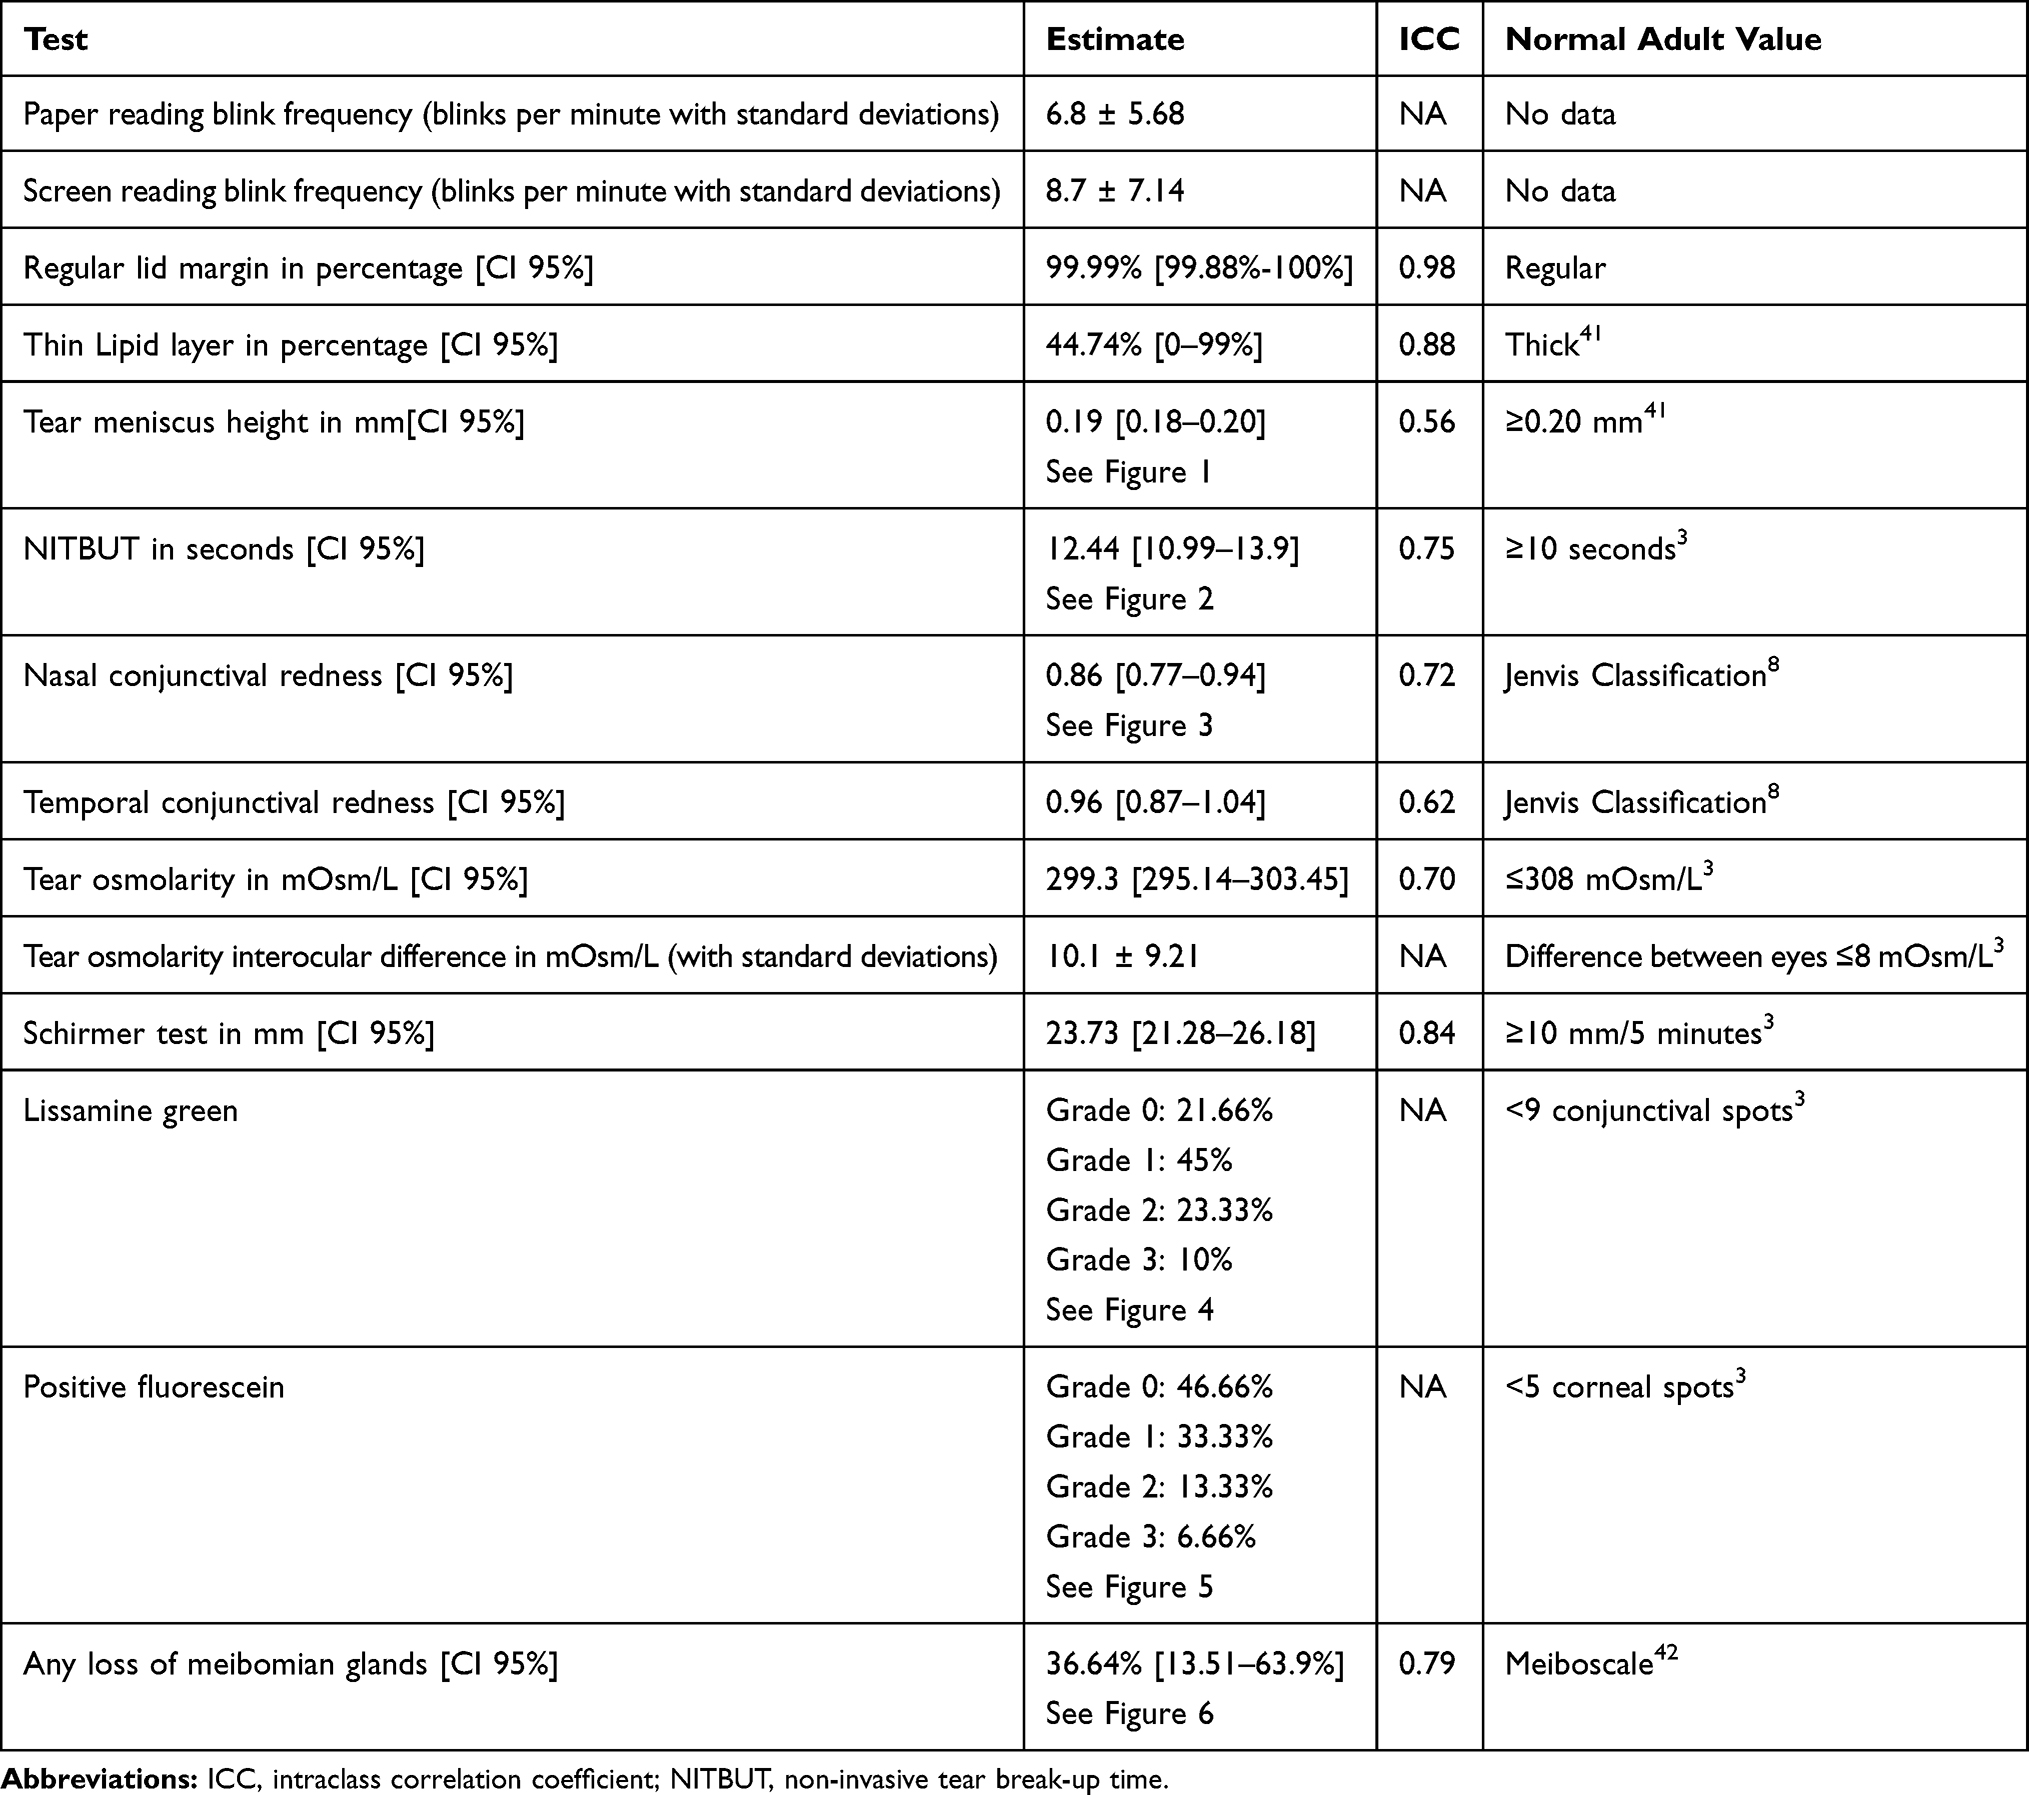 |
Table 3 Tear Function Test Results |
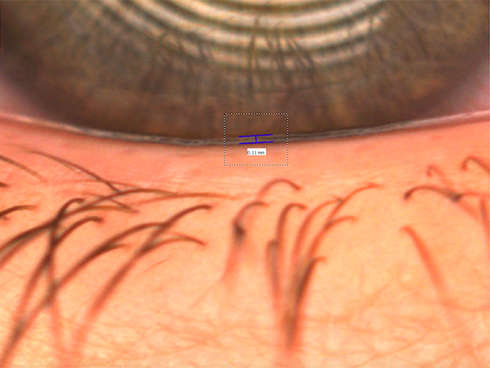 |
Figure 1 Tear meniscus height of 0.11 mm in a study participant. |
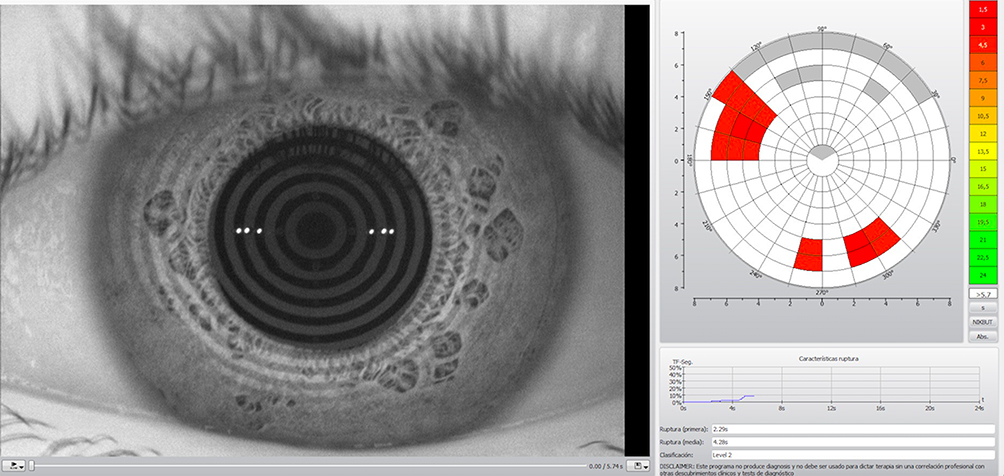 |
Figure 2 NITBUT of 4.28 seconds in a study participant. |
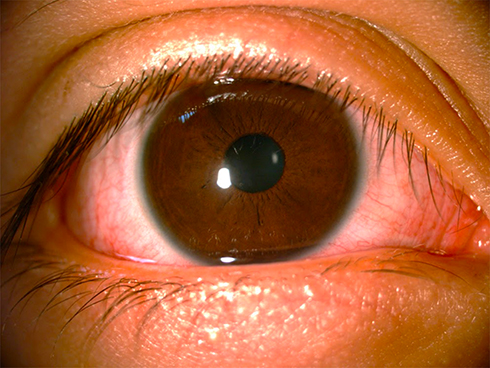 |
Figure 3 Nasal and conjunctival redness in a study participant. |
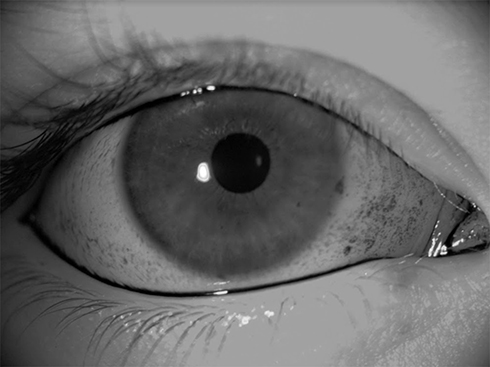 |
Figure 4 Oxford 3 lissamine green staining in a study participant. |
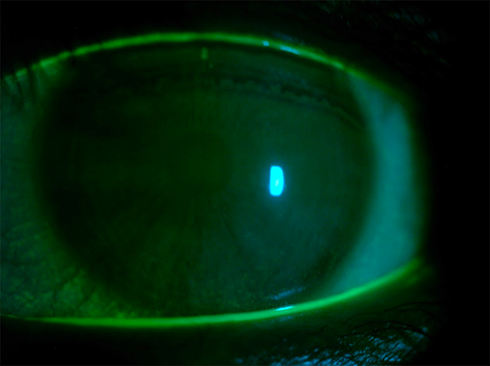 |
Figure 5 Oxford 3 fluorescein staining in a study participant. |
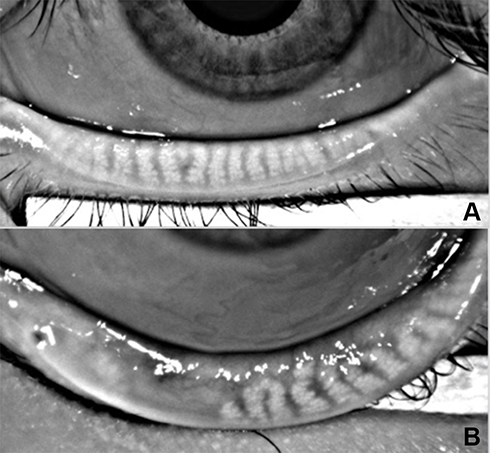 |
Figure 6 FIGURE 6A: 0% meibomian gland loss in a study participant. FIGURE 6B: 50%–75% meibomian gland loss in a study participant. |
In cluster analysis, we identified three device user groups: 1) participants with a principal preference for television; 2) participants with a preference for smartphones and computers; and 3) participants with a preference for tablets. Among these groups, age differences are notable, the younger children were distributed in group 3 and the oldest in group 2. The profiles and ocular surface tests of the three groups are shown in Table 4.
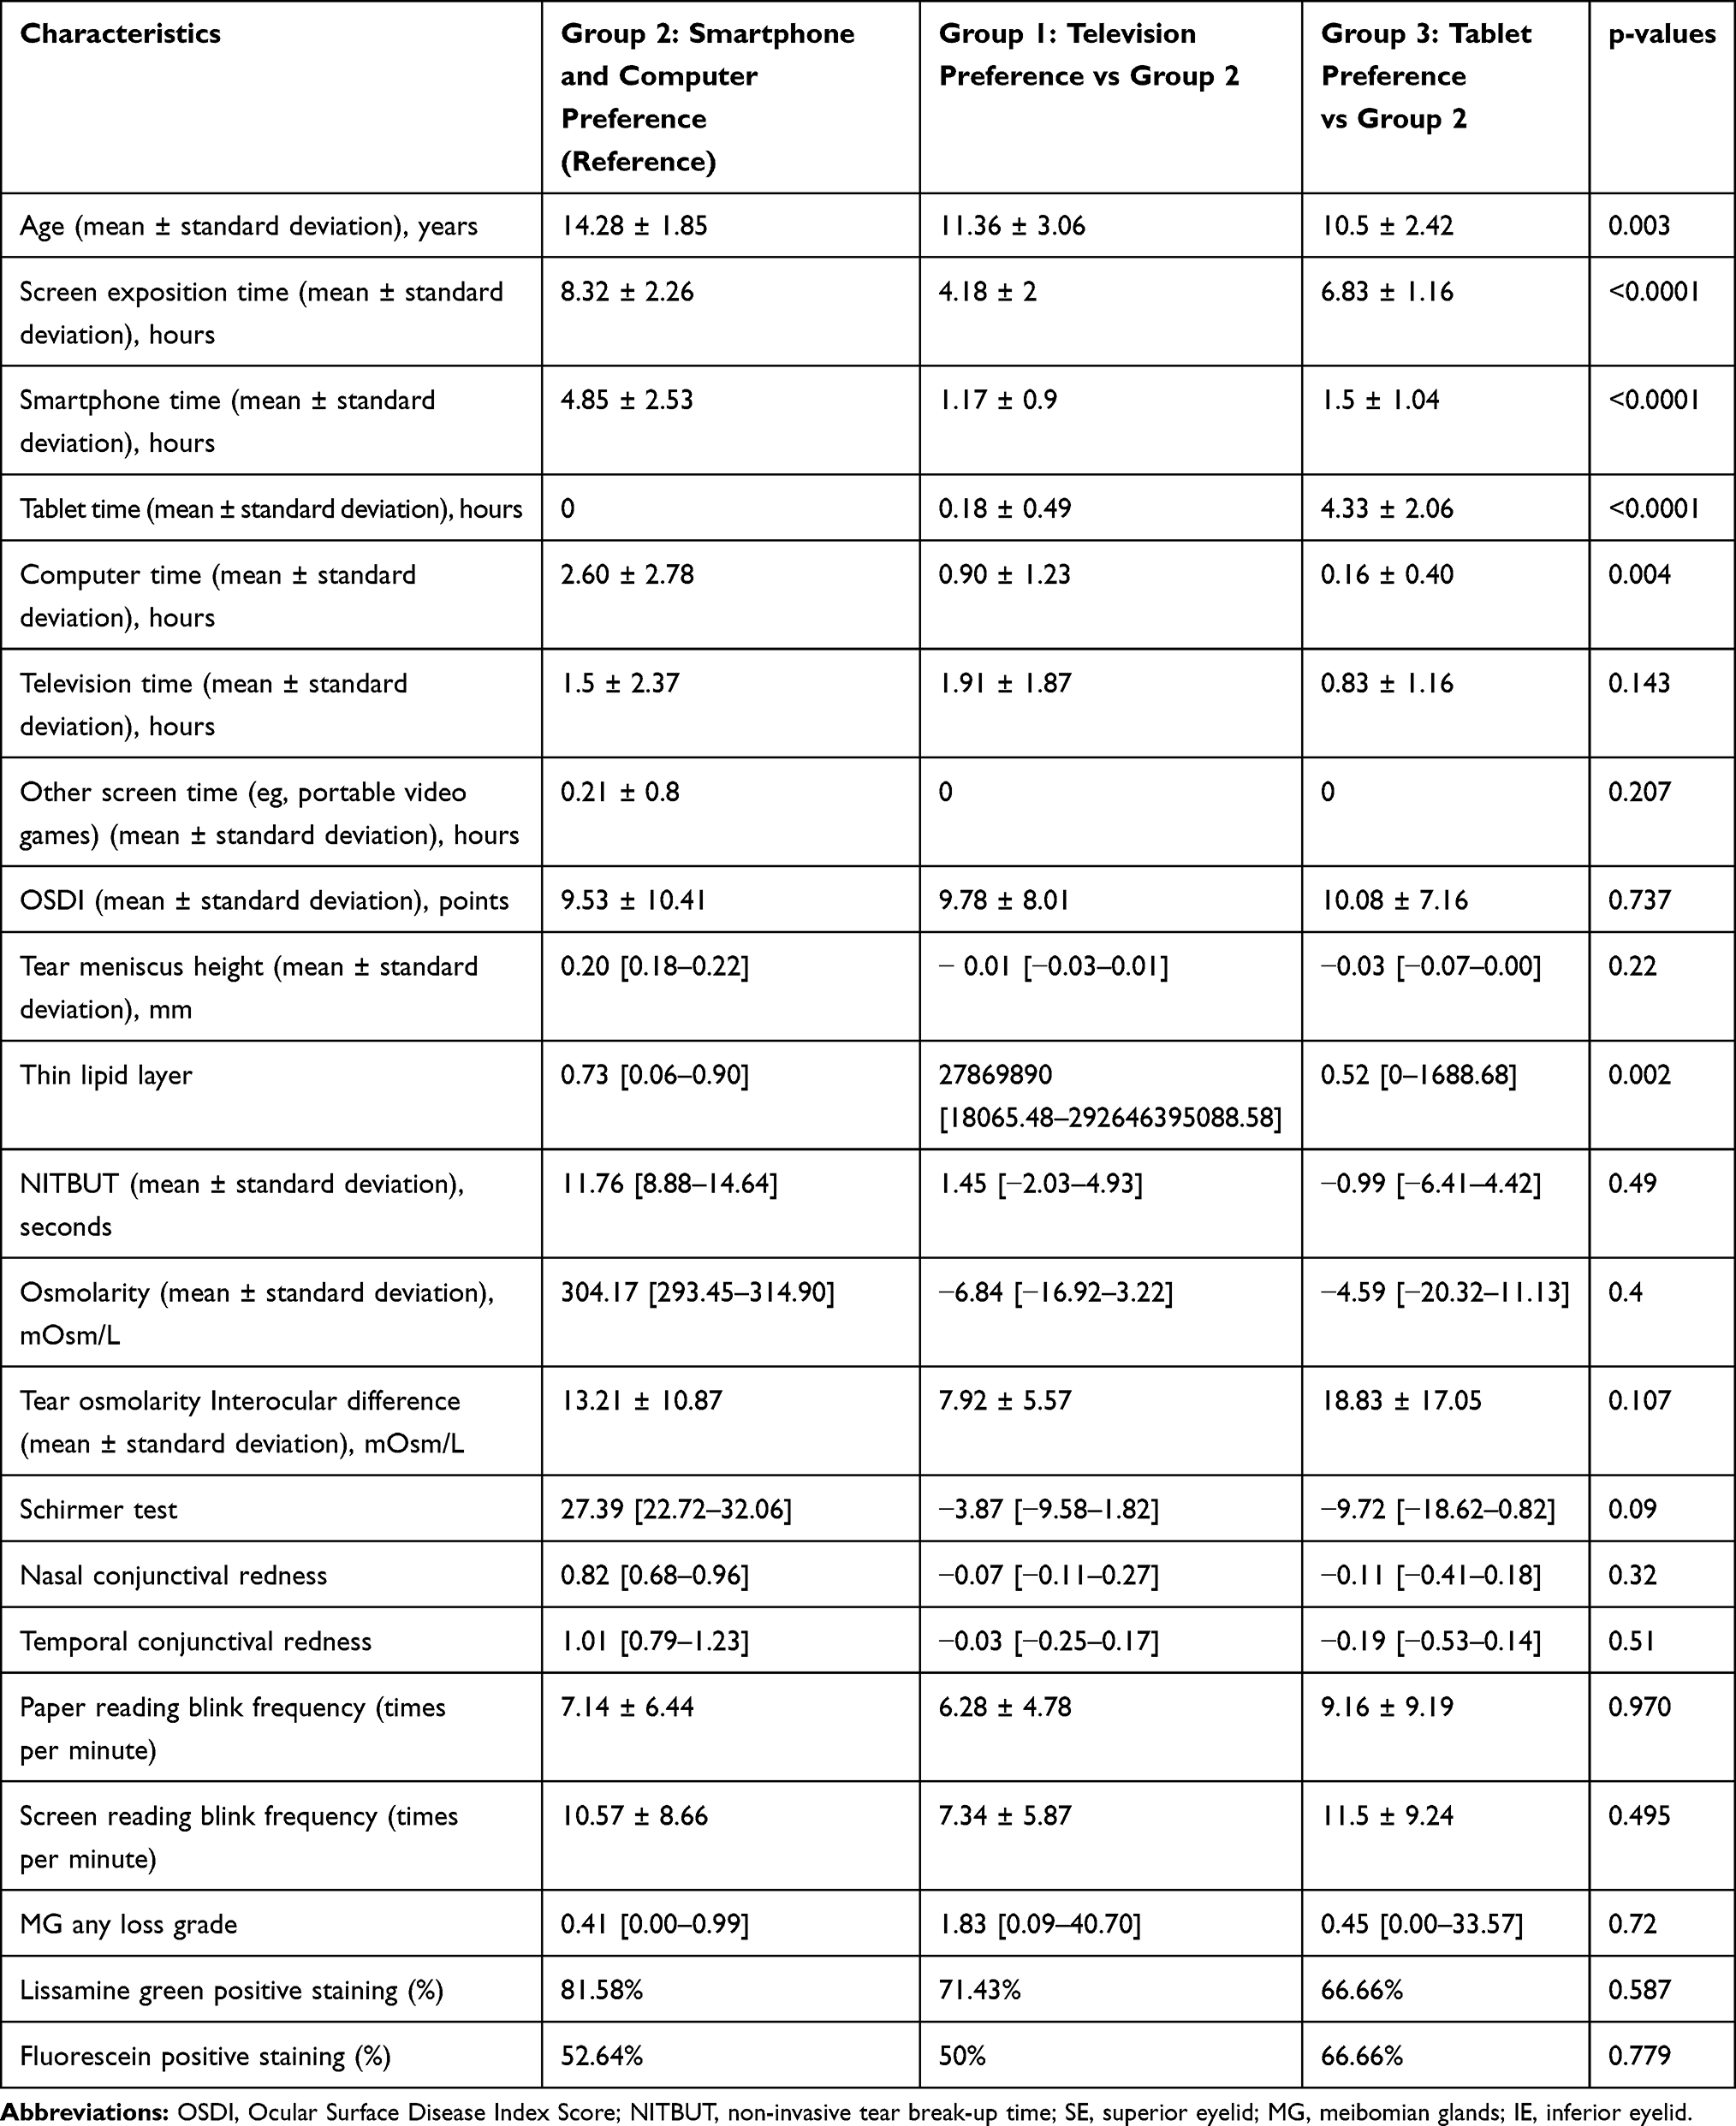 |
Table 4 Profiles of Cluster Groups |
For diagnosis of DED in our study population, we used the TFOS DEWS II diagnostic criteria for adults (OSDI >13 points plus one or more of the following: break-up time <10 seconds, tear osmolarity ≥308 mOsm/L in either eye or interocular difference >8 mOsm/L, >5 corneal spots, >9 conjunctival spots),3 due to lack of criteria for children (Table 5).
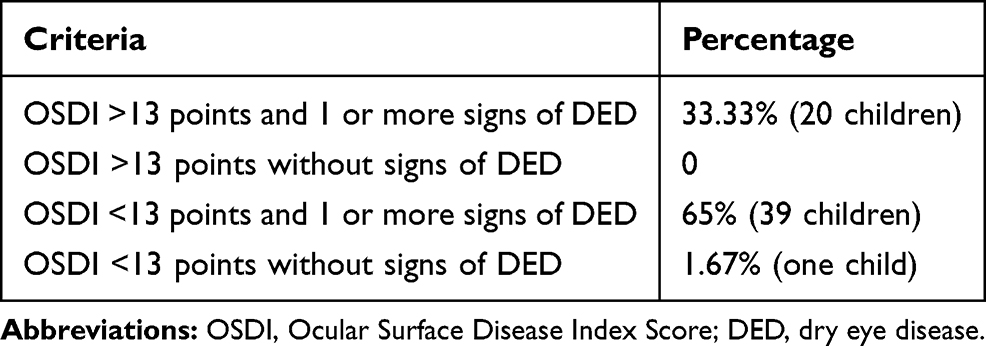 |
Table 5 Diagnosis of DED Using TFO DEWS II Criteria |
Notably, 100% of the children in this study exhibited abnormal results in at least one of the eleven ocular surface tests performed, compared with normal adult values. We did not find any statistically significant association between the use of electronic devices and the results of any ocular surface tests.
Discussion
There is a paucity of data related to the values of ocular surface tests in the pediatric population; thus, existing studies have compared pediatric values to normal adult values. A meta-analysis by Chidi-Egboka et al16 mentioned further studies are needed to determine the effect of variables such as ethnicity, age, sex, and risk factors on the ocular surface tests results in children. It is important to standardize normal pediatric ocular surface tests values as it will help to recognize, prevent and treat opportunely ocular surface diseases in this population.
In our study, we found that 100% of our participants used screen devices. In contrast, Moon et al6,17 described a rate of screen use of 50% to 55.4% in healthy children and 71% to 96.7% in children with DED. Computer and TV times were comparable to the ones found in our study, but smartphone time was lesser than ours in Moon et al6,17 sample (0.93 ± 1.01 daily hours). In a study by Olds et al18 a mean daily screen time of 3.83 hours was reported, which is also lesser than our results. According to these studies, it seems that our population is more exposed to screens than other children. This could be attributed to an increase in digital education system during the last few years, as the previous reports were published 4, 6 and 14 years ago, respectively. The current time of smartphone use in children according to different cultures is not well known, but it is known to be increasing around the world.
When comparing our ocular surface tests results to regular adult values, we found lid margin, tear meniscus height, NITBUT, temporal conjunctival redness, nasal conjunctival redness, osmolarity and Schirmer mean values in our population were normal. This does not mean that these values were not altered in any children, but that the mean value did not show alteration. This could be evidenced in the ranges showed in Table 3.
Contrarily, abnormal values when comparing to regular adult values were found in lipid layer thickness, osmolarity interocular difference, lissamine green, fluorescein, and meibography. No comparable standard adult values have been proposed for blink frequency while reading on screen and blink frequency while reading on paper.
Almost half the participants of this study had thin lipid layer. It was measured by interferometry but with the limitation that the device used gave a subjective classification of the thickness; thin or thick. Chidi-Egboka et al16 mentioned that lipid layer thickness was reported in arbitrary values among the studies they reviewed; moreover, lipid layer thicknesses were not comparable with reported values in healthy adults.
To the best of our knowledge, the study by Tone et al19 is the only prior study that evaluated the interocular difference value. They reported a difference of 8.2 ± 6.6 mOsm/L between eyes, whereas our mean value for this measurement was 10.1 ± 9.21 mOsm/L. We found a wide spectrum, ranging from 0 to 45 mOsm/L, this is why our standard deviation is wide.
Villani et al20 study showed that the mean grade of lissamine green was 0.19 ± 0.46, which indicated that the majority of participants had negative conjunctival staining, whereas our population exhibited a greater percentage of positive conjunctival lissamine green staining (78.34%). As we obtained a great positive lissamine green value, it was important to take into account the test’s predictive values. Alves et al21 performed a study comparing dry eye diagnostic tests, finding that the most sensitive (S) and specific (E) test was OSDI (S 84.2% - E 100%) while the least accurate was lissamine green staining (S 83.2–100% - E 18.2–34.2%). Therefore, we performed a 2x2 table comparing OSDI and lissamine green as diagnostic tests for dry eye. This analysis showed that 30% of the sample where true positives for dry eye disease by means of lissamine green results. Although, it is important to note that most of the children who presented positive lissamine green staining had another DED sign (except 2 children).
More than half of the participants had positive fluorescein corneal staining. In contrast, Villani et al20 previously reported a mean fluorescein grade of 0.03 ± 0.17, which indicated that the majority of the participants had negative corneal staining. Similarly, Tone et al22 found a mean of 0.2 ± 10.4 of corneal staining, being 20% of their healthy patients positive for corneal staining. These results demonstrated that our population had a higher grade of corneal staining than normal adult values, as well as other healthy children.
In our study, we found that more than one-third of the participants had at least some grade of meibomian gland loss. Nevertheless, it is important to take into account that Grade 1 in the Meiboscale could be attributed to a physiological gland loss.23 Therefore, if we take grades 2 to 4, 20% of our population would be positive for significant meibomian gland loss. Similarly, Gunay et al24 found that nearly 16.54% of the healthy children had some grade of meibomian gland loss. Villani et al20 found that meibomian gland dropout, by Meiboscore, was 0.24 ± 0.03. When these two studies are compared with our results, our population exhibits greater meibomian gland loss. Contrarily, Gupta et al25 reported meibomian gland atrophy in 42% of their healthy participants and meibomian gland tortuosity in 37%; the majority of participants exhibited mild atrophy. More recently, another study in 2019 performed by Dereli Can et al26 demonstrated 57% prevalence of meibomian gland atrophy in 43 healthy children. These results are greater than the ones reported in our study.
Blink frequency is an indirect measurement for ocular surface problems, specially DED. TFOS DEWS II3 established that blinking spacing leads to drying areas evidenced in tear film disorders. Thus, it is important to observe this measure in order to assess the need of performing other ocular surface tests. In the same way, some studies have demonstrated that reading conditions or close visual tasks may decrease spontaneous eyeblink rate, which ranges from 10 to 15 blinks/min.3,27,28 Accordingly, blink frequency while reading on paper and screen rates were reduced compared to spontaneous blink rate in our study. Although blink frequencies while reading have been studied, no normal values for these measurements have been established in adults, nor children. Argilés et al,27 reported a mean spontaneous blink rate of 15.5 blinks/min, a mean blink frequency while reading on paper of 4 blinks/min, and mean blink frequency while reading on screen of 6 blinks/min. Koslowe et al,29 reported a blink frequency while reading on screen of 17.15 blinks/min and blink frequency while reading on paper of 15.42 blinks/minute. Abusharha et al28 found a blink frequency while reading a book of 11.35 ± 10.20 blinks/min and a blink frequency while reading on screen of 14.93 ± 10.90 blinks/min. All these study results coincide with our results, taking into account blink frequency while reading on screen was always greater than blink frequency while reading on paper. This might be attributed to a poorer image quality in screen devices30 or differences in gaze angles during screen versus paper reading.31
We found that age was statistically related with screen-use profiles. The younger children had tablet preference, while the oldest preferred smartphones and computers (p = 0.003). Considering we used a non-probabilistic sample size; no statistical associations were found between screen-use profiles and differences among ocular surface tests. Further studies with a probabilistic sample size calculation may show a more accurate relation between screen-use and ocular surface tests alterations.
One-third of the population in our study had DED diagnosis based on the TFOS DEWS II criteria.3 This DED prevalence was higher than the prevalence reported in previous studies. Uchino et al4 described DED prevalence of 4.3% in boys and 8% in girls aged between 15 and 18 years in a study of 3.433 Japanese high school students. They used the Schaumberg questionnaire as a diagnostic tool. However, no clinical evaluations were performed in these individuals. Moon et al17 found that 6.6% of children from eight primary schools in Korea met the criteria for diagnosis of DED. In that study, prevalence was higher in the urban group (8.3%) than in the rural group (2.8%); it was also higher in upper grades (9.1% in grades 4 to 6) than in lower grades (4% in grades 1 to 3). Nevertheless, it is important to note that this study used the International Dry Eye Workshop guidelines, not the TFOS DEWS II. Interestingly, Kim et al32 reported a DED prevalence of nearly 20% in Asian children and a DED prevalence of less than 10% in Caucasian children.
Because we assessed normal pediatric population in Bogotá, it is essential to consider that this group is exposed to environmental factors (eg, pollution, ultraviolet radiation, and high altitude), which could affect the ocular surface.33 These environmental factors,7,34 the use of screen devices6,7,17 and lid disorders7 could lead to excessive air exposition, reduced blink frequency, eye closing alterations, and tear film instability, among others. All these have been closely related with evaporative dry eye disease. Thus, we propose this as the probable etiology of DED in one-third of our population.
Limitations
Several questionnaires and scales, such as OSDI, Symptoms Assessment in Dry Eye (SANDE), 5-item Dry Eye Questionnaire (DEQ-5), McMonnies Dry Eye Questionnaire, Visual Analogue Scale (VAS) for self-assessment of ocular discomfort, and Standard Patient Evaluation of Eye Dryness (SPEED) have been validated in adults for evaluating DED symptoms.35–37 However, as mentioned before, normal tear test values have not been validated in children, nor have normal OSDI test values. Nevertheless, we decided to use this questionnaire in our pediatric population as it has proven to possess a superior discriminative ability and has been recommended in adults by the TFOS DEWS II.27,29 Additionally, OSDI evaluates diverse symptoms and their duration in a more objective way.21
Although this questionnaire was performed by the children, their parents sometimes helped them to read the test and answer it sufficiently. Accordingly, we cannot rule out the possibility that the children’s results may have been influenced by assistance from their parents.
Among TFOS DEWS II tests we decided to use a wide pool of ocular surface tests, leaving some aside. Conjunctival lid margin staining was one of them, but it is important to take into account it is generally used when there are dry eye symptoms and the other diagnostic tests are negative, as it is an early finding. In our study, all children who had OSDI ≥ 13 had at least one criterion for making the diagnosis of dry eye, according to the TFOS DEWS II criteria.3 None of the children had OSDI ≥ 13 without any positive finding. Thus, including this test would have not changed our results. In the same way, positive results of this test have been reported to be more related with contact lenses use,39,40 which none of our participants used.
Although this study was performed with a non-probabilistic convenience sample size, osmolarity interocular difference showed a negative tendency with a wide standard deviation, which is a limitation. Further studies with probabilistic sample size calculations may show reduction in the results range.
Conclusion
Taking into account scarcity of specific pediatric values of ocular surface tests, we performed a clinical investigation involving a selected pool of ocular surface tests in children. It is important to standardize normal pediatric ocular surface tests values as it will help to recognize, prevent and treat opportunely ocular surface diseases in this population.
Although healthy asymptomatic children were included in this study, we found that all participants exhibited abnormal values in at least one ocular surface tests. In addition, a diagnosis of DED could be established in at least 33.3% of the population, when using the TFOS DEWS criteria for adults. We presume these findings could be related to environmental factors.33 No statistical associations were found between screen use and test results. This study provides a basis for further investigation on the prevalence of abnormal ocular surface tests in healthy pediatric population and possible associated factors. It would be relevant to carry out further multicentric studies to compare our ocular surface tests’ results with other groups of children.
Abbreviations
OSDI, Ocular Surface Disease Index Score; NITBUT, Non-invasive tear film break-up time; TF, Tear film; TFOS, Tear Film and Ocular Surface Society; DEWS, Dry Eye Workshop; DED, Dry eye disease.
Data Sharing Statement
The datasets used and/or analyzed during the current study are available by the corresponding author on reasonable request.
Ethics Approval and Informed Consent
The protocol was approved by the Universidad del Rosario ethics committee. It was classified as an investigation with minimum risk because used data recorded through common procedures (eg, ophthalmological physical examination and ocular surface evaluation). Both informed consent and assent were obtained from the participants’ parents and participants, respectively.
Acknowledgments
We thank Mr. Julian Triviño, OD and Mrs. Ángela Barrantes, OD from Horus Grupo Oftalmológico for aiding in the collection of ocular surface tests data. We thank Universidad del Rosario for helping us in the manuscript style correction. We thank Ryan Chastain-Gross, Ph.D., from Edanz Group (https://en-author-services.edanzgroup.com) for editing a draft of this manuscript.
Author Contributions
All authors made a significant contribution to the work reported, whether that is in the conception, study design, execution, acquisition of data, analysis and interpretation, or in all these areas; took part in drafting, revising or critically reviewing the article; gave final approval of the version to be published; have agreed on the journal to which the article has been submitted; and agree to be accountable for all aspects of the work.
Funding
This work was supported by the Universidad del Rosario.
Disclosure
The authors declare that they have no competing interests.
References
1. Willcox MDP, Argüeso P, Georgiev GA, et al. TFOS DEWS II Tear Film Report. Ocul Surf. 2017;15(3):366–403. doi:doi:10.1016/j.jtos.2017.03.006
2. The definition and classification of dry eye disease: report of the Definition and Classification Subcommittee of the International Dry Eye WorkShop (2007). Ocul Surf. 2007;5(2):75–92. doi:doi:10.1016/s1542-0124(12)70081-2
3. Wolffsohn JS, Arita R, Chalmers R, et al. TFOS DEWS II diagnostic methodology report. Ocul Surf. 2017;15(3):539–574. doi:doi:10.1016/j.jtos.2017.05.001
4. Uchino M, Dogru M, Uchino Y, et al. Japan Ministry of Health study on prevalence of dry eye disease among Japanese high school students. Am J Ophthalmol. 2008;146(6):925–929. doi:10.1016/j.ajo.2008.06.030
5. Craig JP, Nichols KK, Akpek EK, et al. TFOS DEWS II definition and classification report. Ocul Surf. 2017;15(3):276–283. doi:doi:10.1016/j.jtos.2017.05.008
6. Moon JH, Lee MY, Moon NJ. Association between video display terminal use and dry eye disease in school children. J Pediatr Ophthalmol Strabismus. 2014;51(2):87–92. doi:doi:10.3928/01913913-20140128-01
7. Alves M, Dias AC, Rocha EM. Dry eye in childhood: epidemiological and clinical aspects. Ocul Surf. 2008;6(1):44–51. doi:doi:10.1016/s1542-0124(12)70104-0
8. O‘Flaherty C OCULUS Keratograph® Workshop WAEPS 2016. Oral presentation presented at the: WAEPS 2016 Workshop; March 16, 2016; United States. Available from: https://pdfs.semanticscholar.org/db89/03cc34d8ffc62a70d65cb46cf60513bf71e3.pdf.
9. Armstrong RA. Statistical guidelines for the analysis of data obtained from one or both eyes. Ophthalmic Physiol Opt. 2013;33(1):7–14. doi:doi:10.1111/opo.12009
10. Generalized, Linear, and Mixed Models.
11. The coefficient of determination R2 and intra-class correlation coefficient from generalized linear mixed-effects models revisited and expanded - PubMed. Available from: https://pubmed.ncbi.nlm.nih.gov/28904005/.
12. Linear Mixed-Effects Models Using R | springerprofessional.de. Available from: https://www.springerprofessional.de/linear-mixed-effects-models-using-r/1845732.
13. R: the R Project for Statistical Computing. Available from: https://www.r-project.org/.
14. Bates D, Mächler M, Bolker B, Walker S. Fitting Linear Mixed-Effects Models Using lme4. J Stat Softw. 2015;67(1):1–48. doi:doi:10.18637/jss.v067.i01
15. Assessment of Regression Models Performance. Available from: https://easystats.github.io/performance/.
16. Chidi-Egboka NC, Briggs NE, Jalbert I, Golebiowski B. The ocular surface in children: a review of current knowledge and meta-analysis of tear film stability and tear secretion in children. Ocul Surf. 2019;17(1):28–39. doi:doi:10.1016/j.jtos.2018.09.006
17. Moon JH, Kim KW, Moon NJ. Smartphone use is a risk factor for pediatric dry eye disease according to region and age: a case control study. BMC Ophthalmol. 2016;16(1):188. doi:doi:10.1186/s12886-016-0364-4
18. Olds T, Ridley K, Dollman J. Screenieboppers and extreme screenies: the place of screen time in the time budgets of 10–13 year-old Australian children. Aust N Z J Public Health. 2006;30(2):137–142. doi:doi:10.1111/j.1467-842X.2006.tb00106.x
19. Tone SO, Elbaz U, Silverman E, et al. Evaluation of dry eye disease in children with systemic lupus erythematosus and healthy controls. Cornea. 2019;38(5):581–586. doi:10.1097/ICO.0000000000001902
20. Villani E, Strologo MD, Pichi F, et al. Dry eye in vernal keratoconjunctivitis: a cross-sectional comparative study. Medicine (Baltimore). 2015;94(42):e1648. doi:doi:10.1097/MD.0000000000001648
21. Alves M, Reinach PS, Paula JS, et al. Comparison of diagnostic tests in distinct well-defined conditions related to dry eye disease. PLoS One. 2014;9:5. doi:doi:10.1371/journal.pone.0097921
22. Ong Tone S, Elbaz U, Silverman E, et al. Evaluation of dry eye disease in children with systemic lupus erythematosus and healthy controls. Cornea. 2019;38(5):581–586. doi:doi:10.1097/ICO.0000000000001902
23. Wang MTM, Dean SJ, Muntz A, Craig JP. Evaluating the diagnostic utility of evaporative dry eye disease markers. Clin Experiment Ophthalmol. 2020;48(2):267–270. doi:doi:10.1111/ceo.13671
24. Gunay M, Celik G, Yildiz E, et al. Ocular surface evaluation in pediatric Hashimoto’s thyroiditis without thyroid-associated ophthalmopathy. Arq Bras Oftalmol. 2019;82(4):283–288. doi:doi:10.5935/0004-2749.20190056
25. Gupta PK, Stevens MN, Kashyap N, Priestley Y. Prevalence of meibomian gland atrophy in a pediatric population. Cornea. 2018;37(4):426–430. doi:doi:10.1097/ICO.0000000000001476
26. Dereli Can G, Kara Ö. Noninvasive evaluation of anterior segment and tear film parameters and morphology of meibomian glands in a pediatric population with hypogonadism. Ocul Surf. 2019;17(4):675–682. doi:doi:10.1016/j.jtos.2019.09.001
27. Argilés M, Cardona G, Pérez-Cabré E, Rodríguez M. Blink rate and incomplete blinks in six different controlled hard-copy and electronic reading conditions. Invest Ophthalmol Vis Sci. 2015;56(11):6679–6685. doi:doi:10.1167/iovs.15-16967
28. Abusharha AA. Changes in blink rate and ocular symptoms during different reading tasks. Clin Optom (Auckl). 2017;9:133–138. doi:doi:10.2147/OPTO.S142718
29. Koslowe KC, Waissman H, Biner-Kaplan M. The blink frequency relationship between reading from a computer screen and reading from a printed page. Available from: undefined./paper/The-Blink-Frequency-Relationship-between-Reading-a-Koslowe-Waissman/dc21de558c7dd5aac90bd820062a16341a2fefcd. 2011.
30. Chu C, Rosenfield M, Portello JK, Benzoni JA, Collier JD. A comparison of symptoms after viewing text on a computer screen and hardcopy: a comparison of symptoms after viewing text. Ophthalmic Physiol Optics. 2011;31(1):29–32. doi:doi:10.1111/j.1475-1313.2010.00802.x
31. Portello JK, Rosenfield M, Chu CA. Blink rate, incomplete blinks and computer vision syndrome. Optometry Vision Sci. 2013;90(5):482–487. doi:doi:10.1097/OPX.0b013e31828f09a7
32. Kim JS, Wang MTM, Craig JP. Exploring the Asian ethnic predisposition to dry eye disease in a pediatric population. Ocul Surf. 2019;17(1):70–77. doi:doi:10.1016/j.jtos.2018.09.003
33. Jung SJ, Mehta JS, Tong L. Effects of environment pollution on the ocular surface. Ocul Surf. 2018;16(2):198–205. doi:doi:10.1016/j.jtos.2018.03.001
34. Wolkoff P, Nøjgaard JK, Troiano P, Piccoli B. Eye complaints in the office environment: precorneal tear film integrity influenced by eye blinking efficiency. Occup Environ Med. 2005;62(1):4–12. doi:doi:10.1136/oem.2004.016030
35. Amparo F, Schaumberg DA, Dana R. Comparison of two questionnaires for dry eye symptom assessment: the ocular surface disease index and the symptom assessment in dry eye. Ophthalmology. 2015;122(7):1498–1503. doi:doi:10.1016/j.ophtha.2015.02.037
36. Wang MTM, Xue AL, Craig JP. Comparative evaluation of 5 validated symptom questionnaires as screening instruments for dry eye disease. JAMA Ophthalmol. 2019;137(2):228–229. doi:doi:10.1001/jamaophthalmol.2018.5243
37. Simpson TL, Situ P, Jones LW, Fonn D. Dry eye symptoms assessed by four questionnaires. Optom Vis Sci. 2008;85(8):692–699. doi:doi:10.1097/OPX.0b013e318181ae36
38. Schiffman RM, Christianson MD, Jacobsen G, Hirsch JD, Reis BL. Reliability and validity of the ocular surface disease index. Arch Ophthalmol. 2000;118(5):615–621. doi:doi:10.1001/archopht.118.5.615
39. Li W, Yeh TN, Leung T, Yuen T, Lerma M, Lin MC. The relationship of lid wiper epitheliopathy to ocular surface signs and symptoms. Invest Ophthalmol Vis Sci. 2018;59(5):1878–1887. doi:doi:10.1167/iovs.17-23639
40. Korb DR, Herman JP, Greiner JV, et al. Lid wiper epitheliopathy and dry eye symptoms. Eye Contact Lens. 2005;31(1):2–8. doi:doi:10.1097/01.icl.0000140910.03095.fa
41. Koh YT, Sanjay S. Characteristics and ophthalmic manifestations of the classic dengue fever epidemic in Singapore (2005–2006). Asia-Pac J Ophthalmol. 2013;2(2):99–103. doi:10.1097/APO.0b013e31828a1917
42. Pult H, Riede-Pult B. Comparison of subjective grading and objective assessment in meibography. Cont Lens Anterior Eye. 2013;36(1):22–27. doi:doi:10.1016/j.clae.2012.10.074
 © 2020 The Author(s). This work is published and licensed by Dove Medical Press Limited. The
full terms of this license are available at https://www.dovepress.com/terms
and incorporate the Creative Commons Attribution
- Non Commercial (unported, 3.0) License.
By accessing the work you hereby accept the Terms. Non-commercial uses of the work are permitted
without any further permission from Dove Medical Press Limited, provided the work is properly
attributed. For permission for commercial use of this work, please see paragraphs 4.2 and 5 of our Terms.
© 2020 The Author(s). This work is published and licensed by Dove Medical Press Limited. The
full terms of this license are available at https://www.dovepress.com/terms
and incorporate the Creative Commons Attribution
- Non Commercial (unported, 3.0) License.
By accessing the work you hereby accept the Terms. Non-commercial uses of the work are permitted
without any further permission from Dove Medical Press Limited, provided the work is properly
attributed. For permission for commercial use of this work, please see paragraphs 4.2 and 5 of our Terms.