")
Back to Journals » International Journal of Nanomedicine » Volume 19
High-Performance Photodynamic Therapy of Tongue Squamous Cell Carcinoma with Multifunctional Nano-Verteporfin
Authors Yu L, Xu Z, Zhu G, Zeng L, Zhang Z, Yu Y, Wang S, Zhang X , Zhou N , Liang L
Received 28 November 2023
Accepted for publication 19 February 2024
Published 13 March 2024 Volume 2024:19 Pages 2611—2623
DOI https://doi.org/10.2147/IJN.S452060
Checked for plagiarism Yes
Review by Single anonymous peer review
Peer reviewer comments 2
Editor who approved publication: Professor R.D.K. Misra
Lina Yu,1,* Zidan Xu,1,* Guanxiong Zhu,1,* Liting Zeng,1 Zeyu Zhang,1 Yang Yu,2 Siran Wang,1 Xin Zhang,3 Na Zhou,3 Lu Liang1,4
1Department of Preventive Dentistry, School and Hospital of Stomatology, Guangdong Engineering Research Center of Oral Restoration and Reconstruction & Guangzhou Key Laboratory of Basic and Applied Research of Oral Regenerative Medicine, Guangzhou Medical University, Guangzhou, People’s Republic of China; 2Department of Sports and Health, Guangzhou Sport University, Guangzhou, People’s Republic of China; 3State Key Laboratory of Quality Research in Chinese Medicine, Macau University of Science and Technology, Avenida Wailong, Taipa, Macau, People’s Republic of China; 4Guangzhou Municipal and Guangdong Provincial Key Laboratory of Molecular Target & Clinical Pharmacology, the State & NMPA Key Laboratory of Respiratory Disease, School of Pharmaceutical Sciences & the Fifth Affiliated Hospital, Guangzhou Medical University, Guangzhou, People’s Republic of China
*These authors contributed equally to this work
Correspondence: Lina Yu; Lu Liang, Email [email protected]; [email protected]
Background: The photodynamic therapy (PDT) showed promising potential in treating tongue squamous cell carcinoma (TSCC). The Food and Drug Administration approved Verteporfin (Ver) is a powerful alternative in this field for its penetrating power and high production of reactive oxygen species (ROS). However, its applications in the treatment of TSCC are still rare.
Methods: Ver was loaded onto Poly (lactic-co-glycolic acid) (PLGA) nanoparticles, followed by the modification with RGD peptide as the ligand. The nanostructured was named as RPV. In vitro assessments were conducted to evaluate the cytotoxicity of RPV through the Live/Dead assay analysis and Cell Counting Kit-8 (CCK-8) assay. Using the reactive oxygen species assay kit, the potential for inducing targeted tumor cell death upon laser irradiation by promoting ROS production was investigated. In vivo experiments involved with the biological distribution of RPV, the administration with RPV followed by laser irradiation, and the measurement of the tumor volumes. Immunohistochemical analysis was used to detect the Ki-67 expression, and apoptosis induced by RPV-treated group. Systemic toxicity was evaluated through hematoxylin-eosin staining and blood routine analysis. Real-time monitoring was employed to track RPV accumulation at tumor sites.
Results: The in vitro assessments demonstrated the low cytotoxicity of RPV and indicated its potential for targeted killing TSCC cells under laser irradiation. In vivo experiments revealed significant tumor growth inhibition with RPV treatment and laser irradiation. Immunohistochemical analysis showed a notable decrease in Ki-67 expression, suggesting the effective suppression of cell proliferation, and TUNEL assay indicated the increased apoptosis in the RPV-treated group. Pathological examination and blood routine analysis revealed no significant systemic toxicity. Real-time monitoring exhibited selective accumulation of RPV at tumor sites.
Conclusion: The findings collectively suggest that RPV holds promise as a safe and effective therapeutic strategy for TSCC, offering a combination of targeted drug delivery with photodynamic therapy.
Keywords: photodynamic therapy, verteporfin, RGD sequence, tumor-specific drug delivery
Introduction
Tongue squamous cell carcinoma (TSCC) stands as a prevalent malignant tumor within the oral and maxillofacial region.1 The American Cancer Society anticipates a substantial 18,040 new cases of tongue cancer in 2023, constituting approximately 52% of all oral cancer incidences.2 TSCC exhibits a higher prevalence in men, with risk factors encompassing tobacco use, alcohol consumption, betel nut, genetic factors, HPV infection, and poor oral hygiene.3 The rich blood supply and tissue abundance in the tongue, coupled with its frequent movement, contribute to the swift progression and early metastasis of TSCC. Current treatment modalities predominantly involve surgery, complemented by comprehensive approaches involving radiotherapy and chemotherapy.4 However, these treatments carry significant side effects, impacting crucial functions such as pronunciation and swallowing, thereby influencing the overall survival and potentially leading to recurrence and metastasis.5 Consequently, there is an urgent need to explore novel treatment techniques and drugs to enhance the prognosis of TSCC patients, ultimately improving their survival rates and impeding tumor spread.
Photodynamic therapy (PDT) represents an established and clinically approved treatment approach capable of generating singlet oxygen (1O2) and other reactive oxygen species (ROS) through the photoactivation of photosensitizers, effectively eliminating diseased cells.6,7 This non-invasive approach has shown effectiveness with minimal adverse effects, making it applicable for treating a variety of conditions such as skin tumors, head and neck tumors, digestive system tumors, abdominal tumors, urinary system tumors, and brain tumors.8,9 PDT requires the presence of a photosensitizer, a light source, and molecular oxygen.10 Current photosensitizers exhibit hydrophobic characteristics and lack specificity for tumors, highlighting the critical need for drug delivery systems with excellent biocompatibility and the ability to selectively target tumor sites.11
In recent decades, substantial progress has been achieved in the advancement of drug delivery systems based on nanoparticles, encompassing polymer nanoparticles, liposomes, carbon dots, upconverting nanoparticles (UCNP), and inorganic nanoparticles.12 Polymer nanoparticles, particularly those utilizing an FDA-approved material - poly (lactic-co-glycolic acid) (PLGA), have emerged as a prominent focus in current research.13 Comprising lactic acid and glycolic acid monomers, PLGA nanoparticles exhibit commendable biocompatibility, degradability, and non-toxicity.14,15 Moreover, surface modifications of PLGA nanoparticles can be chemically engineered to target specific tumor areas, thereby enhancing therapeutic outcomes.16
Targeted drug delivery involves the precise localization of drugs to specific sites through carriers, facilitated either by local or systemic administration. Passive targeting primarily depends on the enhanced permeability and retention effect (EPR effect).17 Conversely, the active targeting enables the direct delivery of drugs to specific sites, enhancing cellular uptake. This active targeting can be categorized into receptor-mediated and ligand-mediated approaches. Notably, the RGD peptide, a polypeptide comprising arginine-glycine-aspartate (Arg-Gly-Asp), exhibits specificity in binding to the overexpressed αvβ3 integrin receptor on the surfaces of tumor cells and vascular endothelial cells, facilitating effective active targeting.17–19
Verteporfin (Ver), a benzoporphyrin derivative (BPD), serves as an effective photosensitizer for cancer treatment by producing ROS.20 FDA-approved in 2000, Ver was initially employed for photodynamic therapy in macular degeneration.21,22 While extensively studied in liver cancer, ovarian cancer, colon cancer, pancreatic cancer, thyroid cancer, and other tumors as a second-generation photosensitizer, limited research has investigated its therapeutic impact on tongue cancer.20,23
In this study, we developed a novel multifunctional nanocarrier, designed for the photodynamic therapy of TSCC. To improve the targeting of treatment, we used RGD sequences to enhance delivery capability. The carrier integrated Ver into RGD-modified PLGA, forming nanoparticles (RPV). The characterization of RPV was presented, followed by a comprehensive evaluation of its anti-tumor efficacy both in vitro and in vivo. The nanoparticles exhibited low cytotoxicity, facilitating the specific accumulation of Ver at the tumor site while minimizing side effects. Hence, the incorporation of RGD-modified polymer nanocarriers proved to significantly improve the targeted delivery efficiency of Ver in photodynamic therapy for tongue cancer, leading to an enhancement in therapeutic outcomes. PLGA and verteporfin we employed have both obtained FDA approval, emphasizing their significant potential for innovation. This investigation specifically centered on materials and medications holding promising clinical applications, particularly in the context of oral cancer treatment, demonstrating considerable transformative potential. It is noteworthy that while Ver holds significant value in treatment, there is currently limited research on the RGD-mediated delivery of Ver, providing compelling evidence for the potential application of nanoparticles in tongue cancer treatment.
Materials and Methods
PLGA-PEG-MAL and DSPE-PEG-RGD were obtained from RuixiBiotech Co.Ltd (Xi’an, China). Verteporfin (Ver) was procured from MedChem Express (China). The DMEM/F-12 culture medium, fetal bovine serum (FBS), phosphate buffer saline (PBS), and penicillin/streptomycin were sourced from Gibco (USA).
Cell Culture
Human tongue squamous cell carcinoma cell lines (CAL-27) were acquired from Wuhan Procell Life Technology Co. LTD in Wuhan, China. These cells were cultured in DMEM/F-12 medium, supplemented with 10% FBS and 1% penicillin/streptomycin, in an incubation chamber under a humidified atmosphere with 5% CO2 at 37 °C.
Preparation of PV and RPV
For the synthesis of PLGA/Ver (PV), PLGA-PEG-Mal was prepared by dissolving in a mixture of ethyl acetate and dichloromethane (v/v = 3/7). Ver was added to a dichloromethane solution and mixed well with the PLGA solution. After ultrasonic treatment (Power 160 W, 3s on and 1 s off for 6 min) in an ice water bath, the resulting emulsion was dropped into a 3% polyvinyl alcohol (PVA) solution. Subsequently, the product was stirred magnetically for 4 h, followed by centrifugation at 12,000 rpm for 30 min to obtain the precipitate of PLGA/Ver (PV).
To initiate the synthesis of RPV, PLGA was dissolved in an appropriate amount of 4-Morpholinoethanesulfonic acid (MES) buffer. Subsequently, 1-Ethyl-3-(3-dimethylaminopropyl) carbodiimide (EDC) and N-Hydroxysuccinimide (NHS) were added to the PLGA solution. The mixture was magnetically stirred for 2 h and subjected to three rounds of centrifugation. Next, the resuspended PV was combined with a DSPE-PEG-RGD solution (with a molar ratio of PV to DSPE-PEG-RGD set at 1:1), followed by magnetic incubation for 12 h. After mixing, the solution underwent centrifugation at 12,000 rpm for 30 min to yield the RPV precipitate. Subsequently, this precipitate was reconstituted in 1 mL of PBS and stored at 4 °C.
Characterization of PV and RPV
The zeta potential, particle size, and polydispersity index (PDI) of PLGA, PV, and RPV were determined using the Zeta Sizer (Malvern, UK). Another set of prepared RPV samples was exposed to PBS solution at various time points (0, 12, 24, 36, 48, 60, and 72 h) to assess their stability.
For electron microscopy analysis, a volume of 10 μL of PLGA, PV, and RPV solutions were individually dropped on a copper mesh for 10 min. Subsequently, the excess solution was absorbed using filter paper, and the grids were left to dry overnight. The copper meshes were then captured using transmission electron microscopy (TEM) (JEOL, Tokyo, Japan).
Drug Encapsulation Efficiency and Drug Loading Capacity
The analysis of drug encapsulation efficiency and drug loading capacity for Ver was conducted using PLGA with varying ratios of PLGA to Ver (PLGA/Ver = 5/1, 50/1, 100/1, 200/1, and 300/1). The loaded PLGA samples underwent centrifugation, and the supernatant was examined using an ultraviolet (UV) spectrophotometer (Spectrum, SP1920, China). The calculations were performed using the following formulas: Ver encapsulation efficiency (%) = (Amount of loaded Ver) / (Initial input of Ver) × 100%; Ver loading capacity (%) = (Amount of loaded Ver) / (Total weight of nanoparticles) × 100%; Amount of loaded Ver = (Initial input of Ver) – (Ver content of supernatant).
Extracellular Release Profile of Ver
RPV was dissolved in 1 mL PBS and subsequently introduced into a dialysis bag with a cutoff of 3000 Da. The dialysis bags were prepared and respectively placed in centrifuge tubes containing 40 mL solutions adjusted to different pH levels (pH = 5.4 and 7.4). The tubes were set to rotate at 250 rpm at 37 °C.
At different time intervals (0, 1, 2, 4, 6, 8, 10, 12, 24, 36, 48, 72, 84, and 96 hours), 1 mL of the liquid was withdrawn and replaced with an equal amount of fresh dialysate. To determine the Ver content in the withdrawn liquid, UV absorbance measurements were conducted using a microporous plate detector (BioTek, USA).
Cellular Uptake in vitro
CAL-27 cells were initially seeded in confocal dishes and six-well plates at a density of 2×10⁵ cells per well, cultured in DMEM/F-12. Following a 24-hour incubation period, different concentrations of RPV (Ver equivalent to 1, 2, 3, 4, and 5 μg/mL) in DMEM/F12 were added into CAL-27 cells. After the designated culture duration, the samples underwent fixation at 37 °C for 10 min using 4% paraformaldehyde. Subsequently, Actin-Tracker Green and DAPI was respectively utilized to stain the cytoskeleton and cell nucleus. Cellular imaging was conducted using confocal laser scanning microscopy (CLSM, LSM880, Zeiss, Germany). For fluorescence quantification assessment, Flow Cytometry (FACS) analysis was performed. Cells were harvested and suspended at 50 μL PBS, and fluorescence was analyzed through FACS. To evaluate the cellular nanoparticle uptake over time (1, 2, 4, 6, and 8 h), the same procedures were followed. After optimizing the dose and time, various environments, such as PBS, PLGA, PV, or RPV, were individually incubated with CAL-27 cells. CLSM and FACS analyses were employed to monitor the fluorescence in these different experimental conditions.
In vitro Cytotoxicity Assays
A total of 2.5×10⁵ CAL-27 cells were initially cultured in confocal dishes for 24 h. Subsequently, the cells were treated with PBS (as a negative control), Ver, PV, or RPV for 8 h. Following the incubation, the cells were exposed to a 660 nm laser for 3 minutes at an intensity of 2 W/cm2 and stained with Calcein-AM/PI (Beyotime, China) at 37 °C for 30 minutes under the light proof condition. Subsequently, the cells were observed under CLSM.
The cytotoxicity of different concentrations and formulations (PBS, Ver, PV, or RPV) was evaluated using the Cell Counting Kit-8 (CCK-8) assay. They were incubated separately for 8 h, with or without laser irradiation. Assessment of cell viability was quantified using a multifunctional plate reader (BioTek, USA).
Assessment of ROS Generation
CAL-27 cells (2×10⁵ cells per well) were initially seeded onto confocal dishes and cultured in a 37°C incubator for 24 h. Subsequently, the cells were exposed to various treatments, including PBS, PBS + Laser, Ver, Ver + Laser, PV, PV + Laser, RPV, and RPV + Laser for a duration of 4 h. DCFH-DA was incubated with CAL-27 cells at 37°C for 30 min in the dark. Laser treatment was applied to the designated groups, involving irradiation with a 660 nm laser at 2 W/cm2 for a duration of 3 min. Observation of the treated cells was carried out using CLSM with excitation at Ex=488 nm and Em=525 nm. This approach allowed for the assessment of ROS generation in response to different treatments and laser exposures.
Antitumor Effect in vivo
Female BALB/c Nude mice weighing 18–20 g and aged 6–8 weeks, were maintained in a specific pathogen-free environment. All animal experiments were conducted following approval from the Laboratory Animal Care of Guangzhou Medical University (Approval Number: G2023-775), and in accordance with the “Laboratory Animal—Guideline for Ethical Review of Animal Welfare (GB/T 35892–2018)”.
The tumor mouse model was established by subcutaneously inoculating CAL-27 cells per mouse on the right side of BALB/c Nude mice. After 2 weeks, tumor-bearing mice were randomly divided into six groups (n=4 per group): PBS, RPV, PBS + Laser, Ver + Laser, PV + Laser, and RPV + Laser. The mice received an equivalent Ver dose of 20 mg/kg. Local injections of the corresponding formulations were injected every 2 days, followed by 660 nm laser irradiation (2 W/cm2, 10 min), with a distance of 5 cm between the laser and the tumor. Tumor volumes were calculated as follows: tumor size (mm3) = (width2 × length)/2. After five treatment cycles, the mice were weighed and subsequently sacrificed. The major organs (heart, liver, spleen, lung, and kidney) and tumors were preserved in 4% paraformaldehyde and subjected to analysis using Hematoxylin and Eosin staining (HE), IHC staining with anti-Ki67 antibody staining and TdT-mediated dUTP Nick-End Labeling (TUNEL). Additionally, a blood routine test was conducted to monitor potential systemic toxicity.
In vivo Fluorescence Imaging
Tumor-bearing nude mice were randomly allocated into four groups. Following anesthesia with 2% isoflurane, the mice received local injections of different dosage forms (Ver, PV, or RPV), while the control group was injected with an equal volume of PBS. In Vivo Imaging System (PerkinElmer, IVIS Lumina LT, USA) was employed for monitoring at 1, 2, 4, 8, 12, 24, and 48 h, respectively. Subsequent to in vivo tracking, the mice were euthanized, and the major organs were dissected and imaged. The fluorescence intensity was then analyzed using Maestro V3.0.A software.
Statistical Analysis
The data were analyzed using GraphPad Prism 8.0 software. All data are presented as mean ± standard deviation (SD). Statistical comparisons among groups were performed using one-way analysis of variance (ANOVA), followed by Tukey’s multiple comparisons test. Statistical significance is indicated as *p < 0.05, **p < 0.01, and ***p < 0.001.
Results
Preparation and Characterization of RPV
The size and morphology of PLGA, PV, and RPV nanoparticles were assessed by TEM. It was evident that the structure of PLGA, PV, and RPV were round, regular in shape, and uniform in size (Figure 1A-C), with the particle sizes corresponding to approximately 216.8 nm, 234.7 nm, and 257.2 nm, respectively (Figure 1D-F). The zeta potential of PV was −13.4 mV, representing an increase from −18.9 mV corresponding to PLGA. Following the modification with DSPE-PEG-RGD, the zeta potential of the prepared nanoparticles was −16.3 mV (Figure 1G). Simultaneously, the particle size and polydispersity index (PDI) of RPV remained stable within 72 h in PBS, with the particle size at approximately 263.4 nm and a PDI of 0.12 (Figure 1H). The loading efficiency of Ver was analyzed, revealing that at a ratio of 50:1, the encapsulation efficiency was nearly 60%, and the drug loading efficiency was 1.17% (Figure 1I). To investigate the extracellular release profile of Ver, RPV was exposed to environments with pH values of 5.4 and 7.4, respectively. The results indicated a slow release of RPV in a pH 7.4 environment. Conversely, under pH 5.4 conditions, the drug release rate significantly accelerated, reaching 50.61% (Figure 1J). TEM images confirmed that RPV degraded or dissolved in a pH 5.4 environment (Figure 1K). The observed degradation or dissolution in this low pH setting strongly suggests that RPV undergoes decomposition in acidic conditions. The ability of RPV to degrade in response to specific environmental conditions enhances its applicability, offering a versatile feature that may be advantageous in various applications, especially those requiring controlled release or targeted delivery systems.
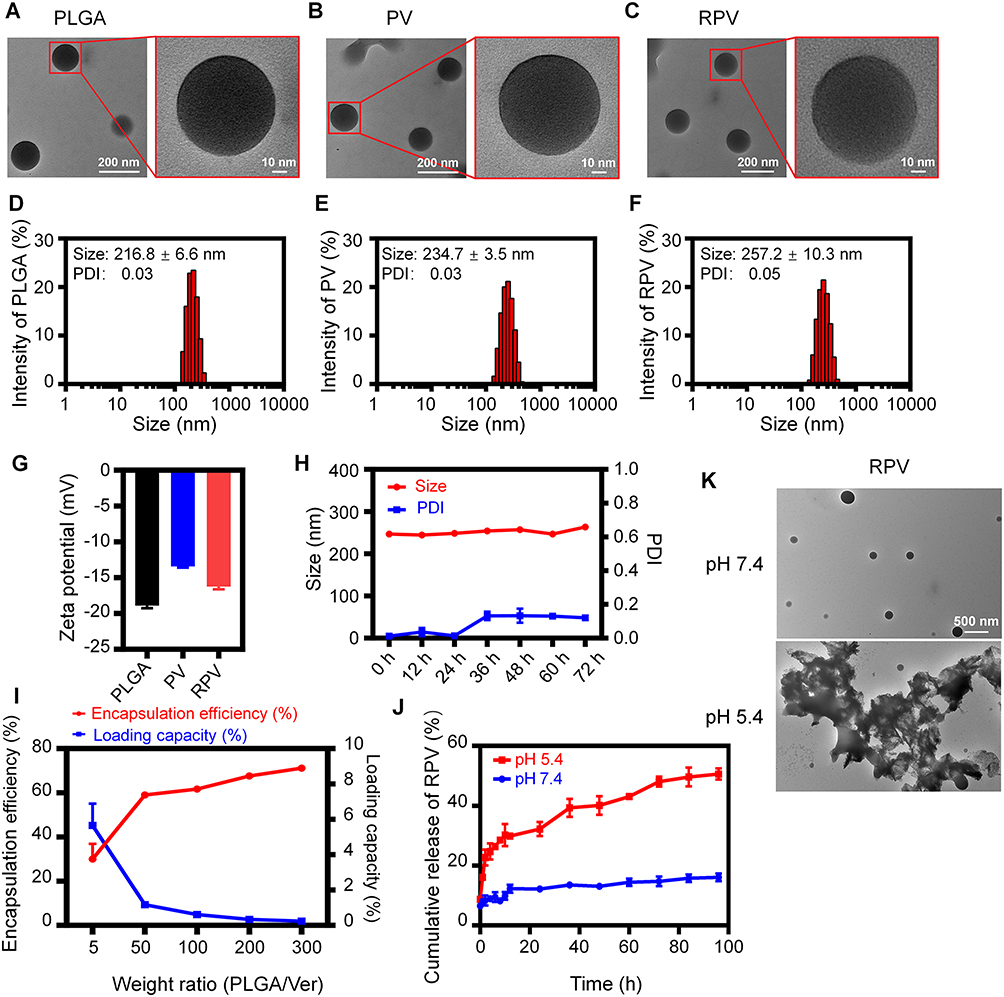 |
Figure 1 Characterizations of PV and RPV. (A-C) TEM image analysis of PLGA, PV and RPV. (D-F) The size distribution of PLGA, PV and RPV. (G) The zeta potential of PLGA, PV and RPV. (H) The size and PDI of RPV. (I) Encapsulation efficiency and loading capacity of RPV. (J) The cumulative release of RPV. (K) TEM image analysis of RPV at pH 5.4 and pH 7.4. |
Evaluation of Cellular Uptake
The cellular uptake of RPV was assessed using CLSM and analyzed through FACS. Ver, with its inherent fluorescence, allows for the direct detection of nanoparticles containing Ver. This property facilitates the tracking of cellular uptake in vitro. DAPI was employed to stain the nucleus (blue), while Ver exhibited red fluorescence. Limited red fluorescence was evident following the incubation of CAL-27 cells with 1 μg/mL RPV (equivalent to the concentration of 1 μg/mL Ver). As the concentration increased, the red fluorescence of RPV nanoparticles gradually intensified. FACS-based quantitative analysis revealed that the fluorescence intensity within the cells exhibited a concentration-dependent increase, peaking at 98.8% at 5 μg/mL RPV (Figure 2A). Thus, RPV at a concentration of 5 μg/mL was selected for further investigation to determine the optimal incubation time.
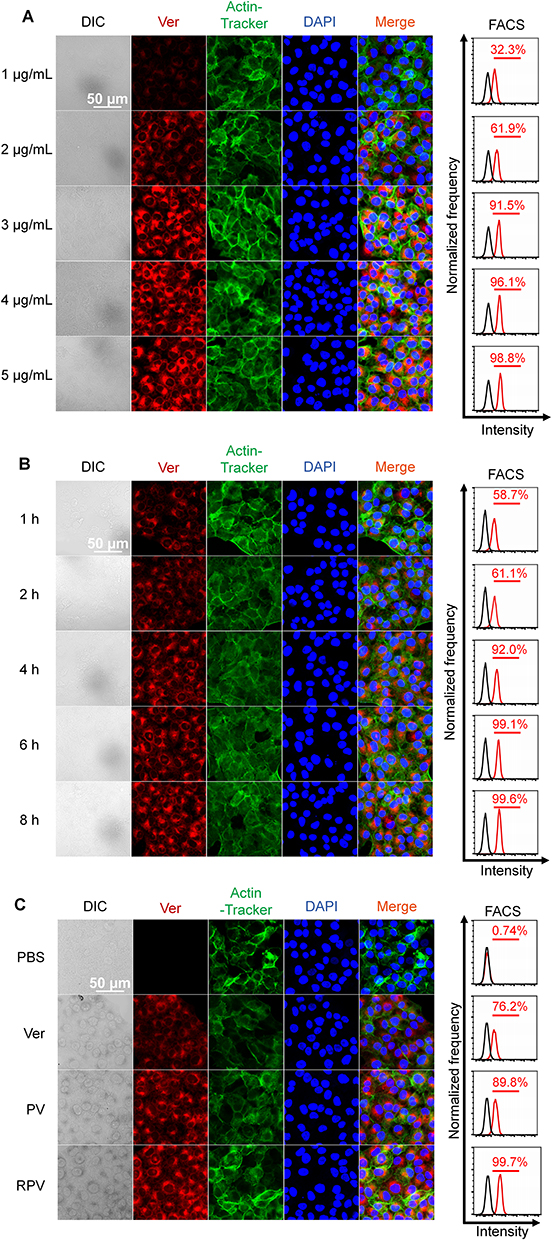 |
Figure 2 Cellular uptake of RPV under varied conditions. (A) Transfection of CAL-27 cells with varying concentrations of RPV. (B) Transfection of CAL-27 cells for different time intervals. (C) CAL-27 cells transfected with Ver, PV, and RPV. |
At the initial time points (1 and 2 h), a minimal fluorescence signal suggested a low cellular uptake. However, with prolonged incubation time of 4, 6, and 8 h, a significant increase in fluorescence intensity was observed, indicating a substantial enhancement in the cellular uptake of RPV (Figure 2B). Thus, the subsequent experiments were employed at the condition of RPV at a Ver concentration of 5 μg/mL, followed by an 8-hour transfection.
Moreover, we evaluated the cellular uptake of different formulations by the TSCC cell line, CAL-27 cells. Both CLSM and FACS results showed that RGD played pivotal roles in enhancing the cellular uptake of Ver, as indicated by the strongest fluorescence observed in CAL-27 cells after the incubation with RPV (Figure 2C).
In vitro Assessment of Antitumor Potential
In this experiment, living cells were identified by the green fluorescence of Calcein, while dead cells were marked with the red fluorescence of propidium iodide (PI). Following different treatments without laser irradiation, the majority of cells exhibited green fluorescence. On the contrary, the exposure to the laser irradiation induced a substantial rise in red fluorescence, as observed following the treatment with Ver, PV, and RPV, implying the increases of dead cells (Figure 3A). The cytotoxicity of RPV was assessed in CAL-27 cells. Without laser conditions, there was no significant change in cell viability of CAL-27 cells treated with different concentrations (0.0125 μg/mL, 0.025 μg/mL, 0.05 μg/mL, 0.1 μg/mL) of RPV. After laser irradiation, the viability of CAL-27 cells significantly decreased with increasing concentration. The IC50 value (50% inhibitory concentration) of RPV with laser was 0.03 μg/mL (Figure S1).
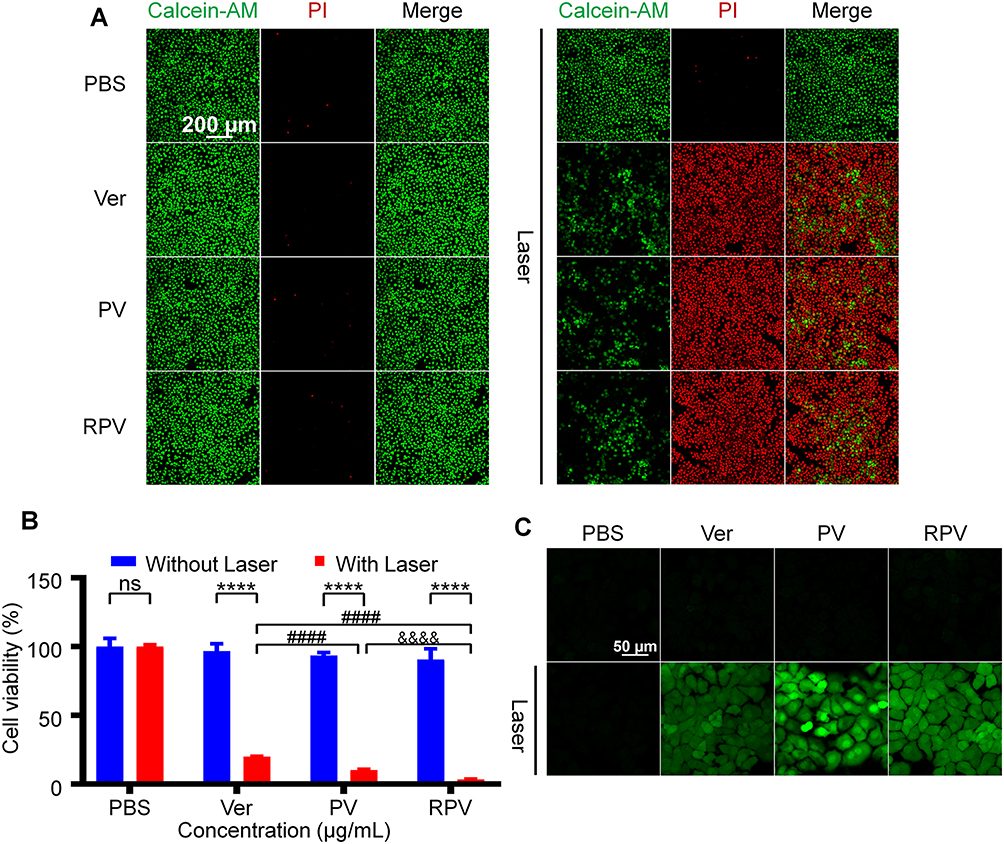 |
Figure 3 In vitro assessment involved calcein AM/PI staining, cytotoxicity, and ROS Levels. CAL-27 cells were subjected to treatments with PBS, Ver, PV, and RPV for 8 h, both with and without 660 nm laser irradiation. (A) Fluorescence microscopy images depicting Calcein AM/PI-stained CAL-27 cells. (B) CAL-27 cell viability assessed by CCK-8 assay. (C) Determination of cellular ROS levels using the DCFDA assay. All data are presented as the mean ± SD. ****, P < 0.001 vs without laser group; ####P < 0.001 vs Ver + laser group; &&&&P < 0.001 vs RPV + laser group. |
Upon the treatment with Ver + Laser, PV + Laser, or RPV + Laser, the cell viability significantly decreased compared to the groups without laser treatment. Remarkably, the synergistic effect was more pronounced when RPV was combined with laser irradiation, resulting in a greater cytotoxic effect than the Ver + Laser or PV + Laser group (Figure 3B). It was observed that Ver-loaded nanoparticles exhibited low cytotoxicity, avoiding the side effects to the normal cells in the absence of laser exposure. However, upon laser irradiation, they demonstrated the capability to induce tumor cell death.
ROS production subjected to various treatments (Ver, PV, and RPV) was assessed using ROS detection kits. Negligible ROS production was detected across the various groups in the absence of laser irradiation. However, following laser irradiation, a substantial increase in intracellular fluorescence signals was evident in Ver, PV and RPV-treated groups. Moreover, cells treated with RPV and exposed to laser demonstrated a notable elevation in intracellular ROS levels in comparison to the Ver and PV groups (Figure 3C). This phenomenon underscored the ability of RPV to significantly enhanced ROS production in cells, potentially leading to cell death by disrupting the cellular redox balance.
Tracking Nano-Photosensitizer in vivo
The analysis of drug distribution and content is facilitated by the In Vivo Imaging System, which enables real-time monitoring of fluorescence signals within living organisms. In this study, we employed this technology to investigate nanoparticle distribution in nude mice and tumor sites. Following drug injection, fluorescence signals prominently accumulated at the tumor area, with RPV-injected mice exhibiting higher fluorescence levels compared to other groups (Figure 4A). Notably, the fluorescence signals of major organs were minimal in the administered groups, indicating heightened fluorescence exclusively at tumor sites (Figure 4B and C).
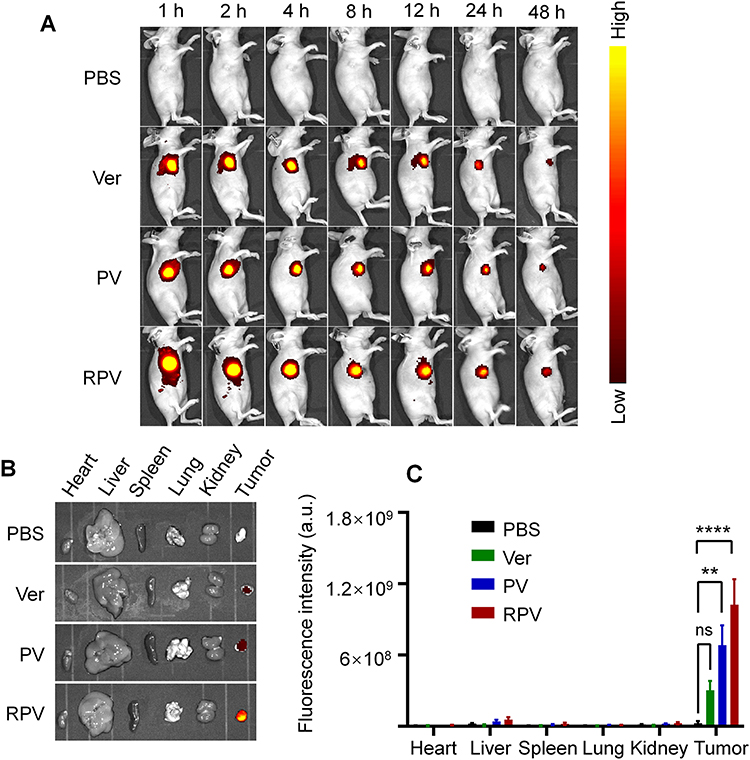 |
Figure 4 Conducting an in vivo assessment of biodistribution and homotypic targeting involved the administration of Ver, PV, or RPV to BALB/c mice (n = 4). (A) In vivo analysis of fluorescent nanoparticles for biodistribution. (B and C) Ex-vivo imaging of major organs accompanied by corresponding quantitative evaluations. All data are presented as the mean ± SD. **P < 0.01, ****P < 0.0001 between two groups. Abbreviation: ns, no significance. |
In vivo Antitumor Effects
To evaluate the in vivo anti-tumor effect of RPV, tumor-bearing mice were divided into six groups and treated with PBS, RPV, PBS + Laser, Ver + Laser, PV + Laser, and RPV + Laser every two days (Figure 5A). Our results revealed the largest tumor volume in the PBS, RPV, and PBS + Laser groups. Laser treatment resulted in smaller tumor volumes, with the RPV group exhibiting the smallest (Figure 5B and C). The tumor growth curve showed a faster growth rate in the PBS, RPV, and PBS + Laser groups, while the other three groups exhibited inhibited growth. Among them, RPV showed the most pronounced inhibitory effect (Figure 5C). Notably, tumor weights confirmed these findings (Figure 5D). The weight of nude mice in all treatment groups slightly increased, indicating reliable biosafety of the drug preparation (Figure 5E). As expected, conspicuous necrotic regions were markedly observed in tumor tissues after laser irradiation in the RPV treatment group, while the control groups (PBS, RPV, and PBS + Laser) exhibited minimal necrosis (Figure 5F). Ki-67, a commonly used biomarker for cell proliferation, showed significantly down-regulated expression in tumor tissues of the laser-treated groups compared to other groups. The group treated with RPV and laser demonstrated the most pronounced reduction in Ki-67 expression (Figure 5F). TUNEL assay for apoptosis detection revealed minimal apoptotic cells in the tumor tissues of the groups treated without laser, while the RPV + Laser group exhibited the highest apoptosis rate, with tumor tissues predominantly occupied by green fluorescent apoptotic cells (Figure 5F).
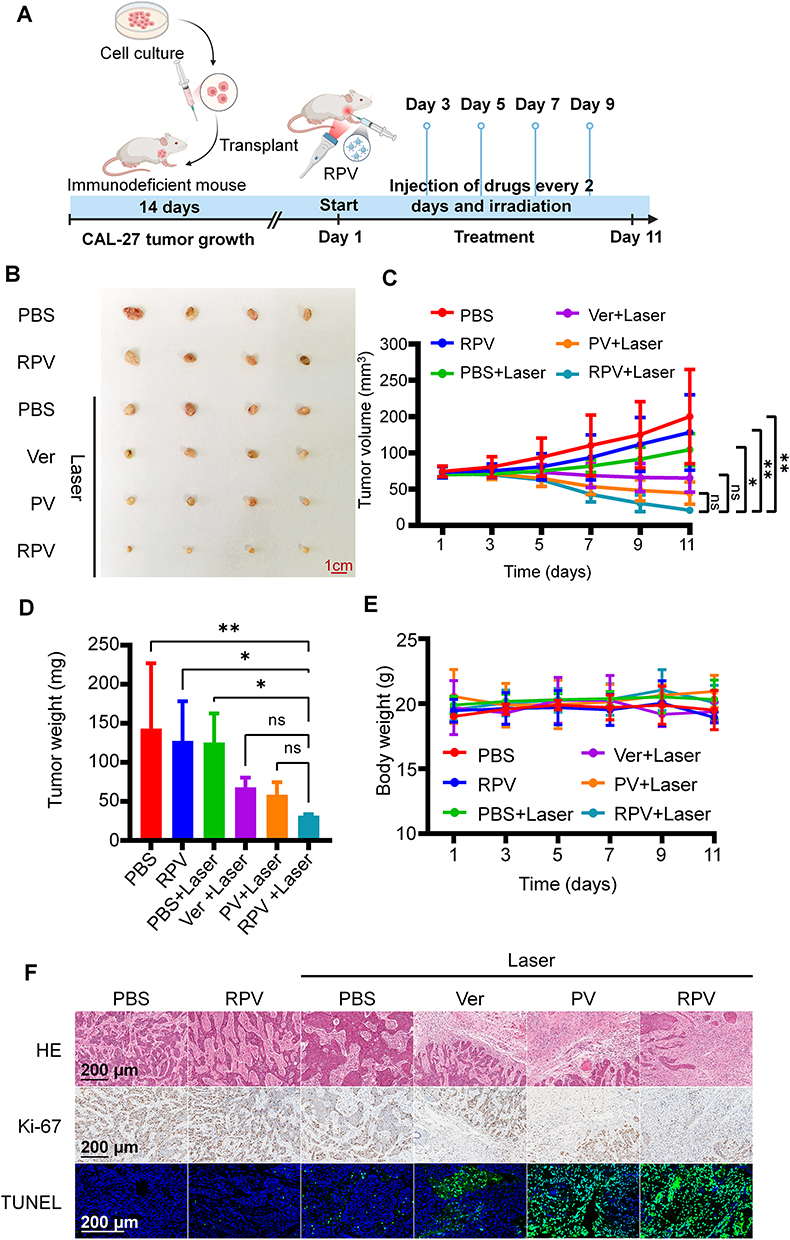 |
Figure 5 The antitumor effects of CAL-27 tumor-bearing nude mice following subcutaneous administration of PBS, RPV, PBS + Laser, Ver + Laser, PV + Laser, and RPV + Laser (n = 4), with an administered dose equivalent to Ver (20 mg/kg). (A) Schematic representation illustrating photothermal therapy in nude mice. (B) Extraction of tumors post-treatment with various formulations. (C) Presentation depicting dynamic changes in tumor volume. (D) Recorded weights of tumors at the conclusion of therapy on day 11. (E) The changes in body weight of mice in different treatment groups. (F) Representative histological images of tumor tissues stained with H&E, Ki-67, and TUNEL, respectively. All data are presented as the mean ± SD. ns, no significance; *P < 0.05, **P < 0.01 between two groups. |
To further assess the safety of RPV as an anti-tumor drug, pathological examination of tumor tissues and major organs in each group was conducted. No significant differences were observed in the major organs between each treatment and control groups (Figure S2). Blood routine analysis in each group supported the conclusion that RPV poses no serious systemic toxicity, establishing it as an ideal therapeutic drug (Figure S3).
Discussion
PDT for tumors involves injecting photosensitizers into the tumor site and subsequently using specific wavelengths of light to generate a significant amount of reactive oxygen species.24 This process induces chemical damage to tumor cells, ultimately leading to tumor cell death. Ver has been utilized as a photosensitizer for tumor PDT.25 In an aerobic environment, Ver can be activated by laser to produce ROS, leading to the destruction of tumor tissue. In addition, Ver can selectively attack abnormal blood vessels with laser irradiation, causing endothelial cell damage and vascular dysfunction.22 Junya et al utilized the reactive oxygen species generated by laser irradiation with Ver to cause damage to ameloblastoma cells, ultimately leading to tumor cell death.26 However, in numerous analogous studies, Ver is frequently administered as a standalone free drug. This approach may result in low aggregation in tumor tissue, diminished drug utilization, and even phototoxic side effects in non-tumor areas. Hence, there is a need to confer Ver with specific targeting ability towards tumor tissue.
In our prior studies focusing on the treatment of oral cancer, we utilized macrophage membranes to encapsulate zeolite imidazolium framework 8 loaded with Ver.27 However, literature has clearly pointed out that zeolitic imidazolate frameworks, as a metal material, also have certain cytotoxicity and exhibit toxic side effects on different parts of the body, severely limiting their application in the field of biomedicine.28 In this investigation, we formulated and characterized RGD-decorated PLGA nanoparticles to facilitate the targeted delivery of Ver for photodynamic therapy in tongue squamous cell carcinoma (TSCC). Both PLGA and verteporfin have received FDA approval, showcasing considerable potential for transformation, particularly in the treatment of oral cancer. Significantly, to enhance treatment targeting, we utilized RGD sequences to improve delivery capability. Despite the substantial value of verteporfin in treatment, there was still relatively limited research on the RGD delivery of verteporfin, offering compelling evidence for the potential application of nanoparticles in cancer treatment.
The multifunctional nanocarrier RPV exhibited promising results in both in vitro and in vivo evaluations. The in vitro experiments demonstrated the effective cellular uptake of RPV by CAL-27 cells, suggesting its potential for targeted drug delivery. Moreover, the pH-responsive drug release behavior observed in RPV indicated its ability to release the drug in a controlled manner within the tumor microenvironment, enhancing its therapeutic precision.
The in vitro experiments indicated that RPV effectively inhibited tumor cell activity and growth. The cytotoxicity studies revealed that RPV induced a significant decrease in cell viability, particularly in the presence of laser irradiation. This effect was attributed to the promotion of ROS production, validating RPV’s potential to disrupt cell redox balance and induce cell death.
In vivo experiments on tumor-bearing mice further validated the anti-tumor effects of RPV. The group treated with RPV and laser showed the most significant decrease in Ki-67 expression, indicating a substantial reduction in cell proliferation. TUNEL assay results confirmed a higher apoptosis rate in the RPV treatment group with laser irradiation, suggesting that RPV promotes apoptosis in tumor cells, especially under laser irradiation. In vivo evaluation of biodistribution highlighted the preferential accumulation of RPV in tumor sites, emphasizing its potential as an effective drug delivery system with active targeting capabilities. Moreover, the study explored the biosafety of RPV, as evidenced by the slight increase in the weight of nude mice and the absence of significant differences in major organs and blood routine analysis between treatment and control groups. These findings suggest that RPV possesses reliable biosafety and is a promising therapeutic option for TSCC.
Conclusion
In conclusion, RPV has demonstrated significant promise as a potential treatment for TSCC, demonstrating efficacy in inhibiting tumor growth, inducing apoptosis, and maintaining a favorable safety profile. The multifaceted attributes of RPV, including efficient cellular uptake, pH-responsive drug release, and targeted therapy, position it as a noteworthy avenue for further exploration in preclinical and potentially clinical studies. The findings contribute to valuable insights into the formulation of safe and effective therapeutic strategies for tongue cancer. Future research will explore additional aspects such as long-term effects, potential resistance mechanisms, and optimizing dosage regimens. By acknowledging these limitations and charting a course for future investigations, the study will lay the groundwork for continued advancements in the field, aiming to enhance the translational impact of RPV in the clinical landscape for TSCC treatment.
Abbreviations
PDT, Photodynamic therapy; TSCC, Tongue squamous cell carcinoma; Ver, Verteporfin; PLGA, Poly (lactic-co-glycolic acid); PV, PLGA-loaded Verteporfin; RPV, RGD-modified PV; 1O2, Singlet oxygen; UCNP, Upconverting nanoparticles; BPD, Benzoporphyrin derivative; CAL-27, Human tongue squamous cell carcinoma cell lines; MES, 4-Morpholinoethanesulfonic acid; NHS, N-Hydroxysuccinimide; EDC: 1-Ethyl-3-(3-dimethylaminopropyl) carbodiimide; CLSM, Confocal laser scanning microscopy; TEM, Transmission electron microscopy; ROS, Reactive oxygen species; FBS, Fetal bovine serum; PBS, Phosphate buffer saline; DCFH-DA, 2’,7’-Dichlorodihydrofluorescein diacetate; PDI, Polydispersity index; UV, Ultraviolet; HE, Hematoxylin-eosin; FACS, Flow cytometry; TUNEL, TdT-mediated dUTP nick-end labeling; PI, Propidium iodide; CCK-8, Cell counting kit-8.
Acknowledgments
This study was supported by National Key Research and Development Program of China (2021YFE0108000), National Natural Science Foundation of China (No. 82000080), Guangzhou Higher Education Teaching Quality and Teaching Reform Project-Excellent Talent Training Program (2022ZXRCPR008), Young Talent Support Project of Guangzhou Association for Science, Technology, and Guangdong Medical Research Foundation (A2023261), Ministry of Education Industry-University Cooperation and Collaborative Education Project (220900179290138), and Featured Innovation Project of Ordinary Higher Education Institutions in Guangdong Province (2023KTSCX106). This research received support from the Plan for Advancing Scientific Research in Guangzhou Medical University (02-410-2302377XM). Furthermore, funding was provided through the Peak Discipline Construction Project of Guangzhou Medical University, specifically the Epigenetic Drug Development Project (02-445-2301220XM, 02-445-2301164XM), as well as the First-class Professional Construction Project of Guangzhou Medical University (02-408-2304-13029XM).
Disclosure
The authors report no conflicts of interest in this work.
References
1. Xu Y, Zhang X, Zhou A, et al. A smart ‘energy nanolock’ selectively blocks oral cancer energy metabolism through synergistic inhibition of exogenous nutrient supply and endogenous energy production. Adv Mater. 2023;35(3):2207384.
2. Siegel RL, Miller KD, Wagle NS, et al. Cancer statistics, 2023. CA Cancer J Clin. 2023;73(1):17–48. doi:10.3322/caac.21763
3. Rodríguez-Molinero J, Migueláñez-Medrán BDC, Puente-Gutiérrez C, et al. Association between Oral Cancer and Diet: an Update. Nutrients. 2021;13(4):1299. doi:10.3390/nu13041299
4. Makvandi P, Josic U, Delfi M, et al. Drug Delivery (Nano)Platforms for Oral and Dental Applications: tissue Regeneration, Infection Control, and Cancer Management. Adv Sci. 2021;8(8):2004014. doi:10.1002/advs.202004014
5. Sun L, Xu Y, Zhang X, et al. Mesenchymal Stem Cells Functionalized Sonodynamic Treatment for Improving Therapeutic Efficacy and Compliance of Orthotopic Oral Cancer. Adv Mater. 2020;32(48):e2005295. doi:10.1002/adma.202005295
6. Cramer GM, Cengel KA, Busch TM. Forging Forward in Photodynamic Therapy. Cancer Res. 2022;82(4):534–536. doi:10.1158/0008-5472.CAN-21-4122
7. Almeida-Marrero V, van de Winckel E, Anaya-Plaza E, et al. Porphyrinoid biohybrid materials as an emerging toolbox for biomedical light management. Chem Soc Rev. 2018;47(19):7369–7400. doi:10.1039/C7CS00554G
8. Agostinis P, Berg K, Cengel KA, et al. Photodynamic therapy of cancer: an update. CA Cancer J Clin. 2011;61(4):250–281. doi:10.3322/caac.20114
9. Pham TC, Nguyen V-N, Choi Y, et al. Recent Strategies to Develop Innovative Photosensitizers for Enhanced Photodynamic Therapy. Chem Rev. 2021;121(21):13454–13619. doi:10.1021/acs.chemrev.1c00381
10. Li X, Lovell JF, Yoon J, et al. Clinical development and potential of photothermal and photodynamic therapies for cancer. Nat Rev Clin Oncol. 2020;17(11):657–674. doi:10.1038/s41571-020-0410-2
11. Zhao X, Liu J, Fan J, et al. Recent progress in photosensitizers for overcoming the challenges of photodynamic therapy: from molecular design to application. Chem Soc Rev. 2021;50(6):4185–4219. doi:10.1039/D0CS00173B
12. Goddard ZR, Marín MJ, Russell DA, et al. Active targeting of gold nanoparticles as cancer therapeutics. Chem Soc Rev. 2020;49(23):8774–8789. doi:10.1039/D0CS01121E
13. Deng W, McKelvey KJ, Guller A, et al. Application of Mitochondrially Targeted Nanoconstructs to Neoadjuvant X-ray-Induced Photodynamic Therapy for Rectal Cancer. ACS Cent Sci. 2020;6(5):715–726. doi:10.1021/acscentsci.9b01121
14. Pinto M, Silva V, Barreiro S, et al. Brain drug delivery and neurodegenerative diseases: polymeric PLGA-based nanoparticles as a forefront platform. Ageing Res Rev. 2022;79:101658. doi:10.1016/j.arr.2022.101658
15. Fang X, Chen Z, Zhou W, et al. Boosting Glioblastoma Therapy with Targeted Pyroptosis Induction. Small. 2023;19(30):e2207604. doi:10.1002/smll.202207604
16. Duwa R, Pokhrel RH, Banstola A, et al. T-cell engaging poly(lactic-co-glycolic acid) nanoparticles as a modular platform to induce a potent cytotoxic immunogenic response against PD-L1 overexpressing cancer. Biomaterials. 2022;291:121911. doi:10.1016/j.biomaterials.2022.121911
17. Li Z, Liu P, Chen W, et al. Hypoxia-cleavable and specific targeted nanomedicine delivers epigenetic drugs for enhanced treatment of breast cancer and bone metastasis. J Nanobiotechnol. 2023;21(1):221. doi:10.1186/s12951-023-01939-7
18. Slack RJ, Macdonald SJF, Roper JA, et al. Emerging therapeutic opportunities for integrin inhibitors. Nat Rev Drug Discov. 2022;21(1):60–78. doi:10.1038/s41573-021-00284-4
19. Di Gregorio E, Romiti C, Di Lorenzo A, et al. RGD_PLGA Nanoparticles with Docetaxel: a Route for Improving Drug Efficiency and Reducing Toxicity in Breast Cancer Treatment. Cancers. 2022;15(1):8. doi:10.3390/cancers15010008
20. Wang Y, Shang W, Zhong H, et al. Tumor Vessel Targeted Self-Assemble Nanoparticles for Amplification and Prediction of the Embolization Effect in Hepatocellular Carcinoma. ACS Nano. 2020;14(11):14907–14918. doi:10.1021/acsnano.0c04341
21. Gavini J, Dommann N, Jakob MO, et al. Verteporfin-induced lysosomal compartment dysregulation potentiates the effect of sorafenib in hepatocellular carcinoma. Cell Death Dis. 2019;10(10):749. doi:10.1038/s41419-019-1989-z
22. Wei C, Li X. The Role of Photoactivated and Non-Photoactivated Verteporfin on Tumor. Front Pharmacol. 2020;11:557429. doi:10.3389/fphar.2020.557429
23. Liu K, Du S, Gao P, et al. Verteporfin suppresses the proliferation, epithelial-mesenchymal transition and stemness of head and neck squamous carcinoma cells via inhibiting YAP1. J Cancer. 2019;10(18):4196–4207. doi:10.7150/jca.34145
24. Sun F, Shen H, Liu Q, et al. Powerful Synergy of Traditional Chinese Medicine and Aggregation-Induced Emission-Active Photosensitizer in Photodynamic Therapy. ACS Nano. 2023;17(19):18952–18964. doi:10.1021/acsnano.3c04342
25. Kim TE, Chang J-E. Recent Studies in Photodynamic Therapy for Cancer Treatment: from Basic Research to Clinical Trials. Pharmaceutics. 2023;15(9):2257. doi:10.3390/pharmaceutics15092257
26. Yamashita J, Kimoto A, Teraoka S, et al. Photodynamic therapy with verteporfin accelerates apoptotic bleb formation in human ameloblastoma. Oral Dis. 2023. doi:10.1111/odi.14775
27. Yu L, Zhu G, Zhang Z, et al. Nano-Photosensitizer Directed Targeted Phototherapy Effective Against Oral Cancer in Animal Model. Int J Nanomed. 2023;18:6185–6198. doi:10.2147/IJN.S434917
28. Abdelhamid HN. Zeolitic Imidazolate Frameworks (ZIF-8) for Biomedical Applications: a Review. Curr Med Chem. 2021;28(34):7023–7075. doi:10.2174/0929867328666210608143703
 © 2024 The Author(s). This work is published and licensed by Dove Medical Press Limited. The full terms of this license are available at https://www.dovepress.com/terms.php and incorporate the Creative Commons Attribution - Non Commercial (unported, v3.0) License.
By accessing the work you hereby accept the Terms. Non-commercial uses of the work are permitted without any further permission from Dove Medical Press Limited, provided the work is properly attributed. For permission for commercial use of this work, please see paragraphs 4.2 and 5 of our Terms.
© 2024 The Author(s). This work is published and licensed by Dove Medical Press Limited. The full terms of this license are available at https://www.dovepress.com/terms.php and incorporate the Creative Commons Attribution - Non Commercial (unported, v3.0) License.
By accessing the work you hereby accept the Terms. Non-commercial uses of the work are permitted without any further permission from Dove Medical Press Limited, provided the work is properly attributed. For permission for commercial use of this work, please see paragraphs 4.2 and 5 of our Terms.