Back to Journals » Pediatric Health, Medicine and Therapeutics » Volume 11
High Inequality and Slow Services Improvement in Newborn and Child Health Interventions in Ethiopia
Authors Tola HH ![]() , Gamtesa DF
, Gamtesa DF ![]()
Received 15 October 2020
Accepted for publication 10 December 2020
Published 31 December 2020 Volume 2020:11 Pages 513—523
DOI https://doi.org/10.2147/PHMT.S286652
Checked for plagiarism Yes
Review by Single anonymous peer review
Peer reviewer comments 3
Editor who approved publication: Professor Roosy Aulakh
Habteyes Hailu Tola, Dinka Fikadu Gamtesa
TB/HIV Research Directorate, Ethiopian Public Health Institute, Addis Ababa, Ethiopia
Correspondence: Habteyes Hailu Tola
TB/HIV Research Directorate, Ethiopian Public Health Institute, P.O. Box: 1242, Addis Ababa, Ethiopia
Tel +251 978 641 821
Fax +251 11 2758634
Email [email protected]
Background: In the previous years, efforts have been made to reduce the inequality gap in newborn and child health interventions in Ethiopia. However, there is still limited evidence on the extent and trends of inequality on newborn and child health interventions. Thus, we aimed to assess newborn and child health interventions, inequality levels, and trends during four demographic and health survey periods based on inequality dimensions: economic status, education level, residency, and child’s sex in Ethiopia.
Methods: We conducted an inequality analysis on four periods (2000, 2005, 2011, and 2016) of the Ethiopian Demographic and Health Survey (EDHS) data. We estimated inequality related to economic and education status using percentage, relative concentration index, and slope index, while mean percentage difference and ratio were used to assess inequality due to residency and child’s sex.
Results: The coverage of services was concentrated in the richest quintile, highly educated families, and urban dwellers. Child and newborn health intervention service coverage improvement in the past four survey periods was less than 10.0% for all services, and there is high disparity between sub-national regions. Full immunization-related inequality was highest in Ethiopia compared to four east-central African countries.
Conclusion: Increasing service coverage and improving equitable access to routine immunizations could fill the existing inequality gap while focusing on the underserved group. In addition, strengthening regular monitoring processes is also vital to know those left behind.
Keywords: health inequality, child health interventions, health equity, vaccination, immunization, children
Background
The World Health Organization (WHO) Expanded Programme on Immunization (EPI) has launched in 1974 as a global strategy to reduce newborn and child mortality due to vaccine preventable diseases.1,2 Since then, there has been a tremendous reduction in child mortality resulting from vaccine preventable infectious diseases across the world.3–5 Immunization is an effective intervention to control and eliminate life-threatening infectious diseases such as diphtheria, hepatitis B, measles, mumps, pertussis (whooping cough), pneumonia, polio, rotavirus, rubella, and tetanus.3–5 Immunization prevents between two and three million deaths among children each year from diphtheria, tetanus, pertussis, and measles alone.5 Despite some improvements in global immunization coverage, there remains considerable regional and local inequalities2,6–16 that are due to several reasons such as family-related social and behavioral factors, resources limitation, competing health priorities, poor management, and inadequate monitoring and supervision.2,6–21
Apart from several challenges, inequality in newborn and child health interventions, particularly immunization and vitamin A supplementation, are a major concern impeding developing countries to achieve child health-related desired targets.15–19 Inequality in childhood immunization can be linked to economic status and mother’s education level, place of residence, and child sex.12,15,17–21 For example, full immunization coverage is concentrated in the richest economic quintile.15,18
It is well documented that child immunization has played a significant role in the improvement of newborn and child health in the past decades,1,3–5,22 but the service improvement and the available inequality gap have been less explored in Ethiopia. Moreover, although studies have been reported on inequality related to newborn and child interventions,15–21,23 there is little evidence on the progress achieved in narrowing the disparities between different segments of the population in the past years. The majority of previously reported studies indicated inequality on a single newborn and child health intervention.18 However, there is limited evidence on different newborn and child health interventions inequality gaps using different inequality dimensions. Furthermore, there is limited evidence on newborn and child health interventions at sub-national and sub-regional levels in Ethiopia. Therefore, we aimed: i) to assess inequality in newborn and child health interventions (BCG, DTP3, measles and full immunization, and vitamin A supplementation) coverage and trends across the four survey periods based on economic, education, child sex, and residency dimensions; and ii) to compare inequality between sub-nations within Ethiopia and with countries having comparable health coverage in east-central Africa.
Methods
The main outcomes of our analysis were six newborn and child health intervention indicators: Bacille Calmette Guérin (BCG), diphtheria tetanus, pertussis (DTP3), measles, polio, and full immunization coverage for 1-year-old children, and vitamin A supplementation coverage for children aged 6–59 months. The definition of each selected newborn and child health intervention was adopted from the WHO Handbook on Health Inequality Monitoring24 and given below.
BCG immunization coverage among 1-year-olds: Percentage of 1-year-olds who have received one dose of BCG vaccine.
DTP3 immunization coverage among 1-year-olds: Percentage of 1-year-olds who have received three doses of the combined diphtheria tetanus and pertussis vaccine in a given year.
Full immunization coverage among 1-year-olds: Percentage of 1-year-olds who have received one dose of BCG vaccine, three doses of polio vaccine, three doses of DTP3 vaccine, and one dose of measles vaccine.
Measles immunization coverage among 1-year-olds: Percentage of children aged 12–23 months who have received at least one dose of measles-containing vaccine in a given year.
Polio immunization coverage among 1-year-olds: Percentage of children aged 12–23 months who received at least three doses of polio vaccine.
Vitamin A supplementation among children under 5 years: Proportion of children aged 6–59 months who received a high-dose vitamin A supplement within the 6 months prior to the survey. High-dose vitamin A, according to the International Vitamin A Consultative Group (IVACG) definition, refers to doses equal to or greater than 25,000 international units (IU).
We compared an inequality of these six indicators based on the four inequality dimensions indicated above. We used a publicly available datasets collected in 2000, 2005, 2011, and 2016 for Demographic and Health Survey (DHS) data in Ethiopia. We accessed the data through the World Health Organization (WHO) Health Equity Assessment Toolkit (HEAT) and DHS program.
Data Analysis
We estimated both disaggregated and aggregated mean percentage estimate of newborn and child health intervention indicators coverage with its 95% confidence intervals and Standard Errors (SEs). We also estimated relative aggregated estimates of economic and education inequality with Relative Concentration Index (RCI) and Slope Index (SI). Both RCI and SI of inequality take into account the distribution of wealth and education status of the whole population in the country. The concept of RCI is similar with the Gini index for income distribution.25 It is a relative measure of inequality that shows child and newborn health intervention gradient across multiple subgroups with natural ordering of wealth or education status.24,26,27 It indicates the extent to which a health indicator is concentrated among the disadvantaged or the advantaged subgroups.24,26,27 After a population is ranked by increasing socioeconomic status, the RCI has a negative value when child and newborn health intervention is concentrated among the poor or less educated.24 However, it has a positive value when child and newborn health intervention is concentrated among the rich or more educated.24 When the concentration index is zero, there is no inequality between the subgroups.24
The SI of inequality is used to show the gradient of health across subgroups of wealth and education with natural ordering.24,26,27 It uses a logistic regression model to express the absolute difference in coverage, in percentage points, between the extremes of the wealth and education distribution.24 To calculate the SI of inequality, a weighted sample of the whole population is ranked from the most disadvantaged (poorest or less educated) subgroup to the most advantaged (richest or highly educated).24 This ranking is weighted, while accounting for the proportional distribution of the population within each subgroup. The population of each wealth or education category is then considered in terms of its range in the cumulative population distribution, and the midpoint of this range. The child and newborn health interventions are regressed against this midpoint value for wealth or education subgroups using a logistic regression model, and the predicted values of the child and newborn health interventions are calculated for the two extremes (disadvantaged) and advantaged. The difference between the predicted values of the two extremes generates the SI of inequality value. Thus, the slope index of inequality represents the difference between the lowest and the highest, while considering all other subgroups in the regression. When the SI of inequality is zero, there is no inequality between the subgroups.24 The positive values of the SI of inequality indicate that the advantaged subgroup is more served, whereas negative values indicate that the disadvantaged subgroup is the most served.24
We estimated relative aggregated estimates of place of residency and child sex with mean percentage difference and ratio. Ratio is a simple measure of relative inequality between two subgroups and makes pair-wise comparisons of health indicators between two subgroups. In ratio the mean value of a health indicator in one subgroup is divided by the mean value of that health indicator in another subgroup. We presented both disaggregated and aggregated estimates in tables and graphs to show the inequality on newborn and child health intervention indicators. For the definition, collection and measurements of dimensions (economic status, education level, residence, and child sex), interested readers can refer to the survey reports.28–31 We used WHO HEAT plus software version 1.0 and Stata version 14 to explore and compare newborn and child health intervention indicators inequalities based on the four inequality dimensions mentioned above. Level of significance was set at a P-value less than 0.05.
Ethics
Ethical approval and consent were not sought, because publicly available data was used for the analysis of this study. However, the surveys from which the data was used in the current analysis were ethically approved by the Ethiopian Public Health Institute.
Results
National Coverage
The national coverage of BCG, DTP3, measles, polio, and full immunization were slightly increased across the four survey periods (Figure 1). However, for vitamin A supplement the coverage decreased across the survey periods (Figure 1). Except for BCG immunization the national coverage of newborn and child health interventions coverage were less than 55% in the four survey periods (Figure 1).
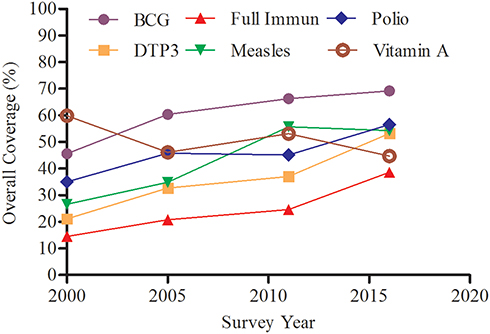 |
Figure 1 Overall national coverage of the six newborn and child health interventions (BCG, DTP3, full immunization, measles, polio, and vitamin A supplement) coverage (%) in Ethiopia in the past three surveys period (2001–2017). |
Economic
Inequality of the six newborn and child health interventions was slightly increased monotonically across the economic quintiles in each survey period (Table 1). All newborn and child health intervention indicators included in this analysis provided a positive slope index of inequality across the survey periods, and the inequality was statistically significant (Table 1). The results from relative concentration index analysis indicated a positive concentration index across the economic quintile, and this inequality was statistically significant (Table 1). In each survey period both slope index and relative concentration index showed a pro-rich inequality for the six newborn and child health intervention indicators included in this analysis. However, the results from both slope index and relative concentration index inequality showed the lowest pro-rich inequality in vitamin A supplement across the survey periods than other interventions (Table 1). Except for vitamin A supplement coverage, the other five newborn and child health intervention indicators coverage inequalities between richest and poorest quintiles were greater than 20% points across the surveys periods (Table 1).
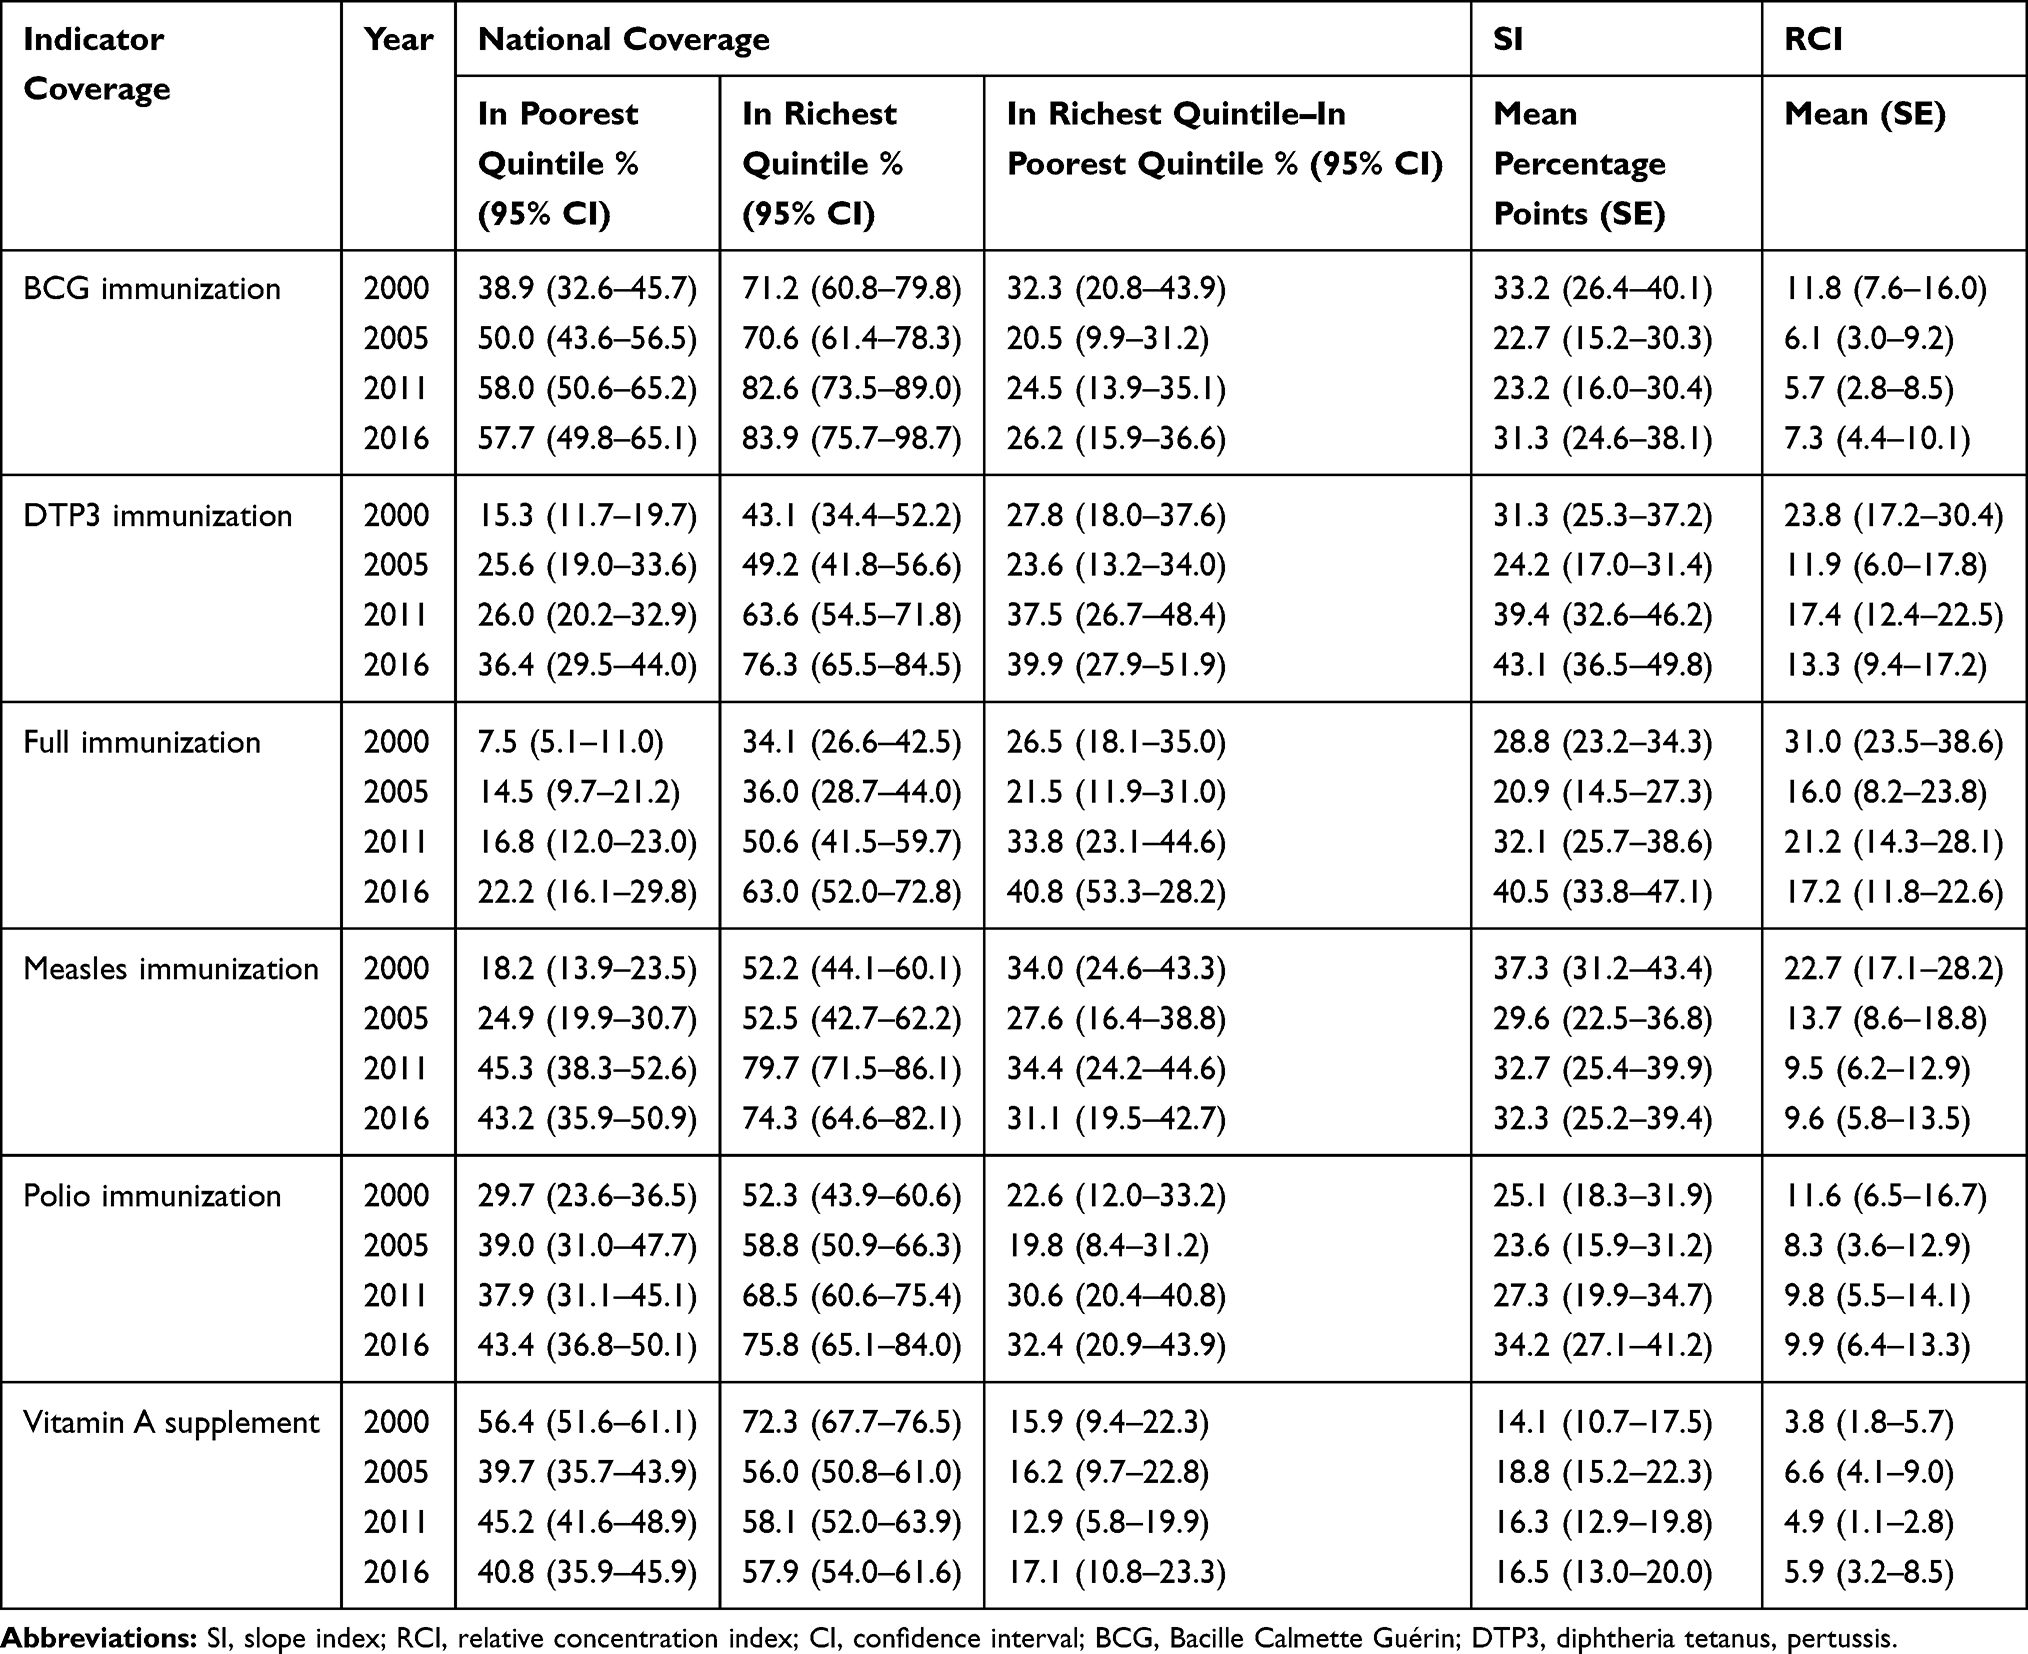 |
Table 1 Percentage of Eligible Children Receiving Newborn and Child Health Interventions Inequalities in Economic Status in Ethiopia (2001–2017) |
Education
Across the education levels the six newborn and child health intervention indicators included in this analysis provided a positive slope index and relative concentration index of inequality that indicated the presence of a pro-educated inequality in coverage, and this inequality was statistically significant (Table 2). The inequality between no education and secondary school or above were greater than 50% for the five newborn and child health interventions included in this analysis across the survey periods. However, for vitamin A supplement the inequality was lower than 50% (Table 2).
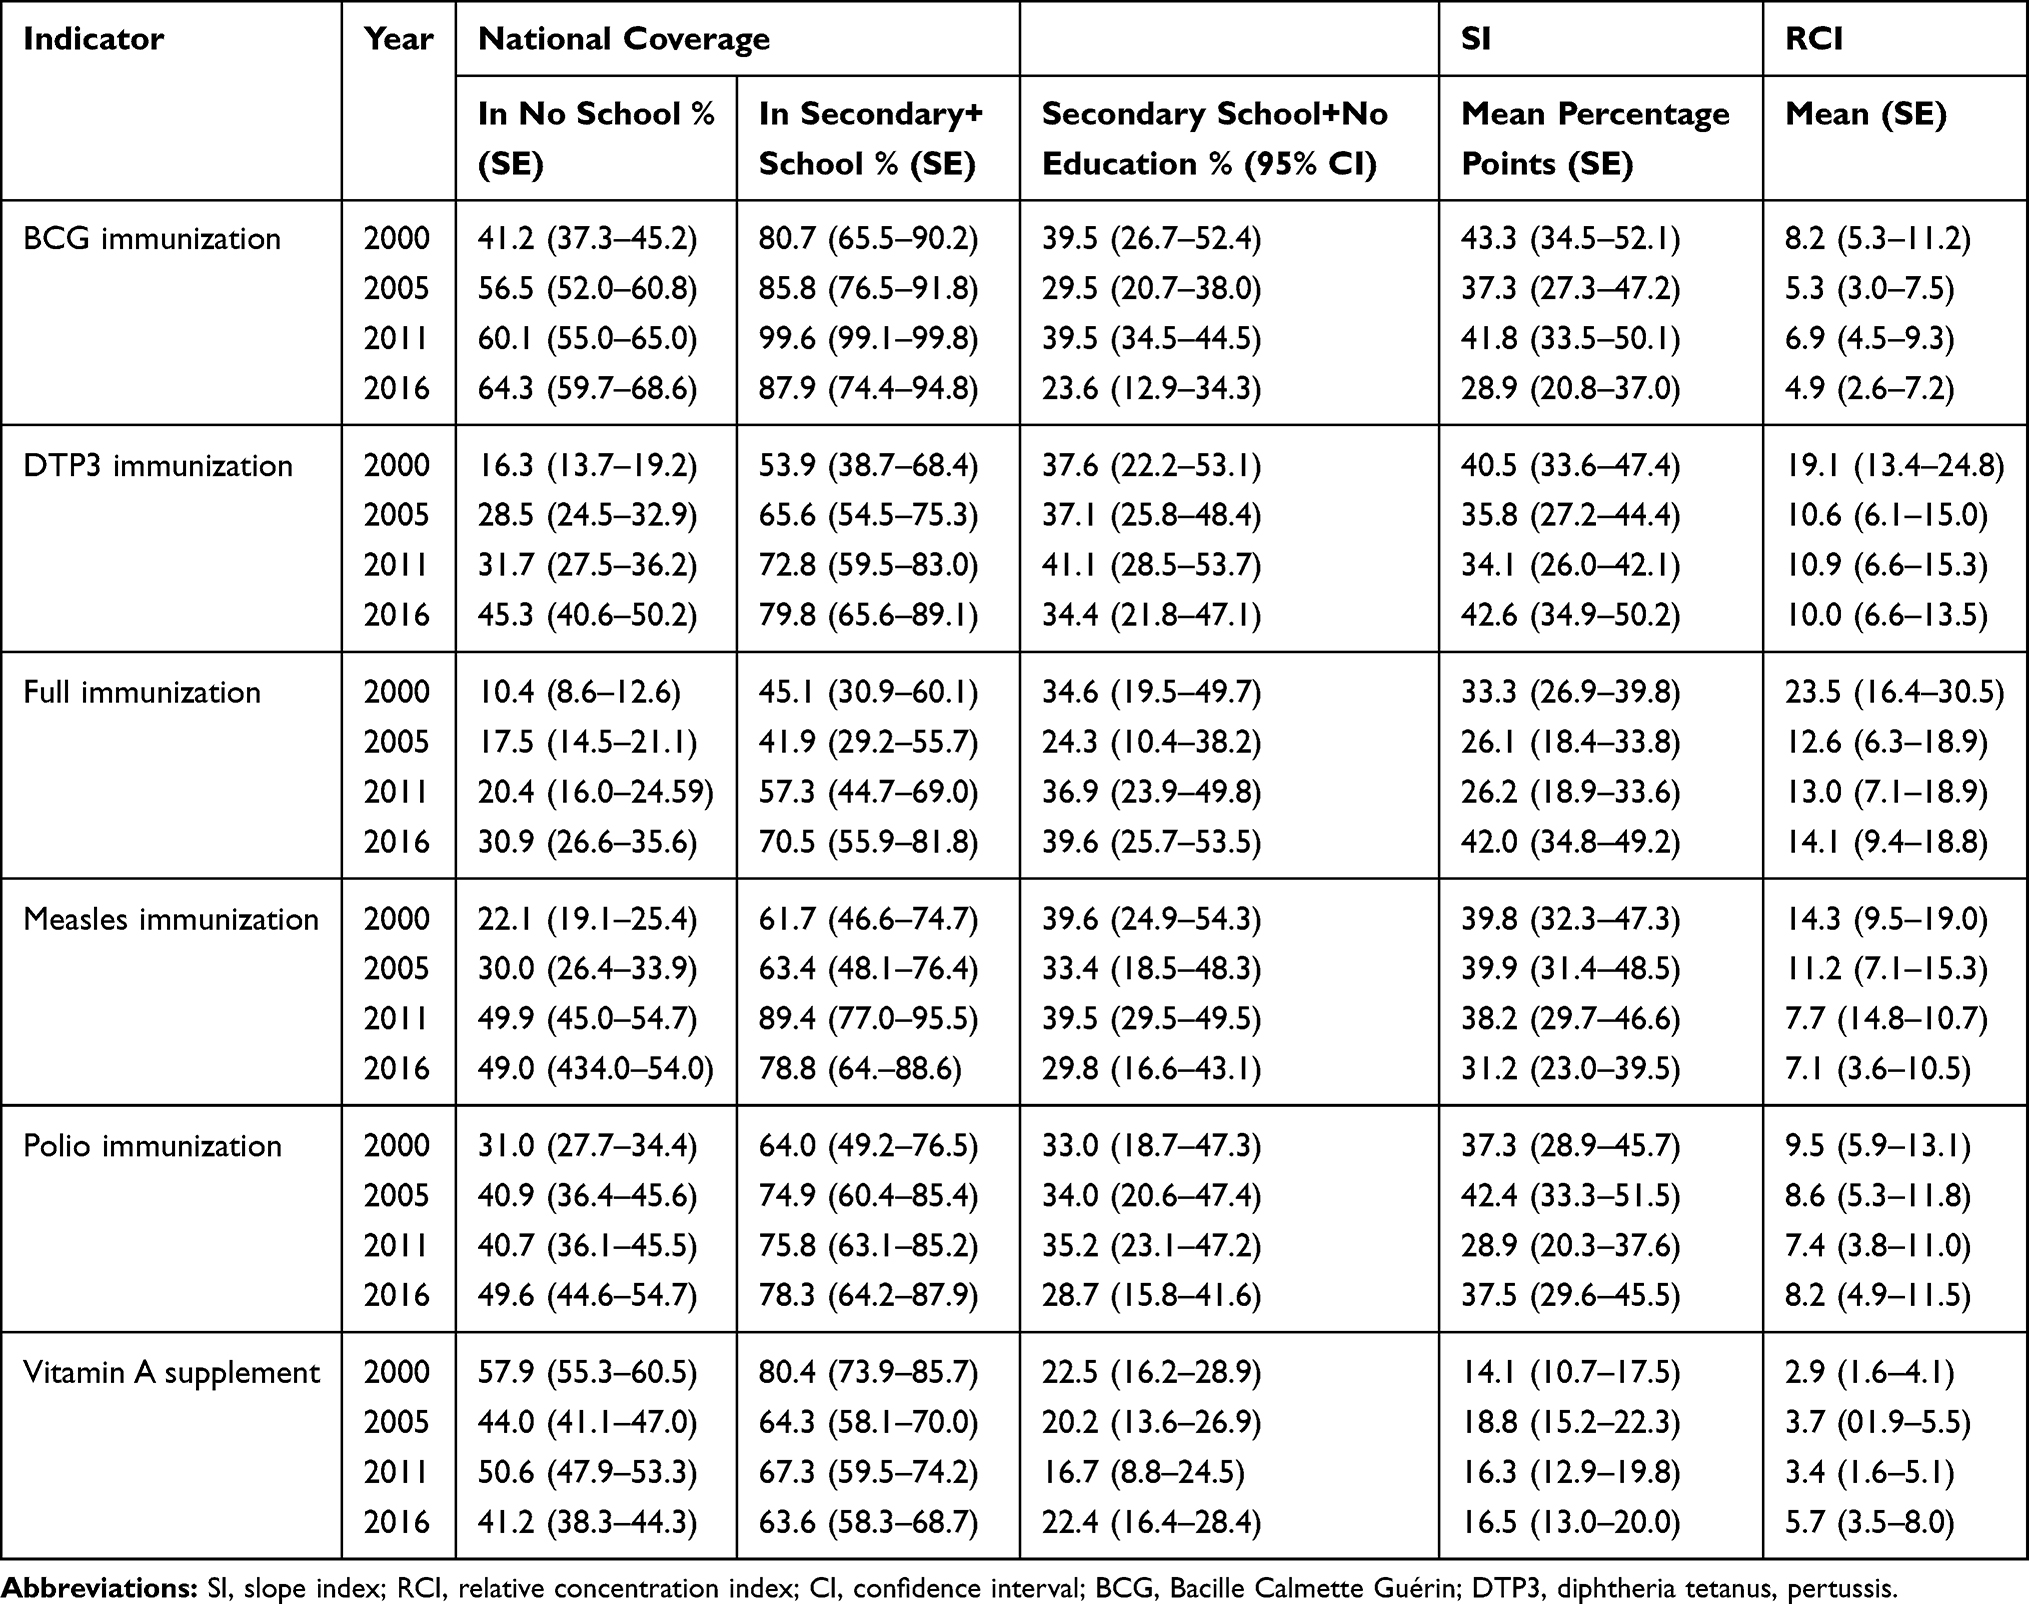 |
Table 2 Percentage of Eligible Children Receiving Newborn and Child Health Interventions Inequalities in Education Status in Ethiopia (2001–2017) |
Residency
Service coverage was increased across the four survey periods for both urban and rural areas equally. The coverage of newborn and child health intervention indicators was higher in urban than rural areas across the survey periods (Table 3). The services coverage was slightly increased over the survey periods for both rural and urban areas. Coverage inequality between urban and rural areas for all newborn and child health intervention indicators included in this analysis showed a significant difference (Table 3). Except for vitamin A, the services coverage between urban and rural areas for five newborn and child health intervention indicators were greater than 25% better in urban than in rural and indicated that the services were pro-urban (Table 3). The inequality in terms of urban-to-rural ratio indicated a higher coverage in urban than in rural areas (Table 3). The highest inequality was shown on full immunization coverage which was more than 3.0-times higher in urban than in rural areas across the survey periods, while the lowest inequality was shown for vitamin A supplement coverage (Table 3).
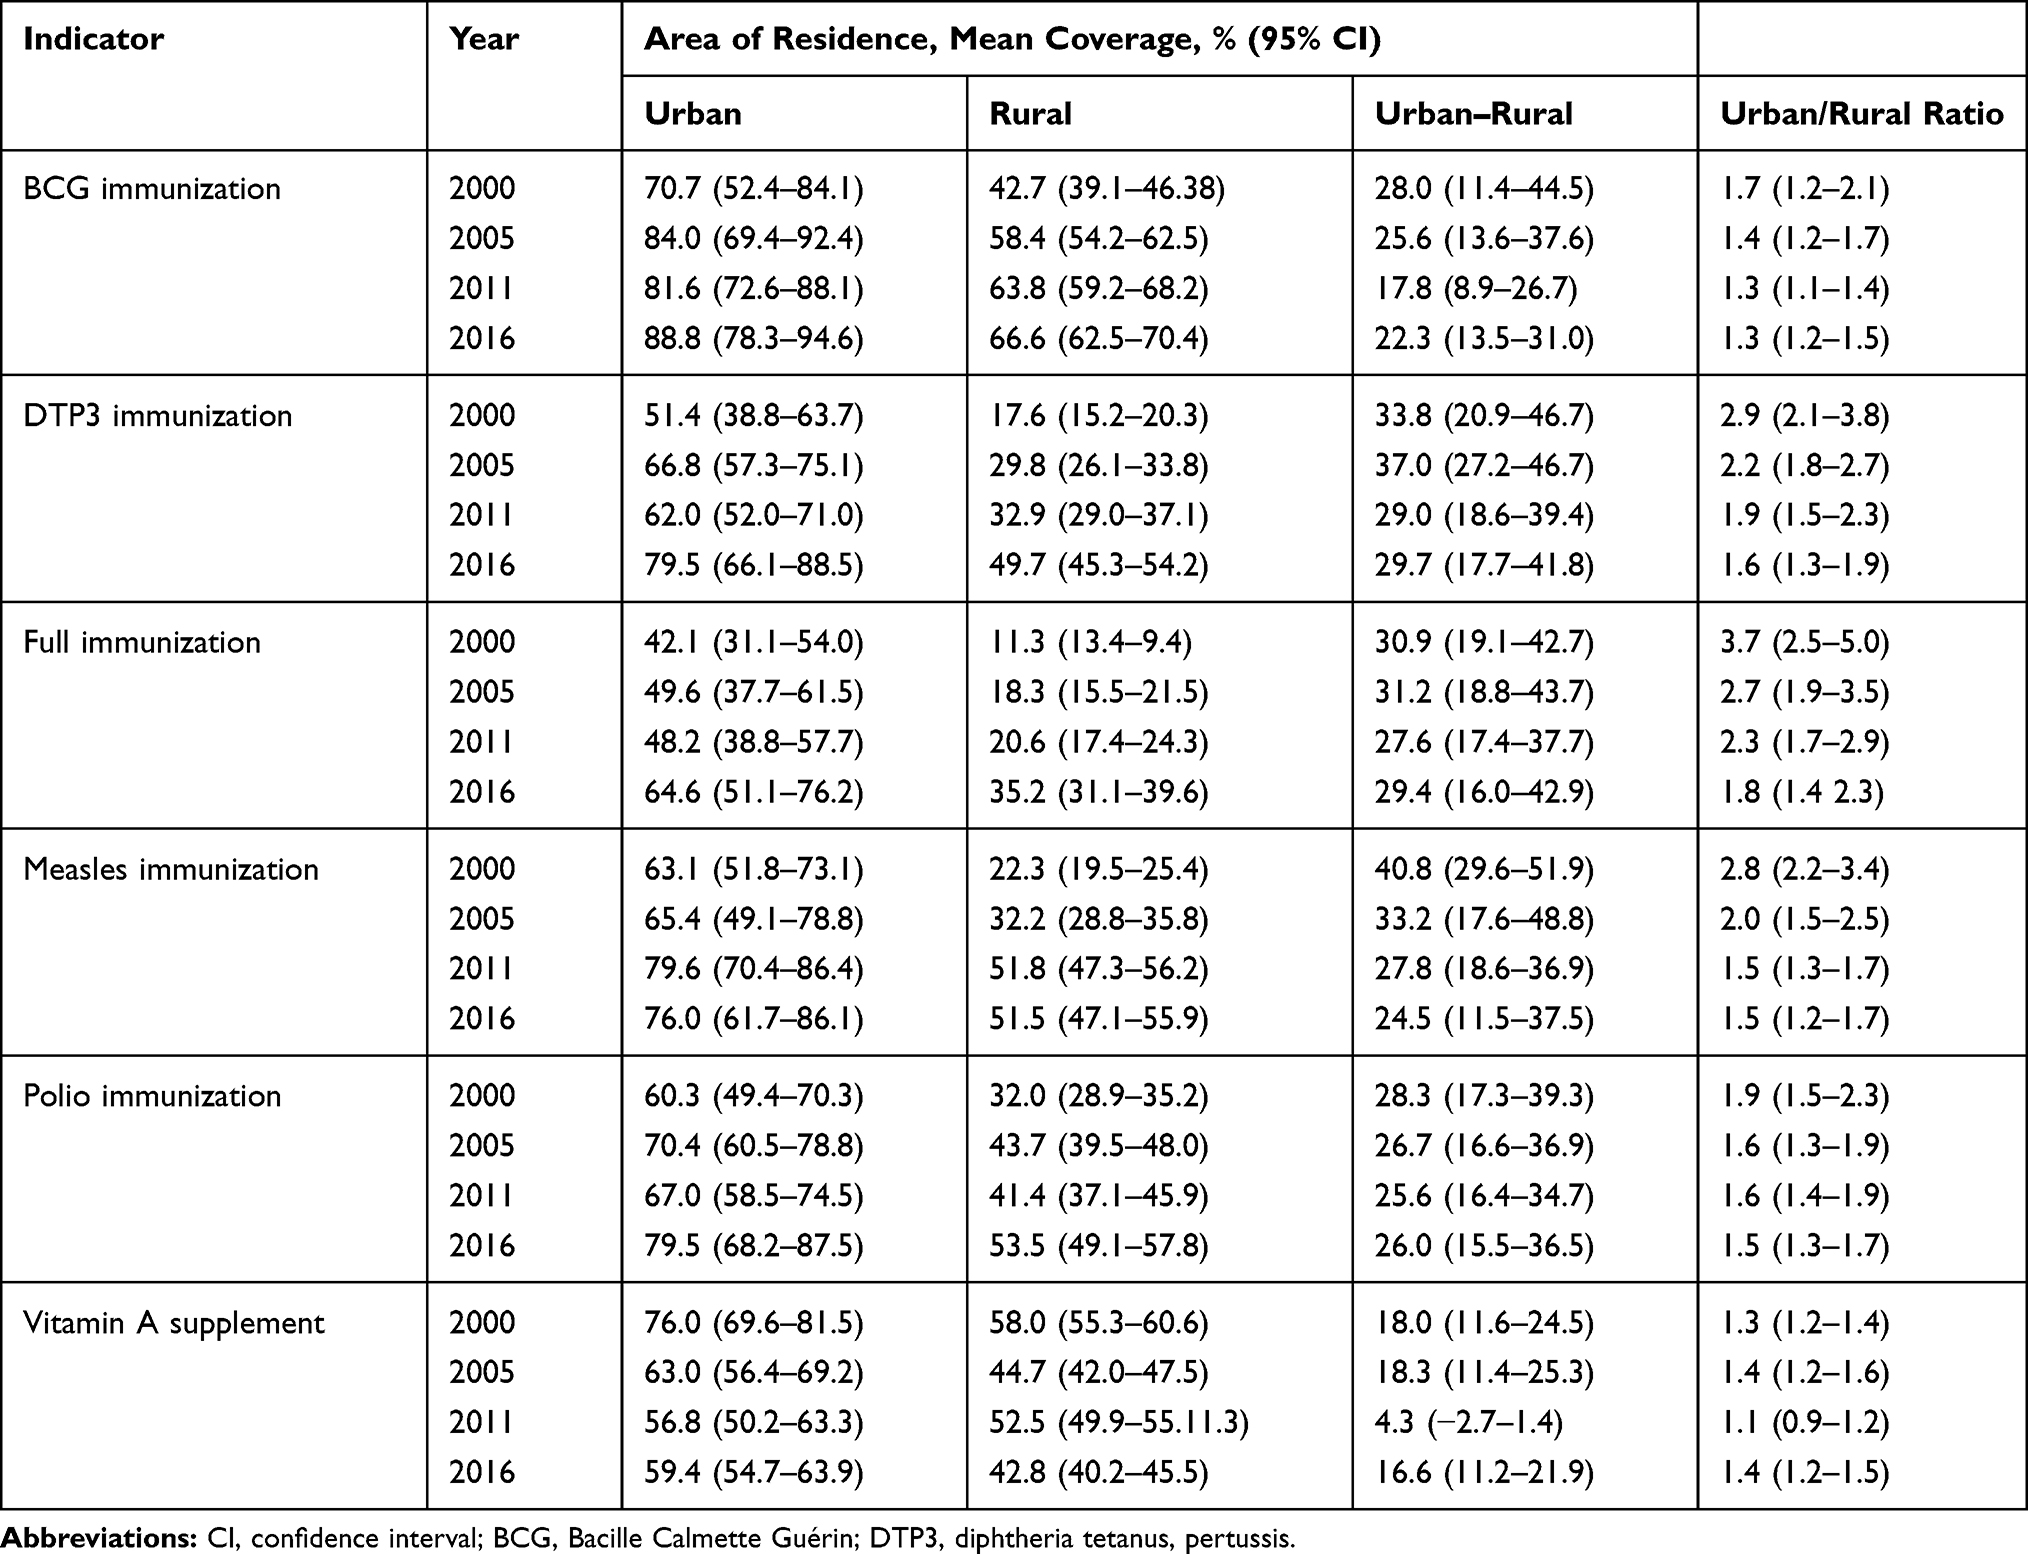 |
Table 3 Percentage of Eligible Children Receiving Newborn and Child Health Interventions Inequalities in Coverage in Place of Residence in Ethiopia (2001–2017) |
Child Sex
Service coverage was increased across the four survey periods for both boys and girls. Child sex-related inequality on services coverage was less than five percentage points, and the differences were not statistically significant for all services. In terms of boy-to-girl ratio, there was no significant inequality on services coverage across the survey periods, and the ratio was approximately one-to-one for all newborn and child health intervention indicators.
Sub-National Coverage
Table 4 depicts the six-newborn and child health interventions coverage inequalities in nine regional states and two city administrations under Ethiopian federal government jurisdiction. The highest newborn and child health interventions coverage was found in Addis Ababa city, followed by Dire Dawa city administration and Tigray region across the survey periods. The lowest coverage across the survey periods for all services was found in Afar and Somali regions (Table 4). BCG vaccination and vitamin A supplement coverage were more highly covered than other services across all sub-national regions in the survey periods (Table 4). In most regions the services coverage were less than 50%, except in Addis Ababa city, Tigray regional state, Dire Dawa city, and Harari region (Table 4). Although the coverage was increased across the survey periods for most sub-national regions, the increment was ≤10.0%, and the inequality was constantly high over the survey periods (Table 4). The coverage inequality between regions with highest (Addis Ababa) and lowest (Afar) coverage was more than 70.0% for most of the newborn and child health interventions across the survey periods. In addition, there was no significant decrease in inequality in newborn and child health intervention in the survey periods in most of the country’s sub-national regions.
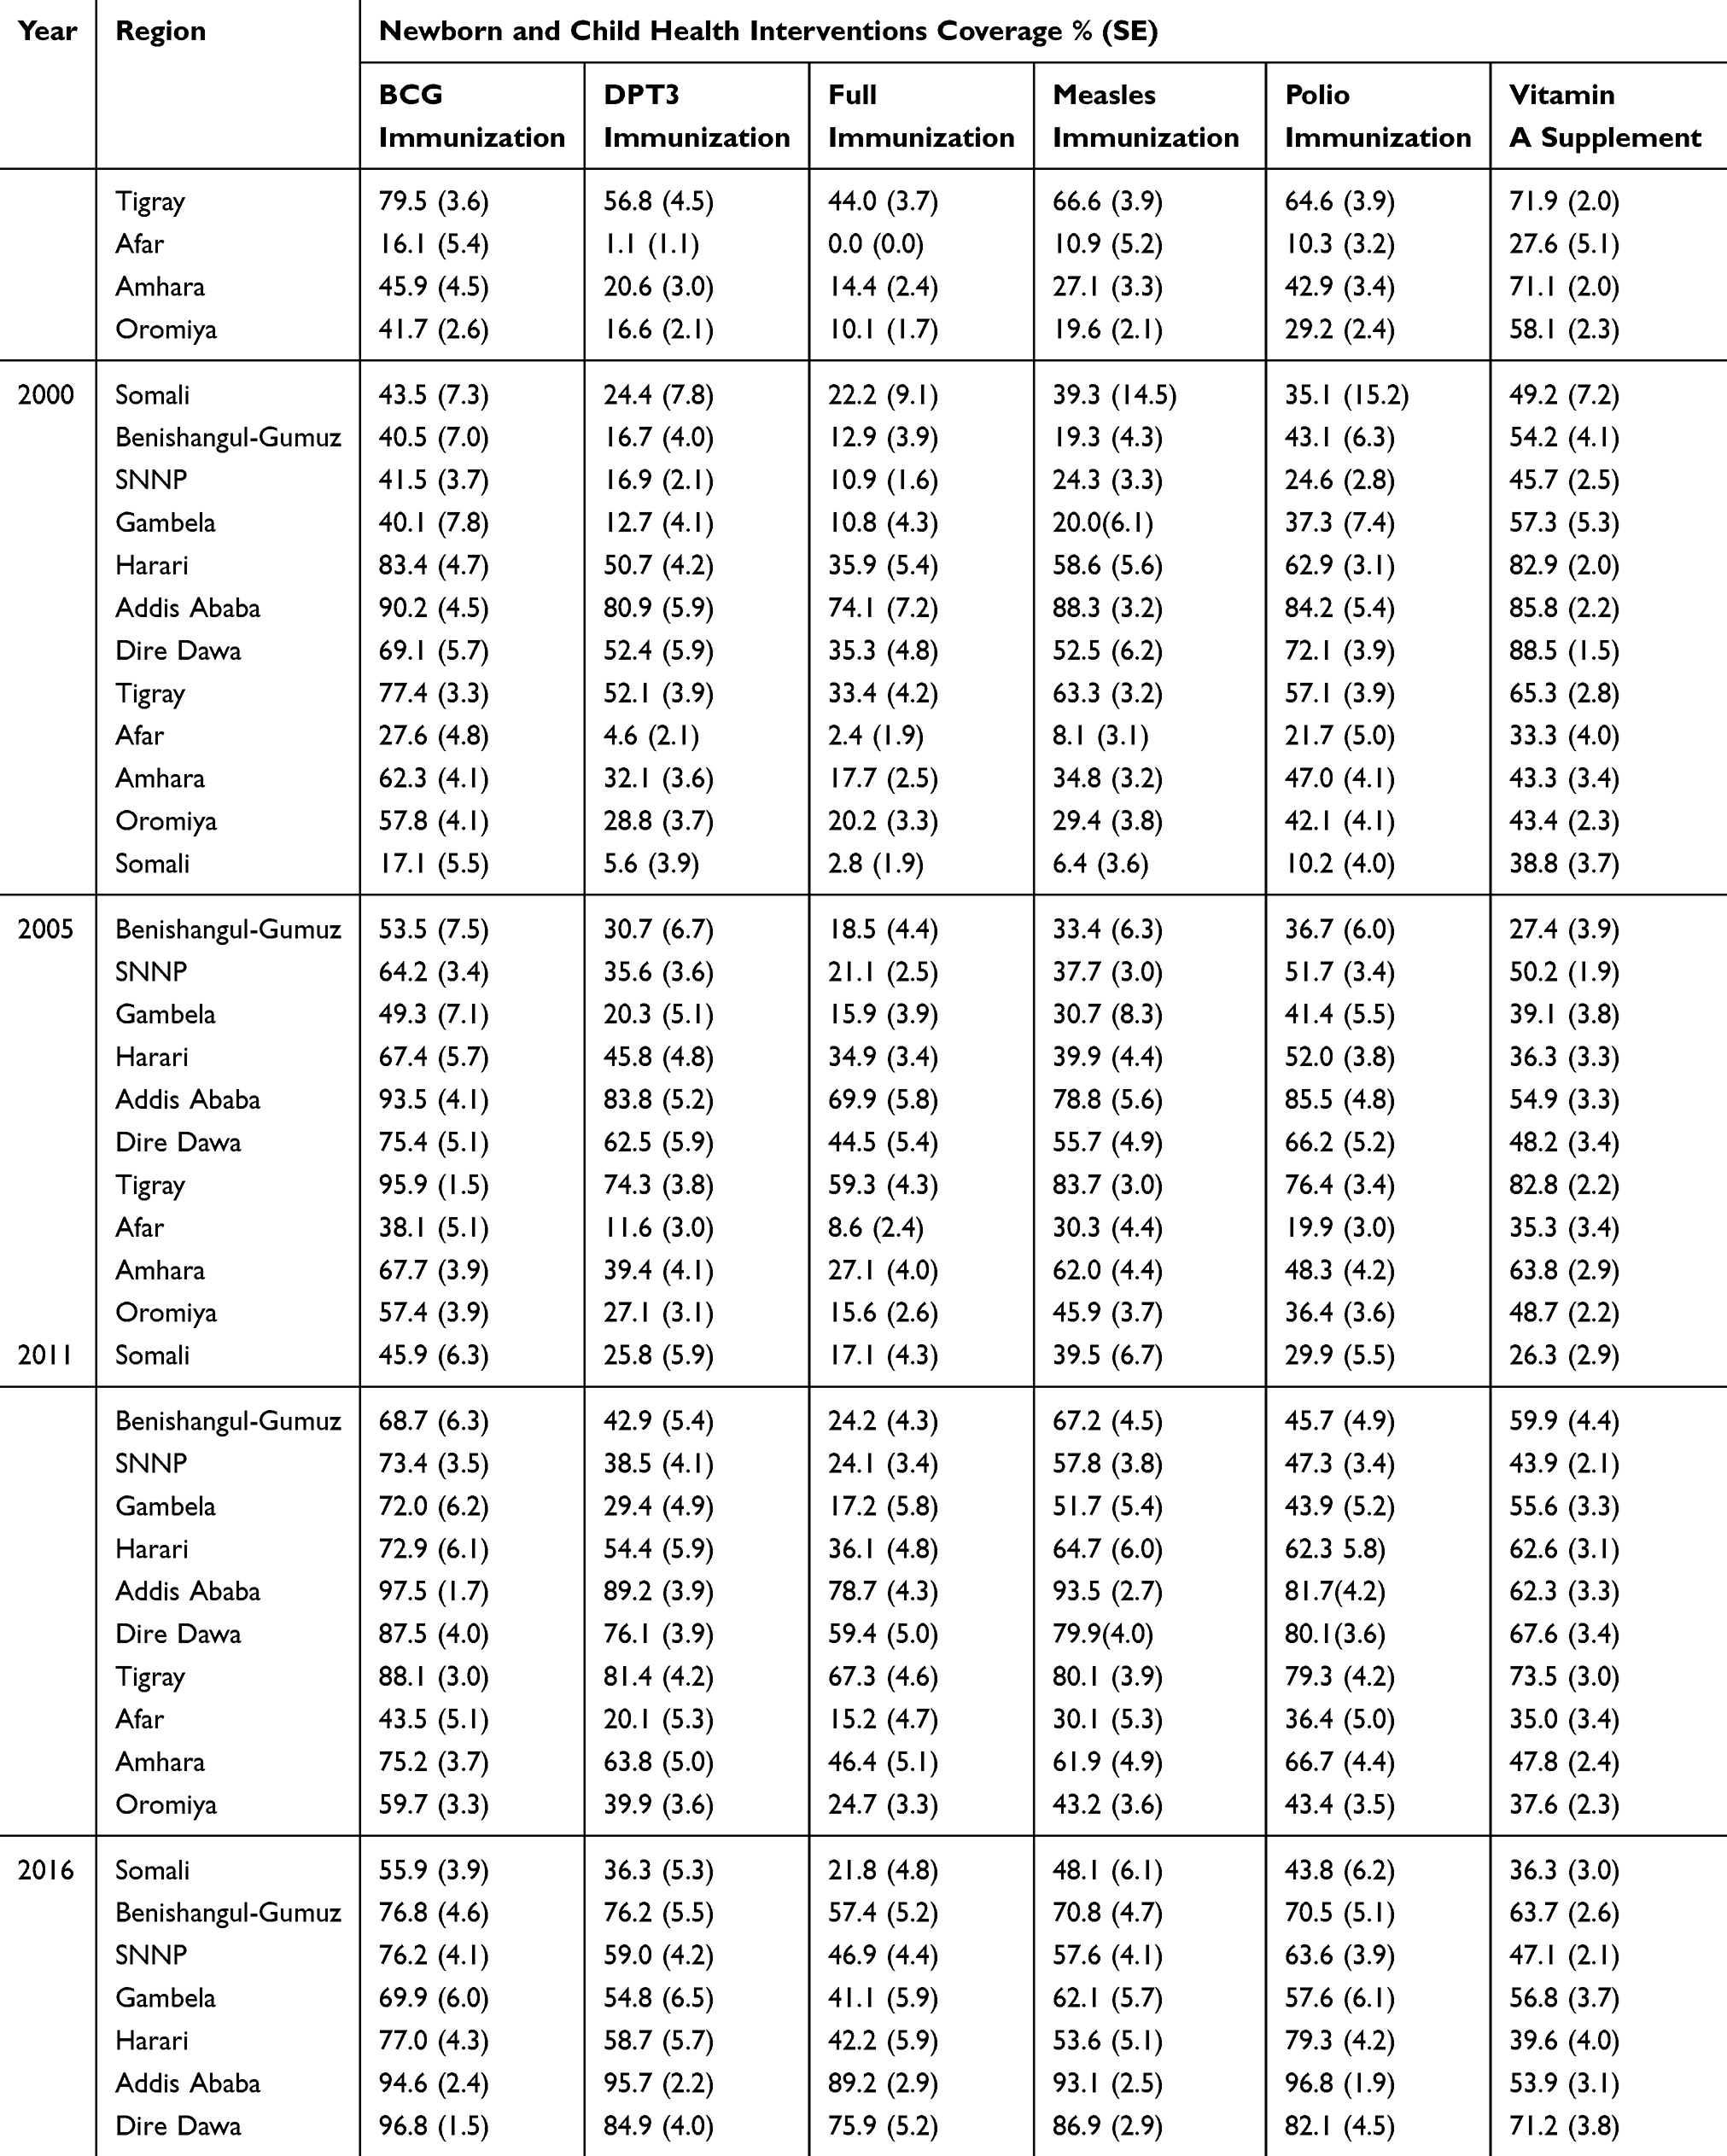 |
Table 4 Percentage of Eligible Children Receiving Newborn and Child Health Interventions Sub-National Coverage in Ethiopia (2001–2017) |
Comparison with Four African Countries
We compared inequality on one newborn and child health intervention (full immunization) for the most recent year (2016) survey data in Ethiopia with four east-central African countries with their recent survey years (2014, 2015, and 2016). The countries we compared were: Burundi, Rwanda, Uganda, and the United Republic of Tanzania (Figure 2). An aggregated estimate of full immunization inequality was highest in Ethiopia than other four countries based on economic status, education level, and place of residency (Figure 2). Full immunization coverage among 1-year-old children was lower in Ethiopia than the four countries compared (Figure 2).
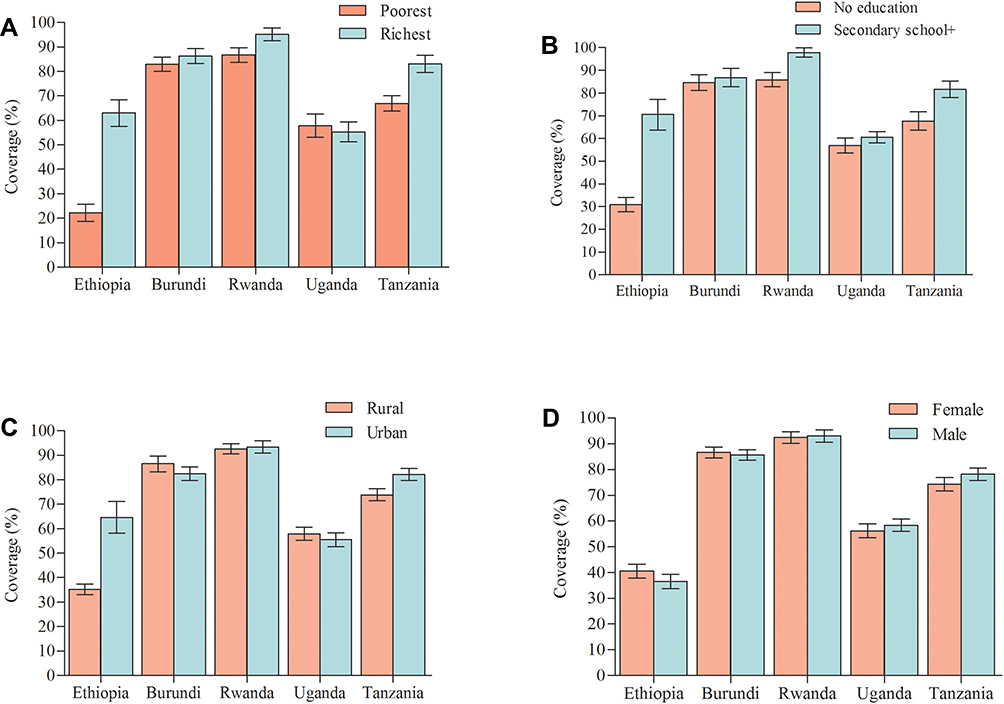 |
Figure 2 Full immunization coverage among 1-year old children (%): (A) economic status; (B) education level; (C) place of residence; and (D) child sex in five countries (error bars are standard errors). |
Discussion
The present study is reporting the results of inequality on six newborn and child health intervention indicators based on four inequality dimensions: economic status, education level, child sex, and place of residency on the four periods (2000, 2005, 2011, and 2016) of Ethiopian demographic and health surveys (DHS) data. The current study findings indicated that newborn and child health intervention indicators: BCG immunization, DTP3 immunization, measles immunization, polio immunization, and full immunization, and vitamin A supplement coverage were slightly increased over the four survey periods in all inequality dimensions. There was also considerable service coverage inequality between economic quintiles, education levels, and place of residence in each survey period. In addition, the current analysis indicated that there is high inequality between sub-national regions. Compared to four east-central African countries, the overall full immunization inequality was significantly higher in Ethiopia. In addition, full immunization coverage was also significantly lower than the four east-central African countries compared.
Despite the fact that services coverage was slightly increased across the survey periods, the inequality gap was significantly different between economic quintiles and education levels. This indicated that children from poor and uneducated families are still depraved. The present analysis finding is comparable with previously reported studies.15,18,20 The expansion of newborn and child health interventions was similar across the economic quintile and education level over the survey periods. This indicated that the service improvement which happened over the four survey periods was similar for lower and higher economic quintiles and for lower and higher education levels. These findings were contradicted by a previously reported study in which service expansion was pro-poor.18 This difference occurred most probably due to analysis and interpretation techniques used. Moreover, the overall newborn and child health intervention services coverage was pro-rich and pro-educated in Ethiopia. This might be due to several reasons. The main possible reason could be poor people might be spending more time on income making opportunities rather than accessing the services.13 Health-seeking attitudes and practices of poor and less educated people might also have contributed to the observed inequality. Health facility waiting time and indirect costs which accumulated for travel to immunization centers might be possible factors that could hinder service-seeking behavior, hence leading to inequality. In addition, health facility and vaccine access and poor management are most probably among other possible explanations. Available evidence also indicates that mother’s education might be one of the main factors affecting health services utilization behavior which, in turn, leads to inequality in immunization.12
A study reported from India indicated that females are less immunized than male children.20 In contrast, in the present study, there is no significant difference between girls and boys immunization status in Ethiopia. This difference might be due to the study population and socioeconomic difference between the two countries. A previous study reported from Ethiopia indicated that there was no significant difference inequality between girls and boys on full immunization.18 This finding is similar with the present study results.
The present study finding showed that children residing in rural areas remain under coverby the six newborn and child health interventions in Ethiopia. These findings were similar with previous study findings in which disparities of the service coverage were observed between urban and rural children.18,20
In the current study newborn and child health interventions inequality was high between sub-national regions in the country. The services inequality between highest and lowest covered regions was 70.0% for most of the services included in the present analysis, and the services coverage improvement across the survey period was low. These indicate that the six newborn and child health intervention indicators require more attention in order to minimize the existing inequality. In addition, services improvement in the last four survey periods were less than 10.0% for most of the interventions. These results show that a huge investment is required in the country to reach underserved sub-national regions.
Full immunization inequality between economic quintiles, education levels, and place of residence was high in Ethiopia compared with four east-central African countries. The possible explanation of this disparity could be population size, economic status, sociocultural factors, amount invested, and rural population proportion (nearly 85% of Ethiopian resides in rural area)28–31 between Ethiopia and the countries used for comparison. This indicates that newborn and child health interventions inequality in Ethiopia requires elevated efforts to minimize the gap.
The main limitation of this study was that we used only three summary measures of inequality (RCI, SI, and difference) for economic and education dimensions, while available evidence recommend the importance of a combination of inequality measures are more comprehensive than only relative measures. In addition, we only presented the comparison result of one newborn and child health intervention (full immunization) in Ethiopia with other countries, this might limit the comprehensiveness of this analysis results.
Conclusion
There is high inequality in newborn and child health intervention indicators in terms of economic status, education level, and residency. Newborn and child health interventions coverage in Ethiopia was less than 55% across the four survey periods for most of the indicators. Full immunization inequality was higher in Ethiopia than east-central African countries. Increasing service coverage and improving equity access to routine immunizations could fill the existing inequality. Strengthening regular monitoring processes of immunization coverage is also vital to identify those left behind.
Acknowledgment
The authors acknowledge the contribution of World Health Organization and DHS Program for the provision of data access.
Disclosure
The authors report no conflicts of interest for this work.
References
1. Keja K, Chan C, Hayden G, Henderson R. Expanded programme on immunization. World Heal Stat Q. 1988;41(2):59–63.
2. Delamonica E, Minujin A, Gulaid J. Monitoring equity in immunization coverage. Bull World Heal Organ. 2005;83:384–391.
3. World Health Oeganization. Vaccines and diseases [Internet]. Geneva; 2019. Available from: https://www.who.int/immunization/diseases/en/.
4. World Health Organization. Immunization Agenda 2030: a global strategy to leave no one behind: edited draft for the WHA [Internet]. Geneva, Switzeland; 2020. Available from: https://www.who.int/immunization/IA2030_draft_4_WHA.pdf?ua=1.
5. World Health Organization. Immunization fact sheet [Internet]. Geneva, Switzeland; 2018 [
6. Akseer N, Bhatti Z, Rizvi A, Salehi AS, Mashal T, Bhutta ZA. Coverage and inequalities in maternal and child health interventions in Afghanistan. BMC Public Health. 2016;16(Suppl 2):797. doi:10.1186/s12889-016-3406-1
7. Ambel AA, Andrews C, Bakilana AM, Foster EM, Khan Q, Wang H. Examining changes in maternal and child health inequalities in Ethiopia. Int J Equity Heal. 2017;16:152. doi:10.1186/s12939-017-0648-1
8. Amouzou A, Jiwani SS, Da Silva IC, et al. Closing the inequality gaps in reproductive, maternal, newborn and child health coverage: slow and fast progressors. BMJ Glob Heal. 2020;5(1).
9. Banerjee J, Shitole T, Deshmukh P. Child health and immunization status in an unregistered Mumbai Slum.
10. Barros AJD, Ronsmans C, Axelson H, et al. Equity in maternal, newborn, and child health interventions in Countdown to 2015: a retrospective review of survey data from 54 countries. Lancet. 2015;379(9822):1225–1233. doi:10.1016/S0140-6736(12)60113-5
11. Barros JD, Victora CG. Measuring coverage in MNCH: determining and interpreting inequalities in coverage of maternal, newborn, and child health interventions. PLoS Med. 2013;10(5):e1001390. doi:10.1371/journal.pmed.1001390
12. Egondi T, Oyolola M, Mutua MK, Elung P. Determinants of immunization inequality among urban poor children: evidence from Nairobi ’ s informal settlements. Int J Equity Health. 2015;14:24. doi:10.1186/s12939-015-0154-2
13. Faye CM, Wehrmeister FC, Melesse DY, et al. Large and persistent subnational inequalities in reproductive, maternal, newborn and child health intervention coverage in sub- Saharan Africa. BMJ Glob Heal. 2020;5:e002232. doi:10.1136/bmjgh-2019-002232
14. Keats EC, Akseer N, Bhatti Z, et al. Assessment of inequalities in coverage of essential reproductive, maternal, newborn, child, and adolescent health interventions in Kenya. JAMA Netw Open. 2018;1(8):e185152. doi:10.1001/jamanetworkopen.2018.5152
15. Restrepo-méndez MC, Barros JD, Wong LM, Johnson HL, Pariyo G. Inequalities in full immunization coverage: trends in low- and middle- income countries. Bull World Heal Organ. 2016;94(August):794–805A. doi:10.2471/BLT.15.162172
16. Soura AB, Mberu B, Elungata P, Lankoande B, Millogo R. Understanding inequities in child vaccination rates among the urban poor: evidence from nairobi and ouagadougou health and demographic surveillance systems. Urban Health. 2014;92(1):39–54. doi:10.1007/s11524-014-9908-1
17. Hajizadeh M. Socioeconomic inequalities in child vaccination in low/middle-income countries: what accounts for the differences? Epidemiol Community Heal. 2018;72:719–725. doi:10.1136/jech-2017-210296
18. Lakew Y, Bekele A, Biadgilign S. Factors influencing full immunization coverage among 12–23 months of age children in Ethiopia: evidence from the national demographic and health survey in 2011. BMC Public Health. 2015;15(1):728. doi:10.1186/s12889-015-2078-6
19. Lauridsen J, Pradhan J. Socio-economic inequality of immunization coverage in India. Health Econ Rev. 2011;1(1):11. doi:10.1186/2191-1991-1-11
20. Prusty RK, Kumar A. Socioeconomic dynamics of gender disparity in childhood immunization in India, 1992 – 2006. PLoS One. 2014;9(8):e104598. doi:10.1371/journal.pone.0104598
21. Singh PK. Trends in child immunization across geographical regions in India: focus on urban-rural and gender differentials. PLoS One. 2013;8(9):e73102. doi:10.1371/journal.pone.0073102
22. World Health Organization/UNICEF. Progress and challenges with achieving universal immunization coverage 2018: WHO/UNICEF estimates of national immunization coverage [Internet]. Geneva, Switzeland; 2019. Available from: https://www.who.int/immunization/monitoring_surveillance/who-immuniz.pdf?ua=1.
23. Chang BAY, Riumallo-herl C, Perales NA, et al. The equity impact vaccines may have on averting deaths and medical impoverishment in developing countries. Health Aff. 2018;37(2):316–324. doi:10.1377/hlthaff.2017.0861
24. World Health Organization. Handbook on health inequality monitoring with a special focus on low- and middle-income countries. Geneva, Switzeland: WHO Press [Internet]; 2013. Available from: http://apps.who.int/iris/bitstream/10665/85345/1/9789241548632_eng.pdf.
25. Wagstaff A, Paci P, van Doorslaer E. On the measurement of inequalities in health. Soc Sci Med. 1991;33(3):545–557. doi:10.1016/0277-9536(91)90212-U
26. Bleichrodt H, Van Doorslaer E. A welfare economics foundation for health inequality measurement. J Heal Econ. 2006;25:945–957. doi:10.1016/j.jhealeco.2006.01.002
27. Hosseinpoor AR, Bergen N, Grove J. Measuring health inequalities in the context of sustainable development goals. Bull World Heal Organ. 2018;96:654–659. doi:10.2471/BLT.18.210401
28. Central Statistical Authority (CSA) [Ethiopia] and ORC Macro. Ethiopia demographic and health survey 2000. Addis Ababa, Ethiopia and Calverton, Maryland, USA: Central Statistical Authority and ORC Macro [Internet]. Addis Ababa, Ethiopia; 2001. Available from: http://www.dhsprogram.com/pubs/pdf/FR118/FR118.pdf.
29. Central Statistical Agency (CSA) [Ethiopia] and ORC Macro. Ethiopia demographic and health survey 2005. Addis Ababa, Ethiopia and Calverton, Maryland, USA: Central Statistical Agency and ORC Macro [Internet]. Addis Ababa, Ethiopia; 2006. Available from: http://www.dhsprogram.com/pubs/pdf/FR179/FR179%5B2.
30. Central Statistical Agency (CSA) [Ethiopia] and ICF. Ethiopia demographic and health survey 2011. Addis Ababa, Ethiopia and Calverton, Maryland, USA: Central Statistical Agency and ICF. [Internet]. Addis Ababa, Ethiopia; 2012. Available from: https://dhsprogram.com/pubs/pdf/FR255/FR255.pdf.
31. Central Statistical Agency (CSA) [Ethiopia] and ICF. Ethiopia demographic and health survey key findings. Addis Ababa, Ethiopia, and Rockville, Maryland, USA. CSA and ICF [Internet]; 2017. Available from: https://dhsprogram.com/pubs/pdf/SR241/SR241.pdf.
 © 2020 The Author(s). This work is published and licensed by Dove Medical Press Limited. The
full terms of this license are available at https://www.dovepress.com/terms
and incorporate the Creative Commons Attribution
- Non Commercial (unported, 3.0) License.
By accessing the work you hereby accept the Terms. Non-commercial uses of the work are permitted
without any further permission from Dove Medical Press Limited, provided the work is properly
attributed. For permission for commercial use of this work, please see paragraphs 4.2 and 5 of our Terms.
© 2020 The Author(s). This work is published and licensed by Dove Medical Press Limited. The
full terms of this license are available at https://www.dovepress.com/terms
and incorporate the Creative Commons Attribution
- Non Commercial (unported, 3.0) License.
By accessing the work you hereby accept the Terms. Non-commercial uses of the work are permitted
without any further permission from Dove Medical Press Limited, provided the work is properly
attributed. For permission for commercial use of this work, please see paragraphs 4.2 and 5 of our Terms.