Back to Journals » Diabetes, Metabolic Syndrome and Obesity » Volume 13
High Glucose Downregulates Connexin 43 Expression and Its Gap Junction and Hemichannel Function in Osteocyte-like MLO-Y4 Cells Through Activation of the p38MAPK/ERK Signal Pathway
Authors Yang L, Zhou G, Li M, Li Y, Yang L, Fu Q ![]() , Tian Y
, Tian Y
Received 25 November 2019
Accepted for publication 16 February 2020
Published 26 February 2020 Volume 2020:13 Pages 545—557
DOI https://doi.org/10.2147/DMSO.S239892
Checked for plagiarism Yes
Review by Single anonymous peer review
Peer reviewer comments 2
Editor who approved publication: Prof. Dr. Antonio Brunetti
Lei Yang,1 Guangping Zhou,2 Mingyang Li,1 Yan Li,1 Liqing Yang,1 Qin Fu,1 Ye Tian1
1Orthopedics Department, Shengjing Hospital of China Medical University, Shenyang, Liaoning Province, People’s Republic of China; 2Orthopedics Department, Shenyang Orthopedics Hospital, Shenyang, Liaoning Province, People’s Republic of China
Correspondence: Qin Fu Tel +86-18940251086
Email [email protected]
Purpose: Osteocyte network structure correlates with bone material quality. This network is profoundly altered in diabetic mice; however, the underlying mechanisms are unknown. The gap junction protein connexin 43 (Cx43) is necessary for normal osteocyte function and osteocyte network formation. Here, we evaluated Cx43 expression in patients with diabetes, the effect of high glucose on Cx43 expression, and the function of Cx43 gap junctions and hemichannels in osteocyte-like MLO-Y4 (MLO-Y4) cells.
Patients and Methods: Human cortical bone samples were obtained from patients with or without type II diabetes mellitus (T2DM) who underwent arthroplasty surgery to treat osteoporosis-induced femoral neck fracture.Cx43 expression was quantified in human cortical bone samples from both groups of patients and MLO-Y4 cells. The functions of Cx43 gap junctions and hemichannels in MLO-Y4 cells were evaluated using dye transfer and dye uptake assays, respectively. Furthermore, we evaluated levels of membrane Cx43 (mCx43), the functional form, and p38MAPK/ERK1/2 signaling, which is involved in mCx43 internalization, to characterize the mechanism of decreased Cx43 expression and gap junctions and hemichannels function.
Results: Osteocyte Cx43 expression was decreased in femoral neck cortical bone samples of patients with T2DM patients compared with the non-diabetic control group. In addition, Cx43 expression was decreased in MLO-Y4 cells treated with high glucose. The functions of Cx43 gap junctions and hemichannels were inhibited in MLO-Y4 cells treated with high glucose. mCx43 expression was decreased in response to activation of p38-MAPK/ERK signaling. Inhibition of the p38-MAPK/ERK pathway partially reversed the decreases in Cx43 hemichannels and gap-junctions function.
Conclusion: High glucose dampened Cx43 gap junction and hemichannel function in MLO-Y4 cells by activating the p38MAPK/ERK pathway leading to subsequent mCx43 internalization.
Keywords: high glucose, osteocyte, connexin 43, gap junction, hemichannel
Introduction
Patients with type 2 diabetes mellitus (T2DM) are at increased risk for bone fracture independent of bone mineral density (BMD).1,2 Recent studies focused on bone structure quality have shown that trabecular and cortical bone microstructure are more fragile in patients with T2DM.3–6 These findings have led to increased interest in the mechanisms of T2DM-induced bone microstructure damage, with the goal of developing new treatments for T2DM-induced osteoporosis.
Cortical bone is the main body weight support and the determining factor in bone strength. More than 90% of body weight is supported by cortical bone, and over 75% of fractures occur in cortical bones.7 Increased cortical porosity and cracking have been observed in patients with T2DM and in mouse models of the disease.6,8,9
Osteocytes are the most abundant cells in cortical bone. Historically, osteocytes were considered inactive with no apparent function. However, recent studies have shown that they can form complex networks with neighboring osteocytes, osteoblasts, osteoclasts, and human bone marrow stromal cells (hBMCS) via their long dendritic processes.10,12 These results indicated that osteocytes may be central to bone modeling and remodeling by orchestrating various bone cell functions.13,14 In addition, osteocytes are the primary responders to mechanical force changes and can translate these into chemical signals for transmission through the osteocyte network.12 Interestingly, the osteocyte network is profoundly altered in diabetic mice compared with wild-type mice.15,16 These findings suggest that osteocytes are involved in diabetic cortical bone fragility.17
Gap junction channels in bone were first described in the early 1970s and are present in osteoclasts, osteoblasts, and osteocytes. Connexin 43 (Cx43) is the most abundant gap junction-forming protein expressed in bone, and it can form these channels on the tops of dendritic processes to mediate intercellular communication.18 Cx43 can also form hemichannels on the cell surfaces of osteocytes and mediate communication between the intra- and extracellular environments.13 Many studies have shown that Cx43 is critical for maintenance of normal bone structure.19 In addition, Cx43 gap junction channels and hemichannels are important for osteocyte survival under oxidative stress conditions.20 Young, skeletally mature mice lacking Cx43 in osteocytes exhibit increased osteocyte apoptosis and decreased bone strength, and increased Cx43 in osteocytes has been shown to ameliorate age-induced cortical bone changes by preserving osteocyte viability and maintaining bone formation, both of which improve bone strength.21 Cx43 also plays a key role in sensing mechanical forces to maintain normal bone structure.22
We hypothesized that elevated glucose could alter the expression of Cx43 and subsequently affect gap junction channel and hemichannel function in osteocytes, ultimately resulting in cortical bone structure changes. In this study, we show that Cx43 plays a role in cortical bone structure and that p38MAPK/ERK signaling induces membrane Cx43 (mCx43) internalization in MLO-Y4 cells treated with high glucose, decreasing Cx43 channel function.
Materials and Methods
Cell Culture
MLO-Y4 cells (BNCC340801, BeNa Culture Collection Company, Beijing, China) were cultured as previously described.23 Cells were cultured on collagen-coated (rat tail collagen type I, 0.15 mg/mL) surfaces in α-MEM media (Hyclone, South Logan, UT, USA) supplemented with 2.5% fetal bovine serum and 2.5% calf serum (both from Bioind, Bei HaEmek, Israel), and incubated in a 5% CO2 atmosphere at 37°C. The media were changed every 2 days.
Cell Viability Assay
MLO-Y4 cells were seeded in 96-well plates. When the cell density reached 70%, media containing different concentrations of glucose (0, 2.5, 5, 10, 20, and 40 mM) were added to the cells for culture for 24 or 48 h. Cell viability was evaluated using the CCK8 kit (C0042, Beyotime, Nanjing, China) according to the manufacturer’s instructions, and the absorbance of each well was measured at 450 nm using a spectrophotometer (SynergyH1, BioTek, Winooski, VT, USA).
Total and Subcellular Protein Extraction
MLO-Y4 cells were seeded in 6-well plates with media containing different concentrations of glucose (0, 2.5, 5, 10, 20, and 40 mM) for 24 h. The cells were washed with cold phosphate-buffered saline (PBS), and lysed in radioimmunoprecipitation assay buffer (25 mM Tris-HCl pH 7.6, 150 mM NaCl, 1% NP-40, 1% sodium deoxycholate, and 0.1% sodium dodecyl sulfate) with1 mM polymethylsulfonyl fluoride (ST506, Beyotime) for 10 min on ice. Cell scrapers were used to remove cells from the plates. The cells were collected in lysis buffer, then centrifuged at 14,000 rpm for 20 min at 4°C. The supernatant was diluted with cold loading buffer. Protein concentration was determined using the bicinchoninic acid assay kit (P0010, Beyotime). The protein samples were boiled at 100°C for 10 min. Subcellular protein fractions (plasma membrane, organelles, and cytosol) were separated using the Minute plasma membrane isolation kit (SM005, Invent Biotechnologies, Plymouth, MN, USA) according to the manufacturer’s instructions. Plasma membrane protein concentration was analyzed using the bicinchoninic acid assay kit (P0010, Beyotime).
Western Blot
Proteins were separated by SDS polyacrylamide gel electrophoresis on 10% Bis-Tris gels with Tris-glycine running buffer. Proteins were then transferred to polyvinylidene difluoride membranes (Millipore, Burlington, MA, USA). The membranes were blocked with 5% non-fat milk (w/v) for 2 h at room temperature, then incubated with the following primary antibodies overnight at 4°C: rabbit polyclonal anti-Cx43 (1:1000, #3512, Cell Signaling Technology [CST], Danvers, MA, USA), rabbit polyclonal anti-p38 (1:1000, #8690, CST), rabbit polyclonal anti-ERK (1:1000, #9102, CST), anti-β-tubulin (WL01931, Wanleibio, Shenyang, China), anti-Na-K-ATP (1:1000, ab205967, Abcam, Cambridge, UK). The membranes were then incubated with horseradish peroxidase (HRP)-labeled goat anti-rabbit secondary antibodies (1:3000, Beyotime) for 2 h at room temperature. The membranes were then washed with Tris-buffered saline with Tween three times, and bands were visualized using an enhanced chemiluminescence system (Thermo Fisher Scientific, Waltham, MA, USA) on a GE Amersham imager 600 (GE Healthcare Life Sciences, Chicago, IL, USA). Quantitation was performed using ImageJ software (National Institutes of Health [NIH], Bethesda, MD, USA).
Immunofluorescence Staining
MLO-Y4 cells were grown on glass coverslips in 24-well plates and treated when they reached 60% confluence. The cells were divided into four groups: a) control group treated with culture media only, b) high glucose group treated with culture media containing 20 mM glucose; c) inhibitor group treated with mitogen-activated protein kinases (MAPK) PD98059 (20 μM) or extracellular regulated protein kinases, (ERK) inhibitor U0126 (25μM) (MedChemExpress, Princeton, NJ, USA), and d) inhibitor (PD98059 or U0126) plus high glucose (20 mM) group. Cells were treated for 24 h, washed with PBS, fixed with 4% paraformaldehyde for 15 min at room temperature, and permeabilized using 0.1% Triton X-100 in PBS for 10 min at room temperature. The cells were blocked with 10% goat serum for 2 h at room temperature and incubated with a primary antibody against Cx43 at a 1:50 dilution overnight at 4°C. The coverslips were washed with PBS, then incubated with Cy3-labeled goat anti-rabbit secondary antibody (SA000092, Proteintech, Rosemont, IL, USA) in the dark at room temperature for 1 h. Nuclei were co-labeled using DAPI dihydrochloride (Beyotime) for 5 min at room temperature. The coverslips were mounted on slides with anti-fade mounting medium (Beyotime), and images were collected using a fluorescence microscope (Eclipse Ci, Nikon, Japan).
Histological Examination and Immunohistochemistry
Cortical bone was obtained from surgical specimens removed from patients diagnosed with femoral neck fractures who underwent femoral head or total hip replacement surgery. This study was approved by the Ethics Committee of China Medical University. All patients provided written informed consent in accordance with the Declaration of Helsinki. The inclusion criteria for the present study were as follows: a) post-menopausal women, b) age 60–70 years, and c) diagnosed with osteoporotic femoral neck fracture with or without T2DM. The exclusion criteria were: a) high blood pressure (over 140/90 mmHg), chronic obstructive pulmonary disease, coronary heart disease, or any other disease that affects bone structure or b) treated with any kind of anti-osteoporosis drug prior to the study. Twenty patients were enrolled and divided into a non-T2DM control group (n=11) and a T2DM group (n=9). The patients in T2DM group had been diagnosed with T2DM for at least 3 years. They had all used insulin to control blood glucose for at least 1 year (fasting glucose <8 mmol/L, postprandial blood glucose <10 mmol/L, glycosylated hemoglobin <7.5%). The mean body mass indexes (BMIs) were 20.3 ± 2.1 and 19.8 ± 1.9 in the T2DM and non-T2DM groups, respectively (P>0.05). Samples were taken from the broken end of the femoral neck, and adherent soft tissue was removed. Cortical bone samples were cut into small pieces and fixed in 4% paraformaldehyde for 1 week at room temperature. Then the samples were decalcified using a 10% ethylenediaminetetraacetic acid solution (changed every 3 days) at room temperature for 6 months.
Specimens were dehydrated in graded alcohol, made transparent in xylene, and embedded in paraffin wax. Specimens were sectioned sagittally and stained with hematoxylin and eosin (H&E). Histological sections were visualized using an Olympus BX53 microscope (Olympus, Tokyo, Japan). One section with the best cortical bone condition was selected for each patient, and three fields of cortical bone were imaged in each slice. The ratio of empty bone lacuna to total lacuna was calculated.
Immunohistochemistry was performed as described previously.24 Samples were sliced into 3-μm sections that were deparaffinized in xylene and an alcohol gradient, then washed using cold PBS. Enzymatic antigen retrieval (AR0026, Bosterbio, Pleasanton, CA, USA) was performed at 37°C for 30 min. Endogenous peroxidases were inactivated using 3% H2O2 for 30 min at room temperature. The slices were washed three times in PBS, then blocked in 5% goat serum. The sections were incubated with a rabbit polyclonal anti-Cx43 antibody (1:50) at 4°C overnight. After extensive washing with PBS, the sections were incubated with the corresponding biotinylated secondary antibody, washed with PBS, and incubated with streptavidin/horseradish peroxidase (S-A/HRP) (Zhongshan Goldenbridge Biotechnology, Co., Beijing, China) at room temperature for 30 min according to the manufacturer’s protocol. Sections were stained with diaminobenzidine for 1 min and counterstained with hematoxylin for 5 min. The sections were dehydrated using an alcohol gradient and xylene, then sealed with neutral resins. Images of sections were captured using optical microscopy (Eclipse Ci, Nikon), and optical density values were measured using Image-Pro Plus, version 6.0 (Media Cybernetics, Inc., Rockville, MD, USA).
Dye Uptake Assay
MLO-Y4 cells were grown at a low initial plating density to ensure that most cells were not physically in contact.22 The dye uptake assay was performed as previously described.22 MLO-Y4 cells were grown to a density of 7.0×10³ cells/cm2, then treated with or without 20 mM glucose for 24 h, washed three times, and incubated for 5 min in recording solution (154 mM NaCl, 5.4 mM KCl, 1.8 mM CaCl2, 1 mM MgCl2, 10 mM glucose, and 10 mM HEPES, pH 7.4). The cells were then exposed to ethidium bromide (Etd+) (Solarbio Life Science Co., Beijing, China) for 5 min and fixed with 2% formaldehyde in PBS for 30 min and visualized using a fluorescence microscope (Eclipse Ci, Nikon). Fluorescence was recorded at regions of interest using an eclipse filter (rhodamine B filter; excitation wavelengths 540–580 nm, emission wavelengths 600–660 nm). Images were captured using a Cool SNAP HQ2 fast-cooled monochromatic digital camera (16-bit) (Photometrics, Tucson, AZ, USA). At least three microphotographs of fluorescence fields were taken. Image analysis was performed using ImageJ software (NIH). Integrated optical density (IOD) was calculated in each visual field, and the extent of dye uptake was determined as the ratio of IOD to total cell number.
Scrape Loading Assay
Gap junction communication function in MLO-Y4 cells was evaluated with scrape loading assays as previously described.26 The treatment groups were the same as those in the dye uptake assay. When MLO-Y4 cells reached 90% confluence after 24 h of treatment, they were rinsed with Hank’s balanced salt solution (HBSS) three times. The cells were scratched with a scalpel to create multiple scrapes, then incubated with gap junction-permeable Lucifer yellow fluorescence dye (1 mg/mL, Sigma-Aldrich Co., St. Louis, MO, USA) for 5 min at 37°C. After 30 min of incubation at room temperature, the cultures were rinsed three times with HBSS, then fixed in a 4% paraformaldehyde solution for 10 min. The cells were visualized using a fluorescence microscope (Nikon Eclipse TE 200). In three independent experiments, five fields of view per cell line were imaged, and each field of view was assessed at three places along the scratch for a total of 45 individual measurements for each cell line. The Lucifer yellow dye travel distance was quantified using ImageJ software (NIH).
Statistical Analysis
All data were analyzed using GraphPad Prism 5.04 (GraphPad Software, San Diego, CA, USA), Image-Pro Plus, version 6.0 software (Media Cybernetics, Inc.), and ImageJ software (NIH). One-way analysis of variance and Student-Newman-Keul tests were used for comparisons among more than two groups, and Student’s t-tests were used for comparisons between two groups. Unless otherwise specified in the figure legends, data are presented as the mean ± SEM of at least three determinations. P<0.05 was considered statistically significant.
Results
MLO-Y4 Cell Viability Dose-Dependently Decreased in Response to Glucose Treatment
Treatment with glucose reduced MLO-Y4 cell viability in a dose-dependent manner after 24 and 48 h (Figure 1). Cell viability rates were 90.1%, 87.3%, 86.2%, 79.6%, and 73.4% in MLO-Y4 cells following treatment with 2.5, 5, 10, 20, and 40 mM glucose, respectively, after 24 h. The corresponding values were 91.3%, 87.0%, 81.2%, 72.6%, and 54.2% following 48 h of incubation. Cell viability was >50% in all conditions, which was consistent with the chronic nature of T2DM-related damage. We chose 20 mM glucose as the high glucose condition for further experiments.
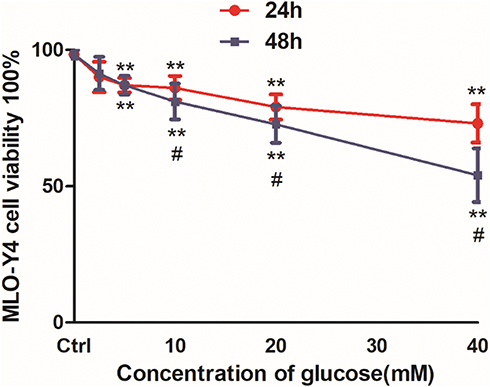 |
Figure 1 High glucose decreased cell viability and Cx43 protein expression in osteocyte-like MLO-Y4 cells. Viability assays of MLO-Y4 cells following treatment with different concentrations of glucose for 24 and 48 hrs using CCK8 kits. MLO-Y4 cell viability dose-dependently decreased following glucose treatment. Cell viability was reduced to a greater extent at 48 hrs, but decreased by <50% in response to all glucose concentrations. The results represent three independent experiments. **P<0.01 vs control group (Ctrl), untreated cells. #P<0.05 vs group treated with the same concentration of glucose for 24 hrs. |
Cx43 Expression Decreased in Osteocytes of Cortical Bone Obtained from Patients with T2DM
There were 9 patients and 11 patients in T2DM and non-T2DM groups, respectively, according to inclusion and exclusion criteria. H&E staining showed more empty osteocyte lacunae in the T2DM group (54.93%) than in the non-T2DM group (36.51%) (Figure 2A and B). Immunohistochemical staining showed lower Cx43 expression in cortical bone osteocytes in the T2DM group compared to the non-T2DM control group (Figure 2C and D).
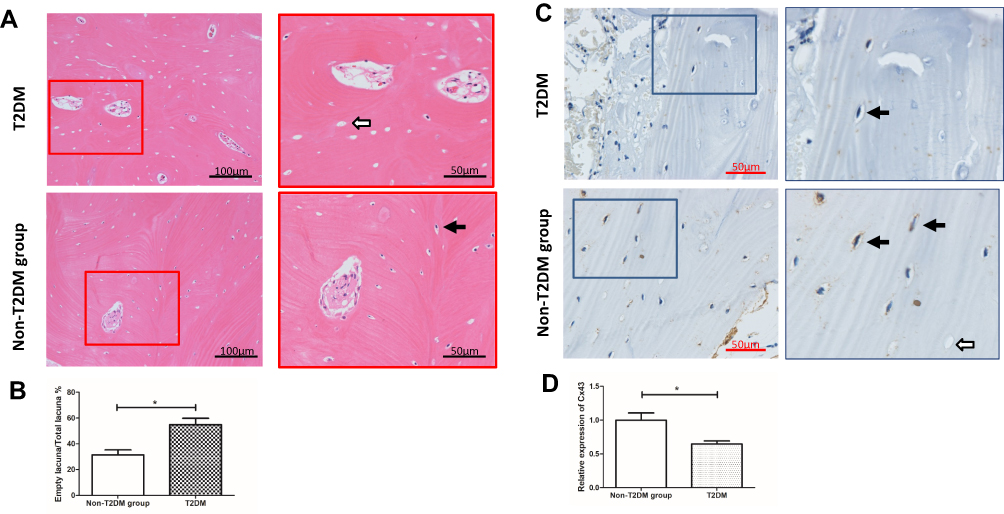 |
Figure 2 Hematoxylin and eosin staining and immunohistochemical detection of Cx43 expression in cortical bone samples from patients with femoral neck fractures. (A) Hematoxylin and eosin staining. Only osteocytes in cortical bone were calculated. One section with the best cortical bone condition was selected for each patient, and three fields of cortical bone were imaged in each slice. The ratio of empty bone lacuna to total lacuna was calculated. There was a higher empty osteocyte lacunae rate (54.93%) in the T2DM group than the non-T2DM group (36.51%). (B) The statistical analysis is shown in the histogram. *P<0.05 vs non-T2DM. Data are presented as the mean ± standard deviation of three independent experiments. Bar = 100 μm (original magnification 200×). White and black arrows indicate empty and normal bone lacunae, respectively. (C) Immunohistochemical results showed that Cx43 expression was reduced by 35.67% in patients with T2DM compared with the non-T2DM group. (D) The statistical analysis is shown in the histogram. *P<0.05 vs non-T2DM. Data are presented as the mean ± standard deviation of three independent experiments. Bar = 50 μm (original magnification 400×). White and black arrows indicate the empty and normal bone lacunae, respectively. |
High Glucose Dose-Dependently Reduced Cx43 Expression in MLO-Y4 Cells
MLO-Y4 cells were divided into six groups and treated with different concentrations of glucose (0, 2.5, 5, 10, 20, and 40 mM) for 24 h. Total protein was extracted, and Cx43 expression was evaluated using Western blot. The results showed that Cx43 levels decreased in MLO-Y4 cells in a glucose dose-dependent manner (Figure 3A). Immunofluorescence staining confirmed that Cx43 expression was decreased in MLO-Y4 cells treated with 20 mM glucose for 24 h compared with the control group (Figure 3B).
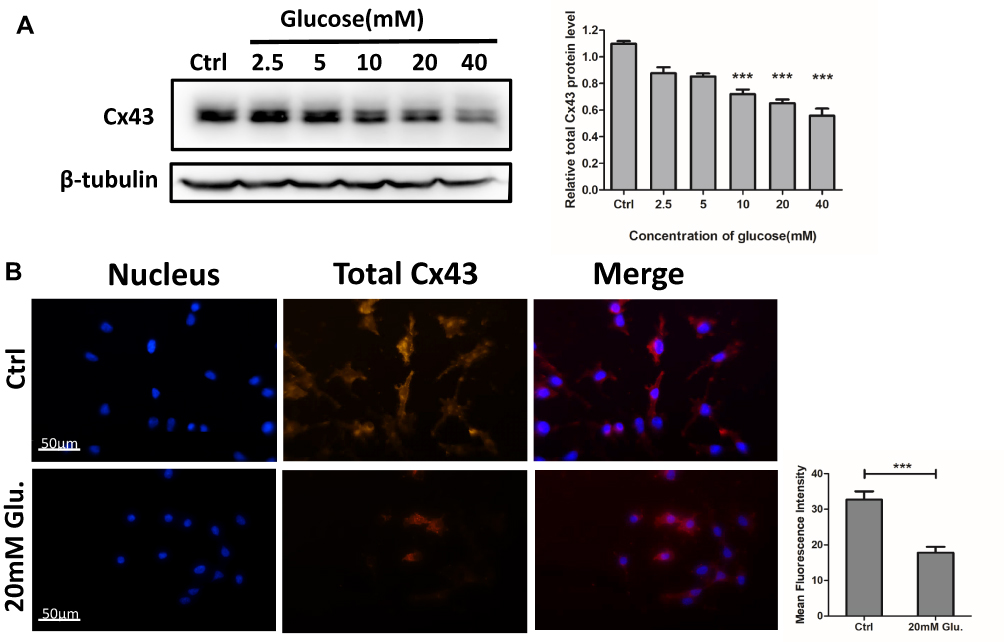 |
Figure 3 Dose-dependent reduction of total Cx43 protein expression in MLO-Y4 cells in response to glucose, as determined using Western blotting and immunofluorescence assays. (A) Cx43 expression was dose-dependently reduced in response to glucose after 48 hrs. Relative expression of Cx43 protein is shown in the histogram to the right of the blot. The relative levels of Cx43 protein significantly reduced to 65.03 ± 8.50% and 55.75 ± 10.78% following exposure to 20 and 40 mM glucose for 24 hrs, respectively. Data are presented as the mean ± standard deviation of three independent experiments. Analysis of variance; ***P<0.001 vs Ctrl. (untreated cells). The statistical results are shown in the histogram on the right. (B) Cx43 immunofluorescence (red) was reduced in MLO-Y4 cells treated with 20 mM glucose compared with the control group. Blue, nuclei. All images were obtained at the same magnification. Bar=50 μm. The statistical results are shown in the histogram to the right of immunofluorescence images. Data are presented as the mean ± standard deviation of three independent experiments. Analysis of variance; ***P<0.001 vs Ctrl. (untreated cells). |
Cx43 Gap Junction and Hemichannel Function Were Reduced in MLO-Y4 Cells Subjected to High Glucose
Cx43 gap junction and hemichannel function in MLO-Y4 cells were evaluated using the scrape loading and dye uptake assays, respectively. In the high glucose group, Lucifer yellow traveled a shorter distance than in the control group. These results indicated that gap junction function was inhibited by high glucose treatment. Three independent scrape loading experiments were performed, and the results showed that gap junction function was decreased by 30% in the high glucose group (Figure 4A and B). In addition, hemichannel function was decreased by nearly 50% in the high glucose group compared to the control group, as evidenced by decreased Etd+ fluorescence intensity (Figure 4C and D).
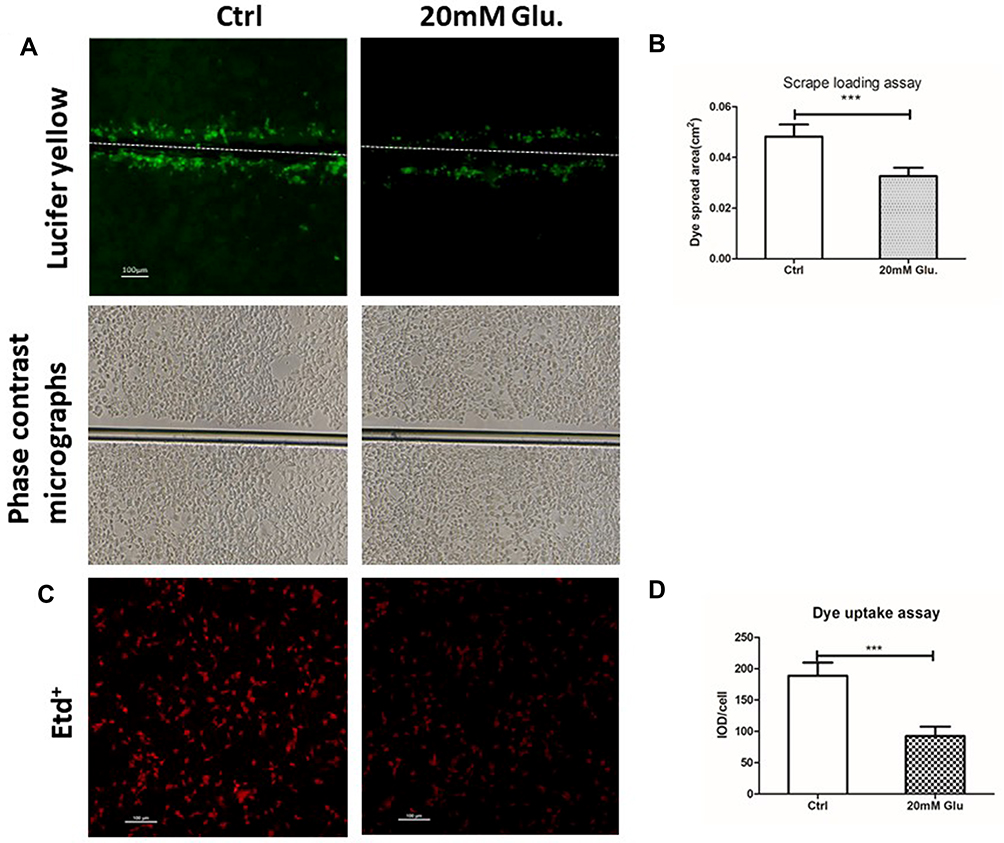 |
Figure 4 Treatment with glucose (20 mM) reduced gap junction communication and hemichannel function. (A) Analysis of the area between the bilateral edges of Lucifer yellow transfer at the scrape line is shown, and the spread area of Lucifer yellow was analyzed with ImageJ software as shown in (B). Bar=100 μm. Cx43 gap junction function was reduced by 32.17% in MLO-Y4 cells treated with 20 mM glucose. Phase-contrast micrographs of Lucifer yellow transfer are shown on the second line. ***P<0.001 vs Ctrl. Data are presented as the mean ± standard deviation of three independent experiments. (C) Etd+dye uptake assays were performed after cells were exposed to 20 mM glucose for 24 hrs. Etd+dye uptake was observed using a fluorescence microscope (bottom image) and quantified and presented as a ratio of integrated optical density (IOD) to total cell number using ImageJ software, and the result is shown in (D) Cx43 hemichannel function was reduced by 50.69% in MLO-Y4 cells treated with 20 mM glucose. ***P<0.001 vs Ctrl. Bar=100 μm. Data are presented as the mean ± standard deviation of three independent experiments. |
Membrane Cx43 Expression Was Decreased and p38MAPK/ERK Signaling Was Activated in MLO-Y4 Cells Exposed to High Glucose
To evaluate the mechanisms of decreased gap junction and hemichannel function, mCx43 expression was evaluated using Western blot. The results showed that mCx43 levels decreased by approximately 40% in MLO-Y4 cells treated with 20 mM glucose compared with the control group (Figure 5A). In addition, we observed enhanced p38MAPK/ERK signaling, which promotes mCx43 internalization, as evidenced by increased expression of key proteins in this pathway. Treatment of MLO-Y4 cells with 0, 2.5, 5, 10, 20, and 40 mM glucose for 24 h resulted in dose-dependent increases in the expression of p38MAPK and p-ERK1/2 (Figure 5B).
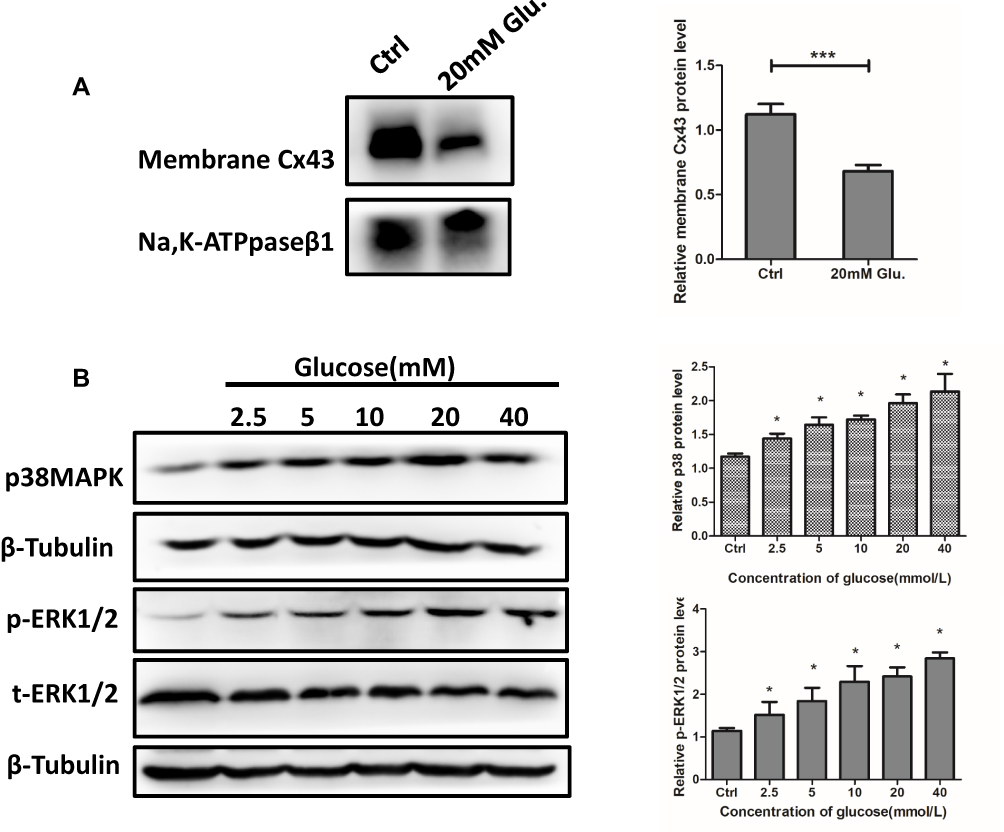 |
Figure 5 Membrane Cx43 protein expression decreased and pERK1/2 and p38 MAPK were activated in MLO-Y4 cells in response to 20 mM glucose treatment. (A) Membrane Cx43 protein expression in MLO-Y4 cells was decreased by 60% after glucose treatment. A histogram representation of the data is shown on the right. (B) Phosphorylated EKK1/2, total ERK1/2, and p38 MAPK were activated in MLO-Y4 cells following glucose treatment. ***P<0.001 vs Ctrl. *P <0.05 vs Ctrl. Data are presented as the mean ± standard deviation of three independent experiments. |
Inhibitors of p38MAPK and ERK1/2 Partially Reversed Glucose-Mediated Decreases in Cx43 Expression and Function
MLO-Y4 cells were treated with 20 mM glucose, PD98059 (20 μM) alone, PD98059 followed by 20 mM glucose (pretreatment with PD98059 for 30 min, then co-treatment with glucose), or control media. Cells were cultured for 24 h, and Cx43 expression is shown in Figure 6A. PD98059 partially reversed glucose-mediated decreases in Cx43 expression (22.9%). This result was supported by immunofluorescence results (Figure 6B).
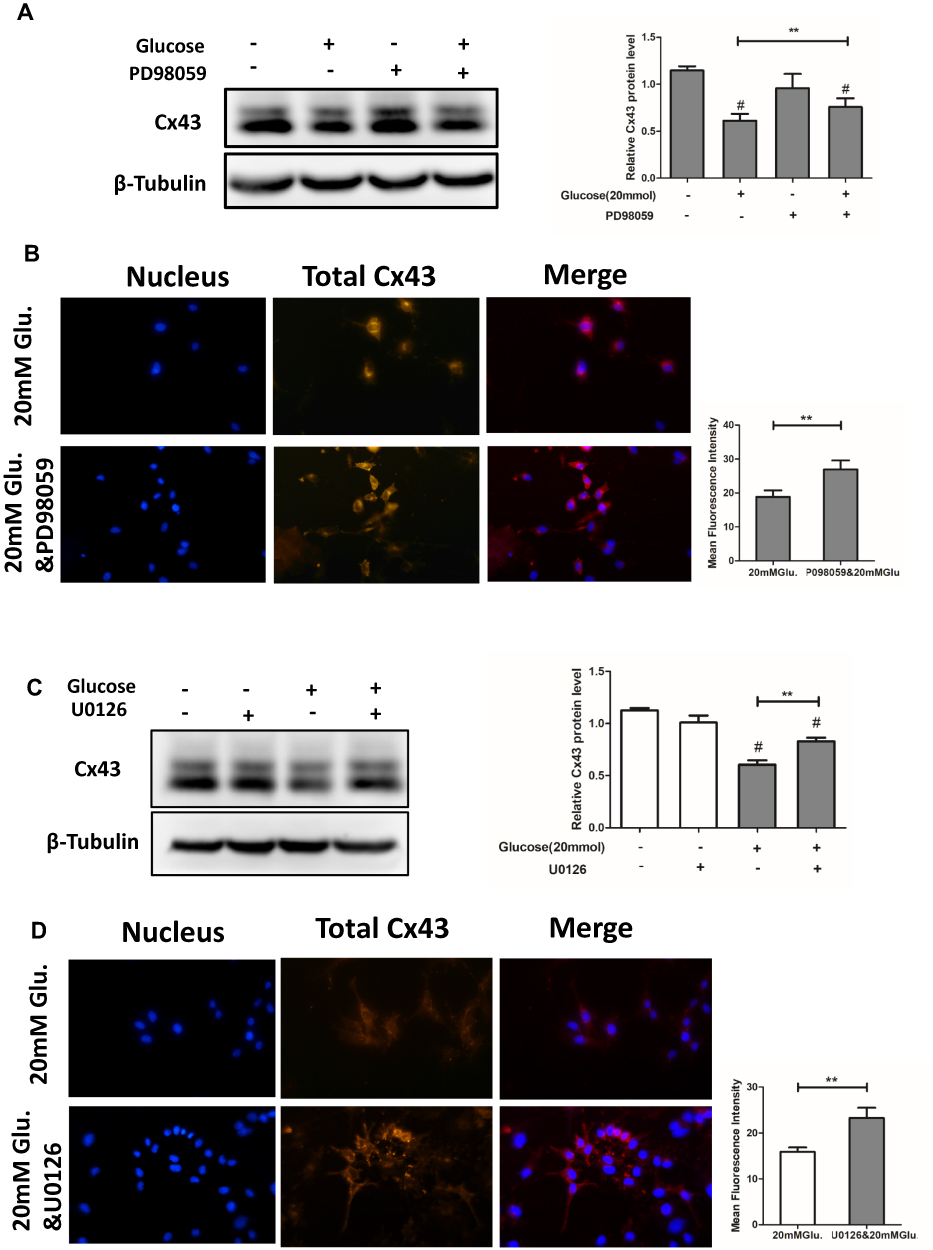 |
Figure 6 PD98059, an inhibitor of p38 MAPK and U0126, and an inhibitor of ERK1/2 partially reversed the glucose-mediated downregulation of total Cx43 protein. (A) The relative expression levels of Cx43 in cells treated with 20 mM glucose increased from 62.3% to 84.1% following PD98059 treatment as compared to untreated cells. (B) Immunofluorescence microscopy for Cx43. Expression was higher in the PD98059+20 mM glucose group compared to the 20 mM glucose group. A histogram representation of the data is shown on the right. (C) The relative expression of Cx43 in cells treated with 20 mM glucose increased from 61.51% to 82.98% following U0126 treatment as compared to untreated cells. (D) Immunofluorescence microscopy for Cx43. Expression was higher in the PD98059+20 mM glucose group compared to the 20 mM glucose group. A histogram representation of the data is shown on the right. #P<0.01 vs Ctrl. **P <0.01 vs 20 mM Glu. Data are presented as the mean ± standard deviation of three independent experiments. |
The effect of ERK1/2 inhibitor on Cx43 expression in MLO-Y4 cells treated with high glucose was also assessed as described for PD98059. Notably, U0126 also partially reversed glucose-mediated decreases in Cx43 expression (21.37%) (Figure 6C). Again, this result was supported by immunofluorescence results (Figure 6D).
p38MAPK Inhibition Partially Reversed Glucose-Mediated Decreases in Cx43 Gap Function
Gap junction and hemichannel function were also evaluated. The results showed that decreased gap junction and hemichannel functions were partially reversed (46.3% and 26.05%, respectively) by treatment with PD98059 compared with the high glucose group (Figure 7A and B).
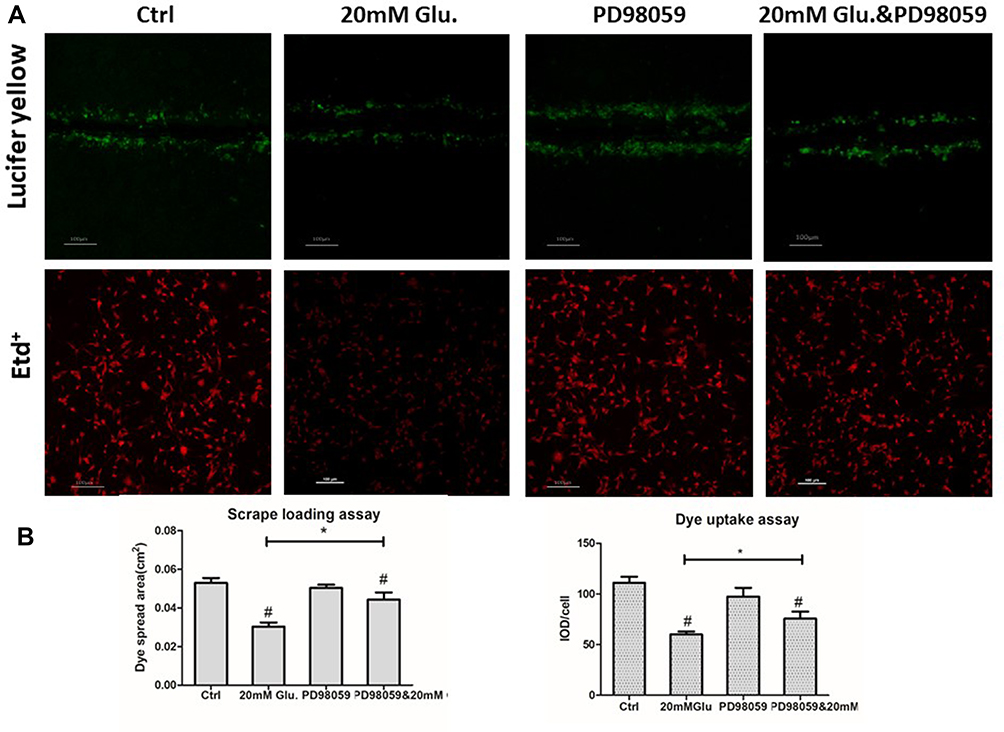 |
Figure 7 PD98059 reversed glucose-mediated downregulation of Cx43 gap junction and hemichannel function in MLO-Y4 cells. (A and B) Cx43 gap junction and hemichannel function were partially rescued by PD98059, as determined by scrape loading and uptake assays. Cx43 gap junction and hemichannel function levels were rescued by 46.35% and 26.05%, respectively, compared with those in cells treated with glucose only. *P<0.05 vs 20 mM Glu. #P<0.01 vs Ctrl. Data are presented as the mean ± standard deviation of three independent experiments. |
Discussion
Osteoporosis and T2DM are prevalent diseases in elderly individuals. Patients with T2DM are susceptible to fracture independent of BMD2,4 so bone structure has received increased attention.27 There is especially strong interest in cortical bone, which is the major type of bone (90% of bone tissue is cortical bone) that supports weight-bearing functions (contributes 40–90% of the bending rigidity in the femoral neck and 45–75% of the axial load on a vertebral body).28,29 Studies of mice models and patients with T2DM patients have shown that T2DM is associated with a high rate of small core and micro-cracks in cortical bone, altering stiffness.6,7,30-32 These results suggest that cortical bone structure damage may play a crucial role in T2DM-related osteoporosis fractures.
Osteocytes are the main cells in cortical bone and orchestrate bone modeling or remodeling by forming networks with osteoblasts and osteoclasts on the bone surface, and bone marrow stromal cells (BMCs). The architectural quality of the osteocyte network was shown to correlate with bone material quality.10,27,33 Furthermore, osteocytes and the osteocyte network are key responders to mechanical signals, and can translate mechanical signals into chemical signals, ultimately regulating bone structure.25,34,35 Previous studies have described disordered osteocyte networks in T2DM mice.15,32 However, the mechanism of T2DM osteocyte network disruption has not been characterized.
In this study, we focused on osteocytes and their network function in response to high glucose. The treatment resulted in a dose-dependent decrease in MLO-Y4 cell viability, but it was never decreased by more than 50% compared with untreated cells. This suggests that high glucose treatment was not acutely toxic, which was consistent with the effects of T2DM on cells and organs in vivo.
To investigate the osteocyte network, we evaluated Cx43, the most abundant gap junction-forming protein in bone, as well as Cx43 gap junction and hemichannel function that are necessary for normal osteocyte network structure and function.36 We showed that osteocytes of patients with T2DM had decreased Cx43 expression compared with those in patients without T2DM. We obtained similar results in MLO-Y4 cells treated with different concentrations of glucose. Moreover, Cx43 gap junction and hemichannel function decreased in MLO-Y4 cells subjected to high glucose treatment.
Connexin 43 is necessary for osteocyte survival under oxidative stress conditions. Knockdown of Cx43 expression using small interfering RNA increased cell susceptibility to oxidative stress-induced death.20 Increased Cx43 expression in osteocytes ameliorated age-induced cortical bone changes by preserving osteocyte viability and maintaining bone formation, resulting in greater bone strength.21 Oxidative stress is a critical mechanism of T2DM pathology and can induce osteoblast apoptosis and differentiation, increase osteoclast function, and inhibit BMC function.37 Decreased Cx43 expression in osteocytes in T2DM may render osteocytes susceptible to oxidative stress, which could reduce their viability and promote cell death, resulting in empty bone lacunae.
Connexin gap junctions and hemichannels play distinct roles in osteocyte function. Cx43 gap junctions are responsible for intercellular communication, while Cx43 hemichannels exchange cellular signals and materials with the extracellular matrix.12 Gap junction communication is involved in bone remodeling, and Cx43 hemichannels likely help maintain osteocyte viability, bone integrity and longevity, endocortical bone resorption, and periosteal apposition.10,19 Decreased Cx43 gap junction and hemichannel function in response to high glucose may decrease the bone turnover rate and increase the occurrence of micro-cracks in patients with T2DM.38
To further characterize the mechanism of decreased Cx43 expression and altered gap junction and hemichannel function in MLO-Y4 cells, we measured the expression of mCx43 and proteins in the p38MAPK/ERK signaling pathway. Levels of mCx43 were decreased, and Cx43 was internalized in MLO-Y4 cells treated with high glucose. The p38MAPK/ERK signaling inhibitor PD98059 partially reversed the glucose-induced decrease in Cx43 expression and gap junction and hemichannel function in MLO-Y4 cells. These results suggested that increased mCx43 internalization due to enhanced p38MAPK/ERK signaling contributed to decreased Cx43 levels. We previously showed that advanced glycation end products produced by reactions between the aldehyde group of glucose and other macromolecules induced autophagy in the osteoblast-like cell line MC3T3-E1.39 Autophagy is an important degradation pathway for Cx43.40 Therefore, we hypothesized that high glucose-mediated reduction of Cx43 expression could accelerate autophagic degradation.
Cx43 in gap junction and hemichannels is important for osteocytes’ mechanical sensing ability. Lloyd et al showed that Cx43 deficiency desensitized bone to the effects of mechanical unloading in a mouse model with osteoblast-/osteocyte-specific deletion of Cx43.41,42 Another study by Grimston et al showed that osteoblast-/osteocyte-specific Cx43 knockout mice subjected to a muscle paralysis with treatment with botulinum toxin A (BtxA) exhibited reduced sensitivity of cortical bone to the unloading effects of muscle paralysis.43 It is well known that mechanical force helps maintain normal bone structure and stimulates bone remodeling. Therefore, decreased Cx43 expression in response to high glucose might decrease the mechanical sensing function of osteocytes, resulting in a low remodeling rate and altered bone microstructure.
Our study suffered from some limitations. First, we had a very small sample size because the patients were selected from an elderly population with many comorbid diseases that resulted in exclusion. In addition, age was matched across groups, which further limited our sample size. T2DM is associated with increased risk for fracture in both women and men.44 Considering the morbidity of osteoporosis, we only included female patients, which was also a limitation. We did not assess effects of high glucose on Cx43 gene regulation, and this should be explored. In addition, it remains unknown whether blocking the Cx43 degradation pathway can increase protein levels or gap junction and hemichannel function. Finally, we did not evaluate the mechanisms by which Cx43 expression and gap junction and hemichannel function contribute to increased micro-crack formation in patients with T2DM.
Conclusion
In conclusion, our results demonstrated that high glucose can attenuate Cx43 gap junction and hemichannel function in MLO-Y4 cells by activating p38MAPK/ERK signaling and subsequent mCx43 internalization.
Data Sharing Statement
The data described in this article are openly available in the Open Science Framework at DOI:10.17605/OSF.IO/TPA6U.
Acknowledgments
This work was supported by the National Nature Science Foundation of China (No. 81970760 and No. 81370981). This work was also funded by the Shengjing Freedom Researcher Foundation of Shengjing Hospital of China Medical University.
Disclosure
The authors declare no competing financial or non-financial interests.
References
1. Palermo A, D’Onofrio L, Buzzetti R, Manfrini S, Napoli N. Pathophysiology of bone fragility in patients with diabetes. Calcif Tissue Int. 2017;100:122–132. doi:10.1007/s00223-016-0226-3
2. Cortet B, Lucas S, Legroux-Gerot I, et al. Bone disorders associated with diabetes mellitus and its treatments. Joint Bone Spine. 2019;86:315–320. doi:10.1016/j.jbspin.2018.08.002
3. Shu A, Yin MT, Stein E, et al. Bone structure and turnover in type 2 diabetes mellitus. Osteoporos Int. 2012;23:635–641. doi:10.1007/s00198-011-1595-0
4. Nilsson AG, Sundh D, Johansson L, et al. Type 2 diabetes mellitus is associated with better bone microarchitecture but lower bone material strength and poorer physical function in elderly women: a population-based study. J Bone Miner Res. 2017;32:1062–1071. doi:10.1002/jbmr.3057
5. Acevedo C, Sylvia M, Schaible E, et al. Contributions of material properties and structure to increased bone fragility for a given bone mass in the UCD-T2DM rat model of type 2 diabetes.. J Bone Miner Res. 2018;33:1066–1075. Epub ahead of print doi:10.1002/jbmr.3393.
6. Zeitoun D, Caliaperoumal G, Bensidhoum M, et al. Microcomputed tomography of the femur of diabetic rats: alterations of trabecular and cortical bone microarchitecture and vasculature – a feasibility study. Eur Radiol Exp. 2019;3:17. doi:10.1186/s41747-019-0094-5
7. Burr DB. Cortical bone: a target for fracture prevention? Lancet. 2010;375:1672–1673. doi:10.1016/S0140-6736(10)60444-8
8. Patsch JM, Burghardt AJ, Yap SP, et al. Increased cortical porosity in type 2 diabetic postmenopausal women with fragility fractures. J Bone Miner Res. 2013;28:313–324. doi:10.1002/jbmr.1763
9. Kerckhofs G, Durand M, Vangoitsenhoven R, et al. Changes in bone macro- and microstructure in diabetic obese mice revealed by high resolution microfocus X-ray computed tomography. Sci Rep. 2016;6:35517. doi:10.1038/srep35517
10. Talbot J, Brion R, Lamora A, et al. Connexin43 intercellular communication drives the early differentiation of human bone marrow stromal cells into osteoblasts. J Cell Physiol. 2018;233:946–957. doi:10.1002/jcp.25938
11. Zhao S, Zhang Y, Harris S, Ahuja SS, Bonewald LF. MLO-Y4 osteocyte-like cells support osteoclast formation and activation. J Bone Miner Res. 2002;17:2068–2079. doi:10.1359/jbmr.2002.17.11.2068
12. Plotkin LI. Connexin 43 hemichannels and intracellular signaling in bone cells. Front Physiol. 2014;5:131. doi:10.3389/fphys.2014.00131
13. Rochefort GY, Pallu S, Benhamou CL. Osteocyte: the unrecognized side of bone tissue. Osteoporos Int. 2010;21:1457–1469. doi:10.1007/s00198-010-1194-5
14. Dallas SL, Prideaux M, Bonewald LF. The osteocyte: an endocrine cell … and more. Endocr Rev. 2013;34:658–690.
15. Mabilleau G, Perrot R, Flatt PR, Irwin N, Chappard D. High fat-fed diabetic mice present with profound alterations of the osteocyte network. Bone. 2016;90:99–106. doi:10.1016/j.bone.2016.06.008
16. Cunha JS, Ferreira VM, Maquigussa E, Naves MA, Boim MA. Effects of high glucose and high insulin concentrations on osteoblast function in vitro. Cell Tissue Res. 2014;358:249–256. doi:10.1007/s00441-014-1913-x
17. Rochefort GY. The osteocyte as a therapeutic target in the treatment of osteoporosis.pdf. Ther Adv Musculoskelet Dis. 2014;6:79–91. doi:10.1177/1759720X14523500
18. Moorer MC, Stains JP. Connexin43 and the intercellular signaling network regulating skeletal remodeling. Curr Osteoporos Rep. 2017;15:24–31. doi:10.1007/s11914-017-0345-4
19. Xu H, Gu S, Riquelme MA, et al. Connexin 43 channels are essential for normal bone structure and osteocyte viability. J Bone Miner Res. 2015;30:436–448. doi:10.1002/jbmr.2374
20. Kar R, Riquelme MA, Werner S, Jiang JX. Connexin 43 channels protect osteocytes against oxidative stress-induced cell death. J Bone Miner Res. 2013;28:1611–1621. doi:10.1002/jbmr.1917
21. Davis HM, Aref MW, Aguilar-Perez A, et al. Cx43 overexpression in osteocytes prevents osteocyte apoptosis and preserves cortical bone quality in aging mice. JBMR Plus. 2018;2:206–216. doi:10.1002/jbm4.v2.4
22. Xu H, Liu R, Ning D, et al. Biological responses of osteocytic connexin 43 hemichannels to simulated microgravity. J Orthop Res. 2017;35:1195–1202. doi:10.1002/jor.v35.6
23. Yu C, Huang D, Wang K, et al. Advanced oxidation protein products induce apoptosis, and upregulate sclerostin and RANKL expression, in osteocytic MLO-Y4 cells via JNK/p38 MAPK activation. Mol Med Rep. 2017;15:543–550. doi:10.3892/mmr.2016.6047
24. Zhang H, Ji L, Yang Y, et al. The therapeutic effects of treadmill exercise on osteoarthritis in rats by inhibiting the HDAC3/NF-KappaB pathway in vivo and in vitro. Front Physiol. 2019;10:1060. doi:10.3389/fphys.2019.01060
25. Cherian PP, Siller-Jackson AJ, Gu S, et al. Mechanical strain opens connexin 43 hemichannels in osteocytes: a novel mechanism for the release of prostaglandin. Mol Biol Cell. 2005;16:3100–3106. doi:10.1091/mbc.e04-10-0912
26. Xie Y, Liu S, Hu S, Wei Y. Cardiomyopathy-associated Gene 1-Sensitive PKC-dependent connexin 43 Expression and phosphorylation in left ventricular noncompaction cardiomyopathy. Cell Physiol Biochem. 2017;44:828–842. doi:10.1159/000485348
27. Kerschnitzki M, Kollmannsberger P, Burghammer M, et al. Architecture of the osteocyte network correlates with bone material quality. J Bone Miner Res. 2013;28:1837–1845. doi:10.1002/jbmr.1927
28. Holzer G, von Skrbensky G, Holzer LA, Hip PW. Fractures and the contribution of cortical versus trabecular bone to femoral neck strength. J Bone Miner Res. 2009;24:468–474. doi:10.1359/jbmr.081108
29. Rockoff SD, Sweet E, Bleustein J. The relative contribution of trabecular and cortical bone to the strength of human lumbar vertebrae. Calcif Tissue Res. 1969;3:163–175. doi:10.1007/BF02058659
30. Samelson EJ, Demissie S, Cupples LA, et al. Diabetes and deficits in cortical bone density, microarchitecture, and bone size: framingham HR-pQCT study. J Bone Miner Res. 2018;33:54–62. doi:10.1002/jbmr.v33.1
31. Sellmeyer DE, Civitelli R, Hofbauer LC, et al. Skeletal metabolism, fracture risk, and fracture outcomes in Type 1 and Type 2 diabetes. Diabetes. 2016;65:1757–1766. doi:10.2337/db16-0063
32. Burghardt AJ, Issever AS, Schwartz AV, et al. High-resolution peripheral quantitative computed tomographic imaging of cortical and trabecular bone microarchitecture in patients with type 2 diabetes mellitus. J Clin Endocrinol Metab. 2010;95:5045–5055. doi:10.1210/jc.2010-0226
33. Wagner AS, Glenske K, Wolf V, et al. Osteogenic differentiation capacity of human mesenchymal stromal cells in response to extracellular calcium with special regard to connexin 43. Ann Anat. 2017;209:18–24. doi:10.1016/j.aanat.2016.09.005
34. Batra N, Riquelme MA, Burra S, et al. Direct regulation of osteocytic connexin 43 hemichannels through AKT kinase activated by mechanical stimulation. J Biol Chem. 2014;289:10582–10591. doi:10.1074/jbc.M114.550608
35. Tatsumi S, Ishii K, Amizuka N, et al. Targeted ablation of osteocytes induces osteoporosis with defective mechanotransduction. Cell Metab. 2007;5:464–475. doi:10.1016/j.cmet.2007.05.001
36. Bivi N, Nelson MT, Faillace ME, et al. Deletion of Cx43 from osteocytes results in defective bone material properties but does not decrease extrinsic strength in cortical bone. Calcif Tissue Int. 2012;91:215–224. doi:10.1007/s00223-012-9628-z
37. Moorer MC, Hebert C, Tomlinson RE, et al. Defective signaling, osteoblastogenesis and bone remodeling in a mouse model of connexin 43 C-terminal truncation. J Cell Sci. 2017;130:531–540. doi:10.1242/jcs.197285
38. Gerdhem P, Isaksson A, Fau-Akesson K, Obrant KJ, Obrant KJ. Increased bone density and decreased bone turnover, but no evident alteration of fracture susceptibility in elderly women with diabetes mellitus. Osteoporos Int. 2005;16:1506–1512. doi:10.1007/s00198-005-1877-5
39. Yang L, Meng H, Yang M. Autophagy protects osteoblasts from advanced glycation end products-induced apoptosis through intracellular reactive oxygen species. J Mol Endocrinol. 2016;56:291–300. doi:10.1530/JME-15-0267
40. Fong JT, Kells RM, Gumpert AM, et al. Internalized gap junctions are degraded by autophagy. Autophagy. 2012;8:794–811. doi:10.4161/auto.19390
41. Li X, Liu C, Li P, et al. Connexin 43 is a potential regulator in fluid shear stress-induced signal transduction in osteocytes. J Orthop Res. 2013;31:1959–1965. doi:10.1002/jor.v31.12
42. Lloyd SA, Loiselle AE, Zhang Y, Donahue HJ. Connexin 43 deficiency desensitizes bone to the effects of mechanical unloading through modulation of both arms of bone remodeling. Bone. 2013;57:76–83. doi:10.1016/j.bone.2013.07.022
43. Grimston SK, Goldberg DB, Watkins M, et al. Connexin43 deficiency reduces the sensitivity of cortical bone to the effects of muscle paralysis. J Bone Miner Res. 2011;26:2151–2160. doi:10.1002/jbmr.425
44. Lee RH, Sloane R, Pieper C, et al. Glycemic control and insulin treatment alter fracture risk in older men with Type 2 diabetes mellitus. J Bone Miner Res. 2019;34:2045–2051. doi:10.1002/jbmr.v34.11
 © 2020 The Author(s). This work is published and licensed by Dove Medical Press Limited. The
full terms of this license are available at https://www.dovepress.com/terms
and incorporate the Creative Commons Attribution
- Non Commercial (unported, 3.0) License.
By accessing the work you hereby accept the Terms. Non-commercial uses of the work are permitted
without any further permission from Dove Medical Press Limited, provided the work is properly
attributed. For permission for commercial use of this work, please see paragraphs 4.2 and 5 of our Terms.
© 2020 The Author(s). This work is published and licensed by Dove Medical Press Limited. The
full terms of this license are available at https://www.dovepress.com/terms
and incorporate the Creative Commons Attribution
- Non Commercial (unported, 3.0) License.
By accessing the work you hereby accept the Terms. Non-commercial uses of the work are permitted
without any further permission from Dove Medical Press Limited, provided the work is properly
attributed. For permission for commercial use of this work, please see paragraphs 4.2 and 5 of our Terms.