Back to Journals » OncoTargets and Therapy » Volume 11
High expression of TFEB is associated with aggressive clinical features in colorectal cancer
Authors Liang J, Jia X, Wang K, Zhao N
Received 13 July 2018
Accepted for publication 10 October 2018
Published 13 November 2018 Volume 2018:11 Pages 8089—8098
DOI https://doi.org/10.2147/OTT.S180112
Checked for plagiarism Yes
Review by Single anonymous peer review
Peer reviewer comments 5
Editor who approved publication: Dr William C. Cho
Jing Liang,1,* Xinfeng Jia,2,* Kun Wang,3,* Niankun Zhao4
1Department of Oncology, Tianjin Binhai New Area Dagang Hospital, Tianjin 300270, China; 2Geriatrics Department, Tianjin Civil Affairs Bureau Geriatric Hospital, Tianjin 300111, China; 3Department of Genitourinary Oncology, Tianjin Medical University Cancer Institute and Hospital, National Clinical Research Center for Cancer, Key Laboratory of Cancer Prevention and Therapy, Tianjin, Tianjin’s Clinical Research Center for Cancer, Tianjin 300030, China; 4Department of Internal Medicine, Tianjin Binhai New Area Dagang Hospital, Tianjin 300270, China
*These authors contributed equally to this work
Objectives: The transcription factor EB (TFEB), a member of the micropthalmia family, has been found to be associated with autophagy and upregulated in some kinds of tumors. However, very few studies focused on TFEB in colorectal cancer (CRC). TFEB expression status and its relevance to clinical features in CRC would be analyzed in this study.
Materials and methods: Real-time PCR, Western blot, and immunohistological staining were used to evaluate TFEB expression in CRC tissues and adjacent normal tissues, and the role of TFEB in CRC cell lines was investigated in vitro and in vivo.
Results: TFEB was expressed at lower level in CRC tissues than normal in both mRNA and protein level. However, there were significantly positive correlations between TFEB expression in cancer tissues and malignant progression of CRC. Cancers with TFEB overexpression always had deeper infiltration and higher lymphatic metastasis rate. Furthermore, patients with high TFEB levels always had poor survival, and higher TFEB expression could be a predictor of survival in multivariate analysis. Meanwhile, knockdown TFEB by shRNA or knockout TFEB by sgRNA in CRC cell lines could significantly inhibit cell proliferation and migration in amino acid-free medium. In addition, we found a positive relationship between TFEB and Beclin1 expression, and silencing TFEB inhibited Beclin1 expression in CRC cells.
Conclusion: TFEB expression correlated with aggressive clinical features in CRC, and higher TFEB expression could be a prognostic factor and potential treatment target of CRC.
Keywords: TFEB, colorectal cancer, clinicopathologic variables, prognostic factor, Beclin1
Introduction
Colorectal cancer (CRC) is a cancer with a high morbidity level and a high lethality rate worldwide.1,2 Aggressive CRC is a term commonly used to describe CRC with a poor prognosis, and aggressive clinical features of CRC always mean poor differentiation grade, positive metastasis status, and/or higher clinical Dukes stage. Even with advanced treatment with a combined approach of routine therapy and molecular targeting treatment, the median survival time was not significantly improved.3 Still, >50% of patients develop metastasis and recurrence after surgery.4,5 Therefore, early diagnosis and therapy hold a significant prognostic value. Meanwhile, identifying new biomarkers as well as specific therapeutic targets for CRC would improve the prognosis of CRC patients.6,7
Among many factors and mechanisms that are involved in CRC, researchers find that autophagy plays an important role when an enterocyte shifts from normal to malignant cell.8,9 Autophagy is a catabolic process of “self-eating” to destroy and recycle the unnecessary or damaged cell components to satisfy the needs of their growth in most cell types; hence, it plays an important role in maintaining cellular homeostasis.10,11 The whole process of autophagy is regulated by multiple proteins.12 Transcription factor EB (TFEB) is a master transcription factor directing the expression of hundreds of autophagy- and lysosomal-related genes.13 TFEB could be phosphorylated at nutrient-rich condition and then bound to 14-3-3, which is anchored in the cytoplasm of cells. At the condition of starvation, TFEB is dephosphorylated and translocated to the nucleus, in which it initiates the transcription of target genes involved in autophagy and lysosomal function.14 Beclin1, an ortholog of the Atg6 in yeast, plays an important role in a critical step of the autophagic process, by interacting with PI3K, which facilitates lipid membrane extension, cargo recruitment, and autophagosome maturation.12 Some studies have found that TFEB could affect the expression of Beclin1 in cancer cells.11,17
TFEB has been found to be upregulated in many kinds of tumors;15–17 however, very few studies focused on TFEB in CRC. Only one paper has shown that the expression of TFEB in tumors was significantly lower than normal tissues.18 In this study, we investigated the expression level of TFEB in CRC tissues and adjacent normal tissues and analyzed the correlation of TFEB with clinicopathological variables and survival of CRC patients.
Materials and methods
Patients and tissues
A total of 120 CRC tissues and adjacent tissues were obtained from patients who underwent radical resection at Tianjin Binhai New Area Dagang Hospital during 2009−2013. Five pairs of fresh tissues were collected from Tianjin Binhai New Area Dagang Hospital in 2017. All the patients were diagnosed by two pathology doctors according to the guideline of the World Health Organization and not treated with neoadjuvant therapy. This study complied with the Declaration of Helsinki and was approved by the Human Ethics and Research Ethics Committees of the hospital. In addition, written informed consents were obtained from all patients.
Antibodies
The primary antibodies used in this study are listed as follows: TFEB (Abcam, Cambridge, MA, USA), Beclin1 (Proteintech, Chicago, IL, USA), Ki-67 (Santa Cruz Biotechnology Inc., Dallas, TX, USA), caspase3 (Abcam), and GAPDH (Santa Cruz Biotechnology Inc.). The anti-mouse secondary antibodies (Santa Cruz Biotechnology Inc.), and anti-rabbit secondary antibodies (Zhongshan Goldbridge Biotechnology, Beijing, China) were purchased for Western blot. The secondary antibody PV6001 was obtained from Zhongshan Goldbridge Biotechnology for immunohistochemistry (IHC) assay.
RNA isolation and real-time PCR analysis
Total RNA was extracted using TRIzol reagent (Thermo Fisher Scientific, Waltham, MA, USA), and 1 μg of total RNA was reverse transcribed to cDNA using a Reverse Transcription Kit (Qiagen NV, Venlo, the Netherlands). Real-time PCR analyses were performed using SYBR-Green quantitative real-time PCR Master Mix Kit (Toyobo Co., Osaka, Japan). The primer sequences used were as follows: TFEB forward: 5′-GGTGCAGTCCTACCTGGAGA-3′, reverse: 5′-GTGGGCAGCAAACTTGTTCC-3′; GAPDH forward: 5′-AACGTGTCAGTGGT GGACCTG-3′, reverse: 5′-AGTGGGTGTCGCTGTTGAAGT-3′.
Western blot
Equal amount of proteins was separated by SDS-PAGE and then transferred to polyvinylidene fluoride (PVDF) membrane (EMD Millipore, Billerica, MA, USA); 5% nonfat dry milk was used to block PVDF membrane for 1 hour. The above PVDF membrane was incubated with the corresponding primary antibodies for overnight and then incubated with HRP-conjugated secondary antibodies for 1 hour at room temperature. Detection was performed by enhanced chemiluminescence (ECL) Western blotting kit.
IHC assay
Sections were deparaffinized and rehydrated; 3% hydrogen peroxide was used to block endogenous peroxidase, and then the sections were boiled in 10 mM citrate buffer (pH 6.0) for 3 minutes. After that, the sections were incubated with TFEB antibody (1:100 dilution) or Beclin1 (1:100 dilution) overnight at 4°C. Then the sections were incubated with PV6001 for 1 hour at 37°C and stained with DAB for 2 minutes. Five high-power fields from each slice were chosen and scored, the positive cells among 100 cells were counted in a 40×10 magnification manually. Patients with TFEB expression levels of ≤50% in sections were assigned to the low-expression group, whereas those with values >50% were assigned to the high-expression group.
Cell culture
HCT-116 and LoVo were purchased from American Type Culture Collection (ATCC, Manassas, VA, USA). These cells were maintained in DMEM containing 10% of FBS, 100 U/mL of penicillin, and 100 μg/mL of streptomycin (Thermo Fisher Scientific) at 37°C with 5% CO2.
Plasmid construction and cell infection
shRNAs were constructed into pLKO.1 plasmids. The shKHK sequence was 5′-TGGCAACAGTGCTCCCAATAG-3′ and was synthesized by Shanghai Genechem Co., Ltd. (Shanghai, China). sgctrl and sgTFEB were designed according to the Zhang laboratory’s protocol19 and then cloned into the lentiCRISPR/CAS9 vector. The sgTFEB sequence targeted 5′-CATTGACAACATTATGCGTC-3′. For TFEB overexpression, the gene sequences encoding TFEB was amplified from HCT-116 and cloned into the pcDNA3.1 plasmid according to the manufacturer’s instructions. Lipofectamine 2000 Reagents (Thermo Fisher Scientific) were used for cell transfection.
Cell Counting Kit-8 (CCK-8) for cell proliferation
The cells were seeded in a 96-well plate at a density of 1×10³ cells per well; 10 μL CCK-8 was added to the wells at different time points, and then absorbance was measured at 450 nm by a microplate reader.
Colony formation assay
A total of 2×10³ cells/well were seeded in a six-well plate and cultured for 10–14 days. Colonies were fixed with 10% formaldehyde for 30 minutes and stained with 0.5% crystal violet for 5 minutes. Then the colonies were photographed and analyzed.
In vitro migration assay
Cell migration was assessed using a Boyden chamber assay. Cells (5×10⁵) suspended in serum-free medium were transferred to the upper chamber (8 μM; Costar, Cambridge, MA, USA), and the latter were seeded in complete medium. After 24 hours, cells that had migrated to the bottom side of the membrane were fixed in 70% ethanol and stained with crystal violet.
Luciferase reporter assay
A reporter construct containing Beclin1 promoter was linked to a luciferase reporter gene, then CRC cell lines HCT116 and LoVo were cotransfected with 0.5 μg pGL3-Beclin1, 0.1 μg CMV-β-gal plasmid, and 1 μg shTFEB or shctrl plasmid in six-well plates using Fugene6® reagent (Promega Corporation, Fitchburg, WI, USA). After transfection, cells were lysed 48 hours and assayed for luciferase and β-galactosidase activities, with the former being normalized by the latter.
In vivo proliferation assay
Male BALB/c nude mice (4–5 weeks old) were purchased from the Model Animal Research Center of Nanjing University (Nanjing, China). The protocol was approved by the responsible governmental animal ethics committee. A total of 2×10⁶ HCT116 cells were inoculated subcutaneously in the right flank of the nude mice. Tumors were measured every 4 days, and tumor volume was calculated by length × width × width/2. Meanwhile, Ki-67 and caspase3 were also detected by IHC assay to analyze the tumor proliferation in vivo. All animal studies were approved by the Dagang Hospital in accordance with the principles and procedures outlined in the NIH Guide for the Care and Use of Laboratory Animals.
Statistical analysis
SPSS 19.0 was used. Chi-squared test was used to assess the correlation of TFEB expression and the pathological and clinical factors. Survival was analyzed by using the Kaplan–Meier analysis and Cox’s proportional hazard regression model. The standard two-tailed independent samples t-test was performed to compare the differences in two groups. The significance level was defined as P<0.05. All experiments were repeated three times (*P<0.05, **P<0.01).
Results
Expression of TFEB was inhibited in CRC tissues
To investigate the expression level of TFEB in CRC, we first analyzed its expression levels in The Cancer Genome Atlas (TCGA) database, and we found that TFEB mRNA was lower expressed in CRC tissues than normal tissues (Figure S1A, P<0.01). To further define the expression level of TFEB, real-time PCR and Western blot were used to detect TFEB mRNA and protein expression levels in five pairs of fresh specimens of CRC tissues and adjacent normal tissues. The results showed that both TFEB mRNA level (Figure 1A) and protein level (Figure 1B) were lower in CRC tissues than adjacent normal tissues. Then IHC was also used to evaluate TFEB expression in cancer and adjacent normal tissues in 120 patients with CRC, and as expected, the expression levels of TFEB were also lower in CRC tissues than adjacent normal tissues (P<0.01) (Figure 1C and D).
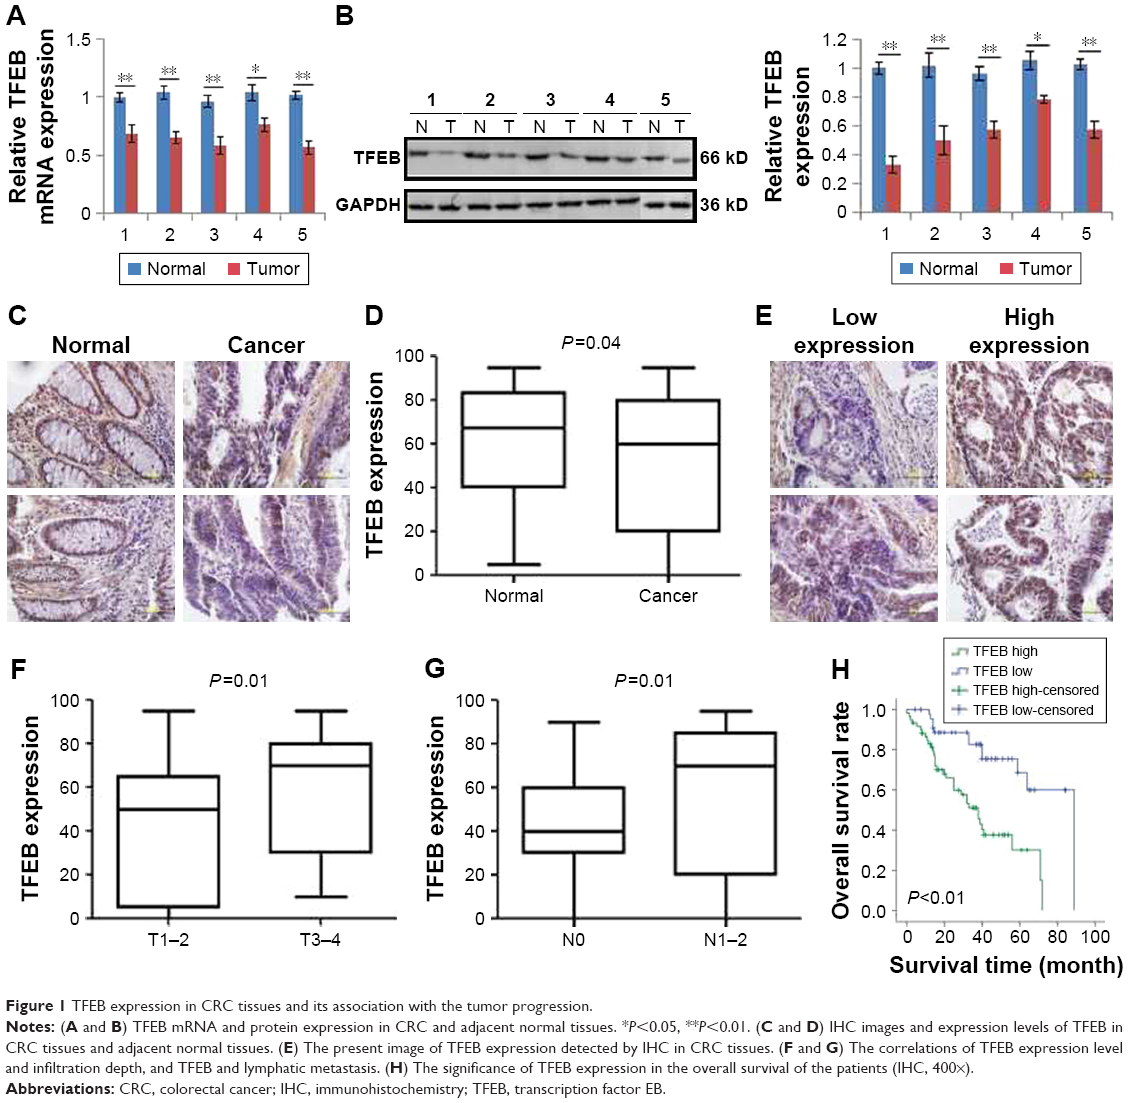 | Figure 1 TFEB expression in CRC tissues and its association with the tumor progression. |
High levels of TFEB expression are associated with aggressive clinical features
We had known that the expression of TFEB was inhibited in CRC tissues. To further explore the role of TFEB in CRC progression, we intensively analyzed the correlations between TFEB expression level and each clinicopathological variables such as age, sex, differentiation grade, infiltration depth, metastasis status, and Dukes stage using the TCGA database and our IHC results of TFEB. The results of TCGA database showed that there was no correlation between TFEB mRNA expression and age or sex (Figure S1B and C), but significant positive correlations between TFEB mRNA and infiltration depth, TFEB mRNA and lymphatic metastasis, TFEB mRNA and distant metastasis, and TFEB mRNA and clinical stage were found (Figure S1D–G). In addition, we analyzed the correlations of expression level of TFEB protein and clinicopathological variables in 120 CRC cases. We divided these cases into two groups (low-expression group and high-expression group) according to TFEB IHC score (Figure 1E). The results are summarized in Table 1, which shows that there are positive correlations between TFEB and infiltration depth (P=0.01, Figure 1F) and TFEB and lymphatic metastasis (P<0.01, Figure 1G).
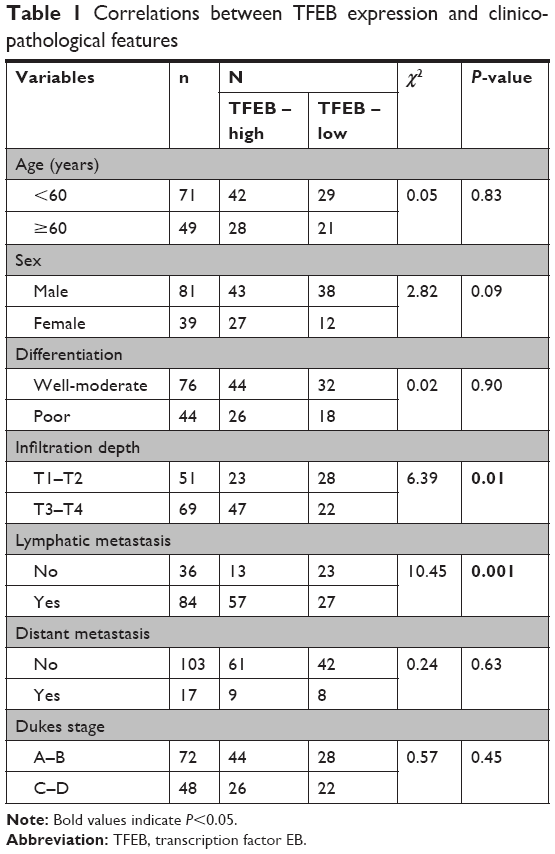 | Table 1 Correlations between TFEB expression and clinicopathological features |
Effect of TFEB on the prognosis of CRC patients
We first analyzed the effect of TFEB mRNA on the prognosis of CRC patients using the database of TCGA, and we found that TFEB mRNA has no effect on the overall survival of CRC patients (P=0.76, Figure S1I), but progression-free survival rate was significantly lower in the TFEB mRNA higher-expression group (P<0.01, Figure S1H). Meanwhile, Kaplan–Meier survival analysis was used to analyze the effect of TFEB on the survival of patients in our 120 cases, and the results showed that the patients with higher TFEB expression always have poor survival (P<0.01, Figure 1H). Furthermore, TFEB was a significant predictor of survival in multivariate analysis (HR=3.27; 95% CI=1.13–7.58, P<0.01), when entered into a model consisting all clinicopathologic variables (Table 2).
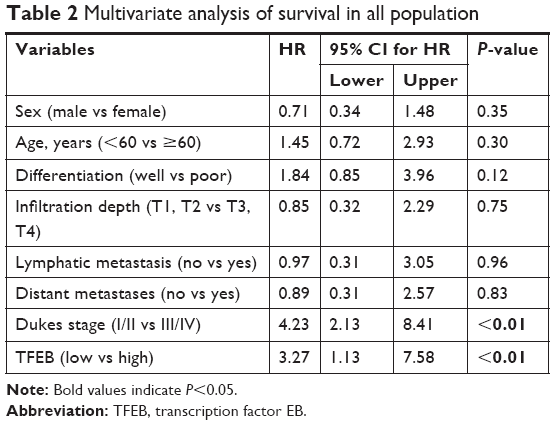 | Table 2 Multivariate analysis of survival in all population |
Silencing TFEB could inhibit cell growth and migration ability
Since TFEB expression was correlated with aggressive features of CRC, to further explore the role of TFEB in the ability of cell growth and migration in vitro, we first knocked down TFEB in CRC cell lines of HCT116 and LoVo using shRNA (Figure 2A). Compared with shctrl cells, the growth and colony formation ability of shTFEB cells were not affected in both HCT116 and LoVo (Figure 2B and C). Meanwhile, we also detected the change of migration ability of shTFEB cells and shctrl, but no difference was found in normal medium (Figure 2F). In consideration that TFEB is associated with autophagy, we thought whether shTFEB could affect the cell biology function when autophagy was induced, then the experiments were performed in AA-free medium. The results showed that shTFEB could significantly affect cell proliferation (Figure 2D), colony formation (Figure 2E), and migration ability (Figure 2G) in both HCT116 and LoVo in AA-free medium, which indicated that the role of TFEB in cell functions was more prominent in the cell medium of nutrient insufficiency.
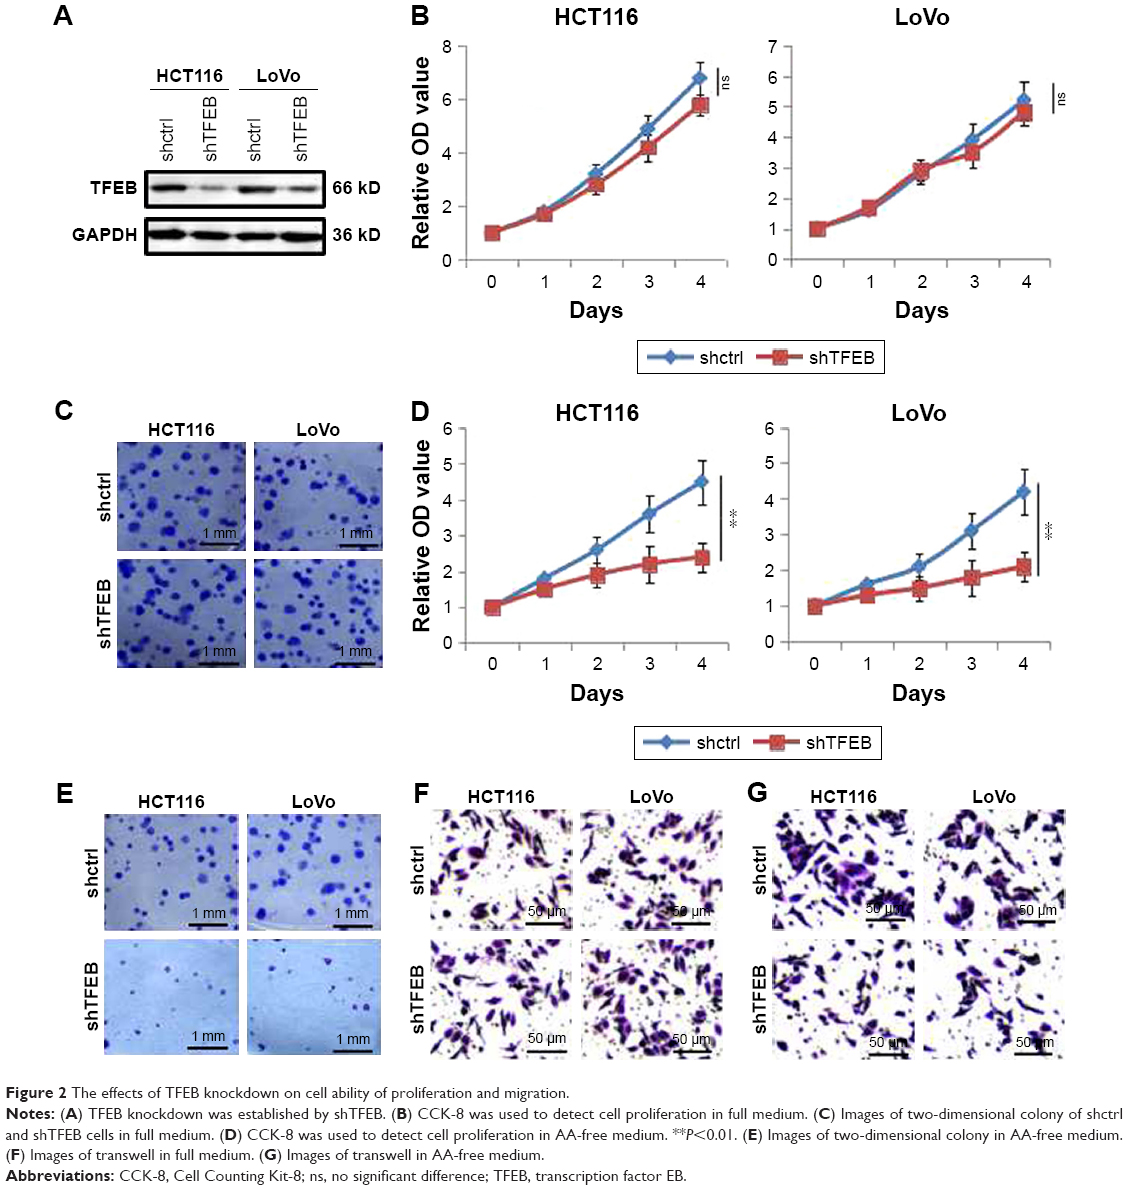 | Figure 2 The effects of TFEB knockdown on cell ability of proliferation and migration. |
Furthermore, we also constructed the cell line of sgTFEB in HCT116 using lentiCRISPR/CAS9 system, and the expression level of TFEB was significantly silenced in both protein level (Figure 3A) and mRNA level (Figure 3B). Similar experiments were also performed to detect the change of cell growth and migration ability in sgTFEB and sgctrl cells in AA-free medium, and the results showed that cell proliferation (Figure 3C), colony formation (Figure 3D), and migration ability (Figure 3E) were all inhibited in sgTFEB cells. When TFEB was resumed in sgTFEB, the abilities of cell proliferation and migration were resumed (Figure 3). Meanwhile, the animal experiment was also performed. We found that the tumor volumes of sgTFEB cells were significantly smaller than sgctrl cells, and TFEB overexpression could rescue the tumor growth (Figure 3F). Furthermore, the positive cells of Ki-67 were significantly decreased and the positive cells of Caspase3 were significantly increased in sgTFEB tumors (Figure 3G and H). All the results suggested that silencing TFEB could significantly inhibit cell proliferation and migration ability in CRC cells in nutrient insufficiency microenvironment.
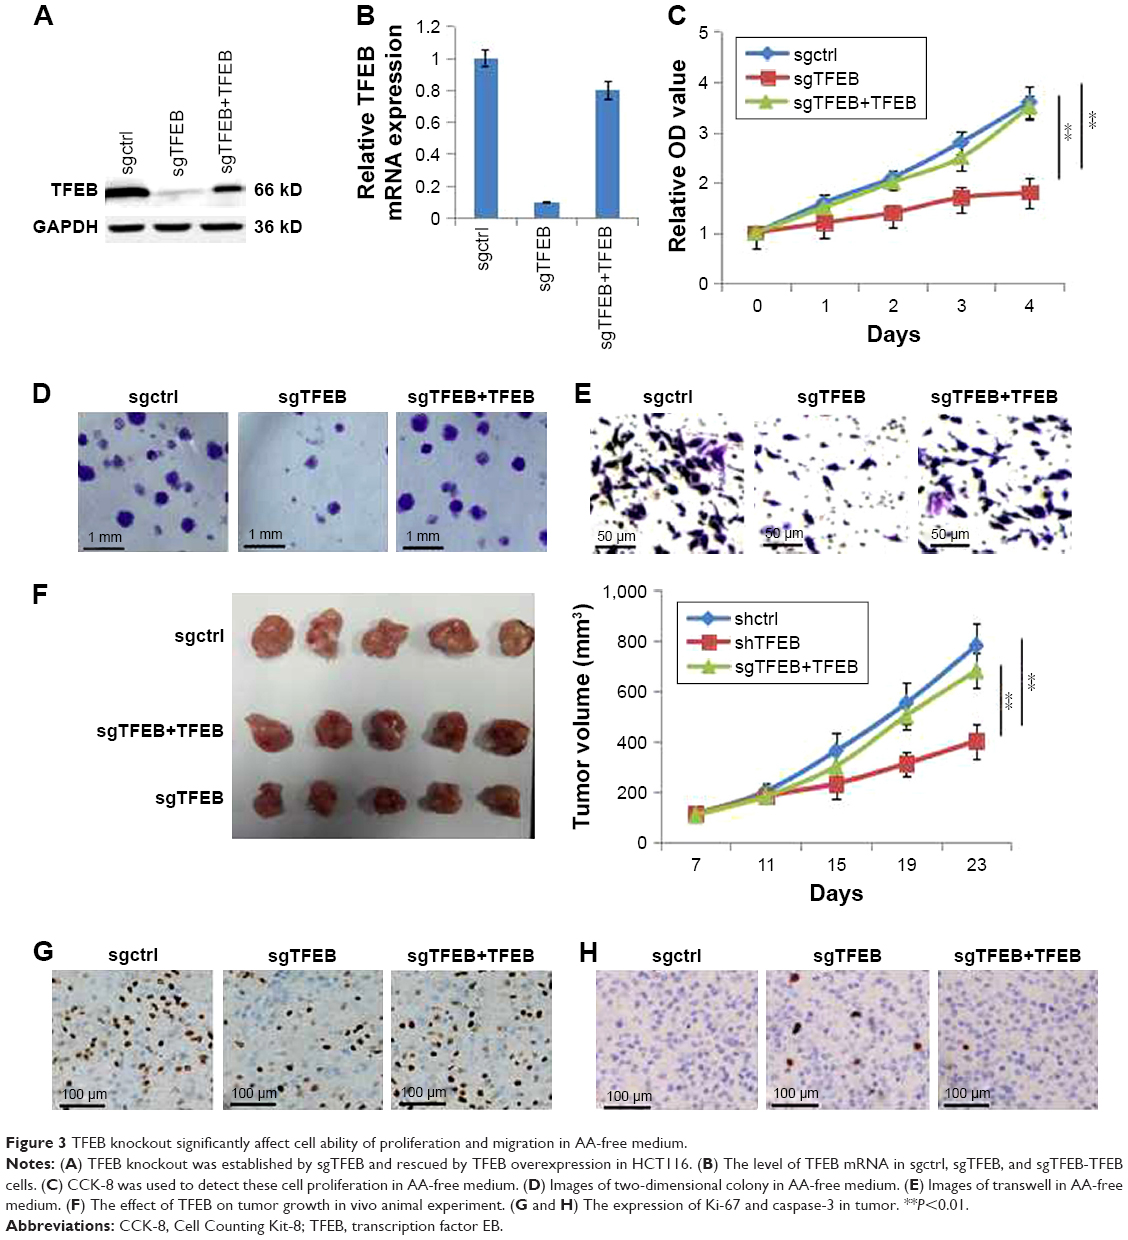 | Figure 3 TFEB knockout significantly affect cell ability of proliferation and migration in AA-free medium. |
Silencing TFEB inhibited the expression of Beclin1 in CRC cells
Since we found that silencing TFEB could significantly inhibit cell biology function in CRC cells in nutrient insufficiency microenvironment, we indicated that TFEB may play an important role in autophagy in CRC. Many reports have shown that TFEB could induce the expression of autophagy-associated proteins, including Beclin1. We first analyzed the correlation of TFEB and Beclin1 mRNA expression using TCGA database and found a positive correlation between these two genes (Figure 4A). Meanwhile, we also analyzed the correlation of TFEB and Beclin1 protein expression using the data of our IHC score (Figure 4B), and a significantly positive correlation was also found (Figure 4C). In addition, the protein level of Beclin1 was also significantly decreased in shTFEB cells in both HCT116 and LoVo (Figure 4D). As a transcription factor, luciferase reporter assay was used to detect the effect of TFEB on Beclin1 expression and showed that depletion of TFEB powerfully suppressed Beclin1 promoter ability (Figure 4E), and silencing TFEB could significantly inhibit Beclin1 expression in transcription level (Figure 4F).
 | Figure 4 TFEB affects the expression of Beclin1. |
Discussion
From the results, we found that, compared with adjacent normal tissues, the expression of TFEB was inhibited in CRC tissues. However, TFEB higher expression in CRC tissues was correlated with malignant progression of CRC and poor survival of CRC patients. In addition, silencing TFEB could significantly inhibit CRC cell ability of proliferation and migration in AA-free medium in vitro and inhibit tumor proliferation in vivo. All these results powerfully suggested that the higher expression of TFEB could accelerate cell proliferation and migration, which demonstrated that TFEB pathway may be a prognostic indicator and therapeutic target for CRC.
TFEB, a master transcription factor, could directly bind to the promoters of several autophagic lysosomal genes and lysosomal enzymes to promote their expression and regulate the autophagy progression in many kinds of cells,13 whereas the depletion of TFEB could inhibit the expression of lysosomal genes and affect intracellular clearance system in multiple cell types.20,21 In addition, TFEB also plays an important role in modulating organelle-specific autophagy through enhancing degradation of bulk autophagy substrates.22 Beclin1, interacting with PI3K, plays an important role in a critical step of the autophagic process.12 In our study, we found that there was a close correlation between TFEB and Beclin1 expression in CRC tissues, and silencing TFEB could significantly inhibit the promoter activity of Beclin1 and its expression in CRC cell lines.
Some papers have studied the oncogenic features of TFEB in cancer and found that chromosomal translocation of TFEB could cause a particular type of renal cancer.23 In addition to chromosomal translocation inducing renal cancer, TFEB could also induce renal cancer through amplification.24 Meanwhile, TFEB overexpression could promote the growth of pancreatic adenoductal carcinoma via inducing autophagy,25 and TFEB was also identified as being highly expressed in non-Hodgkin’s lymphoma.26 In this study, the expression of TFEB was inhibited in CRC tissues, however, consistent with other cancers, high levels of TFEB expression in CRC tissues are associated with aggressive clinical features and poor survival of CRC patients.
About autophagy in tumor genesis, the current hypothesis is that autophagy has dual and contradictory roles. In normal cells, autophagy could protect cells from malignant transformations. However, in tumor cells, autophagy could support tumor formation and metastasis in advanced stage.10 In our study, we think that it does not contradict that TFEB was highly expressed in normal colorectal tissues, in which TFEB and autophagy play a vital role. But when tumor has been formed or in late stage, TFEB would be highly expressed in CRC to regulate autophagy to promote tumor growth and metastasis. Hence, higher TFEB expression in CRC tissues was correlated with malignant progression of CRC and poor survival of CRC patients, and silencing TFEB in CRC cells could successfully inhibit cell growth and migration in nutrient deficiency microenvironment.
Conclusion
In conclusion, TFEB expression was inhibited in CRC cells, but higher TFEB expression correlated with aggressive clinical features in CRC. Meanwhile, higher TFEB expression was a prognostic factor of CRC. TFEB regulated cell autophagy through promoting Beclin1 expression; however, it is likely that future studies will have to address the identification of other proteins regulated by TFEB in CRC cells.
Acknowledgments
We appreciate all volunteers who participated in this study. And we also sincerely thank Tianjin Medical University Cancer Institute and Hospital for their assistance in experiments.
Disclosure
The authors report no conflicts of interest in this work.
References
Marley AR, Nan H. Epidemiology of colorectal cancer. Int J Mol Epidemiol Genet. 2016;7(3):105–114. | ||
Brody H. Colorectal cancer. Nature. 2015;521(7551):S1. | ||
Hines RB, Jiban MJH, Choudhury K, et al. Post-treatment surveillance testing of patients with colorectal cancer and the association with survival: protocol for a retrospective cohort study of the Surveillance, Epidemiology, and End Results (SEER)-medicare database. BMJ Open. 2018;8(4):e022393. | ||
Holch JW, Demmer M, Lamersdorf C, et al. Pattern and dynamics of distant metastases in metastatic colorectal cancer. Visc Med. 2017;33(1):70–75. | ||
Samawi HH, Shaheen AA, Tang PA, Heng DYC, Cheung WY, Vickers MM. Risk and predictors of suicide in colorectal cancer patients: a Surveillance, Epidemiology, and End Results analysis. Curr Oncol. 2017;24(6):e513–e517. | ||
Zarkavelis G, Boussios S, Papadaki A, Katsanos KH, Christodoulou DK, Pentheroudakis G. Current and future biomarkers in colorectal cancer. Ann Gastroenterol. 2017;30(6):613–621. | ||
Cuyle PJ, Prenen H. Current and future biomarkers in the treatment of colorectal cancer. Acta Clin Belg. 2017;72(2):103–115. | ||
Yu T, Guo F, Yu Y, et al. Fusobacterium nucleatum promotes chemoresistance to colorectal cancer by modulating autophagy. Cell. 2017;170(3):e516:548–563. | ||
Hu JL, He GY, Lan XL, et al. Inhibition of ATG12-mediated autophagy by miR-214 enhances radiosensitivity in colorectal cancer. Oncogenesis. 2018;7(2):16. | ||
Wilde L, Tanson K, Curry J, Martinez-Outschoorn U. Autophagy in cancer: a complex relationship. Biochem J. 2018;475(11):1939–1954. | ||
Russo M, Russo GL. Autophagy inducers in cancer. Biochem Pharmacol. 2018;153:51–61. | ||
Zhang J, Wang G, Zhou Y, Chen Y, Ouyang L, Liu B. Mechanisms of autophagy and relevant small-molecule compounds for targeted cancer therapy. Cell Mol Life Sci. 2018;75(10):1803–1826. | ||
Napolitano G, Ballabio A. TFEB at a glance. J Cell Sci. 2016;129(13):2475–2481. | ||
Nezich CL, Wang C, Fogel AI, Youle RJ. MiT/TFE transcription factors are activated during mitophagy downstream of Parkin and Atg5. J Cell Biol. 2015;210(3):435–450. | ||
Li L, Sun B, Gao Y, Niu H, Yuan H, Lou H. STAT3 contributes to lysosomal-mediated cell death in a novel derivative of riccardin D-treated breast cancer cells in association with TFEB. Biochem Pharmacol. 2018;150:267–279. | ||
Klein K, Werner K, Teske C, et al. Role of TFEB-driven autophagy regulation in pancreatic cancer treatment. Int J Oncol. 2016;49(1):164–172. | ||
Giatromanolaki A, Kalamida D, Sivridis E, et al. Increased expression of transcription factor EB (TFEB) is associated with autophagy, migratory phenotype and poor prognosis in non-small cell lung cancer. Lung Cancer. 2015;90(1):98–105. | ||
Zeng C, Matsuda K, Jia WH, et al. Identification of susceptibility loci and genes for colorectal cancer risk. Gastroenterology. 2016;150(7):1633–1645. | ||
Joung J, Konermann S, Gootenberg JS, et al. Genome-scale CRISPR-Cas9 knockout and transcriptional activation screening. Nat Protoc. 2017;12(4):828–863. | ||
Ploper D, Taelman VF, Robert L, et al. MITF drives endolysosomal biogenesis and potentiates Wnt signaling in melanoma cells. Proc Natl Acad Sci U S A. 2015;112(5):E420–E429. | ||
Medina DL, Fraldi A, Bouche V, et al. Transcriptional activation of lysosomal exocytosis promotes cellular clearance. Dev Cell. 2011;21(3):421–430. | ||
Settembre C, de Cegli R, Mansueto G, et al. TFEB controls cellular lipid metabolism through a starvation-induced autoregulatory loop. Nat Cell Biol. 2013;15(6):647–658. | ||
Malouf GG, Su X, Yao H, et al. Next-generation sequencing of translocation renal cell carcinoma reveals novel RNA splicing partners and frequent mutations of chromatin-remodeling genes. Clin Cancer Res. 2014;20(15):4129–4140. | ||
Durinck S, Stawiski EW, Pavía-Jiménez A, et al. Spectrum of diverse genomic alterations define non-clear cell renal carcinoma subtypes. Nat Genet. 2015;47(1):13–21. | ||
Perera RM, Stoykova S, Nicolay BN, et al. Transcriptional control of autophagy-lysosome function drives pancreatic cancer metabolism. Nature. 2015;524(7565):361–365. | ||
Gayle S, Landrette S, Beeharry N, et al. Identification of apilimod as a first-in-class PIKfyve kinase inhibitor for treatment of B-cell non-Hodgkin lymphoma. Blood. 2017;129(13):1768–1778. |
Supplementary material
 | Figure S1 TFEB expression in CRC in TCGA database. |
 © 2018 The Author(s). This work is published and licensed by Dove Medical Press Limited. The
full terms of this license are available at https://www.dovepress.com/terms
and incorporate the Creative Commons Attribution
- Non Commercial (unported, 3.0) License.
By accessing the work you hereby accept the Terms. Non-commercial uses of the work are permitted
without any further permission from Dove Medical Press Limited, provided the work is properly
attributed. For permission for commercial use of this work, please see paragraphs 4.2 and 5 of our Terms.
© 2018 The Author(s). This work is published and licensed by Dove Medical Press Limited. The
full terms of this license are available at https://www.dovepress.com/terms
and incorporate the Creative Commons Attribution
- Non Commercial (unported, 3.0) License.
By accessing the work you hereby accept the Terms. Non-commercial uses of the work are permitted
without any further permission from Dove Medical Press Limited, provided the work is properly
attributed. For permission for commercial use of this work, please see paragraphs 4.2 and 5 of our Terms.