Back to Journals » Cancer Management and Research » Volume 11
High expression of SMARCE1 predicts poor prognosis and promotes cell growth and metastasis in gastric cancer
Authors Liu H, Zhao YR, Chen B, Ge Z, Huang JS
Received 19 November 2018
Accepted for publication 7 March 2019
Published 23 April 2019 Volume 2019:11 Pages 3493—3509
DOI https://doi.org/10.2147/CMAR.S195137
Checked for plagiarism Yes
Review by Single anonymous peer review
Peer reviewer comments 2
Editor who approved publication: Dr Rituraj Purohit
Hao Liu,1 Yan-Rong Zhao,2 Bo Chen,1 Zheng Ge,3 Jiang-Sheng Huang1
1Department of Minimally Invasive Surgery, The Second Xiangya Hospital, Central South University, Changsha, Hunan, People’s Republic of China; 2Department of General Surgery, Xiangya Hospital, Central South University, Changsha, Hunan, People’s Republic of China; 3Department of General Surgery, Huaihe Hospital, Henan University, Kaifeng, Henan, People’s Republic of China
Background: Gastric cancer (GC) is one of the most lethal cancers worldwide with a high risk for recurrence and metastasis. Therefore, further understanding of the metastatic mechanism and the development of treatment strategies are required. Although increasing evidence suggests that SWI/SNF Related, Matrix Associated, Actin Dependent Regulator of Chromatin, Subfamily E, Member 1 (SMARCE1) promotes cancer metastasis, its role in GC remains unclear.
Materials and methods: GC samples (n=122) were used to investigate the association between SMARCE1 expression, patient clinicopathological features, and prognosis. The expression of SMARCE1 in GC tissues was measured using real-time polymerase chain reaction, western blotting, and immunohistochemistry. MGC-803 and AGS cells were transfected with lentivirus to upregulate or downregulate SMARCE1 expression. The roles of SMARCE1 in GC cell proliferation, migration, and invasion were determined using Cell Counting Kit-8 assay, colony formation assay, wound healing, transwell migration, and invasion assay. Nude mice models were established to observe tumorigenesis. The specific mitogen-activated protein kinase (MAPK) inhibitor U0126 was utilized to verify the involved pathway.
Results: SMARCE1 was highly expressed in GC tissues and cell lines. High expression of SMARCE1 was correlated with the malignant clinicopathological characteristics of GC patients, including tumor size, depth of invasion, degree of differentiation, lymph node involvement, and TNM stage (all P<0.05). Kaplan–Meier survival analysis revealed that high SMARCE1 expression predicted poor prognosis in GC patients (P<0.01). Moreover, SMARCE1 was an independent risk factor of poor prognosis (P<0.01). Functional study revealed that overexpression of SMARCE1 markedly promoted the proliferation, migration, and invasion of GC cells in vitro and tumorigenesis in vivo. Furthermore, SMARCE1 activated the MAPK/ERK signaling pathway. U0126 significantly inhibited the SMARCE1-induced proliferation and mobility of GC cells.
Conclusion: SMARCE1 promoted growth and metastasis of GC, indicating its potential usefulness as a prognostic biomarker and target for therapeutic intervention against this disease.
Keywords: SMARCE1, gastric cancer, prognosis, proliferation, metastasis
Introduction
Gastric cancer (GC) is one of the most common types of cancers worldwide, and the third and fifth leading cause of cancer-related death in males and females, respectively.1 Although the available treatment options have been greatly improved, the prognosis of GC patients remains poor because of recurrence and metastasis after surgical resection.2,3 Hence, it is necessary to investigate the molecular mechanisms underlying GC carcinogenesis and metastasis for the development of innovative therapeutic options and strategies.
SWI/SNF Related, Matrix Associated, Actin Dependent Regulator of Chromatin, Subfamily E, Member 1 (SMARCE1) – also known as BAF57 – is a core subunit of the mammalian SWI/SNF ATP-dependent chromatin remodeling complex.4 Tumorigenesis is closely related to gene transcription, DNA replication error, and DNA repair,5–7 which are regulated in part by the chromatin remodeling complex.8–10 Thus, SMARCE1 – a core member of this complex – has gradually attracted attention in cancer research.11–13 Initially, members of this complex (including SMARCE1) were considered tumor suppressors.14,15 However, recent studies demonstrated that SMARCE1 plays an oncogenic and aggressive role in cancer,16–19 despite other research reporting a converse standpoint.20–22 This controversy in data indicates that SMARCE1 plays a diverse role in tumorigenesis and progression of cancers originating from different tissues. Crucially, the role of SMARCE1 in GC has not been investigated.
In this study, we initially examined the expression level of SMARCE1 in GC tissues and cell lines. Subsequently, we analyzed the correlation of SMARCE1 with the clinicopathological features and overall survival (OS) of GC patients. A multivariate analysis was used to determine whether SMARCE1 is an independent risk factor of OS in GC patients. Furthermore, we investigated the roles of SMARCE1 in the proliferation, migration, and invasion of GC cells in vitro and tumorigenesis in vivo. In addition, we aimed to identify the signaling pathway through which SMARCE1 may be involved in GC.
Materials and methods
Patients and samples
In this study, tissue specimens were collected from 122 GC patients who underwent surgery at the Second Xiangya Hospital of Central South University (Changsha, China) from May 2010 to June 2012. The clinical pathological characteristics of all patients and correlation with SMARCE1 expression are shown in Table 1. Among these patients, 20 matched fresh GC tissues and adjacent non-tumor (NT) tissues were collected for quantitative real-time PCR (qRT-PCR) and western blotting. These patients did not receive preoperative chemotherapy or radiotherapy.
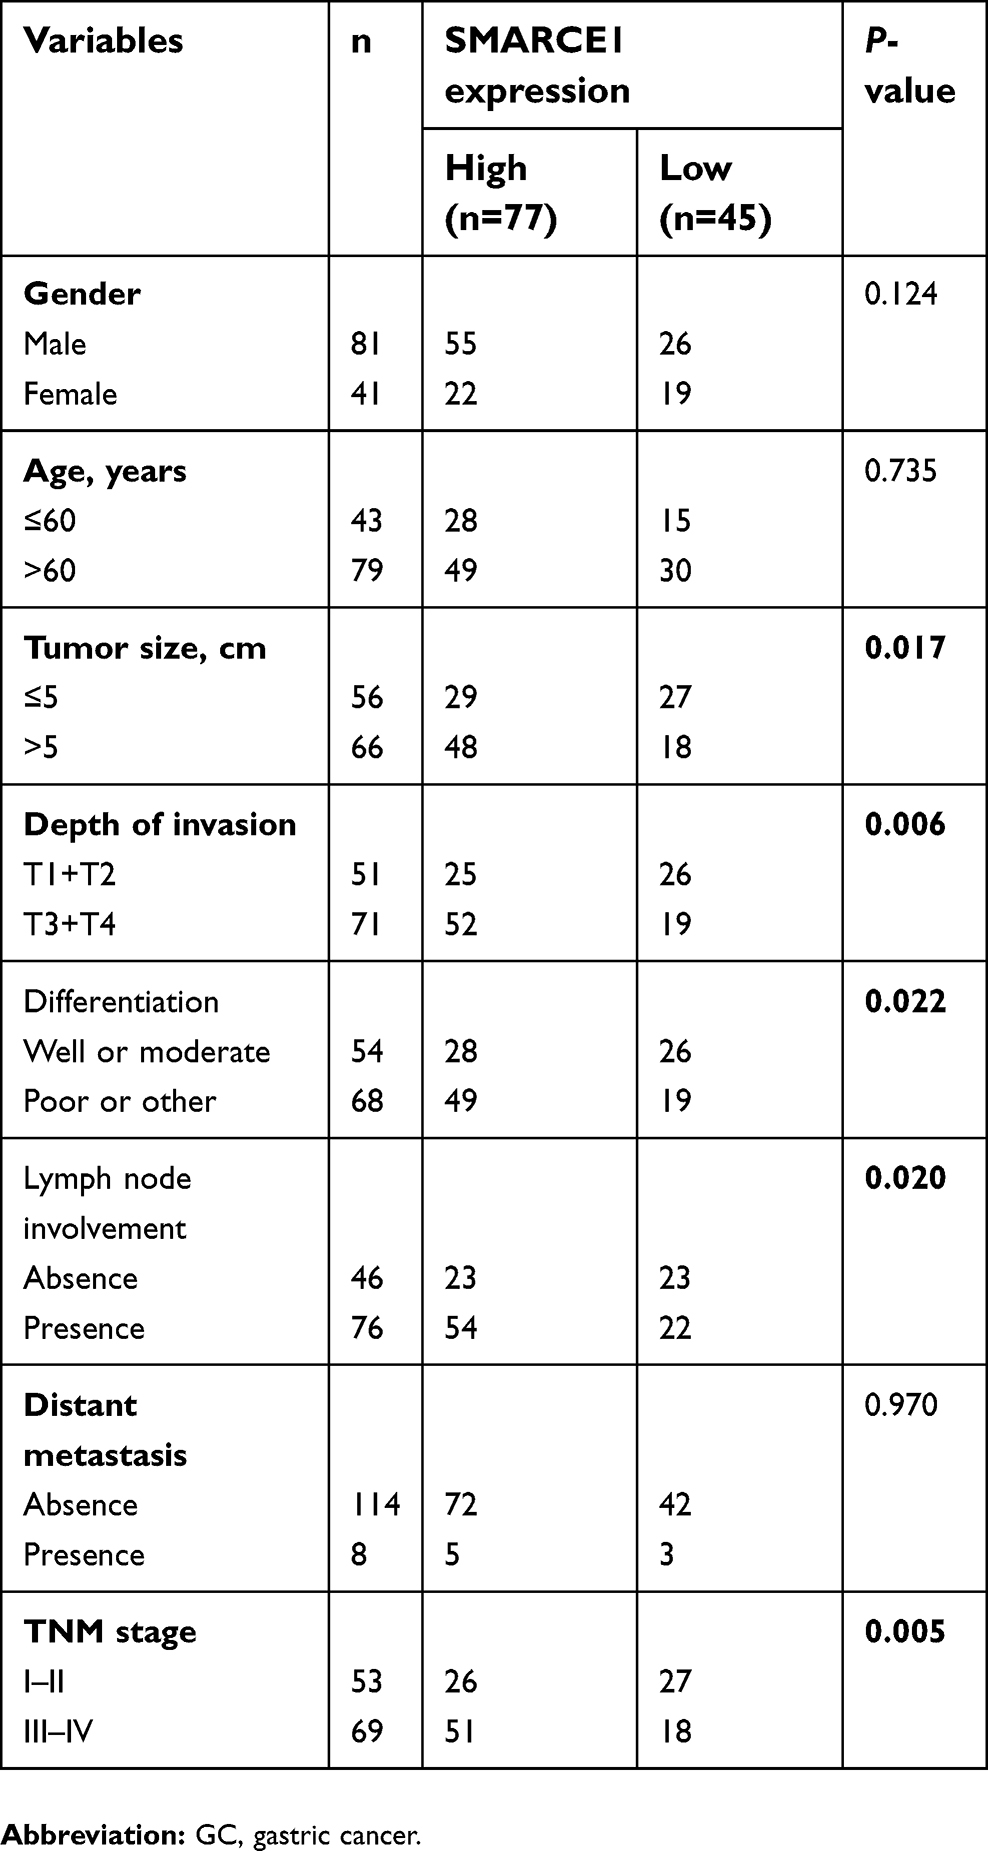 | Table 1 Correlation of SMARCE1 expression with the clinicopathological characteristics of GC patients |
RNA isolation and qRT-PCR analysis
Total RNA was extracted using the TRIzol reagent (Invitrogen, Carlsbad, CA, USA Thermo Fisher Scientific, Waltham, MA, USA). cDNA was synthesized using the RevertAid First Strand cDNA Synthesis kit (Fermentas, Compton, CA, USA), followed by qRT-PCR using the SYBR Green PCR kit (Toyobo, Osaka, Japan). Each sample was analyzed in triplicate. Glyceraldehyde-3-Phosphate Dehydrogenase (GAPDH) served as internal control. SMARCE1 primers were synthesized and purchased from Sangon Biotech Company (Shanghai, China) as follows: forward: 5ʹ-CCACCAGATAAGCCGCTGATGC-3ʹ and reverse: 5ʹ-TCTCGCCACATGCCACCAATAATC-3ʹ; GAPDH forward: 5ʹ-CCGAGAATGGGAAGCTTGTC-3ʹ and reverse: 5ʹ-AAGCACCAACAGAGGAGAA-3ʹ. The 2−∆∆Ct method was used to analyze the qRT-PCR results.
Western blotting analysis
Total proteins were extracted by lysing cells in radio-Immunoprecipitation assay buffer (50 mM Tris, pH 7.4, 150 mM NaCl, 1% Triton X-100, 1% sodium deoxycholate, 0.1% SDS) (Beyotime, Shanghai, China) supplemented with 1% protease inhibitor cocktail (NCM Biotech Co. Ltd, Suzhou, China). Proteins were separated through 10% sodium dodecyl sulfate polyacrylamide gel electrophoresis (Beyotime) and electrotransferred onto polyvinylidene fluoride membrane (Millipore, Billerica, MA, USA). The blotted membranes were blocked in 5% skimmed milk (Biosharp, Hefei, China) for 1 h at room temperature, followed by incubation with primary antibodies against SMARCE1 (1:1,000, Affinity Biosciences, Cincinnati, OH, USA), p-ERK1/2 (1:1,000, Abcam, Cambridge, MA, USA), ERK1/2 (1:1,000, Affinity Biosciences, Cincinnati, OH, USA), MMP9 (1:1,000, Affinity Biosciences, Cincinnati, OH, USA), cyclin D1 (1:1,000, Affinity Biosciences, Cincinnati, OH, USA), and β-actin (1:1,000, Proteintech, Rosement, IL, USA) under gentle rocking at 4 °C overnight. After washing, the membranes were incubated with horseradish peroxidase (HRP)-conjugated secondary antibodies (1:10,000, Zhongshan Gold Bridge Biotechnology, Beijing, China) at room temperature for 30 min. An enhanced chemiluminescence kit (NCM Biotech Co. Ltd) was used to perform chemiluminescent detection. The gray values of the target bands were analyzed using the ImageJ software (NIH Image, Bethesda, MD, USA).
Immunohistochemistry (IHC)
Formalin-fixed and paraffin-embedded tissue sections (4 μm) were stained using the polymer HRP detection system (Zhongshan Gold Bridge Biotechnology). The paraffin sections were dewaxed in xylene and rehydrated with graded ethanol, followed by antigen retrieval using 0.01 M sodium citrate buffer (pH 6.0). The endogenous peroxidase was eliminated using 0.3% hydrogen peroxide. Subsequently, the sections were blocked with 10% goat serum (Solarbio, Beijing, China) for 30 min at room temperature. The sections were incubated with SMARCE1 antibody (1:200, Affinity Biosciences, Cincinnati, OH, USA) and ki-67 antibody (1:300, Cell Signaling Technology, Beverly, MA, USA) overnight at 4 °C in a humidified chamber, followed by incubation with HRP-conjugated secondary antibody (Zhongshan Gold Bridge Biotechnology) at room temperature for 30 min. After washing thrice with phosphate-buffered saline, antibody binding was detected using diaminobenzidine (Zhongshan Gold Bridge Biotechnology). Tissue sections were counterstained using hematoxylin (Sigma-Aldrich, St. Louis, MO, USA), dehydrated with graded ethanol, mounted on coverslips using neutral resins (Solarbio). Appropriate positive and negative controls were included for each IHC experiment. All stained sections were evaluated by two investigators in a blinded manner. Immunohistochemical staining was scored according to the percentage of positively stained tumor cells in a field as follows: 0 (<5%), 1 (5–30%), 2 (31–50%), 3 (51–80%), and 4 (>80%).23 Subsequently, the GC specimens were divided according to their protein expression into the low-expression group (0–1) and high-expression group (2–4) for further analysis.
Cell culture
Human GC cell lines (MGC-803, BGC-823, MKN-28, and AGS) and normal gastric mucosa line GES-1 were purchased from the Type Culture Collection of the Chinese Academy of Sciences (Shanghai, China). The cells were cultivated in Roswell Park Memorial Institute’s (RPMI) 1640 medium supplemented with 10% fetal bovine serum (FBS) (Gibco, Carlsbad, CA, USA Thermo Fisher Scientific). All cells were grown at 37 °C in an atmosphere containing 5% CO2.
Production of stable cell lines
The SMARCE1 ectopic expression, knockdown, and control lentiviruses were purchased from GeneChem (Shanghai, China). MGC-803 and AGS cells were infected with ectopic expression lentivirus, or lentiviral containing short hairpin RNAs (shRNA) targeting SMARCE1 according to the manufacturer’s instructions. The shRNA sequences of SMARCE1 were as follows: shSMARCE1-1: 5ʹ-GGTCCAGTCCTTAATGGTT-3ʹ; shSMARCE1-2: 5ʹ-CCTAAAGTTGTGGGAGATT-3ʹ; shSMARCE1-3: 5ʹ-GCTGAAGATCCAGATGATT-3ʹ. Cells transfected with empty vector were used as negative controls. Following lentiviral transfection, the infected cells were subsequently screened in freshed medium with 2.5 μg/mL puromycin (Sigma-Aldrich). Every three days, the fresh medium with 2.5 μg/mL puromycin (Sigma-Aldrich) was replaced. After 10–14 days, the transfected single-cell clonal isolates survived. The efficiency of transduction was verified by qRT-PCR and western blotting analysis.
Cell Counting Kit-8 (CCK-8) assay and colony formation assay
The CCK-8 assay was performed according to the instructions provided by the manufacturer (Dojindo Molecular Technologies, Kumamoto, Japan). For the CCK-8 assay with a specific mitogen-activated protein kinase (MAPK) inhibitor, cells were treated with 10 µM U0126 (Selleck Chemicals LLC, Shanghai, China). For the colony formation assay, 5×10² cells per well were seeded in a six-well plate (NEST, Wuxi, China) and cultured for 2 weeks. Colonies were stained with 1% crystal violet (Solarbio) and counted. Each experiment was performed in triplicate.
Wound healing assay
Cells were seeded in six-well plates. At a 90% cell confluence, wounds were created by scraping the confluent cell monolayers using a sterile 10-µl pipette tip. Serum-free medium with mitomycin-C (10 µg/mL, Sigma-Aldrich) was used to suppress cell proliferation. The healing area was assessed after 24 h. Each experiment was performed in triplicate.
Transwell migration and invasion assay
For the cell invasion and migration assay, transwell chambers with 8-µm pores (Corning Costar Corp., Cambridge, MA, USA) were coated with or without 200 µl Matrigel at 200 µg/mL (BD Biosciences, San Jose, CA, USA) and incubated overnight. A total of 1×10⁵ cells incubated in serum-free medium were seeded in the upper chambers. The lower chamber was filled with RPMI 1640 medium containing 10% FBS. After incubation for 24 h at 37 °C, the cells which remained in the upper chamber were removed using a wet swab. The cells which remained in the lower surface were fixed with 4% paraformaldehyde, stained with 0.1% crystal violet dye (Solarbio) for 10 min at room temperature, and counted using an inverted microscope (Nikon, Tokyo, Japan). Each assay was performed in triplicate.
Immunofluorescence (IF)
For cytoskeleton staining, cells were cultured on the glass coverslips (NEST), fixed with 4% paraformaldehyde, permeabilized with 0.5% Triton X-100 (Beyotime), and stained with Phalloidin (Sigma-Aldrich) according to the protocol provided by the manufacturer. Subsequently, 4ʹ,6-diamidino-2-phenylindole (Solarbio) was used to counterstain the cell nucleus. After mounting on the coverslips, the cells were visualized using a fluorescence microscope (Leica, Solms, Germany).
Subcutaneous tumor model in nude mice
BALB/c nude mice were purchased from SLAC Laboratory Animal Co. (Shanghai, China). A total of 5×10⁶ cells were subcutaneously injected into the left upper flank regions of BALB/c nude mice (5 mice per group). The size of the tumor nodules was measured every 5 days. One month later, all mice were sacrificed and the tumor nodules were removed and weighed. The tumor size was calculated as follows: volume (m3) =1/2 length × width2.
Statistical analysis
All quantified data are shown as the mean ± SD. Statistical analysis was conducted using the SPSS 19.0 (IBM Corporation, Armonk, NY, USA) software. Two-tailed Student’s independent sample t-test was used for comparisons of continuous values between two independent groups. The association between SMARCE1 expression and the clinicopathological characteristics of GC was analyzed using the Chi-squared test. OS was analyzed using the Kaplan–Meier method, and the log-rank test was used to compare the survival between two groups. Univariate and multivariate analyses were conducted using the Cox proportional hazards regression model. A P<0.05 denoted statistical significance.
Ethics statement
According to the Declaration of Helsinki, written informed consent was obtained from all the patients/patients’ families. The present study and all experimental procedures were approved by the Ethics Committee of The Second Xiangya Hospital of Central South University. All experiments involving animals were performed in accordance with the guidelines of the Laboratory Animal Ethics Committee of Central South University.
Results
SMARCE1 is upregulated in GC
Initially, we used the online Cancer Genome Atlas (TCGA,
 | Figure 1 SMARCE1 is upregulated in GC tissues.Notes: (A and B) the mRNA expression of SMARCE1 was significantly higher in GC tissues than in normal tissues according to TCGA data ( |
Elevated SMARCE1 correlates with poor clinicopathological features and indicates poor prognosis in GC patients
The IHC analysis showed that staining for SMARCE1 was markedly stronger in GC tissues than that observed in NT tissues (Figure 2A). Furthermore, clinical data suggested that elevated SMARCE1 expression was significantly correlated with tumor size, depth of invasion, differentiation, lymph node involvement, and TNM stage (Table 1). Survival analysis from the TCGA showed that GC patients with high SMARCE1 expression were associated with poor OS (Figure 2B). Consistently, our survival analysis showed that high expression of SMARCE1 in GC patients was linked to poor OS (Figure 2C). More importantly, the multivariate analysis showed that high SMARCE1 expression was an independent risk factor of poor OS in GC patients (Table 2). These results indicate that SMARCE1 may be a novel independent prognosis biomarker for GC patients and play important roles in GC progression.
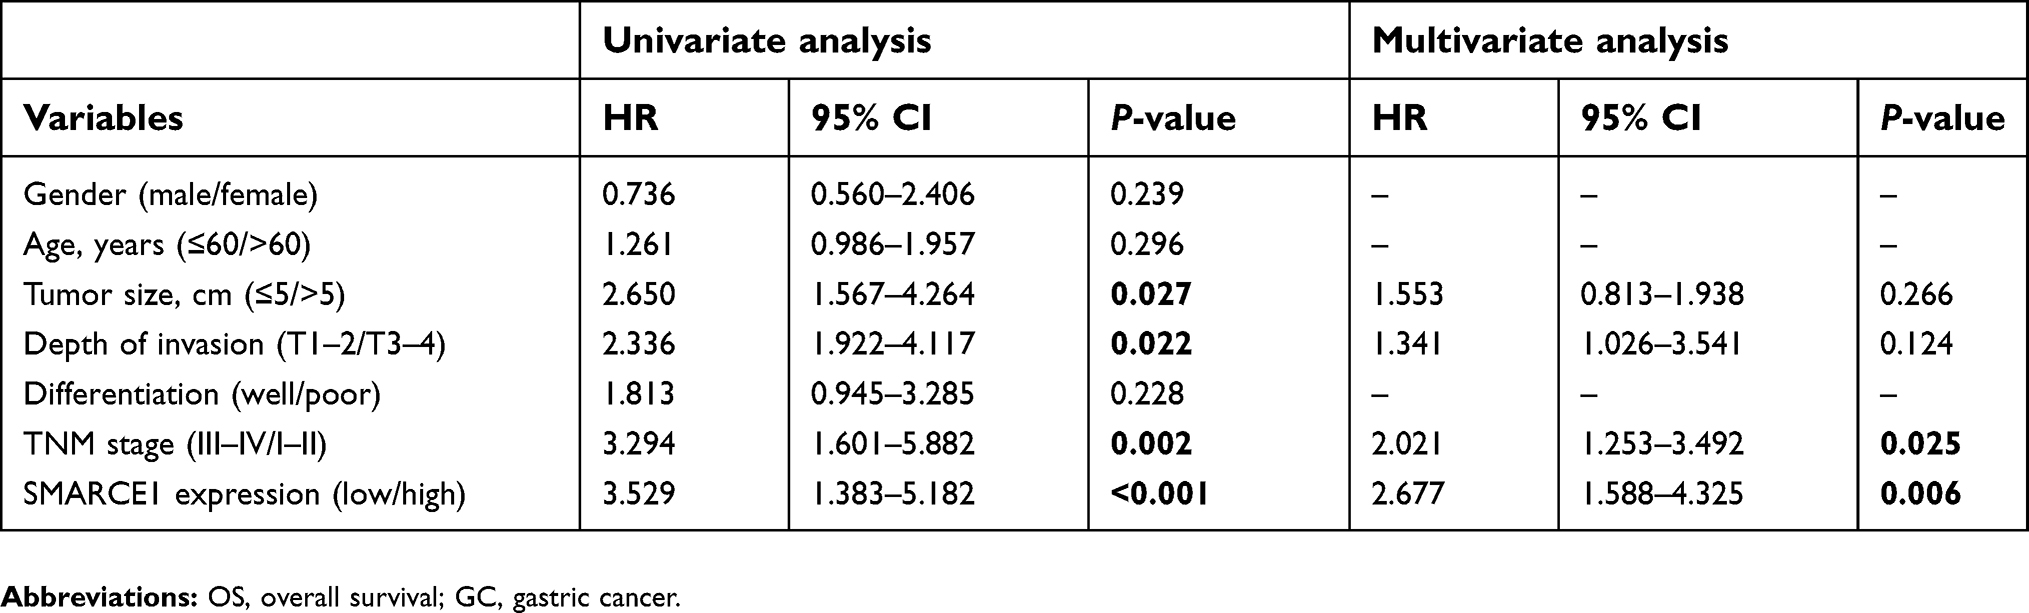 | Table 2 Uni- and multivariate analysis for risk factors of OS in GC patients |
 | Figure 2 Elevated SMARCE1 expression indicates poor prognosis in GC patients.Notes: (A) Representative image of SMARCE1 immunohistochemical staining in 122 paired NT and human GC samples. Up: magnification ×100; down: magnification x400. (B) High SMARCE1 expression showed poor survival in GC patients in TCGA dataset. (C) The Kaplan–Meier curve and log-rank test for OS from our data showed poor survival in GC patients with high SMARCE1 expression.Abbreviations: GC, gastric cancer; NT, adjacent non-tumor tissues; TCGA, The Cancer Genome Atlas; TPM, transcripts per million. |
The expression level of SMARCE1 in GC cell lines and transfection efficiency in AGS and MGC-803 cells
The qRT-PCR and western blotting analyses showed that the mRNA and protein levels of SMARCE1 in four GC cell lines (ie, MGC-803, BGC-823, MKN-28, and AGS) were significantly higher than those observed in the gastric mucosa cell line GES-1 (Figure 3A and B). The MGC-803 and AGS cell lines demonstrated the lowest and highest expression of SMARCE1, respectively. Subsequently, we selected MGC-803 and AGS cells to construct corresponding models of ectopic expression or knockdown of SMARCE1 through lentivirus transfection for further functional investigation. Following stable transfection, qRT-PCR and western blotting were used to analyze the efficiency of SMARCE1 overexpression or knockdown in both cell lines. For AGS and MGC-803 cells, the shRNA-3 exhibited the most efficient knockdown of SMARCE1 among the three shRNAs (Figures 3C, D and S1A). SMARCE1 was visibly elevated after transfection with the overexpression lentivirus in AGS and MGC-803 cells (Figures 3E, F and S1B).
 | Figure 3 SMARCE1 expression in GC cells and lentiviral transfection efficiency in AGS and MGC-803 cells.Notes: (A) The mRNA level of SMARCE1 in GC cells and gastric mucosa cell line GES-1 was measured using qRT-PCR. (B) Protein expression of SMARCE1 was determined through western blotting. (C and D) The knockdown efficiency of three shRNA targeting SMARCE1 in AGS was detected using qRT-PCR and western blotting; shSMARCE1-3 was the most effective. (E and F) The overexpression efficiency of SMARCE1 in MGC-803 cells was measured through qRT-PCR and western blotting. *P<0.05; **P<0.01; ***P<0.001.Abbreviations: GC, gastric cancer; qRT-PCR, quantitative real-time PCR. |
SMARCE1 promotes GC cell growth in vitro and in vivo
We performed CCK-8 assay and colony formation assay in vitro to determine the role of SMARCE1 in the proliferation of GC cells. The CCK-8 assay showed that the overexpression of SMARCE1 enhanced the viability of AGS and MGC-803 cells (Figures 4A and S1C). In addition, the colony formation assay demonstrated enhanced colony growth in GC cells with high SMARCE1 expression versus those with low SMARCE1 expression (Figures 4B and S1D). Furthermore, we examined the protein expression of SMARCE1 and ki-67 through IHC in 80 human GC tissues, and found a strong positive correlation between SMARCE1 and ki-67 (Figure 4C and D). To further verify the role of SMARCE1 in GC growth, we subcutaneously injected cells with ectopic expression of SMARCE1 and control cells into nude mice for the production of xenograft models. Through a dynamic measurement of tumor volume, we found that GC cells with aberrantly high expression of SMARCE1 grew faster than those with low SMARCE1 expression (Figure 5A). In addition, ectopic expression of SMARCE1 in MGC-803 cells markedly increased tumor volume and weight compared with those observed in MGC-803ctrl. On the contrary, knockdown of SMARCE1 in AGS cells significantly reduced tumor size and weight compared with those measured in AGSshctrl (Figure 5B–D). Collectively, these data confirmed that SMARCE1 promoted GC cell growth in vitro and in vivo.
 | Figure 4 SMARCE1 promotes GC cell proliferation in vitro.Notes: (A) GC cell viability was assessed using the CCK-8 assay after transfection with SMARCE1, shSMARCE1, or control lentiviruses. (B) The proliferative capacity was evaluated through a colony formation assay and quantitative data of the colony number are shown. (C) Representative images of SMARCE1 and ki-67 IHC staining in 80 human GC tissues. Magnification ×400; (D) Correlation analysis revealed a strong correlation between SMARCE1 and ki-67 in GC tissues. The data are shown as the mean ± SD of three independent experiments. **P<0.01; ***P<0.001.Abbreviations: OD, optical density; GC, gastric cancer; CCK-8, Cell Counting Kit-8 . |
 | Figure 5 SMARCE1 significantly promotes GC cell growth in vivo.Notes: (A) The tumor growth dynamic curve showed that tumors derived from overexpressed SMARCE1 GC cells grew faster than those derived from control cells. In contrast, knockdown of SMARCE1 inhibited GC cell growth. (B) Subcutaneous tumor model to observe the effect of SMARCE1 on GC growth in vivo. (C) Tumor volume was calculated. (D) Tumor weight was measured. The data are shown as the mean ± SD. ***P<0.001.Abbreviation: GC, gastric cancer. |
SMARCE1 promotes GC cell migration and invasion in vitro
We performed wound healing assay and transwell migration and invasion assays to investigate the role of SMARCE1 in the mobility of GC cells. In the wound healing assay, our data showed that cells with high SMARCE1 expression exhibited a significantly increased healing area compared with those expressing low levels of SMARCE1 (Figures 6A, B and S1E). In the transwell migration and invasion assays, high SMARCE1 expression significantly increased the ability of GC cells for migration and invasion (Figures 6C, D and S1F). In addition, IF analysis showed that MGC-803SMARCE1 cells presented an elongated cellular morphology and the appearance of F-actin fibers compared with MGC-803ctrl cells. In contrast, AGSshSMARCE1 cells exhibited a cobblestone shape and shrinkable F-actin fiber changes compared with AGSshcontrol cells (Figure 6E). Collectively, these observations suggested that SMARCE1 promoted the migration and invasion of GC cells in vitro.
 | Figure 6 SMARCE1 promotes GC cell migration and invasion in vitro.Notes: (A and B) The migration ability of GC cells was measured using a wound healing assay. MGC-803SMARCE1 and AGSshctrl cells showed greater migration ability. (C and D) The migration and invasion ability of GC cells were assessed using transwell assays. MGC-803SMARCE1 and AGSshctrl cells showed stronger migration and invasion ability. Magnification ×100. (E) The morphological change observed in GC cells are shown by the staining of F-actin. All data are shown as mean ± SD. Magnification ×200; **P<0.01; ***P<0.001.Abbreviations: h, hours; F-actin, fibrous actin; DAPI, 4ʹ,6-diamidino-2-phenylindole; GC, gastric cancer. |
SMARCE1 increases GC cell proliferation, migration, and invasion via activation of the MAPK/ERK signaling pathway
We aimed to determine the potential mechanisms underlying the oncogenic role of SMARCE1 in GC by investigating the involvement of signaling pathways. Considering that the MAPK/ERK signaling pathway plays a critical role in cell proliferation and mobility, we examined the expression of several key proteins of this pathway in GC cells. As shown in Figure 7, ectopic expression of SMARCE1 in MGC-803 significantly upregulated the expression of phosphorylated erk1/2. Moreover, the expression of downstream effector protein MM9 and cyclin D1 was upregulated. Conversely, in AGS cells, knockdown of SMARCE1 downregulated the expression of phosphorylated erk1/2, MMP9, and cyclin D1 (Figure 7A). Through gray analysis, significant differences in protein expression were revealed in AGSshctrl and MGC-803SMARCE1 cells versus AGSshSMARCE1 and MGC-803ctrl cells (Figure 7B). Furthermore, we utilized 10 µM of U0126 to verify the role of MAPK/ERK pathway in the SMARCE1-mediated growth and mobility of GC cells. The results showed that U0126 markedly inhibited SMARCE1-induced proliferation in GC cells (Figure 7C). In addition, the migration of GC cells with high SMARCE1 expression was blocked (Figure 7D and F) and their SMARCE1-induced invasiveness was abolished (Figure 7E and G). These results indicated that SMARCE1 increased the proliferation, migration, and invasion of GC cells via the activation of the MAPK/ERK signaling pathway.
 | Figure 7 SMARCE1 increases GC cell proliferation, migration, and invasion via activation of the MAPK/ERK signaling pathway.Notes: (A) The protein expression of SMARCE1, ERK1/2, p-ERK1/2, MMP9, and cyclin D1 was examined through western blotting. β-actin was used as control. (B) The relative protein expression was analyzed using the gray level and presented as mean ± SD. (C) The CCK-8 assay detected the proliferation of MGC-803SMARCE1, AGSshSMARCE1, and control cells treated with 10 μM of U0126 – an inhibitor of the MAPK/ERK signaling pathway or DMSO. U0126 blocked the proliferation of GC cells induced by SMARCE1. (D) A wound healing assay was performed to evaluate the migration ability of MGC-803SMARCE1, AGSshSMARCE1, and control cells with or without U0126 treatment. U0126 abrogated the SMARCE1-induced GC cell migration. (E) The invasion ability of MGC-803SMARCE1, AGSshSMARCE1, and control cells was determined using a transwell invasion assay. Cell invasion triggered by SMARCE1 was almost completely abolished following treatment with U0126. (F) Quantification of wound closure was shown. (G) Quantification of invasion ability was shown. All data are shown as mean ± SD. Magnification ×100; *P<0.05; **P<0.01; ***P<0.001.Abbreviations: p-ERK1/2, phosphorylated ERK1/2; MMP9, matrix metalloproteinase 9; DMSO, dimethyl sulfoxide; GC, gastric cancer. |
Discussion
In spite of great advancements in the diagnosis and treatment of GC, the underlying pathogenesis remains poorly reported and the OS rate remains low.2 This was the first study to demonstrate that SMARCE1 is overexpressed in GC. We initially analyzed the mRNA expression of SMARCE1 in GC from TCGA and Oncomine dataset. We found that SMARCE1 was significantly upregulated in GC compared with adjacent normal tissues. In addition, the mRNA expression of SMARCE1 from 20 paired fresh GC samples and four GC cell lines further verified the upregulation of SMARCE1 in GC. Furthermore, we found significantly elevated protein expression of SMARCE1 in GC tissues through IHC analysis of 122 paired human GC specimens. Collectively, these findings confirmed that SMARCE1 expression was upregulated in GC. Our results are consistent with those reported by previous studies showing that SMARCE1 expression increased in various types of cancer, such as endometrial carcinoma and ovarian cancer.17,24 Moreover, in prostate cancer, high nuclear expression of SMARCE1 and higher expression in metastatic cancer samples were observed.18,19 Overexpression of SMARCE1 has been identified in human breast cancer cell lines and tissues.25–28 Overall, the upregulation of SMARCE1 indicates that SMARCE1 may act as an oncogene.
Based on the IHC staining results, our study also revealed that SMARCE1 was associated with the malignant clinicopathological characteristics of GC, including tumor size, depth of invasion, degree of differentiation, lymph node involvement, and TNM stage. Besides, the Kaplan–Meier analysis revealed that patients with high SMARCE1 expression were associated with significantly poor OS. Furthermore, we found that high SMARCE1 expression was an independent risk factor of poor OS in GC patients. The results of the present study strongly indicated that SMARCE1 may be involved in GC progression and prognosis. Consistent with our results, a previous study showed that SMARCE1 was significantly associated with the malignant clinicopathological features endometrial carcinoma and was an independent prognostic factor of poor survival.24 In addition, high SMARCE1 expression has been associated with poor prognosis in breast cancer patients.25,29 Combined, these observations establish the prognostic value of SMARCE1 as a novel biomarker of GC progression.
Tumor progression is closely associated with the malignant biological behavior of tumor cells.30 In our study, we found that ectopic expression of SMARCE1 increased proliferation, migration, and invasion, and induced aggressive morphology in MGC-803 cells. Knockdown of SMARCE1 in AGS and MGC-803 cells inhibited the potential for cell proliferation, migration, and invasion. More importantly, in vivo, SMARCE1 significantly promoted GC cell growth. Consistent with our study, Sethuraman et al reported that SMARCE1 promoted lung metastasis of breast cancer.25 In prostate cancer, SMARCE1 conferred migration advantages by inducing a metastasis-specific cell morphology.18 In agreement with the above, Sokol et al stated that SMARCE1 was required for cancer cell invasion and metastasis in breast cancers.29 However, another study showed that knockdown of SMARCE1 induced cell-cycle arrest in the G2-M phase and inhibition of proliferation.16 These studies confirmed the promoting role of SMARCE1 in tumor progression.
The MAPK/ERK signaling pathway plays a critical role in tumor growth and metastasis.31,32 In our study, knockdown of SMARCE1 decreased the activation of the MAPK/ERK pathway. In contrast, ectopic expression of SMARCE1 increased the activation of this pathway and upregulated the expression of MMP9 and cyclin D1. Furthermore, inhibition of MAPK/ERK pathway activation diminished the SMARCE1-induced GC cell growth and mobility. Consistent with our study, previous studies reported that SMARCE1 upregulated the expression of proteases in breast cancer, as well as the levels of p-ERK and cell cycle-related proteins.25,29 These findings indicate that SMARCE1 regulates the activation of the MAPK/ERK signaling pathway in GC cells. To the best of our knowledge, this was the first study investigating the role and mechanism of SMARCE1 in GC. Further studies are warranted to elucidate the mechanisms involved in this process.
Conclusion
The present study revealed that SMARCE1 was upregulated in GC and associated with tumor progression and poor prognosis. Functionally, SMARCE1 promoted GC cell growth, migration, and invasion. These findings establish the prognostic value and oncogenic role of SMARCE1, and highlight its potential as a target for therapeutic intervention against GC.
Acknowledgment
The present study was supported by funding from the Major Science and Technology Projects of Hunan Province, China (grant no. 2016JC2050).
Author contributions
All authors contributed to data analysis, drafting and revising the article, gave final approval of the version to be published, and agree to be accountable for all aspects of the work.
Disclosure
The authors report no conflicts of interest in this work.
References
1. Torre LA, Bray F, Siegel RL, Ferlay J, Lortet-Tieulent J, Jemal A. Global cancer statistics, 2012. CA Cancer J Clin. 2015;65(2):87–108. doi:10.3322/caac.21262
2. Van Cutsem E, Sagaert X, Topal B, Haustermans K, Prenen H. Gastric cancer. Lancet. 2016;388(10060):2654–2664. doi:10.1016/S0140-6736(16)30354-3
3. Zong L, Abe M, Seto Y, Ji J. The challenge of screening for early gastric cancer in China. Lancet. 2016;388(10060):2606. doi:10.1016/S0140-6736(16)32226-7
4. Clapier CR, Iwasa J, Cairns BR, Peterson CL. Mechanisms of action and regulation of ATP-dependent chromatin-remodelling complexes. Nat Rev Mol Cell Biol. 2017;18(7):407–422. doi:10.1038/nrm.2017.26
5. Risinger MA, Groden J. Crosslinks and crosstalk: human cancer syndromes and DNA repair defects. Cancer Cell. 2004;6(6):539–545. doi:10.1016/j.ccr.2004.12.001
6. Wood RD. Fifty years since DNA repair was linked to cancer. Nature. 2018;557(7707):648–649. doi:10.1038/d41586-018-05255-1
7. Peltomaki P. Role of DNA mismatch repair defects in the pathogenesis of human cancer. J Clin Oncol. 2003;21(6):1174–1179. doi:10.1200/JCO.2003.04.060
8. Schaniel C, Ang YS, Ratnakumar K, et al. Smarcc1/Baf155 couples self-renewal gene repression with changes in chromatin structure in mouse embryonic stem cells. Stem Cells. 2009;27(12):2979–2991. doi:10.1002/stem.223
9. Yoo AS, Staahl BT, Chen L, Crabtree GR. MicroRNA-mediated switching of chromatin-remodelling complexes in neural development. Nature. 2009;460(7255):642–646. doi:10.1038/nature08139
10. Hang CT, Yang J, Han P, et al. Chromatin regulation by Brg1 underlies heart muscle development and disease. Nature. 2010;466(7302):62–67. doi:10.1038/nature09130
11. Roberts CWM, Orkin SH. The SWI/SNF complex — chromatin and cancer. Nat Rev Cancer. 2004;4(2):133–142. doi:10.1038/nrc1273
12. Wilson BG, Roberts CWM. SWI/SNF nucleosome remodellers and cancer. Nat Rev Cancer. 2011;11(7):481–492. doi:10.1038/nrc3068
13. Marazzi I, Greenbaum BD, Low DHP, Guccione E. Chromatin dependencies in cancer and inflammation. Nat Rev Mol Cell Biol. 2017;19(4):245–261. doi:10.1038/nrm.2017.113
14. Rosson GB, Bartlett C, Reed W, Weissman BE. BRG1 loss in MiaPaCa2 cells induces an altered cellular morphology and disruption in the organization of the actin cytoskeleton. J Cell Physiol. 2005;205(2):286–294. doi:10.1002/(ISSN)1097-4652
15. Mathur R, Alver BH, San RA, et al. ARID1A loss impairs enhancer-mediated gene regulation and drives colon cancer in mice. Nat Genet. 2017;49(2):296–302. doi:10.1038/ng.3744
16. Hah N, Kolkman A, Ruhl DD, et al. A role for BAF57 in cell cycle-dependent transcriptional regulation by the SWI/SNF chromatin remodeling complex. Cancer Res. 2010;70(11):4402–4411. doi:10.1158/0008-5472.CAN-09-2767
17. Yamaguchi T, Kurita T, Nishio K, et al. Expression of BAF57 in ovarian cancer cells and drug sensitivity. Cancer Sci. 2015;106(4):359–366. doi:10.1111/cas.12612
18. Balasubramaniam S, Comstock CES, Ertel A, et al. Aberrant BAF57 signaling facilitates prometastatic phenotypes. Clin Cancer Res. 2013;19(10):2657–2667. doi:10.1158/1078-0432.CCR-12-3049
19. Link KA, Balasubramaniam S, Sharma A, et al. Targeting the BAF57 SWI/SNF subunit in prostate cancer: a novel platform to control androgen receptor activity. Cancer Res. 2008;68(12):4551–4558. doi:10.1158/0008-5472.CAN-07-6392
20. Papadakis AI, Sun C, Knijnenburg TA, et al. SMARCE1 suppresses EGFR expression and controls responses to MET and ALK inhibitors in lung cancer. Cell Res. 2015;25(4):445–458. doi:10.1038/cr.2015.16
21. Tauziede-Espariat A, Parfait B, Besnard A, et al. Loss of SMARCE1 expression is a specific diagnostic marker of clear cell meningioma: a comprehensive immunophenotypical and molecular analysis. Brain Pathol. 2018;28(4):466–474. doi:10.1111/bpa.12524
22. Smith MJ, O’Sullivan J, Bhaskar SS, et al. Loss-of-function mutations in SMARCE1 cause an inherited disorder of multiple spinal meningiomas. Nat Genet. 2013;45(3):295–298. doi:10.1038/ng.2552
23. Xiao S, Chang R, Yang M, et al. Actin-like 6A predicts poor prognosis of hepatocellular carcinoma and promotes metastasis and epithelial-mesenchymal transition. Hepatology. 2016;63(4):1256–1271. doi:10.1002/hep.28417
24. Kagami S, Kurita T, Kawagoe T, et al. Prognostic significance of BAF57 expression in patients with endometrial carcinoma. Histol Histopathol. 2012;27(5):593–599. doi:10.14670/HH-27.593
25. Sethuraman A, Brown M, Seagroves TN, Wu Z, Pfeffer LM, Fan M. SMARCE1 regulates metastatic potential of breast cancer cells through the HIF1A/PTK2 pathway. Breast Cancer Res. 2016;18(1):81. doi:10.1186/s13058-016-0738-9
26. Kiskinis E, García-Pedrero JM, Villaronga MA, Parker MG, Belandia B. Identification of BAF57 mutations in human breast cancer cell lines. Breast Cancer Res Treat. 2006;98(2):191–198. doi:10.1007/s10549-005-9149-9
27. Davis LM, Harris C, Tang L, et al. Amplification patterns of three genomic regions predict distant recurrence in breast carcinoma. J Mol Diagn. 2007;9(3):327–336. doi:10.2353/jmoldx.2007.060079
28. Má V, López-Mateo I, Markert L, Espinosa E, Já FV, Belandia B. Identification and characterization of novel potentially oncogenic mutations in the human BAF57 gene in a breast cancer patient. Breast Cancer Res Treat. 2011;128(3):891–898. doi:10.1007/s10549-011-1492-4
29. Sokol ES, Feng Y, Jin DX, et al. SMARCE1 is required for the invasive progression of in situ cancers. Proc Natl Acad Sci USA. 2017;114(16):4153–4158. doi:10.1073/pnas.1703931114
30. Valastyan S, Weinberg RA. Tumor metastasis: molecular insights and evolving paradigms. Cell. 2011;147(2):275–292. doi:10.1016/j.cell.2011.09.024
31. Hayashi J, Aoki H, Kajino K, Moriyama M, Arakawa Y, Hino O. Hepatitis C virus core protein activates the MAPK/ERK cascade synergistically with tumor promoter TPA, but not with epidermal growth factor or transforming growth factor alpha. Hepatology. 2000;32(5):958–961. doi:10.1053/jhep.2000.19343
32. Wu S, Lao X, Sun T, et al. Knockdown of ZFX inhibits gastric cancer cell growth in vitro and in vivo via downregulating the ERK-MAPK pathway. Cancer Lett. 2013;337(2):293–300. doi:10.1016/j.canlet.2013.04.003
Supplementary material
 | Figure S1 SMARCE1 promotes GC cell proliferation, migration, and invasion. Notes: (A) The mRNA and protein expression levels of SMARCE1 in MGC-803 cells transfected with shSMARCE1 or shcontrol knockdown lentiviruses. (B) The mRNA and protein levels of SMARCE1 in AGS cells transfected with SMARCE1 or control overexpression lentiviruses. (C) The CCK-8 assay detected the cell viability of MGC-803shSMARCE1, AGSSMARCE1, and corresponding control cells. SMARCE1 knockdown attenuated GC cell proliferation. (D) The colony formation assay examined the proliferation of MGC-803shSMARCE1, AGSSMARCE1, and corresponding control cells. Aberrant expression of SMARCE1 increased colony formation. (E) The wound healing assay evaluated the migration ability of GC cells. (F) The transwell invasion assay assessed the invasiveness of GC cells. Magnification ×100; **P<0.01; ***P<0.001. Abbreviations: OD, optical density; h, hours; GC, gastric cancer; CCK-8, Cell Counting Kit-8. |
 © 2019 The Author(s). This work is published and licensed by Dove Medical Press Limited. The
full terms of this license are available at https://www.dovepress.com/terms
and incorporate the Creative Commons Attribution
- Non Commercial (unported, 3.0) License.
By accessing the work you hereby accept the Terms. Non-commercial uses of the work are permitted
without any further permission from Dove Medical Press Limited, provided the work is properly
attributed. For permission for commercial use of this work, please see paragraphs 4.2 and 5 of our Terms.
© 2019 The Author(s). This work is published and licensed by Dove Medical Press Limited. The
full terms of this license are available at https://www.dovepress.com/terms
and incorporate the Creative Commons Attribution
- Non Commercial (unported, 3.0) License.
By accessing the work you hereby accept the Terms. Non-commercial uses of the work are permitted
without any further permission from Dove Medical Press Limited, provided the work is properly
attributed. For permission for commercial use of this work, please see paragraphs 4.2 and 5 of our Terms.