
Back to Journals » Cancer Management and Research » Volume 18

High Expression of BTN3A3 Acts as an Independent Predictive Factor of Better Prognosis in Patients with Sarcomas
Received 17 August 2025
Accepted for publication 14 June 2026
Published 14 July 2026 Volume 2026:18 555381
DOI https://doi.org/10.2147/CMAR.S555381
Checked for plagiarism Yes
Review by Single anonymous peer review
Peer reviewer comments 2
Editor who approved publication: Dr Sanjeev K. Srivastava
Fengrui Liu,1 Sen Zhao2
1Orthopedics Department, First Hospital of Shanxi Medical University, Taiyuan, Shanxi, 030001, People’s Republic of China; 2Orthopedics Department, Taiyuan Hand Surgery Hospital, Taiyuan, Shanxi, 030001, People’s Republic of China
Correspondence: Sen Zhao, Email [email protected]
Background: Butyrophilin subfamily 3 member A3 (BTN3A3) may be used as a prognostic biomarker for various malignancies. However, there is little evidence on the role of BTN3A3 in sarcomas.
Methods: Using data from the Cancer Genome Atlas (TCGA) and Gene Expression Omnibus (GEO), we detected BTN3A3 in normal and sarcomas tissues. Then we further evaluated clinical relevance, prognostic significance, genetic alternations, DNA methylation, co-expression gene and correlations with immune infiltration of BTN3A3.
Results: The results showed that BTN3A3 expression was higher in sarcoma tissues than in normal tissues. The expression of BTN3A3 was regulated by methylation and miRNA. Higher BTN3A3 expression was associated with a better prognosis of sarcomas than lower BTN3A3 expression. GSEA revealed that the JAK-STAT signaling pathway, cytokine-cytokine receptor interaction, NK cell-mediated cytotoxicity, T cell receptor signaling pathway, cell adhesion, and Toll-like receptor signaling were differentially enriched in patients with elevated BTN3A3 expression. The BTN3A3 expression were found to be positively correlated with immune infiltration, immune checkpoints. In the multivariate analysis, high BTN3A3 expression was found to be an independent risk factor for overall survival.
Conclusion: In conclusion, increased BTN3A3 expression is a significant predictor of better prognosis in patients with sarcomas.
Keywords: BTN3A3, prognosis, sarcomas, immune, nomogram
Introduction
Although they are extremely rare and account for approximately 1% of adult malignancies,1 sarcomas are extremely diverse mesenchymal tumors. EU countries have a sarcoma incidence rate of 5.6 per 100,000.2 More than 70 histological subtypes of sarcoma have been identified, occurring across diverse anatomical sites. Sarcomas are broadly categorized into soft tissue sarcomas, which represent approximately 80% of cases, and osteosarcomas.3 These malignancies are characterized by aggressive local growth and a pronounced propensity for metastasis.4 The development of novel biomarkers to improve prognostic accuracy in sarcoma patients is therefore urgently needed.
Butyrophilins (BTNs) include one or two extracellular Ig domains that have several structural features of the B7 family of co-receptors and are considered B7-related proteins5–7 The BTN3A subfamily, including BTN3A1, BTN3A2, and BTN3A3, share 95% homology with the extracellular domain. They have been shown to be expressed in various types of tumor cells.8,9 Members of the BTN3A family exhibit distinct expression patterns across tumor types and are significantly associated with patient prognosis. BTN3A1 has been extensively implicated in tumor immunity, where it is essential for the activation of Vγ9Vδ2 T cells. In contrast, BTN3A3 has emerged as a potential therapeutic target in breast cancer. Notably, specific single-nucleotide polymorphisms (SNPs) in BTN3A3 and BTN3A2 have recently been linked to increased risk of ovarian and gastric cancers, respectively.10,11 Growing evidence connects the BTN3A family to the initiation and progression of diverse malignancies, positioning these molecules as promising biomarkers and therapeutic targets in oncology. Computational biology has been playing an important role in fundamental biological research, biotechnology and drug development.12 However, little is known about the BTN3A subfamily and its precise functions in sarcomas and tumor microenvironment.
In this study, we compared BTN3A3 expression in normal tissues and sarcomas. Using bioinformatic analyses of clinical and survival data from TCGA and GEO databases, we evaluated the prognostic significance of BTN3A3 expression in sarcoma (SARC). Our results indicate that BTN3A3 expression may serve as a prognostic biomarker in SARC, with high expression levels associated with improved patient survival.
Methods
Patient Data and Sample Collection
RNA-seq data and clinico-pathological information from 263 sarcoma samples were obtained from the TCGA database. In addition, matched tumor and normal adjacent tissues from 25 patients were collected and snap-frozen in liquid nitrogen. All human samples were used in compliance with the Declaration of Helsinki. The study was approved by the ethical committee of Taiyuan Hand Surgery Hospital. Consent was acquired from all patients in written format.
Quantitative Real-Time Polymerase Chain Reaction (PCR) of Tissues
Total RNA was extracted from tissue specimens with TRIzol reagent (Invitrogen, Thermo Fisher Scientific) following the manufacturer’s protocol. Gene expression raw counts were normalized to the average of housekeeping genes under corresponding experimental conditions. Data are presented as fold change relative to normal controls. A qRT-PCR primers used in the present study were as follows: BTN3A3 forward primer, 5′-CTTTGGCCTATCATGAATGGA-3′; BTN3A3 reverse primer, 5′-GCACGACGCTGAGGATCAA-3′; GAPDH forward primer, 5′-TCAAGATCATCAGCAATGCC-3′; GAPDH reverse primer, 5′-CGATACCAAAGTTGTCATGGA-3′.
Gene Set Enrichment Analysis (GSEA)
Gene set enrichment analysis (GSEA) was employed to assess whether predefined sets of genes exhibited statistically significant and concordant differences between two biological states.13 We applied GSEA to identify genes associated with BTN3A3 expression and to detect survival differences between groups with high and low BTN3A3 expression. Gene sets with a nominal p-value < 0.05 and a false discovery rate (FDR) < 0.25 were considered significantly enriched.
Immune Infiltrates and Checkpoints Analysis
To assess the influence of BTN3A3 on immune infiltration, its association with immune cell populations in the tumor microenvironment was evaluated using the CIBERSORT algorithm, TISIDB, and TIMER 2.0 databases.14 Correlations between BTN3A3 expression and immune checkpoint genes, along with the impact of immune infiltration levels on prognosis, were further analysed via TIMER2.0. A panel of 30 commonly studied immune checkpoints was selected based on previous literature to examine their relationship with BTN3A3 expression. Additionally, SangerBox 3.0 was employed to evaluate potential associations between BTN3A3 expression and both tumour mutational burden (TMB) and microsatellite instability (MSI).
Analysis of the Regulation and Co-Expression of BTN3A3 Expression
Methylation profiles of BTN3A3 were analyzed using SurvivalMeth (http://bio-bigdata.hrbmu.edu.cn/survivalmeth/), a publicly available web tool for assessing cancer-associated methylation.15 Data analysis was performed using R (version 3.4.4), and integration of TCGA-derived gene expression and methylation data was carried out with the R package MethylMix.16 Putative miRNAs targeting BTN3A3 were identified through a consensus approach using five prediction databases: Starbase v2.0, miRWalk, TargetScanHuman, mirDIP, and OncomiR. We used GEPIA2 (http://gepia.cancer-pku.cn/) to obtain the BTN3A3-correlated genes based on the datasets of TCGA and GTEx. We also performed correlation analysis between BTN3A3 and selected genes with Pearson correlation analysis.
Gene Ontology and Pathway Analysis
Gene ontology analysis (GO) was used for annotating differentially BTN3A3-related genes. The Database for Annotation, Visualization, and Integrated Discovery (DAVID) (http://david.abcc.ncifcrf.gov/) was used to detect the enriched GO terms of BTN3A3-binding proteins. The pathway enrichment analysis was performed via The Kyoto Encyclopedia of Genes and Genomes (KEGG).
Homology Analysis
To reconstruct the evolutionary relationships within the BTN3A subfamily, transcript sequences were retrieved from UniProt and a phylogenetic tree was constructed using MEGA11 and visualized with iTOL (https://itol.embl.de). Protein sequence alignments across species were performed using DNAMAN.
Statistical Analysis
Box plots were used to assess BTN3A3 expression levels in sarcoma patients, with the median expression value set as the cutoff. Associations between BTN3A3 expression and clinical characteristics were evaluated using the Wilcoxon signed-rank test and logistic regression. Survival outcomes were compared between high- and low-BTN3A3 expression groups via Kaplan–Meier analysis, with statistical significance assessed by the Log rank test. Univariate Cox regression identified potential prognostic variables, and multivariate Cox analysis was used to validate the independent prognostic value of BTN3A3 expression. A nomogram integrating BTN3A3 expression and clinical variables was developed to predict 1‑, 3‑, and 5‑year overall survival in sarcoma.
Results
Genetic Alteration and Expression Analysis of BTN3A3
We first evaluated BTN3A3 expression in pan-cancer data from TCGA. The analysis showed that BTN3A3 expression was higher in 7 tumors, including CHOL, ESCA, GBM, HNSC, KIRC, LIHC and STAD. In contrast, the expression was low in BARC, KICH, LUAD, LUSC, PRAD, THCA and UCEC (Figure 1A). The genetic alteration status of BTN3A3 in different tumor samples from the TCGA cohort was observed. As shown in Figure 1B, melanoma patients had the highest BTN3A3 alteration frequency (nearly 5%). Within the TCGA pan-cancer cohort, mutations represented the most frequent type of DNA alteration affecting BTN3A3. These were most prevalent in endometrial cancer, with an alteration frequency exceeding 3% (Figure 1B). In an independent pan-cancer dataset, amplification emerged as the dominant alteration type. Specifically, BTN3A3 amplifications were observed in lung and bladder cancers (Figure S1A). Notably, among sarcoma (SARC) cases with BTN3A3 alterations, mutations were exclusively observed, occurring at a frequency of approximately 1% (Figure 1B). Furthermore, BTN3A3 alterations in malignancies were distributed across all exons without a discernible hotspot mutation site (Figure S2A and B). The most frequent alterations were the A340V/X340_splice (Figure S2A) and S98L/A (Figure S2B). The BTN3A3 genetic mutation has been linked to the clinical survival prognosis in a wide range of different forms of malignancy. A deeper look into this finding is necessary.
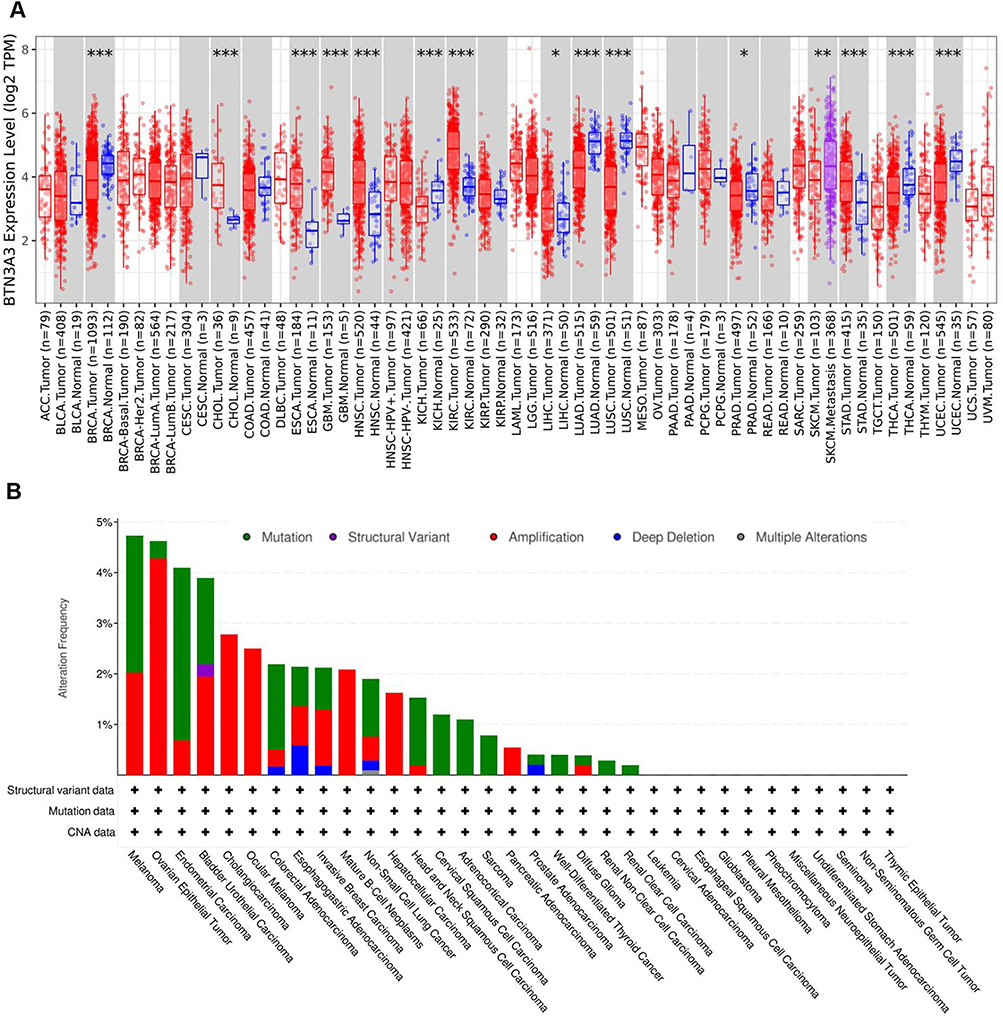 |
Figure 1 The expression of BTN3A3 in different tissues. (A) The transcription levels of BTN3A3 in different cancers or specific cancer subtypes. (B) Genetic aberration of BTN3A3 in cancers. This data contains 10953 patients/10967 samples in 32 studies from TCGA datasets. The global genetic alteration frequency is 2%. |
High BTN3A3 Expression in SARC
To investigate the conservation of BTN3A3 among different species, we compared BTN3A3 protein sequences among 6 distinct species (Figure 2A), demonstrating that Homo sapiens BTN3A3 shared 99, 94, 91, 6 and 60% identity to Pan troglodytes, Pongo abelii, Mus musculus and Bos indicus, respectively. It is indicated that BTN3A3 was highly conserved in primates, but varied significantly between human and mouse as well as zebu. The TCGA data obtained 263 individuals with requisite clinical characteristics. Table S1 lists the detailed clinical features of these patients. Among the 263 patients, 119 were mem (45.2%) and 144 were women (54.8%). All participants were 61 years old on average. In terms of tumor depth, 22 patients (11.1%) had superficial tumors, whereas 188 patients (89.9%) had deep tumors. Among all patients, 120 (67.0%) had metastasis and 59 (33.0%) had no metastasis. To evaluate the status of BTN3A3 expression in SARC patients, we compared the level of BTN3A3 expression in SARC patients with that in normal muscle tissues. BTN3A3 expression was substantially higher in SARC tissues than in normal tissues (P<0.01, Figure 2B). SARC samples and matched normal muscle tissues were used to confirm these findings (P<0.001, Figure 2C, supplementary material). In SARC, higher BTN3A3 expression corresponded with better prognosis (Figure 2D).
 |
Figure 2 The expression of BTN3A3 in SARC. (A) Comparison of protein sequences of BTN3A3 among different species. (B) BTN3A3 expression of SARC patients in GSE17674 is analyzed. (C) Detection of BTN3A3 in sarcomas and adjacent normal tissues. (D) Higher BTN3A3 expression was correlated with longer OS of SARC patients according TCGA database. Data are represented as mean ± SEM; ***P < 0.001. |
Regulation of BTN3A3 Expression
Previous studies found methylation could affect the expression of BTN3A3.17 Therefore, we investigated the potential relationship between BTN3A3 methylation and expression in sarcomas. The results showed that overall methylation levels of the BTN3A3 were low at different methylation sites. We found a substantial negative correlation between BTN3A3 methylation and gene expression at the probe of the untranslated region, which was cg12537337 (P<0.001, R=−0.540, Figure 3A). However, there was no significant correlation between BTN3A3 expression and the methylation in the sites of other probes (Figure 3B). We further analyzed the post-transcriptional regulation of BTN3A3. miRNAs, targeting BTN3A3, were screened from starbase database, miRWalk database, TargetScan database and mirDIP database. Meanwhile, miRNAs associated with the prognosis of SARC patients were obtained from OncomiR (Figure 3C). Combing the results from five databases, we screened hsa-miR-149-5p and hsa-miR-488-3p as the most possible miRNA regulators targeting BTN3A3. We also exhibited the complementary sequences between BTN3A3 and miR-149-5p and miR-488-3p (Figure 3D).
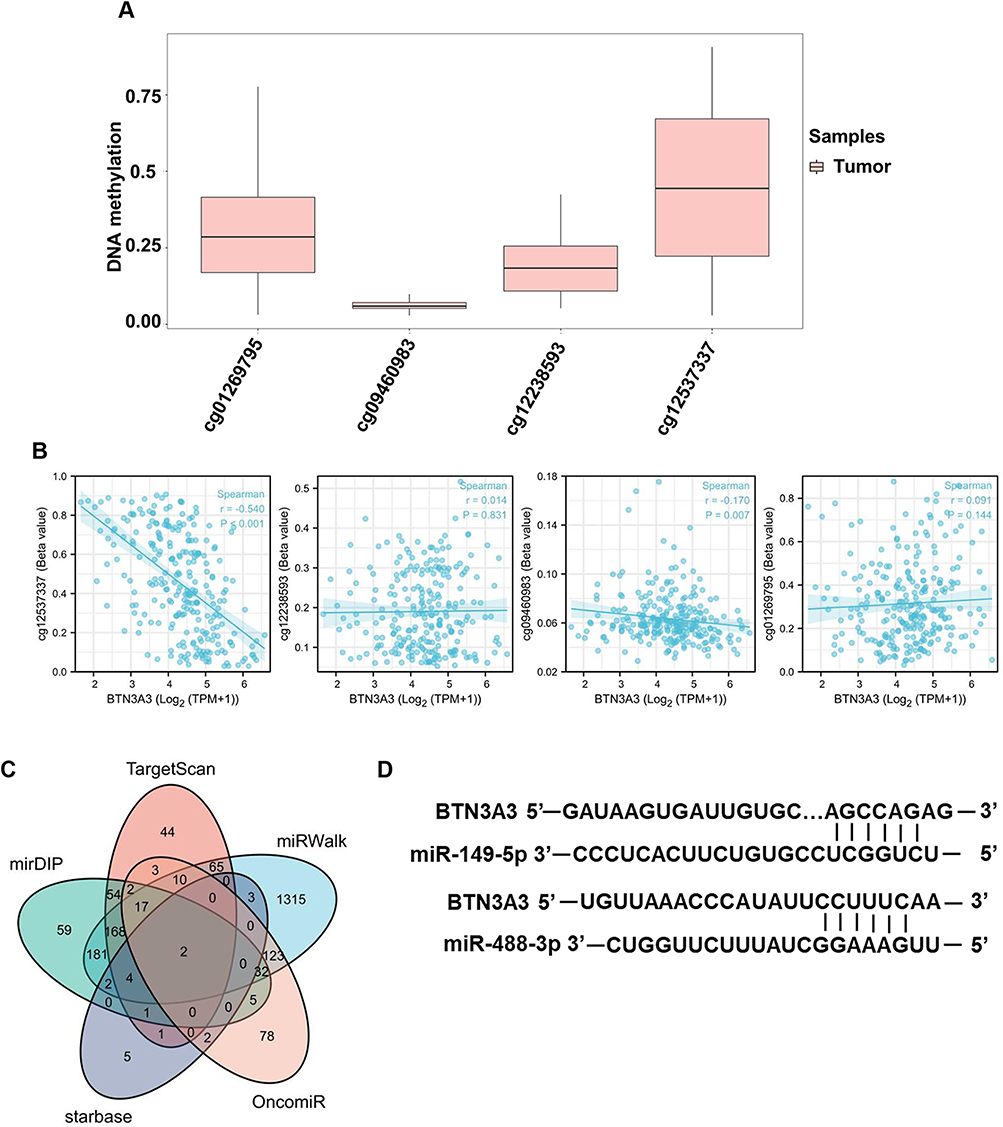 |
Figure 3 Analysis of the regulation of BTN3A3 expression. (A) Differential methylation levels of the BTN3A3 probe in SARC. (B) Correlation between BTN3A3 expression and methylation. (C) Result of predicted miRNAs using 5 different databases. The result was visualized using R software. (D) Predicted interaction between miR-149-5p/miR-488-3p and BTN3A3. |
Genes Co-Expressed with BTN3A3
Using GEPIA2, we aggregated TCGA tumor expression data to identify the top 100 genes correlated with BTN3A3 expression. In sarcoma (SARC), BTN3A3 expression showed strong positive correlations with BTN3A1 (R = 0.87), BTN3A2 (R = 0.82), SAMD9L (R = 0.66), STAT1 (R = 0.65), and TAP1 (R = 0.64) (all P < 0.001; Figure 4A). A phylogenetic tree was constructed to evaluate evolutionary conservation among BTN3A subfamily members (Figure 4B). The analysis revealed two primary clusters: one comprising four BTN3A1 isoforms, and another consisting of BTN3A2 and BTN3A3.
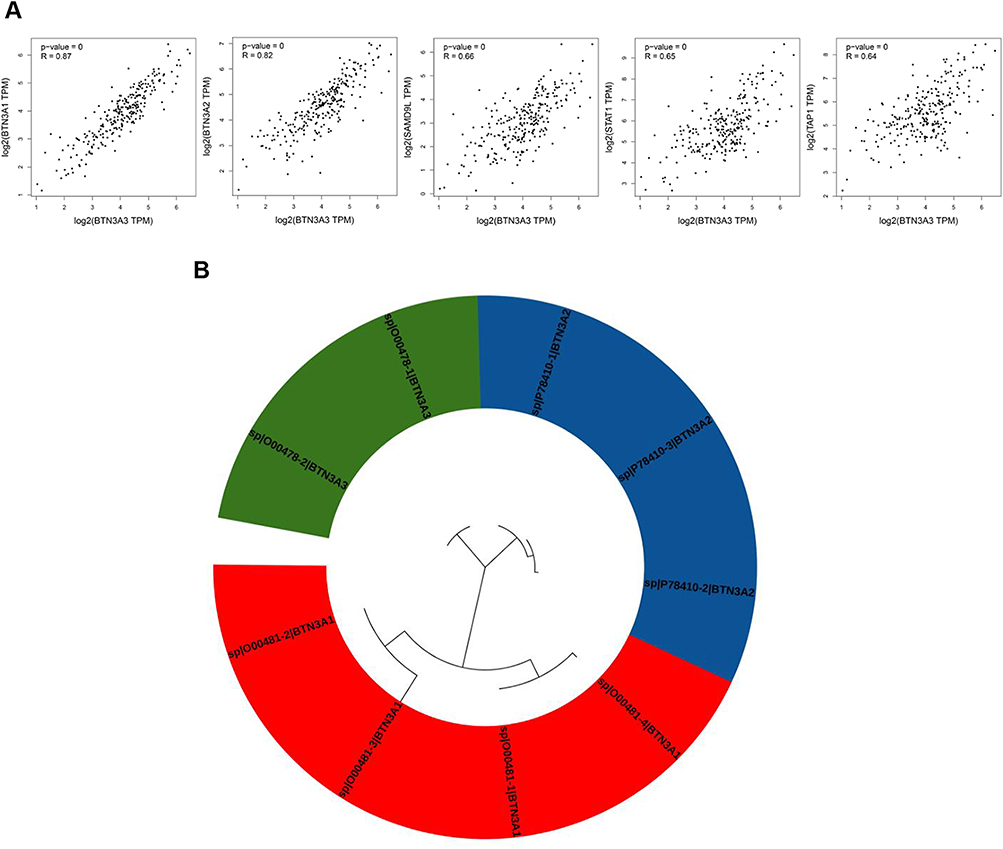 |
Figure 4 Co-expression genes with BTN3A3. (A) Using the GEPIA2 approach, we obtained the top 100 BTN3A3-correlated genes and analyzed the expression correlation between BTN3A3 and top 5 targeting genes, including BTN3A1, BTN3A2, SAMD9L, STAT1 and TAP1. (B) Phylogenetic tree of BTN3A subfamily. |
GSEA Identifies a BTN3A3-Related Signaling Pathway
To identify signaling pathways differentially activated in sarcomas (SARC) based on BTN3A3 expression, we performed gene set enrichment analysis (GSEA) comparing datasets with low and high BTN3A3 levels. High BTN3A3 expression was significantly associated with enrichment of gene sets involved in the JAK–STAT signaling pathway, cytokine–cytokine receptor interactions, natural killer cell-mediated cytotoxicity, T cell receptor signaling, cell adhesion, and Toll-like receptor signaling (Figure 5A).
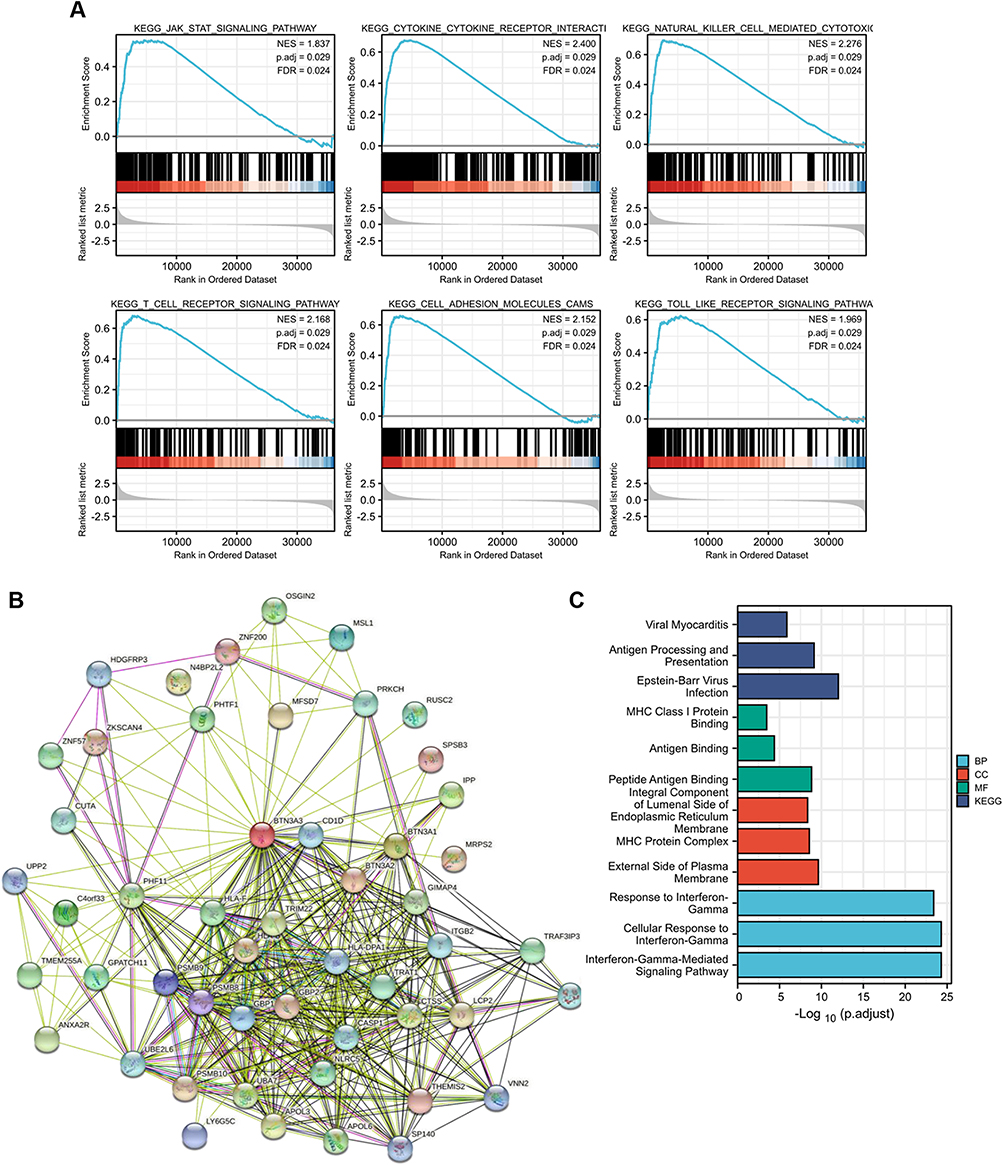 |
Figure 5 Enrichment analysis of BTN3A3. (A) GSEA analysis grouped by BTN3A3 expression level. (B) Network for BTN3A3 and BTN3A3-binding proteins. (C) KEGG enrichment and GO analysis was performed with DAVID. The most enriched pathway, molecular function, biological process and cellular component was pictured. |
Enrichment Analysis of BTN3A3-Related Partners
We attempted to filter out the BTN3A3-binding proteins for further pathway enrichment analysis, to gain a better understanding of the molecular mechanism of BTN3A3 in carcinogenesis. Using the STRING tool, we identified 50 BTN3A3-binding proteins, all of which were experimentally verified. The network of interactions between these proteins is shown in Figure 5B. Intersection analysis showed that BTN3A3 and BTN3A2 were common members of the aforementioned groups. We combined the BTN3A3-binding proteins and expression-correlated genes to perform the KEGG and GO enrichment analyses. The KEGG data suggested that “antigen processing and presentation” might be implicated in the effect of BTN3A3 on tumor pathogenesis. BTN3A3 was also associated with biological processes such as MHC class I protein binding, antigen binding and peptide antigen binding, as well as molecular functions such as response to IFN-γ and IFN-γ-mediated signaling pathways, according to the GO enrichment analysis (Figure 5C).
Correlation Between BTN3A3 Expression and Clinical Features
The relationship between BTN3A3 expression and the clinical characteristics of patients with SARC is summarized in Table S2. High BTN3A3 expression was associated with histological type (P<0.001) and metastasis (P=0.012). However, elevated BTN3A3 expression was not associated with any other clinical feature. BTN3A3 expression was a categorical dependent variable related to superior prognostic clinical features in univariate analysis using logistic regression (Table S2). High BTN3A3 expression was associated with clinical stage (leiomyosarcoma vs. dedifferentiated liposarcoma: OR=0.222, 95% CI=0.108–0.438, P<0.001) and metastasis (yes vs. no: OR=0.437, 95% CI=0.227–0.825, P=0.012).
Prognostic Value of the BTN3A3 Risk Score in SARC
Univariate and multivariate Cox proportional hazards analyses were performed to identify factors correlated with overall survival (OS). Univariate analysis revealed that metastasis (HR = 2.888, P < 0.001), residual tumor (HR = 2.637, P < 0.001), multifocal tumors (HR = 2.402, P < 0.001), margin status (HR = 1.957, P = 0.006), and BTN3A3 expression (HR = 0.552, P = 0.004) were significantly associated with OS in sarcoma patients. Multivariate analysis confirmed that metastasis (HR = 2.355, P = 0.005) and BTN3A3 expression (HR = 0.470, P = 0.022) retained independent prognostic significance (Table S3).
BTN3A3 Correlated to SARC Immune Infiltration
We used the Kruskal–Wallis test to compare the scores related to the TME between the two clusters (BTN3A3 high and BTN3A3 low) to determine whether there was a difference in the TMEs between them (Figure 6A). The three clusters, encompassing stromal (P<0.001), immune (P<0.001) and ESTIMATE (P<0.001), exhibited significant differences in the scores of the two TMEs. We analyzed the number of immune cells in the two clusters to determine whether there was a link between BTN3A3 and other immune infiltration features (Figure 6B). The results indicated that the numbers of T cells, CD8+ T cells, cytotoxic T cells, regulatory T cells, central memory T cells, effect memory T cells, B cells, dendritic cells, macrophages and neutrophils were significantly different between the two clusters.
 |
Figure 6 Associations between BTN3A3 expression and tumor immune infiltration, tumor microenvironment in SARC. (A) Analysis of infiltration levels between BTN3A3 high and low groups; (B) Associations between BTN3A3 expression and tumor microenvironment in SARC from TCGA dataset. Data are represented as mean ± SEM; ***P < 0.001. |
Tumor-infiltrating lymphocytes are independent risk factors for survival.18 Therefore, we further determine whether the pattern of immune infiltration was related to BTN3A3 expression. The levels of BTN3A3 mRNA expression were found to be significantly positively correlated with the infiltrating levels of CD8+ T cells (r=0.412, P=2.11e-11), neutrophils (r=0.461, P=3.27e-14), CD4+ T cells (r=0.304, P=1.34e-06), Tregs (r=0.383, P=6.02e-10), macrophage M1 (r =0.543, P=3.76e-20) and M2 (r=0.465, P= 1.67e-14), NK cells (r=0.425, P=3.91e-12), myeloid dendritic cells (r=0.496, P= 1.56e-16), B cells (r=0.277, P=1.15e-05) and myeloid derived suppressor cells (r=−0.360, P=7.01e-09) (Figure S3A). These findings imply that BTN3A3 is involved in immunological infiltration of SARC. The similar relationship between BTN3A3 expression and the abundance of tumor-infiltrating lymphocytes in SARC was acquired from TISIDB (Figure S4). We also found a positive correlation of BTN3A3 with the various markers of immune cells (Table S4).
Moreover, the survival of SARC showed a closer positively correlated with the infiltration of CD4+ T cells, Treg cells, NK cells, M1 macrophage M1, macrophage M2 and dendritic cells. In contrast, higher infiltration levels of CD8+ T cells and neutrophils were associated with worse prognosis (Figure S3B).
Relationship Between BTN3A3 and the Immune Checkpoints
To evaluate the potential role of BTN3A3 in sarcoma (SARC) immunotherapy, we examined its correlation with immune checkpoint expression. Among 30 immune checkpoints analyzed, BTN3A3 expression was positively correlated with 24, and negatively associated with VTCN1 and PVR (Figure 7A). Scatter plots further illustrated significant correlations between BTN3A3 and several key immune checkpoints, including CD96, ENTPD1, ADORA2A, CD200, CD48, CD200R1, CTLA4, and PDCD1 (Figure 7B–I). These results suggest that elevated BTN3A3 expression is associated with an immunosuppressive microenvironment and may indicate enhanced responsiveness to immunotherapy. In a pan-cancer analysis, BTN3A3 expression showed significant correlations with tumor mutational burden (TMB) and microsatellite instability (MSI) in seven and nine cancer types, respectively, although no significant association was observed in SARC (Figure 7J and K).
 |
Figure 7 Association of BTN3A3 with ICs in SARC (A) The relation between the mRNA level of BTN3A3 and ICIs. (B–I) BTN3A3 expression related to CD96, CD39, ADORA2A, CD200, CD48, CD200R1, CTLA-4, and PDCD1 (PD-1). (J) The expression of BTN3A3 was positively correlated with COAD, COADREAD and READ and negatively correlated with ESCA, LUAD, STES and UCEC in TMB. (K) The expression of BTN3A3 was positively correlated with COAD and COADREAD and negatively correlated with ESCA, KIPAN, PRAD, HNSC, LUSC, KICH and DLBC in MSI. |
Diagnostic Value of BTN3A3 Expression in SARC
A nomogram was developed by integrating statistically significant independent prognostic factors. From a total of 263 patients, 163 were randomly assigned to a training cohort and 100 to a testing cohort. The association between BTN3A3 expression and overall survival (OS) in the primary cohort is shown in Figure 8A. The concordance index (C-index) for OS prediction was 0.809 (95% CI: 0.779–0.838) in the training set and 0.714 (95% CI: 0.672–0.757) in the testing set (Figure 8C). Calibration curves demonstrated close agreement between nomogram-predicted and observed survival probabilities in both cohorts (Figure 8B and D).
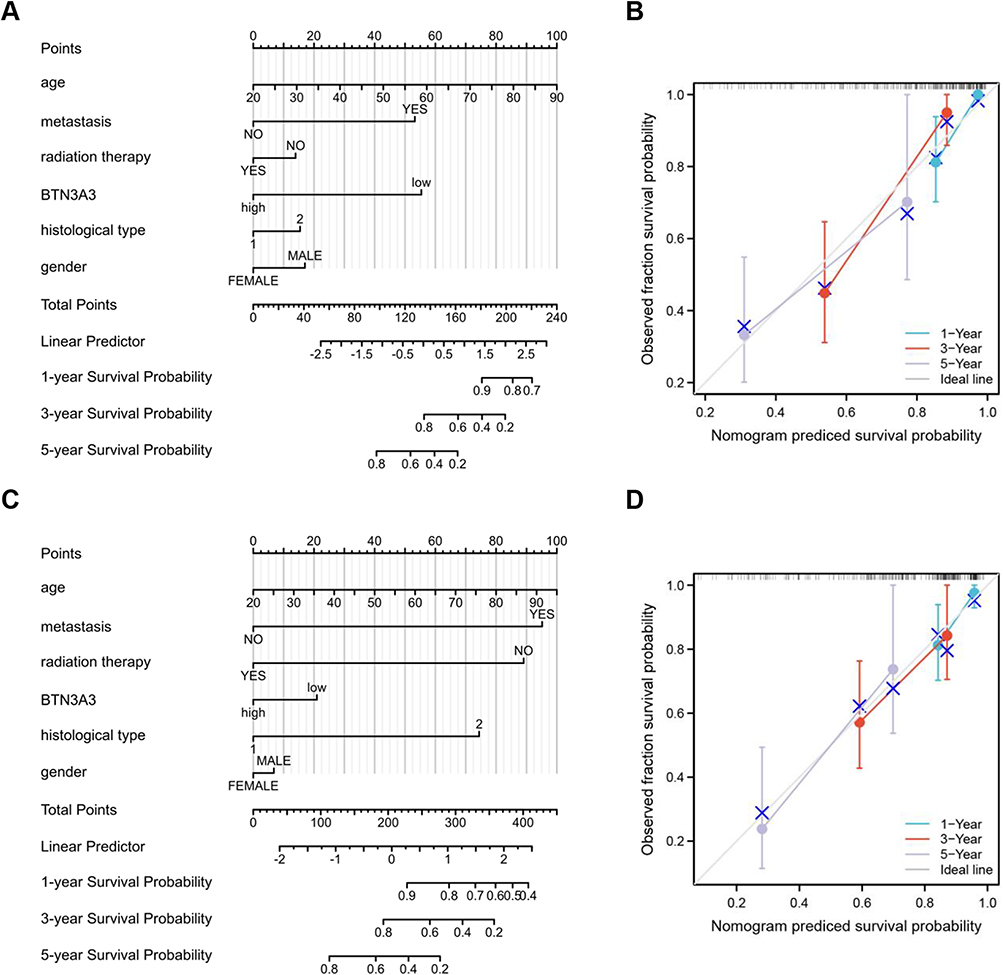 |
Figure 8 Nomograms based on the BTN3A3 for sarcomas patients. (A) Construct a nomogram to predict the OS of patients in training group. (B) The calibration curve of nomogram in training group. (C) Construct a nomogram to predict the OS of patients in testing group. (D) The calibration of nomogram in testing group. |
Discussion
The standard staging technique is now widely recognized as incapable of reliably forecasting the prognosis of cancer patients.19,20 Therefore, there is an urgent need to identify effective biomarkers for tumor diagnosis and prognosis.
The BTN3A family (also designated CD277) constitutes a subfamily of butyrophilin molecules, comprising three isotypes—BTN3A1, BTN3A2, and BTN3A3—encoded by distinct genes in humans and certain non-human primates.21–23 These molecules exhibit broad expression across immune cell subsets, including T cells, B cells, monocytes, dendritic cells, and NK cells,7,21 as well as in both hematopoietic and non-hematopoietic tumor cell lines.9,24 Specific antibodies targeting the extracellular domain of BTN3A proteins can induce activation of Vγ9Vδ2 T cells.25,26 Our analysis indicates that BTN3A3 is phylogenetically conserved among primates, suggesting it may play an important and evolutionarily maintained role. Furthermore, BTN3A3 exhibits higher structural and functional homology to BTN3A2 than to BTN3A1.
BTN3A3 single-nucleotide polymorphisms (SNPs) have been associated with a reduced risk of ovarian cancer27 and decreased recurrence rates.28 Furthermore, BTN3A3 expression levels accurately predict early recurrence (within 21 months) of ovarian cancer following platinum–paclitaxel chemotherapy.11 In breast cancer models, the highly aggressive MDA-MB-231 cell line exhibits elevated BTN3A3 expression, whereas the less aggressive MCF-7 line shows lower expression.29 BTN3A3 also predicts sensitivity to fluorouracil-based therapy in gastric cancer and appears to enhance chemosensitivity by inhibiting EMT.30 According to previous research, BTN3A3 has been linked to intestinal inflammation and colon cancer and has potential to be used as a cancer biomarker.27 In the colonic mucosa of patients with ulcerative colitis, BTN3A3 expression is significantly elevated compared to healthy controls and shows a negative correlation with IFN-γ levels.31 In cervical cancer tissues, BTN3A3 methylation is reduced relative to normal adjacent tissues, suggesting that DNA demethylation may contribute to immune activation in individuals without cervical cancer.17 Meanwhile, we found expression of BTN3A3 was also associated with methylation in SARC.
This study assessed BTN3A3 expression in the prognosis of patients with SARC. Previous TCGA-driven studies have provided a large amount of reliable data for cancer-related research.32–34 We used the TCGA and GEO database to perform bioinformatics analysis on the BTN3A3 gene expression profile in this work. BTN3A3 gene expression levels were considerably higher in individuals with SARC than in matched normal muscle tissues, as validated by qRT-PCR. Kaplan-Meier survival analysis revealed that patients with high BTN3A3 expression had a longer OS (P=0.004).
miRNAs are important regulators of biological functions. We identified hsa-miR-488-3p and hsa-miR-149-5p as vital regulatory miRNAs in the post-transcription regulation of BTN3A3. Previous studies considered miR-488-3p and miR-149-5p both as cancer-suppressing factors. miR-488-3p suppresses proliferation and promotes apoptosis via ZBTB2 in esophageal squamous cell carcinoma.35 It is reported miR-488-3p sensitized malignant melanoma cells to cisplatin.36 Researches have determined down-regulation of miR-149-5p in various cancers, thus offering evidence for the role of miR-149-5p in tumor inhibition.37
Additionally, BTN3A3 may be involved in modulating several key pathways in SARC, including the JAK–STAT signaling pathway, cytokine–cytokine receptor interactions, NK cell-mediated cytotoxicity, T cell receptor signaling, cell adhesion, and Toll-like receptor signaling. We further investigated the role of BTN3A3 within the tumor microenvironment. Tumor immune infiltration in SARC, including T cells, neutrophils, macrophages, NK cells and DC cells, showed a close correlation with its OS and BTN3A3. T cells are the major contributors to antitumor-specific immunity among the tumor-infiltrating lymphocytes.38 Neutrophils promote tumor resistance to radiation therapy.39 It is reported that the total number of macrophages was associated with a good survival in sarcomas.40 DC cells are responsible for antigen presentation to T cell and can activate anti-tumor immunity.41 NK cells have been shown to confer a survival benefit during sarcoma chemotherapy.42 Thus, modulation of immune cell infiltration may represent a key mechanism through which BTN3A3 influences patient survival in SARC. Consistent with this, GSEA indicated that elevated BTN3A3 expression is associated with pathways involved in T cell, NK cell, dendritic cell, and macrophage function. These findings suggest that high BTN3A3 expression may play an important role in remodeling the tumor microenvironment in sarcoma.
Immune checkpoint inhibitors (ICIs) function to restrain excessive T lymphocyte activation; however, tumor cells exploit this mechanism to evade immune surveillance. The efficacy of ICIs remains limited in a subset of patients, an outcome closely associated with biomarker expression levels, including programmed death ligand-1 (PD-L1), tumor TMB, and MSI. In this study, we observed a positive correlation between BTN3A3 expression and multiple immune checkpoints, suggesting that elevated BTN3A3 expression may predict improved response to ICIs.
Multivariate Cox analysis identified BTN3A3 expression and metastasis as independent prognostic factors for OS in SARC patients. To our knowledge, no predictive nomogram incorporating both BTN3A3 expression and clinical variables has been reported for SARC. Using the TCGA dataset, we developed a prognostic nomogram that integrates clinical parameters and BTN3A3 expression to estimate individual mortality risk and inform treatment strategies.
Recent advances in deep learning have introduced powerful computational frameworks for gene expression analysis beyond traditional statistical and machine learning approaches. Generative Adversarial Networks (GANs), for instance, have emerged as promising tools for capturing complex, non-linear patterns in high-dimensional transcriptomic data, enabling the generation of synthetic gene expression profiles and the identification of latent biological features that conventional methods may overlook. We recognize that integrating GAN-based feature extraction or adversarial training strategies could further enhance the discovery of robust BTN3A3-associated biomarker signatures. Future work will explore the incorporation of these advanced computational pipelines to validate and extend our current findings. The lack of bootstrap validation is also a limitation; Future studies should include bootstrap or external validation to confirm these findings. The TCGA sarcoma cohort comprises multiple histologic subtypes with distinct immune landscapes. Previous studies have demonstrated that dedifferentiated liposarcoma and undifferentiated pleomorphic sarcoma exhibit “immune-hot” phenotypes with higher T-cell infiltration, while well-differentiated liposarcoma and synovial sarcoma tend to be “immune-cold”. We acknowledge that BTN3A3 expression may vary across these subtypes, and our findings primarily reflect the aggregated cohort. Future subtype-specific analyses are warranted.
In summary, our findings indicate that elevated BTN3A3 expression in SARC is associated with improved patient outcomes and serves as an independent favorable prognostic factor for overall survival. Furthermore, BTN3A3 expression correlates significantly with immune infiltration, suggesting its involvement in tumor progression and malignant behavior. Cancer treatment is moving quickly toward personalized and precision strategies, especially those that target the immune microenvironment. It is important to use multidisciplinary strategies like combining immunotherapy with metabolic reprogramming or leveraging big data biomarker discovery in the analyze. This study will help BTN3A3 fit into this future landscape. These results support the potential utility of BTN3A3 as a prognostic biomarker in SARC.
Abbreviations
TCGA, The Cancer Genome Atlas; GEO, Gene Expression Omnibus; GSEA, Gene Set Enrichment Analysis; GO, Gene Ontology; KEGG, Kyoto Encyclopedia of Genes and Genomes; BRCA, breast invasive carcinoma; CHOL, cholangiocarcinoma; ESCA, esophageal carcinoma; GBM, glioblastoma multiforme; LIHC, liver hepatocellular carcinoma; LUAD, lung adenocarcinoma; STAD, stomach adenocarcinoma; TGCT, testicular germ cell tumor; HNSC, head and neck squamous cell carcinoma; THCA, thyroid carcinoma; KICH, kidney chromophobe; PRAD, prostate adenocarcinoma; UCEC, uterine corpus endometrial carcinoma; LUSC, lung squamous cell carcinoma; SARC, sarcoma; DC cell, dendritic cell; NK cell, natural killer cell; OS, overall survival; HR, hazard ratio; BTN3A3, butyrophilin subfamily 3 member A3; EU, European Union; BTNs, butyrophilins; SNPs, single-nucleotide polymorphisms; DAVID, Database for Annotation, Visualization, and Integrated Discovery; CI, confidence interval; OR, Odds ratio; SEM, standard error of mean.
Data Sharing Statement
Publicly available datasets were analyzed in this study. This data can be found here: https://portal.gdc.cancer.gov/), GEO dataset GSE17674 (https://www.ncbi.nlm.nih.gov/geo/query/acc.cgi?acc=GSE17674) and https://www.ncbi.nlm.nih.gov/geo/. Further inquiries can be directed to the corresponding authors.
Ethical Statement
The study was approved by the ethical committee of Taiyuan Hand Surgery Hospital. Consent was acquired from all patients in written format.
Disclosure
The authors report no conflicts of interest in this work.
References
1. Skubitz KM, D’Adamo DR. Sarcoma. Mayo Clin Proc. 2007;82:1409–16. doi:10.4065/82.11.1409
2. Stiller CA, Trama A, Serraino D, et al. Descriptive epidemiology of sarcomas in Europe: report from the RARECARE project. Eur J Cancer. 2013;49:684–695. doi:10.1016/j.ejca.2012.09.011
3. Hui JY. Epidemiology and Etiology of Sarcomas. Surg Clin North Am. 2016;96:901–914. doi:10.1016/j.suc.2016.05.005
4. Aung T, Asam C, Haerteis S. Ion channels in sarcoma: pathophysiology and treatment options. Pflugers Arch. 2019;471:1163–1171. doi:10.1007/s00424-019-02299-8
5. Abeler-Dorner L, Swamy M, Williams G, et al. Butyrophilins: an emerging family of immune regulators. Trends Immunol. 2012;33:34–41. doi:10.1016/j.it.2011.09.007
6. Rhodes DA, Reith W, Trowsdale J. Regulation of Immunity by Butyrophilins. Annu Rev Immunol. 2016;34:151–172. doi:10.1146/annurev-immunol-041015-055435
7. Arnett HA, Viney JL. Immune modulation by butyrophilins. Nat Rev Immunol. 2014;14:559–569. doi:10.1038/nri3715
8. Cubillos-Ruiz JR, Martinez D, Scarlett UK, et al. CD277 is a negative co-stimulatory molecule universally expressed by ovarian cancer microenvironmental cells. Oncotarget. 2010;1:329–338. doi:10.18632/oncotarget.165
9. Compte E, Pontarotti P, Collette Y, et al. Frontline: characterization of BT3 molecules belonging to the B7 family expressed on immune cells. Eur J Immunol. 2004;34:2089–2099. doi:10.1002/eji.200425227
10. Zhu M, Yan C, Ren C, et al. Exome Array Analysis Identifies Variants in SPOCD1 and BTN3A2 That Affect Risk for Gastric Cancer. Gastroenterology. 2017;152:2011–2021. doi:10.1053/j.gastro.2017.02.017
11. Peedicayil A, Vierkant RA, Hartmann LC, et al. Risk of ovarian cancer and inherited variants in relapse-associated genes. PLoS One. 2010;5:e8884. doi:10.1371/journal.pone.0008884
12. Sonkin D, Thomas A, Teicher BA. Cancer treatments: past, present, and future. Cancer Genet. 2024;286-287:18–24. doi:10.1016/j.cancergen.2024.06.002
13. Subramanian A, Tamayo P, Mootha VK, et al. Gene set enrichment analysis: a knowledge-based approach for interpreting genome-wide expression profiles. Proc Natl Acad Sci U S A. 2005;102:15545–15550. doi:10.1073/pnas.0506580102
14. Li T, Fan J, Wang B, et al. TIMER: a Web Server for Comprehensive Analysis of Tumor-Infiltrating Immune Cells. Cancer Res. 2017;77:e108–e110. doi:10.1158/0008-5472.CAN-17-0307
15. Zhang C, Zhao N, Zhang X, et al. SurvivalMeth: a web server to investigate the effect of DNA methylation-related functional elements on prognosis. Brief Bioinform. 2021;22:162. doi:10.1093/bib/bbaa162
16. Gevaert O. MethylMix: an R package for identifying DNA methylation-driven genes. Bioinformatics. 2015;31:1839–1841. doi:10.1093/bioinformatics/btv020
17. Milutin Gasperov N, Farkas SA, Nilsson TK, et al. Epigenetic activation of immune genes in cervical cancer. Immunol Lett. 2014;162:256–257. doi:10.1016/j.imlet.2014.09.019
18. Azimi F, Scolyer RA, Rumcheva P, et al. Tumor-infiltrating lymphocyte grade is an independent predictor of sentinel lymph node status and survival in patients with cutaneous melanoma. J Clin Oncol. 2012;30:2678–2683. doi:10.1200/JCO.2011.37.8539
19. Hause RJ, Pritchard CC, Shendure J, et al. Classification and characterization of microsatellite instability across 18 cancer types. Nat Med. 2016;22:1342–1350. doi:10.1038/nm.4191
20. Husain ZA, Chen T, Corso CD, et al. A Comparison of Prognostic Ability of Staging Systems for Human Papillomavirus-Related Oropharyngeal Squamous Cell Carcinoma. JAMA Oncol. 2017;3:358–365. doi:10.1001/jamaoncol.2016.4581
21. Messal N, Mamessier E, Sylvain A, et al. Differential role for CD277 as a co-regulator of the immune signal in T and NK cells. Eur J Immunol. 2011;41:3443–3454. doi:10.1002/eji.201141404
22. Henry J, Ribouchon M, Depetris D, et al. Cloning, structural analysis, and mapping of the B30 and B7 multigenic families to the major histocompatibility complex (MHC) and other chromosomal regions. Immunogenetics. 1997;46:383–395. doi:10.1007/s002510050292
23. Harly C, Peigne CM, Scotet E. Molecules and Mechanisms Implicated in the Peculiar Antigenic Activation Process of Human Vgamma9Vdelta2 T Cells. Front Immunol. 2014;5:657. doi:10.3389/fimmu.2014.00657
24. Rhodes DA, Chen HC, Price AJ, et al. Activation of human gammadelta T cells by cytosolic interactions of BTN3A1 with soluble phosphoantigens and the cytoskeletal adaptor periplakin. J Immunol. 2015;194:2390–2398. doi:10.4049/jimmunol.1401064
25. Palakodeti A, Sandstrom A, Sundaresan L, et al. The molecular basis for modulation of human Vgamma9Vdelta2 T cell responses by CD277/butyrophilin-3 (BTN3A)-specific antibodies. J Biol Chem. 2012;287:32780–32790. doi:10.1074/jbc.M112.384354
26. Starick L, Riano F, Karunakaran MM, et al. Butyrophilin 3A (BTN3A, CD277)-specific antibody 20.1 differentially activates Vgamma9Vdelta2 TCR clonotypes and interferes with phosphoantigen activation. Eur J Immunol. 2017;47:982–992. doi:10.1002/eji.201646818
27. Kiyamova R, Garifulin O, Gryshkova V, et al. Preliminary study of thyroid and colon cancers-associated antigens and their cognate autoantibodies as potential cancer biomarkers. Biomarkers. 2012;17:362–371. doi:10.3109/1354750X.2012.677476
28. Blazquez JL, Benyamine A, Pasero C, et al. New Insights Into the Regulation of gammadelta T Cells by BTN3A and Other BTN/BTNL in Tumor Immunity. Front Immunol. 2018;9:1601. doi:10.3389/fimmu.2018.01601
29. Liu D, Lu Q, Wang X, et al. LSECtin on tumor-associated macrophages enhances breast cancer stemness via interaction with its receptor BTN3A3. Cell Res. 2019;29:365–378. doi:10.1038/s41422-019-0155-6
30. Pan J, Dai Q, Xiang Z, et al. Three Biomarkers Predict Gastric Cancer Patients’ Susceptibility To Fluorouracil-based Chemotherapy. J Cancer. 2019;10:2953–2960. doi:10.7150/jca.31120
31. Lebrero-Fernandez C, Wenzel UA, Akeus P, et al. Altered expression of Butyrophilin (BTN) and BTN-like (BTNL) genes in intestinal inflammation and colon cancer. Immun Inflamm Dis. 2016;4:191–200. doi:10.1002/iid3.105
32. Wang Y, Wang J, Zeng T, et al. Data-mining-based biomarker evaluation and experimental validation of SHTN1 for bladder cancer. Cancer Genet. 2024;288-289:43–53. doi:10.1016/j.cancergen.2024.09.002
33. Liu H, Karsidag M, Chhatwal K, et al. Single-cell and bulk RNA sequencing analysis reveals CENPA as a potential biomarker and therapeutic target in cancers. PLoS One. 2025;20:e031474520250116. doi:10.1371/journal.pone.0314745
34. Rasteh AM, Liu H, Wang P. Pan-cancer genetic profiles of mitotic DNA integrity checkpoint protein kinases. Cancer Biomark. 2024;41:CBM240119. doi:10.3233/CBM-240119
35. Yang Y, Li H, He Z, et al. MicroRNA-488-3p inhibits proliferation and induces apoptosis by targeting ZBTB2 in esophageal squamous cell carcinoma. J Cell Biochem. 2019;120:18702–18713. doi:10.1002/jcb.29178
36. Li N, Ma Y, Ma L, et al. MicroRNA-488-3p sensitizes malignant melanoma cells to cisplatin by targeting PRKDC. Cell Biol Int. 2017;41:622–629. doi:10.1002/cbin.10765
37. Ghafouri-Fard S, Khoshbakht T, Hussen BM, et al. A Review on the Role of miR-149-5p in the Carcinogenesis. Int J Mol Sci. 2021;23:415. doi:10.3390/ijms23010415
38. Franchina DG, He F, Brenner D. Survival of the fittest: cancer challenges T cell metabolism. Cancer Lett. 2018;412:216–223. doi:10.1016/j.canlet.2017.10.014
39. Wisdom AJ, Hong CS, Lin AJ, et al. Neutrophils promote tumor resistance to radiation therapy. Proc Natl Acad Sci U S A. 2019;116:18584–18589. doi:10.1073/pnas.1901562116
40. Qian BZ, Pollard JW. Macrophage diversity enhances tumor progression and metastasis. Cell. 2010;141:39–51. doi:10.1016/j.cell.2010.03.014
41. Hansen M, Andersen MH. The role of dendritic cells in cancer. Semin Immunopathol. 2017;39:307–316. doi:10.1007/s00281-016-0592-y
42. Moore C, Eslin D, Levy A, et al. Prognostic significance of early lymphocyte recovery in pediatric osteosarcoma. Pediatr Blood Cancer. 2010;55:1096–1102. doi:10.1002/pbc.22673
 © 2026 The Author(s). This work is published and licensed by Dove Medical Press Limited. The
full terms of this license are available at https://www.dovepress.com/terms
and incorporate the Creative Commons Attribution
- Non Commercial (unported, 4.0) License.
By accessing the work you hereby accept the Terms. Non-commercial uses of the work are permitted
without any further permission from Dove Medical Press Limited, provided the work is properly
attributed. For permission for commercial use of this work, please see paragraphs 4.2 and 5 of our Terms.
© 2026 The Author(s). This work is published and licensed by Dove Medical Press Limited. The
full terms of this license are available at https://www.dovepress.com/terms
and incorporate the Creative Commons Attribution
- Non Commercial (unported, 4.0) License.
By accessing the work you hereby accept the Terms. Non-commercial uses of the work are permitted
without any further permission from Dove Medical Press Limited, provided the work is properly
attributed. For permission for commercial use of this work, please see paragraphs 4.2 and 5 of our Terms.