")
Back to Journals » International Journal of Nanomedicine » Volume 18
High Contrast Detection of Carotid Neothrombus with Strong Near-Infrared Absorption Selenium Nanosphere Enhanced Photoacoustic Imaging
Authors He F, Hou W, Lan Y, Gao W, Zhou M, Li J, Liu S, Yang B , Zhang J
Received 10 March 2023
Accepted for publication 4 July 2023
Published 24 July 2023 Volume 2023:18 Pages 4043—4054
DOI https://doi.org/10.2147/IJN.S404743
Checked for plagiarism Yes
Review by Single anonymous peer review
Peer reviewer comments 2
Editor who approved publication: Prof. Dr. Dongwoo Khang
Fengbing He,1,* Wenzhong Hou,1,* Yintao Lan,1,2 Weijian Gao,1 Mengyu Zhou,1 Jinghang Li,1 Shutong Liu,1 Bin Yang,1 Jian Zhang1
1Qingyuan People’s Hospital, The Sixth Affiliated Hospital of Guangzhou Medical University, School of Biomedical Engineering, Guangzhou Medical University, Guangdong, People’s Republic of China; 2Guangzhou Regenerative Medicine and Health Guangdong Laboratory, Guangdong, People’s Republic of China
*These authors contributed equally to this work
Correspondence: Jian Zhang, Email [email protected]
Background: Carotid artery thrombosis is the leading cause of stroke. Since there are no apparent symptoms in the early stages of carotid atherosclerosis onset, it causes a more significant clinical diagnosis. Photoacoustic (PA) imaging provides high contrast and good depth information, which has been used for the early detection and diagnosis of many diseases.
Methods: We investigated thrombus formation by using 20% ferric chloride (FeCl3) in the carotid arteries of KM mice for the thrombosis model. The near-infrared selenium/polypyrrole (Se@PPy) nanomaterials are easy to synthesize and have excellent optical absorption in vivo, which can be used as PA contrast agents to obtain thrombosis information.
Results: In vitro experiments showed that Se@PPy nanocomposites have fulfilling PA ability in the 700 nm to 900 nm wavelength range. In the carotid atherosclerosis model, maximum PA signal enhancement up to 3.44, 4.04, and 5.07 times was observed by injection of Se@PPy nanomaterials, which helped to diagnose the severity of carotid atherosclerosis.
Conclusion: The superior PA signal of Se@PPy nanomaterials can identify the extent of atherosclerotic carotid lesions, demonstrating the feasibility of PA imaging technology in diagnosing carotid thrombosis lesion formation. This study demonstrates nanocomposites and PA techniques for imaging and diagnosing carotid thrombosis in vivo.
Keywords: photoacoustic contrast agent, molecular imaging, Se@PPy nanocomposites, carotid artery thrombus
Introduction
Cardiovascular disease accounts for about half of all deaths worldwide, mainly due to the high fatality rate of advanced atherosclerosis.1,2 After lipid deposition in the intima of blood vessels, the intima will gradually thicken to form atherosclerotic plaques and will be a danger of falling off at any time.3 The thrombus is a potentially complicating condition of atherosclerosis. Thrombosis often occurs after atherosclerotic plaque ruptures, which may lead to stroke or acute myocardial infarction.4 The accumulation of plaque can block blood flow in the carotid arteries, and in severe cases, inadequate blood supply to the brain may lead to an acute stroke event. Approximately one-quarter of all ischemic strokes are cardioembolic, especially in patients with atrial fibrillation,5 and three-fourths are atherothrombotic, including carotid artery atherosclerotic disease.6 Despite advances in medical therapies and thrombolysis, the effective treatment of stroke remains elusive for various practical reasons. Therefore, it is essential to familiarize and prevent thrombotic diseases.7
Standard methods of identifying arterial thrombosis on clinical imaging include computed tomography,8 positron emission tomography,9,10 and magnetic resonance imaging.11 These imaging techniques are radioactive, expensive, or harmful and have limitations in the clinical examination of thrombosis lesions. Due to the radiation-free and low-cost advantages of optics or ultrasound, it has attracted exploration and research in clinical medicine. Molecular fluorescence imaging does not produce ionizing radiation, requires low energy to excite fluorescence, and has excellent imaging contrast.12–15 However, this imaging modality only supplies a two-dimensional signal and lacks longitudinal information. Furthermore, the resolution is poor in biological tissues larger than 1mm due to light scattering.16 Ultrasound imaging receives reflected signals and processes them to obtain images of organs in the body. This imaging modality is less effective for thrombus detection due to the limited penetration of micron-sized contrast agents.17–19 Although available nano-bubble technology increases infiltration into the vasculature, the bubble size is at odds with clinical ultrasound system stability and echo efficiency.20–22 Thus, a low-cost, radiation-free imaging method is essential and can be combined with nanomaterial contrast agents to provide accurate thrombus localization and 3D information.
PA imaging is a noninvasive technique based on the PA effect on biological tissues. It preserves high contrast performance and adds the depth advantage of ultrasonic imaging.23 In PA imaging technology, when a pulsed laser irradiates biological tissues, the absorbed electromagnetic wave energy is converted into heat energy, which produces an ultrasonic signal due to thermal expansion. Because light waves have a scattering effect in biological tissues, electromagnetic wave energy can effectively enter the tissue at a depth of about five cm.24 Based on the unique spectral characteristics of each atom and molecule, PA imaging can precisely detect the biochemical components of biological tissues, arousing people’s enthusiasm in various fields of biomedicine.25 PA imaging technology can diagnose diseases such as breast cancer, skin lesions, cerebrovascular disease, and colorectal cancer, obtaining high-resolution and high-contrast biological tissue images to help doctors accurately diagnose patients. In biomedical research, it can be used to observe the morphology, physiology, and metabolism of cells, tissues, and organs under different conditions and study the structure of cells and the human body, especially in disease research, which is of great significance. One of the potential research areas of PA imaging is cardiovascular disease diagnosis, such as noninvasive vascular imaging26–28 and intravascular imaging.29–32 The indirect study of thrombotic disease through thrombotic animal models is essential, and there have been cases of discovering antithrombotic drugs.33 Mice have a highly similar genetic structure to humans, often used in scientific research to study thrombotic diseases.34,35 A standard method of arterial thrombosis in mice is the application of FeCl3 to the arterial surface.36–39 When FeCl3 is administered topically, it causes vascular lipid peroxidation and endothelial cell destruction,40 causing intimal damage, platelet adhesion, aggregation, and ultimately thrombosis. The characteristic information about atherosclerotic inflammation can be obtained without damage using the PA imaging system.41 Due to the light absorption properties of blood, Professor Vasilis’ team used it as a signal source to image the carotid artery in healthy humans using a PA imaging system.42 Imaging studies of arterial thrombosis in animals have been reported, and these researches have proved that PA imaging has the potential to detect thrombosis.43,44 In order to better apply the PA imaging system for the noninvasive detection of carotid thrombosis, we applied PPy-coated selenium (Se@PPy nanocomposite) as contrast agent.45 In recent years, selenium nanomaterials have been a new material that can efficiently enter tumors through the bloodstream and kill them using the photothermal effect.46,47 Both photothermal and PA effects are light energy conversion processes in the same direction, the difference being that photothermal therapy uses a continuous high-energy laser. In contrast, PA imaging uses a low-power pulsed laser; therefore, selenium nanomaterials have the potential for PA imaging. Our study will help to advance the use of PA technology in thrombosis imaging, thereby facilitating further research into thrombotic diseases in medicine. As illustrated in Figure 1, the Se@PPy nanocomposites could accumulate in the thrombus site, and the PA imaging system can aid in treatment decisions, such as thrombolysis, anticoagulation, and surgery. The following sections will cover our details, results, and discussions.
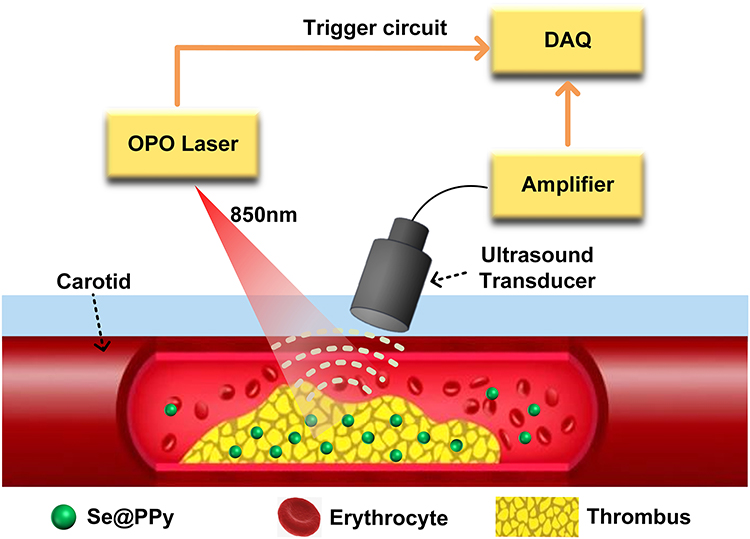 |
Figure 1 Principle of detecting carotid artery thrombosis with the photoacoustic imaging system. Abbreviations: OPO, optical parametric oscillator; DAQ, Data acquisition system. |
Materials and Methods
Materials
FeCl3 was purchased from Kemai Laboratory Supplies Management Department (Wuhan, China). NaCl and Heparin sodium were supplied by Shanghai Yuanye Bio-Technology Co., Ltd. Reagents for selenium dioxides and pyrrole were purchased from Shanghai Macklin Biochemical Technology Co., Ltd. Cell apoptosis was detected using the Annexin V-FITC/PI apoptosis detection kit (Yeasen Biotechnology Co., Ltd., Shanghai, China). 3-(4,5-dimethylthiazol-2-yl)-5-(3-carboxymethoxyphenyl)-2-(4-sulfophenyl)-2H-tetrazolium (MTS) and RPMI-1640 was obtained from Sigma (Shanghai, China). Aldrich. Unless otherwise noted, all commercial reagents were used as received. Experiments were carried out using ultra-pure water (18.25 MΩ*cm, 25°C).
Preparation of Se@PPy Nanocomposites
Prepare a 500 mL beaker and pour approximately 300 mL of deionized water into it. Place the beaker on a magnetic stirrer. Next, use a molecular balance to measure 80.4 mg of pyrrole solution and 79.89 mg of selenium dioxide. Pour the selenium dioxide particles into a flat-bottomed flask, then add 12 mL of deionized water. Transfer the pyrrole solution to the flask using a pipette. Place the magnetic stirrer in the flask. Cover the flask opening tightly with cling film to prevent the solution from splashing, and poke a few small holes for pressure balance. Then, clip the flask with an apparatus and immerse it partially in the water in the beaker. Adjust the magnetic stirrer’s speed and water bath temperature to 800 rpm and 35°C, respectively. Let the reaction proceed for 24 hours in the water bath. Finally, transfer the reaction mixture to a 20 mL brown glass bottle for storage.
Characterization
The atomic force microscope imaging was collected on an instrument (Multimode 8, Bruker Co.). The particle size of nanocomposites was tested with Malvern Nano-ZS Particle Sizer (Britain) at different concentrations after 24h and then at 160 μg/mL for seven days. PA characterization was performed using a self-constructed multi-spectral PA microscope system. The optical absorption spectrum of Se@PPy nanocomposites was detected with Thermo Fisher Scientific Evolution 300 spectrophotometer (USA).
Animal and Ethics Statement
All procedures involving animals were carried out under the Guidelines for Institutional Animal Care and Use Committee and approved by the approval of the Animal Care and Usage Committee of Guangdong Zhiyuan Biomedical Technology Co., Ltd (IAEC-2022011202). All KM mice used for the experiments were obtained from Beijing Vitalstar Biotechnology Co., Ltd. KM mice aged eight weeks were selected for this study. Twenty animals were divided into five groups (4 mice per group). The normal group underwent blood sampling by cardiac puncture. One group was used for blood clearance experiments. The other two groups were treated with FeCl3 to model different degrees of carotid atherosclerosis. The other group of healthy mice was used for control experiments.
Clearance of Se@PPy Nanocomposites in Blood
Mouse was anesthetized with 1% sodium pentobarbital via tail vein injection. PA imaging of mouse ear vessels was performed under laser excitation at 850 nm. After injection of Se@PPy nanocomposites (160 μg/mL, 150 μL) through the tail vein, the mouse ear vessels were imaged again at 0h, 1h, 2h, 4h, 5h, and the PA signals were averaged in order to quantify Se@PPy nanocomposites concentration in blood.
Cytotoxicity of Se@PPy Nanocomposites
The material was centrifuged at 4000 rpm and filtered through a 220 nm filter to remove the supernatant. After adding an equal amount of culture medium to resuspend the materials uniformly, the required experimental concentration (10, 20, 40, 80, 100 μg/mL) was prepared and stored on a clean bench.
To assess the toxic effects of Se@PPy nanocomposites for cells utilizing the cell proliferation assay (MTS). The 22Rv1 cells (2×10³ cells/per well, 100 μL) were divided into six groups, and five replicate wells were set up to incubate for 24 hours on 96-well plates to achieve cell apposition. After removing the medium, Se@PPy nanocomposites solutions were added at different concentrations (10, 20, 40, 80, 100 μg/mL), and the cells were placed in an incubator and incubated at 37°C for 24 hours. After adding 20 μL of MTS per well, enzyme labeling apparatus (OD: 490 nm) was used to measure the absorbance at 2, 3 and 4 hours to obtain cell viability values.
We also evaluated the in vitro cytotoxicity of Se@PPy nanocomposites on endothelial cells HUVEC using flow cytometry. HUVEC cells were seeded at a density of 5×10⁵ cells/well in 6-well plates and five groups were established with different concentrations of Se@PPy nanocomposites (0, 10, 20, 40, 100 μg/mL). The plate was then incubated overnight in a cell culture incubator. On the second day, nanomaterials were added following the same material processing as previously and then incubated for 4 hours. The subsequent experimental operations were carried out according to the instructions of the reagent kit. After incubation, cells were collected by detached with trypsin without EDTA and centrifuged at 4°C for 5 min (300 g) to collect the cells. The cells were washed twice with pre-cooled (4°C) PBS, each time being centrifuged (under the same conditions as before). The PBS was discarded, and the cells were resuspended in 100 μL of 1×Binding Buffer. The cells were then stained with 5 μL of Annexin V-FITC and 10 μL of PI Staining Solution, mixed gently, and kept at room temperature for 15 min in the dark. Cell viability was detected using flow cytometry within 1 hour.
The PA Properties of Se@PPy Nanocomposites
This study employed a multi-spectrum PA microscopy system (as illustrated in Figure S1). The sample was excited using a tunable nanosecond pulsed OPO laser (Continuum, USA) as the energy source. The resulting acoustic signals were then captured using an ultrasound transducer (Olympus, USA) with a central frequency of 25 MHz. The captured signals were amplified using an amplifier (Olympus, USA) and transmitted to a computer outfitted with a data acquisition module and image processing module for further analysis. Injection of Se@PPy nanocomposites at 160 μg/mL into the capillary glass tube and then fixed in a block of agar plates, followed by PA signal acquisition of this sample from 750 nm to 940 nm at 10 nm wavelength intervals to get the PA spectrum. Followed by continuous irradiation of new glass capillary tubes at 800 nm for 20 minutes after switching to a fresh sample, the PA stability of the nanomaterial was assessed by monitoring the change in PA intensity. Different concentrations (0, 20, 40, 80, 160 μg/mL) of Se@PPy nanocomposites glass tubes were prepared using the above method, and then PA images and intensities were obtained at an excitation wavelength of 850 nm.
PA Intensity of Se@PPy Nanocomposites Mixed with Blood
The blood collected by cardiac puncture was transferred to a 96-well plate (containing heparin sodium) and mixed with three concentrations of 80 μg/mL, 160 μg/mL, and original of Se@PPy nanocomposites (ratio of blood to Se@PPy nanocomposites 1:1) to obtain PA images and statistical average PA signal value.
In vivo PA Imaging of Carotid Artery Thrombosis
Mice were anesthetized with 1% pentobarbital sodium via intraperitoneal injection, and the depth of anesthesia was confirmed by pinching their toes. After a small animal electric clipper removed the neck and upper chest fur, the mice were immobilized in the supine position, and the surgical site was disinfected with alcohol. A surgical blade made a small incision in the neck, and the skin was separated from the subcutaneous layer. A midline incision was made in the neck. The thin fascia between the submandibular glands was gently dissected using thin hemostatic forceps and Graefe tweezers to expose the left common carotid artery. Hemostatic forceps separated the carotid artery from the fascia through a small opening. Hold a clean filter paper fragment with forceps and insert it through the opening, then unfold the paper to absorb any FeCl3 that may have penetrated the surrounding blood vessels. In advance, another filter paper (0.5×1 ~ 2×2 mm) was soaked in 20% FeCl3 solution until saturated and placed on the carotid endothelial surface for 5 minutes. After that, the FeCl3 solution was cleaned with PBS. The area where the FeCl3 solution was applied was imaged by the PA imaging system immediately, and the PA image and PA signal value was obtained. The imaging process took about 30 minutes, and nanomaterials (160 μg/mL, 150 μL) were immediately injected via the tail vein. The same area was imaged again under the same conditions as before. Small-scale filter paper corresponds to the partial part, and large-scale infiltration corresponds to the entire part. The wound was closed after surgery.
Statistical Analysis
Statistical analysis was performed using IBM SPSS Statistics 25 software. Data are shown as mean ±SD. In group comparisons, the Mann–Whitney U-test was used for continuous variables. The Kruskal–Wallis test tested the concentration difference. A p-value less than 0.05 was considered statistically significant in all cases.
Result and Discussion
The carotid arteries are primarily responsible for delivering blood to the head. Patients with mild carotid artery thrombosis will experience mild dizziness, headaches, and other discomforts. Severe carotid artery thrombosis is mainly a bilateral thrombosis of the carotid artery, causing severe ischemia in the brain, manifesting in the form of shock and coma, consciousness is lost, and the body is paralyzed.48 In this research, we proved the feasibility of Se@PPy nanocomposites combined with PA imaging technology and used to detect carotid artery thrombosis in mouse models. We could diagnose the severity of carotid artery thrombosis in mouse models.
Characterization of Se@PPy Nanocomposites
At room temperature, pyrrole can reduce H2SeO3 in water to produce elemental selenium, and selenium can act as a catalyst for the polymerization of pyrrole, ultimately resulting in the synthesis of Se@PPy nanocomposites. Fabrication of Se@PPy nanocomposites is elucidated in Figure S2. The stability of the nanocomposite is displayed in Figure S3, and the dissolution in water is shown in Figure S4.
The results of the atomic force microscopy observation as shown in Figure 2A, where the height of the Se@PPy nanocomposites can be seen to be approximately 100 nm to 140 nm. In addition, the diameters of selenium nanomaterials with different concentrations were detected by dynamic light scattering, as shown in Figure 2B, indicating that the average hydrodynamic diameter of the nanostructures is about 190 nm, which differs from the results observed by atomic force microscopy. The differences in sample preparation are the reason for this discrepancy. When the concentration was 160 μg/mL on the first day, the particle diameter distribution was shown in Figure 2C, proving that the material’s particle distribution was stable After seven days of continuous detection, as shown in Figure 2D, it is found that the diameter of the nanoparticles has little difference, which verifies that the nanoparticles have good stability.
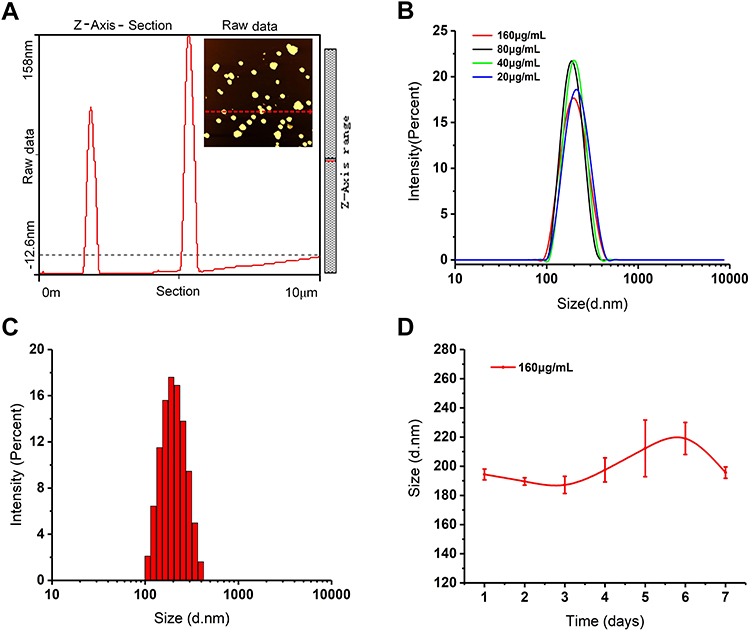 |
Figure 2 (A) Atomic force microscope image of Se@PPy nanocomposites. Cohesive and discrete nanoparticles have been synthesized. (B) The dynamic light scattering method measured the hydrodynamic dimensions of nanocomposites with different concentrations after 24h placement. (C) The particle diameter distribution of Se@PPy nanocomposites with a concentration of 160 μg/mL. (D) The hydrodynamic diameter was detected for seven consecutive days. |
PA Properties of Se@PPy Nanocomposites in vitro
As shown in Figure 3A, the absorption spectrum demonstrated that the absorption range of Se@PPy nanocomposites was extended to the near-infrared region from 700 nm to 850 nm. The relevant experiments were performed using the multi-spectrum PA microscopy system to confirm the PA properties of the nanomaterials further. First, we measured the PA signal value of the material in the wavelength range of 750 nm to 940 nm. The experimental results are shown in Figure 3B. It can be seen that the Se@PPy nanocomposites have a strong PA signal in the near-infrared area from 800 nm to 900 nm, and the characteristic peak can be seen at 850 nm, which is similar to the absorption spectrum. However, a shift in the peak is observed by comparing the two curves. This situation will also be seen in other PA contrast agents. This is mainly affected by slight differences in preparation or caused by differences in the spectral and photophysical processes.
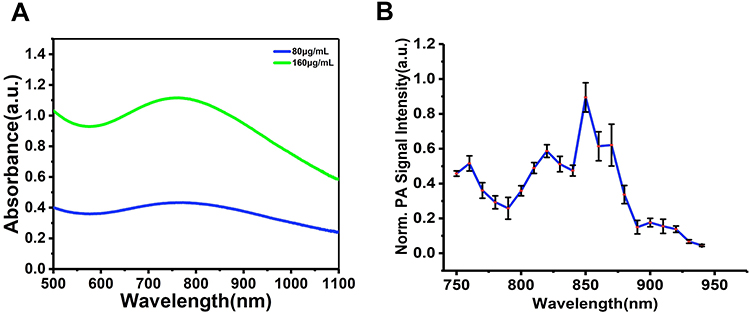 |
Figure 3 (A) UV-vis absorption spectrums of the Se@PPy nanocomposites at different concentrations dissolved in water. (B) PA spectrum of Se@PPy nanocomposites at different wavelengths. |
After confirming the best wavelength imaging of Se@PPy nanocomposites, we performed PA imaging of five concentrations of nanomaterials under laser excitation at 850 nm. The reagents were injected individually into multiple 2 mm glass tubes wrapped in agar. The results are shown in Figure 4A, where it can be observed that the Se@PPy nanocomposites exhibited a PA effect even at a low concentration.
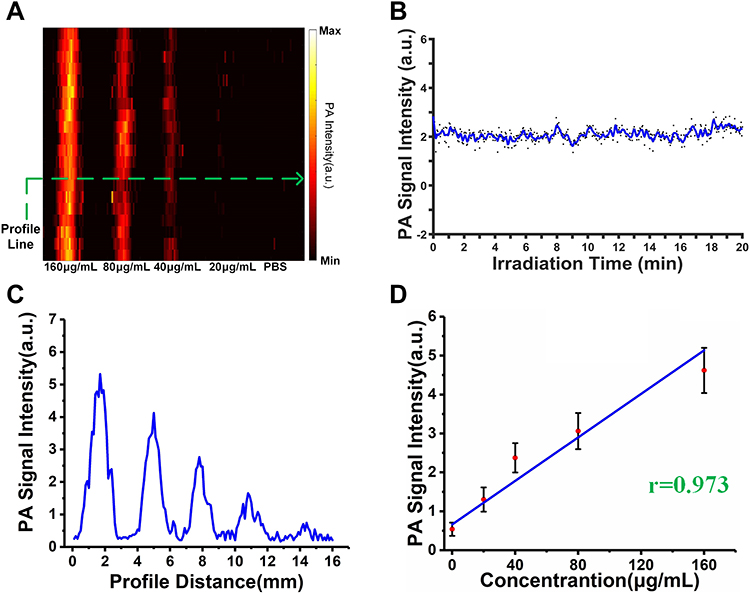 |
Figure 4 (A) PA images of Se@PPy nanocomposites under excitation at 850 nm at various concentrations. (B) The PA signal from Se@PPy nanocomposites under continuous laser irradiation for 20 min. (C) Intensity profiles along the dashed line from (A). (D) The PA amplitudes at 850 nm as a function of the concentrations of Se@PPy nanocomposites. |
The result after continuous laser irradiation is shown in Figure 4B shows that the PA signal did not change significantly during 20 minutes of continuous laser irradiation, demonstrating that Se@PPy nanocomposites improve the stability of PA imaging. In addition, as the concentration of the nanomaterials increases, the corresponding PA signals are significantly enhanced. The curve shown in Figure 4C was extracted from the PA image along the green dashed line, with five sharp peaks representing the PA signal for different concentrations of the Se@PPy nanocomposites. The fitted curve between the concentrations of Se@PPy nanocomposites and PA signal values as displayed in Figure 4D, showed an excellent linear relationship (r=0.973) between the two. Therefore, it can be demonstrated from the above in vitro experimental results that Se@PPy nanocomposites exhibited desirable PA properties.
Toxic Side Effects of Se@PPy Nanocomposites
Cytotoxicity experiments were conducted to evaluate the biocompatibility of Se@PPy nanocomposites. Through cell experiments, it can be seen that the effects of composite materials on the vitality of 22Rv1 cells at different concentrations. In Figure 5, after co-cultured with 22Rv1 cells for 24h, it was seen that the cell viability showed an enhanced trend even at higher concentrations, which showed that the nanomaterial has good biocompatibility and has the potential to promote cell growth at appropriate doses. The flow cytometry results, as shown in Figure S5, demonstrate that at concentrations of 10 μg/mL, 20 μg/mL, and 40 μg/mL, the cell survival rates were 91.2%, 95.3%, and 94.8%, respectively. Our findings demonstrate that HUVEC possesses excellent tolerance to Se@PPy nanocomposites at low concentrations, and incorporating these foreign particles did not impact cell activity. Furthermore, even at a 100 μg/mL nanoparticle concentration, 90.5% of HUVEC cells remained viable, indicating that Se@PPy nanocomposites have favorable biocompatibility and will not cause significant toxic side effects on normal tissues upon entering the body.
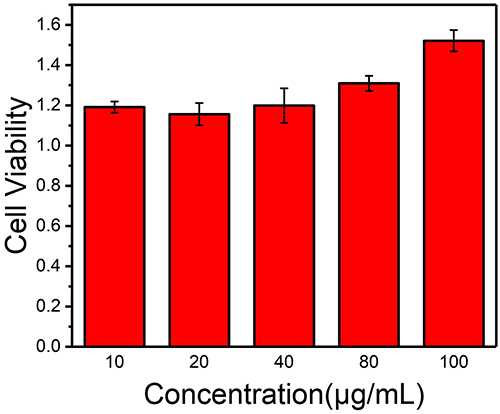 |
Figure 5 Cell viability of 22Rv1 cells when co-cultured with different concentrations (10, 20, 40, 80, and 100 μg/mL) of the Se@PPy nanocomposites at 24 h. |
Once the effect on cellular activity has been confirmed in vitro, it is essential to investigate whether the nanoparticles harm biological organs. To this end, Se@PPy nanocomposites (160 μg/mL, 150 μL) were injected into mice via intravenous injection in the tail vein, and several major organs - including the heart, liver, spleen, lung, and kidney - were sampled after seven days of regular feeding and subjected to H&E analysis. The experimental results are shown in Figure 6, and it can be seen that there is no significant damage in the experimental group compared to normal organs, which showed that they have no toxic effects on biological organs.
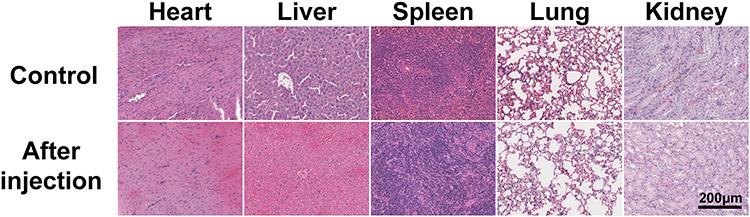 |
Figure 6 Hematoxylin and eosin (H&E) staining of the heart, kidney, liver, lung, and spleen from healthy untreated KM mouse (top row) and mice after injection of Se@PPy nanocomposites (bottom row). The scale bar was 200 µm. |
PA Signal of Se@PPy Nanocomposites Mixed with Blood
Mixing different concentration gradients of Se@PPy nanocomposites with mouse blood, the signal intensity is evident as shown in Figure 7A. As displayed in Figure 7B, the results show a significant difference between groups for each concentration gradient, **P < 0.01; ***P < 0.001. The experimental results accurately show that the signal value of the nanomaterials mixed with blood increases with increasing concentration, indicating the potential use in angiography.
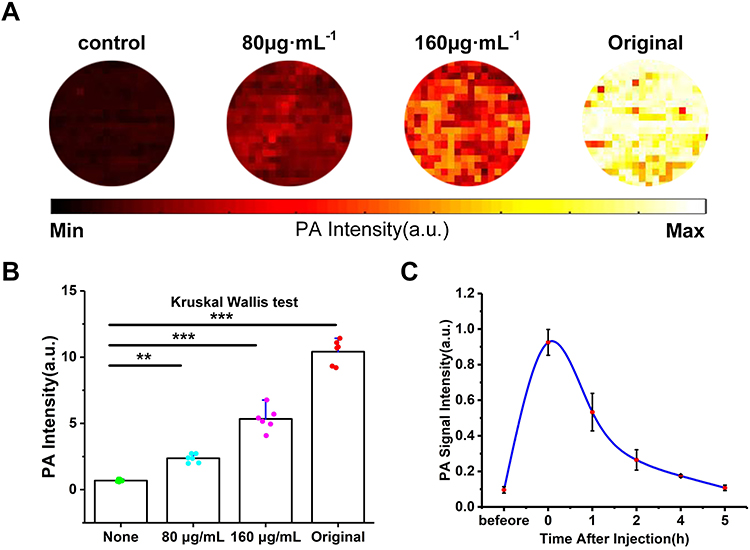 |
Figure 7 (A) PA images of different concentrations of Se@PPy nanocomposites mixed into the blood under excitation at 850 nm. (B) Quantified PA signal enhancement from (A). (C) The blood circulation curve of Se@PPy nanocomposites. Data are shown as mean ±SD. **P < 0.01; ***P < 0.001. |
After injection of Se@PPy nanocomposites into the mouse through the tail vein, the highest initial PA signal can be observed in the ear vessels as shown in Figure 7C, and then gradually weakened with time until 5 hours later, the signal was similar to that before the injection, and the Se@PPy nanocomposites left in the circulating blood could be ignored.
In vivo PA Imaging of Carotid Artery Thrombosis of Varying Severity
It has been proven that FeCl3 activates platelets and clotting factors in the coagulation system. Activated platelets release hormones such as adenosine diphosphate and thromboxane A2, which further recruit more platelets to aggregate and form a platelet plug. FeCl3 also damages vascular endothelial cells, causing them to lose their normal anticoagulant function and further promoting thrombosis. In this process, fibrinogen is converted into fibrin, which produces a network of cross-linked fibrin, further enhancing the strength of the platelet embolus.49 Compared with high-fat diet-induced atherosclerosis methods,50 the induction of carotid atherosclerosis with FeCl3 is not only easy to shape. It has a high success rate but also a low cost. Small pieces of filter paper (0.5×1 mm) contain a smaller range of FeCl3 solution, which might lead to localized thrombus. The larger filter paper (2×2 mm) could cover the whole blood vessel so that FeCl3 can be well infiltrated into both ends of the blood vessel, causing a thrombus to seriously affect blood circulation and lead to blood vessel occlusion. We found that the carotid artery of mice was infiltrated with FeCl3-saturated filter paper of different sizes, and reticular thrombosis of different sizes was formed as shown in Figure S6.
The representative PA imaging of a healthy mouse after the injection of Se@PPy nanocomposites as shown in Figure 8A and B. In two mouse models with different degrees of thrombotic lesions, before and after Se@PPy nanocomposites injection as displayed in Figure 8C–F, respectively. The mouse in the control group showed a limited fluctuation of the PA signal. However, no improved PA signal evident with the same arteries after the probe was injected was detected. It can be observed that the PA signal was strengthened after injection of Se@PPy nanocomposites in a segment of arteries in two thrombotic lesion mouse models (partial and entire), which meant there was thrombus plaque in these areas. The PA signal was enhanced by 3.44, 4.04, and 5.07 times for three arteries with different degrees of thrombotic lesions in the in vivo PA imaging experiment as displayed in Figure 8G. Based on the above results, it is proved that this molding method is feasible. Furthermore, we analyzed the data and found that the nanocomposite can convey specific information regarding thrombus through PA signal values. Notably, the signal intensity correlates directly with the severity of the thrombus. Through quantitative data analysis, it can be found that in the case of the partial thrombus model, the PA imaging system cannot effectively detect the information of thrombus. However, after the injection of Se@PPy nanocomposites, it can be found that there is a difference (p < 0.05). The PA imaging system can be directly detected when the thrombus develops seriously. Moreover, the precise location and size of the thrombus could be seen through the image information after the injection of Se@PPy nanocomposites, and the photoacoustic signals before and after injection were statistically different from those in the control group (p < 0.01). These conclusions prove that the combination of Se@PPy nanocomposites and PA imaging system can effectively detect the degree of thrombus lesion.
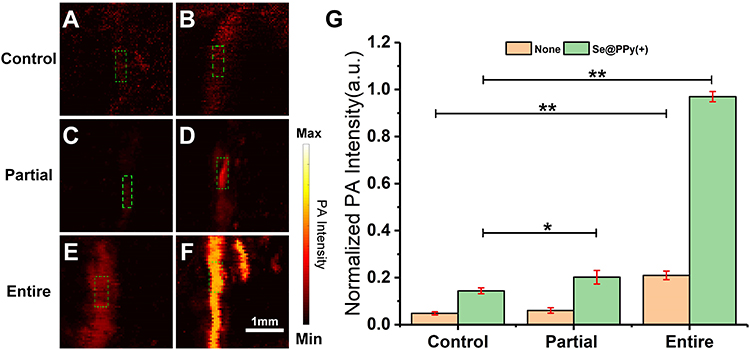 |
Figure 8 (A and B) PA images of blood vessels in normal mice and following injection of Se@PPy nanocomposites, respectively. (C and D) PA contrast images of the partial thrombus before and after injecting Se@PPy nanocomposites. (E and F) PA contrast images of the entire thrombus before and after injection of Se@PPy nanocomposites. The scale bar represents 1 mm. (G) Quantified PA signal enhancement from (A–F). Data are shown as mean ±SD. *P < 0.05; **P < 0.01. |
PA tomography for detecting carotid artery thrombus relies on the magnitude of the PA signal generated in a hemoglobin solution.43 When hemoglobin concentration is low or ischemia occurs, the absorption of light decreases, leading to potential overlap between the thrombus signal and hemoglobin signal, which lowers the accuracy of evaluating the location and size of the thrombus. In contrast, this study used selenium nanomaterials to exploit their excellent penetration properties. The enrichment process in nascent thrombi was very similar to that in tumors, and the results demonstrated that selenium nanomaterials positively enhanced the signal of thrombi in the PA images. This extends the clinical application of selenium nanomaterials from tumor therapy to thrombus detection. It will also enhance the potential of photoacoustic imaging for thrombus detection.
Although Se@PPy nanocomposites have no specificity, they could gather at the thrombus site. We guessed that the reticular structure of thrombosis would intercept Se@PPy nanocomposites, and then the size and position of the thrombus could be displayed through the PA imaging system. Simply injecting Se@PPy nanocomposites may play a poor role. However, with the formation of a thrombus, Se@PPy nanocomposites can build up in the thrombus area, thereby enhancing the PA signal in the area where the thrombus is located. A comparison of partial and overall thrombus showed that Se@PPy nanocomposites could significantly enhance the PA signatures of thrombus. Carotid artery thrombosis requires timely diagnosis and treatment.51 Our research proves that PA imaging could precisely localize the location and size of the thrombus, which could help physicians diagnose the severity of carotid artery thrombosis, assisting with vascular interventional thrombectomy or surgical thrombectomy, etc.52
Conclusion
In summary, our research has proven the feasibility of the PA imaging system and Se@PPy nanocomposites for detecting carotid artery thrombus in vivo and its ability to diagnose thrombus severity.
Acknowledgment
This study is funded by the National Key R&D Program of China (2022YFC2304205), Guangzhou Science and Technology Plan Project (202102020140), and Guangdong Basic and Applied Basic Research Foundation (2020A1515011104).
Disclosure
The authors report no conflicts of interest in this work.
References
1. Timmis A, Vardas P, Townsend N, et al. European Society of Cardiology: cardiovascular disease statistics 2021: executive summary. Eur Heart J Qual Care Clin Outcomes. 2022;8(4):377–382. doi:10.1093/ehjqcco/qcac014
2. Virani SS, Alonso A, Benjamin EJ, et al. Heart disease and stroke statistics-2020 update: a report from the American Heart Association. Circulation. 2020;141(9):e139–e596. doi:10.1161/cir.0000000000000757
3. Iskander-Rizk S, Visscher M, Moerman AM, et al. Micro Spectroscopic Photoacoustic (μsPA) imaging of advanced carotid atherosclerosis. Photoacoustics. 2021;22:100261. doi:10.1016/j.pacs.2021.100261
4. Bays HE, Kulkarni A, German C, et al. Ten things to know about ten cardiovascular disease risk factors - 2022. Am J Prev Cardiol. 2022;10:100342. doi:10.1016/j.ajpc.2022.100342
5. Camm AJ, Lip GY, De Caterina R, et al. 2012 focused update of the ESC Guidelines for the management of atrial fibrillation: an update of the 2010 ESC guidelines for the management of atrial fibrillation. Developed with the special contribution of the European Heart Rhythm Association. Eur Heart J. 2012;33(21):2719–2747. doi:10.1093/eurheartj/ehs253
6. Adams HP
7. Uk-i JM, Young V, Gillard JH. Carotid-artery imaging in the diagnosis and management of patients at risk of stroke. Lancet Neurol. 2009;8(6):569–580. doi:10.1016/s1474-4422(09)70092-4
8. Hetterich H, Willner M, Habbel C, et al. X-ray phase-contrast computed tomography of human coronary arteries. Invest Radiol. 2015;50(10):686–694. doi:10.1097/rli.0000000000000169
9. Majmudar MD, Yoo J, Keliher EJ, et al. Polymeric nanoparticle PET/MR imaging allows macrophage detection in atherosclerotic plaques. Circ Res. 2013;112(5):755–761. doi:10.1161/circresaha.111.300576
10. Dweck MR, Aikawa E, Newby DE, et al. Noninvasive molecular imaging of disease activity in atherosclerosis. Circ Res. 2016;119(2):330–340. doi:10.1161/circresaha.116.307971
11. Jiang K, Ferguson CM, Woollard JR, Zhu X, Lerman LO. Magnetization transfer magnetic resonance imaging noninvasively detects renal fibrosis in swine atherosclerotic renal artery stenosis at 3.0 T. Invest Radiol. 2017;52(11):686–692. doi:10.1097/rli.0000000000000390
12. Park S-J, Ho CJH, Arai S, Samanta A, Olivo M, Chang Y-T. Visualizing Alzheimer’s disease mouse brain with multispectral optoacoustic tomography using a fluorescent probe, CDnir7. Sci Rep. 2019;9(1):12052. doi:10.1038/s41598-019-48329-4
13. Ntziachristos V. Fluorescence molecular imaging. Annu Rev Biomed Eng. 2006;8(1):1–33. doi:10.1146/annurev.bioeng.8.061505.095831
14. Verjans JW, Osborn EA, Ughi GJ, et al. Targeted near-infrared fluorescence imaging of atherosclerosis. JACC Cardiovasc Imaging. 2016;9(9):1087–1095. doi:10.1016/j.jcmg.2016.01.034
15. Wang Y, Chen J, Yang B, et al. In vivo MR and fluorescence dual-modality imaging of atherosclerosis characteristics in mice using profilin-1 targeted magnetic nanoparticles. Theranostics. 2016;6(2):272–286. doi:10.7150/thno.13350
16. Ntziachristos V, Bremer C, Weissleder R. Fluorescence imaging with near-infrared light: new technological advances that enable in vivo molecular imaging. Eur Radiol. 2003;13(1):195–208. doi:10.1007/s00330-002-1524-x
17. Kaufmann BA, Sanders JM, Davis C, et al. Molecular imaging of inflammation in atherosclerosis with targeted ultrasound detection of vascular cell adhesion molecule-1. Circulation. 2007;116(3):276–284. doi:10.1161/circulationaha.106.684738
18. Moccetti F, Weinkauf CC, Davidson BP, et al. Ultrasound molecular imaging of atherosclerosis using small-peptide targeting ligands against endothelial markers of inflammation and oxidative stress. Ultrasound Med Biol. 2018;44(6):1155–1163. doi:10.1016/j.ultrasmedbio.2018.01.001
19. Perera RH, Hernandez C, Zhou H, Kota P, Burke A, Exner AA. Ultrasound imaging beyond the vasculature with new generation contrast agents. Wiley Interdiscip Rev Nanomed Nanobiotechnol. 2015;7(4):593–608. doi:10.1002/wnan.1326
20. Wang S, Hossack JA, Klibanov AL. Targeting of microbubbles: contrast agents for ultrasound molecular imaging. J Drug Target. 2018;26(5–6):420–434. doi:10.1080/1061186x.2017.1419362
21. Zlitni A, Gambhir SS. Molecular imaging agents for ultrasound. Curr Opin Chem Biol. 2018;45:113–120. doi:10.1016/j.cbpa.2018.03.017
22. Klibanov AL. Ultrasound contrast: gas microbubbles in the vasculature. Invest Radiol. 2021;56(1):50–61. doi:10.1097/rli.0000000000000733
23. Wang LV, Hu S. Photoacoustic tomography: in vivo imaging from organelles to organs. Science. 2012;335(6075):1458–1462. doi:10.1126/science.1216210
24. Wang Z, Upputuri K, Zhen X, et al. pH-sensitive and biodegradable charge-transfer nanocomplex for second near-infrared photoacoustic tumor imaging. Nano Res. 2019;12:49–55. doi:10.1007/s12274-018-2175-9
25. Liu Y, Nie L, Chen X. Photoacoustic molecular imaging: from multiscale biomedical applications towards early-stage theranostics. Trends Biotechnol. 2016;34(5):420–433. doi:10.1016/j.tibtech.2016.02.001
26. Kruizinga P, van der Steen AF, de Jong N, et al. Photoacoustic imaging of carotid artery atherosclerosis. J Biomed Opt. 2014;19(11):110504. doi:10.1117/1.Jbo.19.11.110504
27. Merčep E, Deán-Ben XL, Razansky D. Imaging of blood flow and oxygen state with a multi-segment optoacoustic ultrasound array. Photoacoustics. 2018;10:48–53. doi:10.1016/j.pacs.2018.04.002
28. Sethuraman S, Aglyamov SR, Amirian JH, Smalling RW, Emelianov SY. Intravascular photoacoustic imaging using an IVUS imaging catheter. IEEE Trans Ultrason Ferroelectr Freq Control. 2007;54(5):978–986. doi:10.1109/tuffc.2007.343
29. Wang B, Su JL, Karpiouk AB, Sokolov KV, Smalling RW, Emelianov SY. Intravascular Photoacoustic Imaging. IEEE J Quantum Electron. 2010;16(3):588–599. doi:10.1109/jstqe.2009.2037023
30. Rosenthal A, Jaffer FA, Ntziachristos V. Intravascular multispectral optoacoustic tomography of atherosclerosis: prospects and challenges. Imaging Med. 2012;4(3):299–310. doi:10.2217/iim.12.20
31. Wu M, Springeling G, Lovrak M, et al. Real-time volumetric lipid imaging in vivo by intravascular photoacoustics at 20 frames per second. Biomed Opt Express. 2017;8(2):943–953. doi:10.1364/boe.8.000943
32. Leadley RJ
33. Smirnov AV, Kucheryavenko AF, Spasov AA. Antithrombotic activity of a new benzimidazole derivative in the thrombosis model in mice. Bull Exp Biol Med. 2014;157(5):580–582. doi:10.1007/s10517-014-2620-z
34. Libby P, Lichtman AH, Hansson GK. Immune effector mechanisms implicated in atherosclerosis: from mice to humans. Immunity. 2013;38(6):1092–1104. doi:10.1016/j.immuni.2013.06.009
35. Whinna HC. Overview of murine thrombosis models. Thromb Res. 2008;122:S64–S69. doi:10.1016/S0049-3848(08)70022-7
36. Denis CV, Wagner DD. Platelet adhesion receptors and their ligands in mouse models of thrombosis. Arterioscler Thromb Vasc Biol. 2007;27(4):728–739. doi:10.1161/01.Atv.0000259359.52265.62
37. Sachs UJ, Nieswandt B. In vivo thrombus formation in murine models. Circ Res. 2007;100(7):979–991. doi:10.1161/01.RES.0000261936.85776.5f
38. Westrick RJ, Winn ME, Eitzman DT. Murine models of vascular thrombosis (Eitzman series). Arterioscler Thromb Vasc Biol. 2007;27(10):2079–2093. doi:10.1161/atvbaha.107.142810
39. Ghosh A, Li W, Febbraio M, et al. Platelet CD36 mediates interactions with endothelial cell-derived microparticles and contributes to thrombosis in mice. J Clin Invest. 2008;118(5):1934–1943. doi:10.1172/jci34904
40. Li W, McIntyre TM, Silverstein RL. Ferric chloride-induced murine carotid arterial injury: a model of redox pathology. Redox Biol. 2013;1(1):50–55. doi:10.1016/j.redox.2012.11.001
41. Johnson JL, Merrilees M, Shragge J, van Wijk K. All-optical extravascular laser-ultrasound and photoacoustic imaging of calcified atherosclerotic plaque in excised carotid artery. Photoacoustics. 2018;9:62–72. doi:10.1016/j.pacs.2018.01.002
42. Dima A, Ntziachristos V. Non-invasive carotid imaging using optoacoustic tomography. Opt Express. 2012;20(22):25044–25057. doi:10.1364/oe.20.025044
43. Li B, Fu C, Ma G, Fan Q, Yao Y. Photoacoustic imaging: a novel tool for detecting carotid artery thrombosis in mice. J Vasc Res. 2017;54(4):217–225. doi:10.1159/000477631
44. Xie Z, Yang Y, He Y, et al. In vivo assessment of inflammation in carotid atherosclerosis by noninvasive photoacoustic imaging. Theranostics. 2020;10(10):4694–4704. doi:10.7150/thno.41211
45. Zhang J, Qiu T, Lan Y, et al. Autocatalytic polymerization of selenium/polypyrrole nanocomposites as functional theranostic agents for multi-spectral photoacoustic imaging and photothermal therapy of tumor. Mater Today Chem. 2020;17:100344. doi:10.1016/j.mtchem.2020.100344.
46. Chen S, Xing C, Huang D, et al. Eradication of tumor growth by delivering novel photothermal selenium-coated tellurium nanoheterojunctions. Sci Adv. 2020;6(15):eaay6825. doi:10.1126/sciadv.aay6825
47. Fang X, Li C, Zheng L, Yang F, Chen T. Dual-targeted selenium nanoparticles for synergistic photothermal therapy and chemotherapy of tumors. Chem Asian J. 2018;13(8):996–1004. doi:10.1002/asia.201800048
48. Shah PK. Screening asymptomatic subjects for subclinical atherosclerosis: can we, does it matter, and should we? J Am Coll Cardiol. 2010;56(2):98–105. doi:10.1016/j.jacc.2009.09.081
49. Shim Y, Kwon I, Park Y, et al. Characterization of ferric chloride-induced arterial thrombosis model of mice and the role of red blood cells in thrombosis acceleration. Yonsei Med J. 2021;62(11):1032–1041. doi:10.3349/ymj.2021.62.11.1032
50. Yu L, Liu H, Ma X, Seshadri VD, Gao X. Anti-atherosclerotic effects of myrtenal in high-fat diet-induced atherosclerosis in rats. Appl Biochem Biotechnol. 2022;194(12):5717–5733. doi:10.1007/s12010-022-04044-x
51. Afsharfard A, Gholizadeh B, Abdolalian Y, Hosseini SM. Carotid free-floating thrombus causing stroke in a young woman with lupus anticoagulant: a case report and review of the literature. Int J Surg Case Rep. 2017;33:35–37. doi:10.1016/j.ijscr.2017.01.067
52. Cheng SF, Brown MM. Contemporary medical therapies of atherosclerotic carotid artery disease. Semin Vasc Surg. 2017;30(1):8–16. doi:10.1053/j.semvascsurg.2017.04.005
 © 2023 The Author(s). This work is published and licensed by Dove Medical Press Limited. The full terms of this license are available at https://www.dovepress.com/terms.php and incorporate the Creative Commons Attribution - Non Commercial (unported, v3.0) License.
By accessing the work you hereby accept the Terms. Non-commercial uses of the work are permitted without any further permission from Dove Medical Press Limited, provided the work is properly attributed. For permission for commercial use of this work, please see paragraphs 4.2 and 5 of our Terms.
© 2023 The Author(s). This work is published and licensed by Dove Medical Press Limited. The full terms of this license are available at https://www.dovepress.com/terms.php and incorporate the Creative Commons Attribution - Non Commercial (unported, v3.0) License.
By accessing the work you hereby accept the Terms. Non-commercial uses of the work are permitted without any further permission from Dove Medical Press Limited, provided the work is properly attributed. For permission for commercial use of this work, please see paragraphs 4.2 and 5 of our Terms.