Back to Journals » Journal of Hepatocellular Carcinoma » Volume 9
Hepatocellular Carcinoma Risk Prediction in the NIH-AARP Diet and Health Study Cohort: A Machine Learning Approach
Authors Thomas J, Liao LM, Sinha R, Patel T ![]() , Antwi SO
, Antwi SO ![]()
Received 30 September 2021
Accepted for publication 21 December 2021
Published 15 February 2022 Volume 2022:9 Pages 69—81
DOI https://doi.org/10.2147/JHC.S341045
Checked for plagiarism Yes
Review by Single anonymous peer review
Peer reviewer comments 2
Editor who approved publication: Dr Ahmed Kaseb
Jonathan Thomas,1 Linda M Liao,2 Rashmi Sinha,2 Tushar Patel,1,* Samuel O Antwi3,*
1Department of Transplantation, Mayo Clinic, Jacksonville, FL, USA; 2Division of Cancer Epidemiology and Genetics, The National Cancer Institute, Bethesda, MD, USA; 3Department of Quantitative Health Sciences, Mayo Clinic, Jacksonville, FL, USA
*These authors contributed equally to this work
Correspondence: Samuel O Antwi, Department of Quantitative Health Sciences, Mayo Clinic, 4500 San Pablo Road South, Vincent Stabile Building 756N, Jacksonville, FL, 32224, USA, Tel +1-904-953-0310, Fax +1-904-953-1447, Email [email protected]
Background: Prediction of hepatocellular carcinoma (HCC) development in persons with known risk factors remain a challenge and is an urgent unmet need, considering projected increases in HCC incidence and mortality in the US. We aimed to use machine learning techniques to identify a set of demographic, lifestyle, and health history information that can be used simultaneously for population-level HCC risk prediction.
Methods: Data from 377,065 participants of the NIH-AARP Diet and Health Study, among whom 647 developed HCC over 16 years of follow-up, were analyzed. The sample was randomly divided into independent training (60%) and validation (40%) sets. We evaluated 123 participant characteristics and tested 15 different machine learning algorithms for robustness in predicting HCC risk. Separately, we evaluated variables selected from multivariable logistic regression for risk prediction.
Results: The random under-sampling boosting (RUSBoost) algorithm performed best during model testing. Fourteen participant characteristics were selected for risk prediction based on differences between cases and controls (Bonferroni-corrected p-values < 0.0004) and from the most frequently used variables in the initial two decision trees of the RUSBoost learner trees. A predictive model based on the 14 variables had an AUC of 0.72 (sensitivity=0.68, specificity=0.63) and independent validation AUC of 0.65 (sensitivity=0.68, specificity=0.63). A subset of 9 variables identified through logistic regression also had an AUC of 0.72 (sensitivity=0.67, specificity=0.63) and independent validation AUC of 0.65 (sensitivity=0.70, specificity=0.61).
Conclusion: Population-level HCC risk prediction can be performed with a machine learning-based algorithm and could inform strategies for improving HCC risk reduction in at-risk groups.
Keywords: HCC, hepatocellular carcinoma, liver cancer, machine learning, risk prediction
Introduction
Incidence of hepatocellular carcinoma (HCC), the most common form of primary liver cancer, has been increasing in the US over the past several decades1 and is projected to continue to increase up to 2030.2 The rising incidence of HCC partly accounts for the projected increases in mortality from primary liver cancers,3 of which HCC constitute 75–80%.4 The major risk factors of HCC include male sex, hepatitis B and C virus (HBV and HCV) infections, excessive alcohol intake, cigarette smoking, diabetes, obesity, metabolic syndrome, nonalcoholic fatty liver disease (NAFLD), and rare genetic disorders, such as hemochromatosis, Wilson’s disease, and glycogen storage disease.5,6 Despite these well-established risk factors of HCC, accurate prediction of HCC development in persons with these risk factors remain a challenge, even among individuals with liver cirrhosis resulting from exposure to some of these risk factors.7,8 Indeed, HCC risk prediction is an important yet unmet societal need, considering the expected increases in HCC incidence and mortality.2,3
Enhanced primary prevention efforts are necessary for addressing the increasing incidence of HCC and could be informed by population-level risk prediction models designed to predict the development of HCC in apparently healthy individuals in the general population. Based on individuals’ risk profile, targeted education and counseling programs designed to enhance risk-reducing behaviors in at-risk groups could help halt the increasing incidence of HCC. Like clinical prediction models designed for early detection of HCC (secondary prevention), population-level risk models designed to predict HCC development in healthy individuals (primary prevention) could be based on demographic factors, lifestyle, dietary habits, and health history. However, few population-level risk models have been developed for various diseases.9–11 To our knowledge, no such model exist for HCC prediction in the general US population.
On the contrary, many clinical prediction models have been developed for early detection of HCC in various patient subgroups.8,12–17 These clinical models typically incorporate between three to six selected variables based on prior knowledge or expert decision, resulting in different input variables, including different combinations of age, sex, HBV/HCV, diabetes, and blood levels of α-fetoprotein (AFP), alanine aminotransferase (ALT), platelets, albumin, etc. Examples include the ADRESS-HCC risk model developed among cirrhotic patients on liver transplantation waiting list8 and several models developed for Asian patients with chronic HBV, including the REACH-B scoring algorithm,12 the Chinese University HCC (CU-HCC) risk prediction score,15 the GAG-HCC risk score,16 and the Nomograms 1 and 2 HCC risk models (NGM1-HCC and NGM2-HCC).17 Additionally, the PAGE-B HCC risk prediction score was developed among individuals of European descent with chronic HBV undergoing treatment with oral antivirals,13 while the Toronto HCC risk index was developed among patients with cirrhosis of different etiologies.14 However, none of these models is widely accepted yet for routine clinical use. Moreover, data used for model development were universally limited by small numbers of HCC cases and the models were often based on homogeneous patient subgroups (eg, cirrhotic patients, HBV patients, etc.). Importantly, US population-level HCC risk prediction models are lacking.
In the health care and health sciences fields, machine learning—a component of artificial intelligence that lies at the intersection of computer science and statistics—utilizes data-driven and matrix algebra methods, such as feature selection, principal component analysis, canonical correlations, and single objective optimization to enhance prediction of disease risk, treatment response, and health outcomes.18–20 At the core of machine learning is the use of computerized algorithms to train a model to analyze high-dimensional data in an unbiased and novel manner.21 Generally, machine learning can be considered as a search through various candidate computerized algorithms to identify an algorithm with the most optimal performance metric for a given task.18,19 A wide array of machine learning algorithms has been developed across different fields, including commerce, science, and health care.18–21
In this study, we aimed to develop and validate a machine learning-based HCC risk prediction model in a prospective cohort of general US population participants to enhance education and counseling about risk-modifying behaviors and inform clinical decisions on HCC surveillance. Our overall goal was to determine, in an unbiased manner, a refined list of variables that can be used simultaneously to predict HCC risk in the general US population. To maximize model performance, we included several lifestyle factors, including dietary and physical activity variables. We also performed subgroup analyses for more tailored risk prediction based on participant characteristics, such as age, sex, diabetes status, and history of alcohol intake.
Materials and Methods
Study Population
Data from the NIH-AARP Diet and Health Study, a prospective cohort study designed to investigate associations between dietary and lifestyle factors and cancer risk, were used.22 Briefly, between 1995 and 1996, men and women of the ages 50 to 71 years who were AARP members and resided in six US states (California, Florida, Louisiana, New Jersey, North Carolina, and Pennsylvania) or two metropolitan areas (Atlanta, Georgia and Detroit, Michigan) were recruited through mailed questionnaires. Out of 3.5 million mailed questionnaires, 566,398 completed questionnaires were returned.22 For the present study, we excluded participants whose questionnaires were completed by proxy respondents (n=15,760), those with prevalent cancer (n=51,346), and those who reported extreme levels of energy intake (defined as energy intake values exceeding two sex-specific inter-quartile range amounts, n=4432). We adopted a case-control design for risk prediction; hence, we further excluded participants who developed cancers other than HCC (n=117,795). These exclusions left a final analytic sample of 377,065 participants (women, n=161,207; men n=215,858) (Supplementary Figure 1). The NIH-AARP Diet and Health Study was approved by the Special Studies Institutional Review Board (IRB) of the National Cancer Institute (NCI). All participants gave written informed consent. Additional institutional approval was obtained from the Mayo Clinic IRB. Both IRBs conform to the ethical principles set forth in the Helsinki Declaration of 1975 (revised in 2013) and are compliant with the requirements of the US Food and Drug Administration (FDA) regulations 21 CFR Parts 50 and 56 and the US Department of Health and Human Services (HHS) regulations 45 CFR 46, which are guided by the Belmont Report. All participants included in this study had previously provided written informed consent.
Identification of HCC Cases and Cancer-Free Controls
New HCC cases developing over the study period (1995–2011) were identified by linking the study participants’ list to data from state cancer registries in the eight catchment areas and three additional states where the participants tended to relocate (Texas, Arizona, and Nevada). Case ascertainment for the NIH-AARP Diet and Health Study is about 90% complete.23 In the present study, we identified incident HCC cases occurring over the follow-up period using the International Classification of Diseases in Oncology, Third Edition (ICD-0–3) topographic code C22.0 and morphology codes 8170 to 8175.24,25
Risk Factor Ascertainment and Diet Assessment
At baseline, participants completed risk factor questionnaires that solicited various information, including demographics (age, sex, race/ethnicity), anthropometric measures, personal and family health history, and lifestyle factors that included smoking history, physical activity, and alcohol use. Self-reported anthropometric data were used to calculate body mass index (BMI) as weight in kilograms divided by height in meters-squared (kg/m2). Full details of diet assessment in the NIH-AARP Diet and Health Study has been published.26 In brief, dietary intakes were assessed at baseline using a self-administered 124-item food-frequency questionnaire (FFQ)—an earlier version of the NCI’s Diet History Questionnaire. The FFQ asked participants to report their usual portion sizes and frequency of intake over that past 12 months.26,27 The FFQ was calibrated and validated based on two non-consecutive 24-hour dietary recalls among a sample of the NIH-AARP study participants.27 Responses to the questionnaire were linked to a nutrient database maintained by the US Department of Agriculture to derive nutrient intake values for each participant.
Predictor Variable Selection, and Machine Learning-Based Model Training and Validation
Data received from the NIH-AARP Diet and Health Study had 123 predictor variables that included 5 demographic variables, 99 dietary variables, and 19 health and lifestyle information. To select the most informative variables, we first compared variables distribution between cases and controls by calculating fold-change values and testing for statistical differences using Students’ t-tests for continuous variables and χ2 tests for categorical variables. Distributions of 85 variables were found to be significantly different between the cases and controls (p < 0.05). We then applied Bonferroni-corrected significance threshold (p = 0.05/123 = 0.0004) and narrowed the variable list to 51. We further excluded duplicate variables. For example, alcohol was measured as both drinks/day and grams/day, and for such instances, we retained the variable with both the largest fold-change value and lowest p-value, leaving 47 variables for further evaluation.
Supervised machine learning classification was performed in MATLAB 2019b (MathWorks, Natick, MA) using the classification learner tool. We assessed 15 different machine learning algorithms that can accommodate both numerical and categorical variables for risk prediction. Before building the classification model, 60% of the study data were randomly selected for training with 5-fold cross validation. The remaining 40% of data was used as the independent validation sample. Model performance metrics, including area under the receiver operating curve (AUC), sensitivity and specificity, were used to assess predictive abilities of the models. During independent validation, true patient classes were compared to the exported model’s prediction to generate a confusion matrix and we calculated the model performance metrics using the JMP Pro statistical analysis software v14.1.0 (SAS Institute, Cary, NC, USA). Highly informative variables were identified from the top-performing predictive model. We then performed univariate and multivariable logistic regression analyses to calculate odds ratios (ORs) and 95% confidence intervals (CIs) and reduced the variable list to statistically significant variables only. In the logistic regression model, HCC was modeled as outcome and the highly informative variables were modeled first independently and then simultaneously as predictors. Further, we compared distribution of the informative variables between cases and controls using means for continuous variables and proportions for categorical variables. The logistic regression analyses and descriptive statistics were performed with SAS version 9.4 (SAS Institute, Cary, NC). A two-sided p-value < 0.05 was considered statistically significant.
The variables found to be statistically significant in the multivariable model were used as the base model for machine learning-based predictions. We further performed stratified analysis of the base model to determine its ability to predict HCC in subgroups defined by age (< 65, ≥65 years), sex, race (White, other), BMI (≤ 24.9, 25–30, >30 kg/m2), diabetes (yes, no), alcohol use (none, < 20 g/d, ≥20 g/d), and self-reported general health status (excellent/very good, good, fair/poor). Additionally, subgroup-specific machine learning-based models were trained and validated using distinct sets of data created based on age (< 65, ≥65 years), sex, diabetes (yes, no), and alcohol use (none, < 20 g/d, ≥20 g/d). This latter list of variables was chosen based on prior knowledge of their strong association with HCC risk. Sample sizes used for the training and validation analyses for the base model, stratified models, and subgroup-specific models are provided in Supplementary Table 1.
Results
We analyzed data from the NIH-AARP Diet and Health Study cohort after excluding proxy respondents, prevalent cancer cases, participants with extreme levels of energy intake, and those who developed cancers other than HCC (Supplementary Figure 1). The final analytic sample comprised 377,065 participants, among whom 647 developed HCC across 16 years of follow-up (1995–2011). The remaining 376,418 cancer-free participants were used as controls. The study data was divided randomly into training (60%, n=226,239) and validation (40%, n=150,826) sets.
After evaluating 15 different machine learning algorithms, we found that the random under-sampling boosting (RUSBoost) classification method performed best each time during testing and was adopted (Supplementary Table 2). The RUSBoost algorithm is particularly useful in studies where there are substantial differences in comparison group sizes, as it typically under-sample participants in the much larger sized group (eg, controls) to match the number of participants in the smaller sized group (eg, cases).28–30 The RUSBoosted ensemble model was set to use 30 weak learner trees with a maximum of 20 branches to comprise the overall strong learner model. We examined the composition of the 30 decision trees to identify the most frequently used variables in the initial two decision tree layers across the entire ensemble learner model and found that 14 predictors were used most frequently in the first three nodes (the first branch and the subsequent two branches). Collectively, the 14 variables were identified through a systematic process of selecting variables based on differences in their distribution between cases and controls, applying Bonferroni significance threshold, and using the RUSBoosted model to select the most frequently used variables in the initial two decision tree layers across the entire ensemble learner. A schema of the variable selection process is presented in Figure 1.
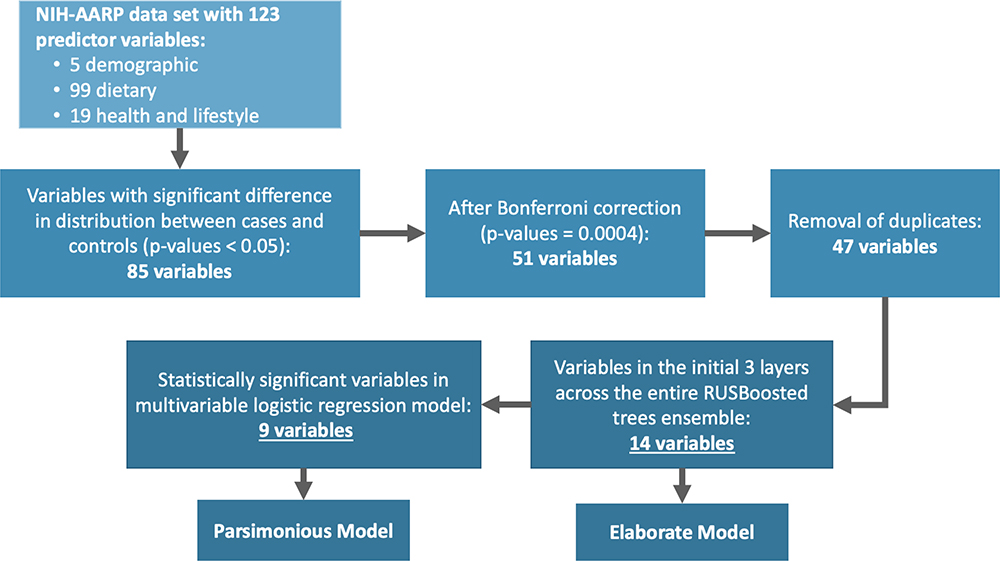 |
Figure 1 Variable selection for model development and validation. Abbreviations: NIH-AARP, National Institutes of Health and formerly the American Association of Retired Persons; RUSBooted, random under-sampling boosting machine learning classification. |
The list of 14 variables selected for model building are shown in Supplementary Table 3, and their distributions between cases and controls are shown in Table 1. In brief, the cases were approximately two years older than controls, and the cases included greater proportions men, obese (BMI ≥30 kg/m2) participants, and individuals with personal history of diabetes than controls. Cases were also more likely to report fair or poor health condition, more likely to drink 20 or more grams of alcohol per day, less likely to engage in moderate-to-vigorous physical activity three or more times a week, and had lower Healthy Eating Index scores31 compared to controls (Table 1).
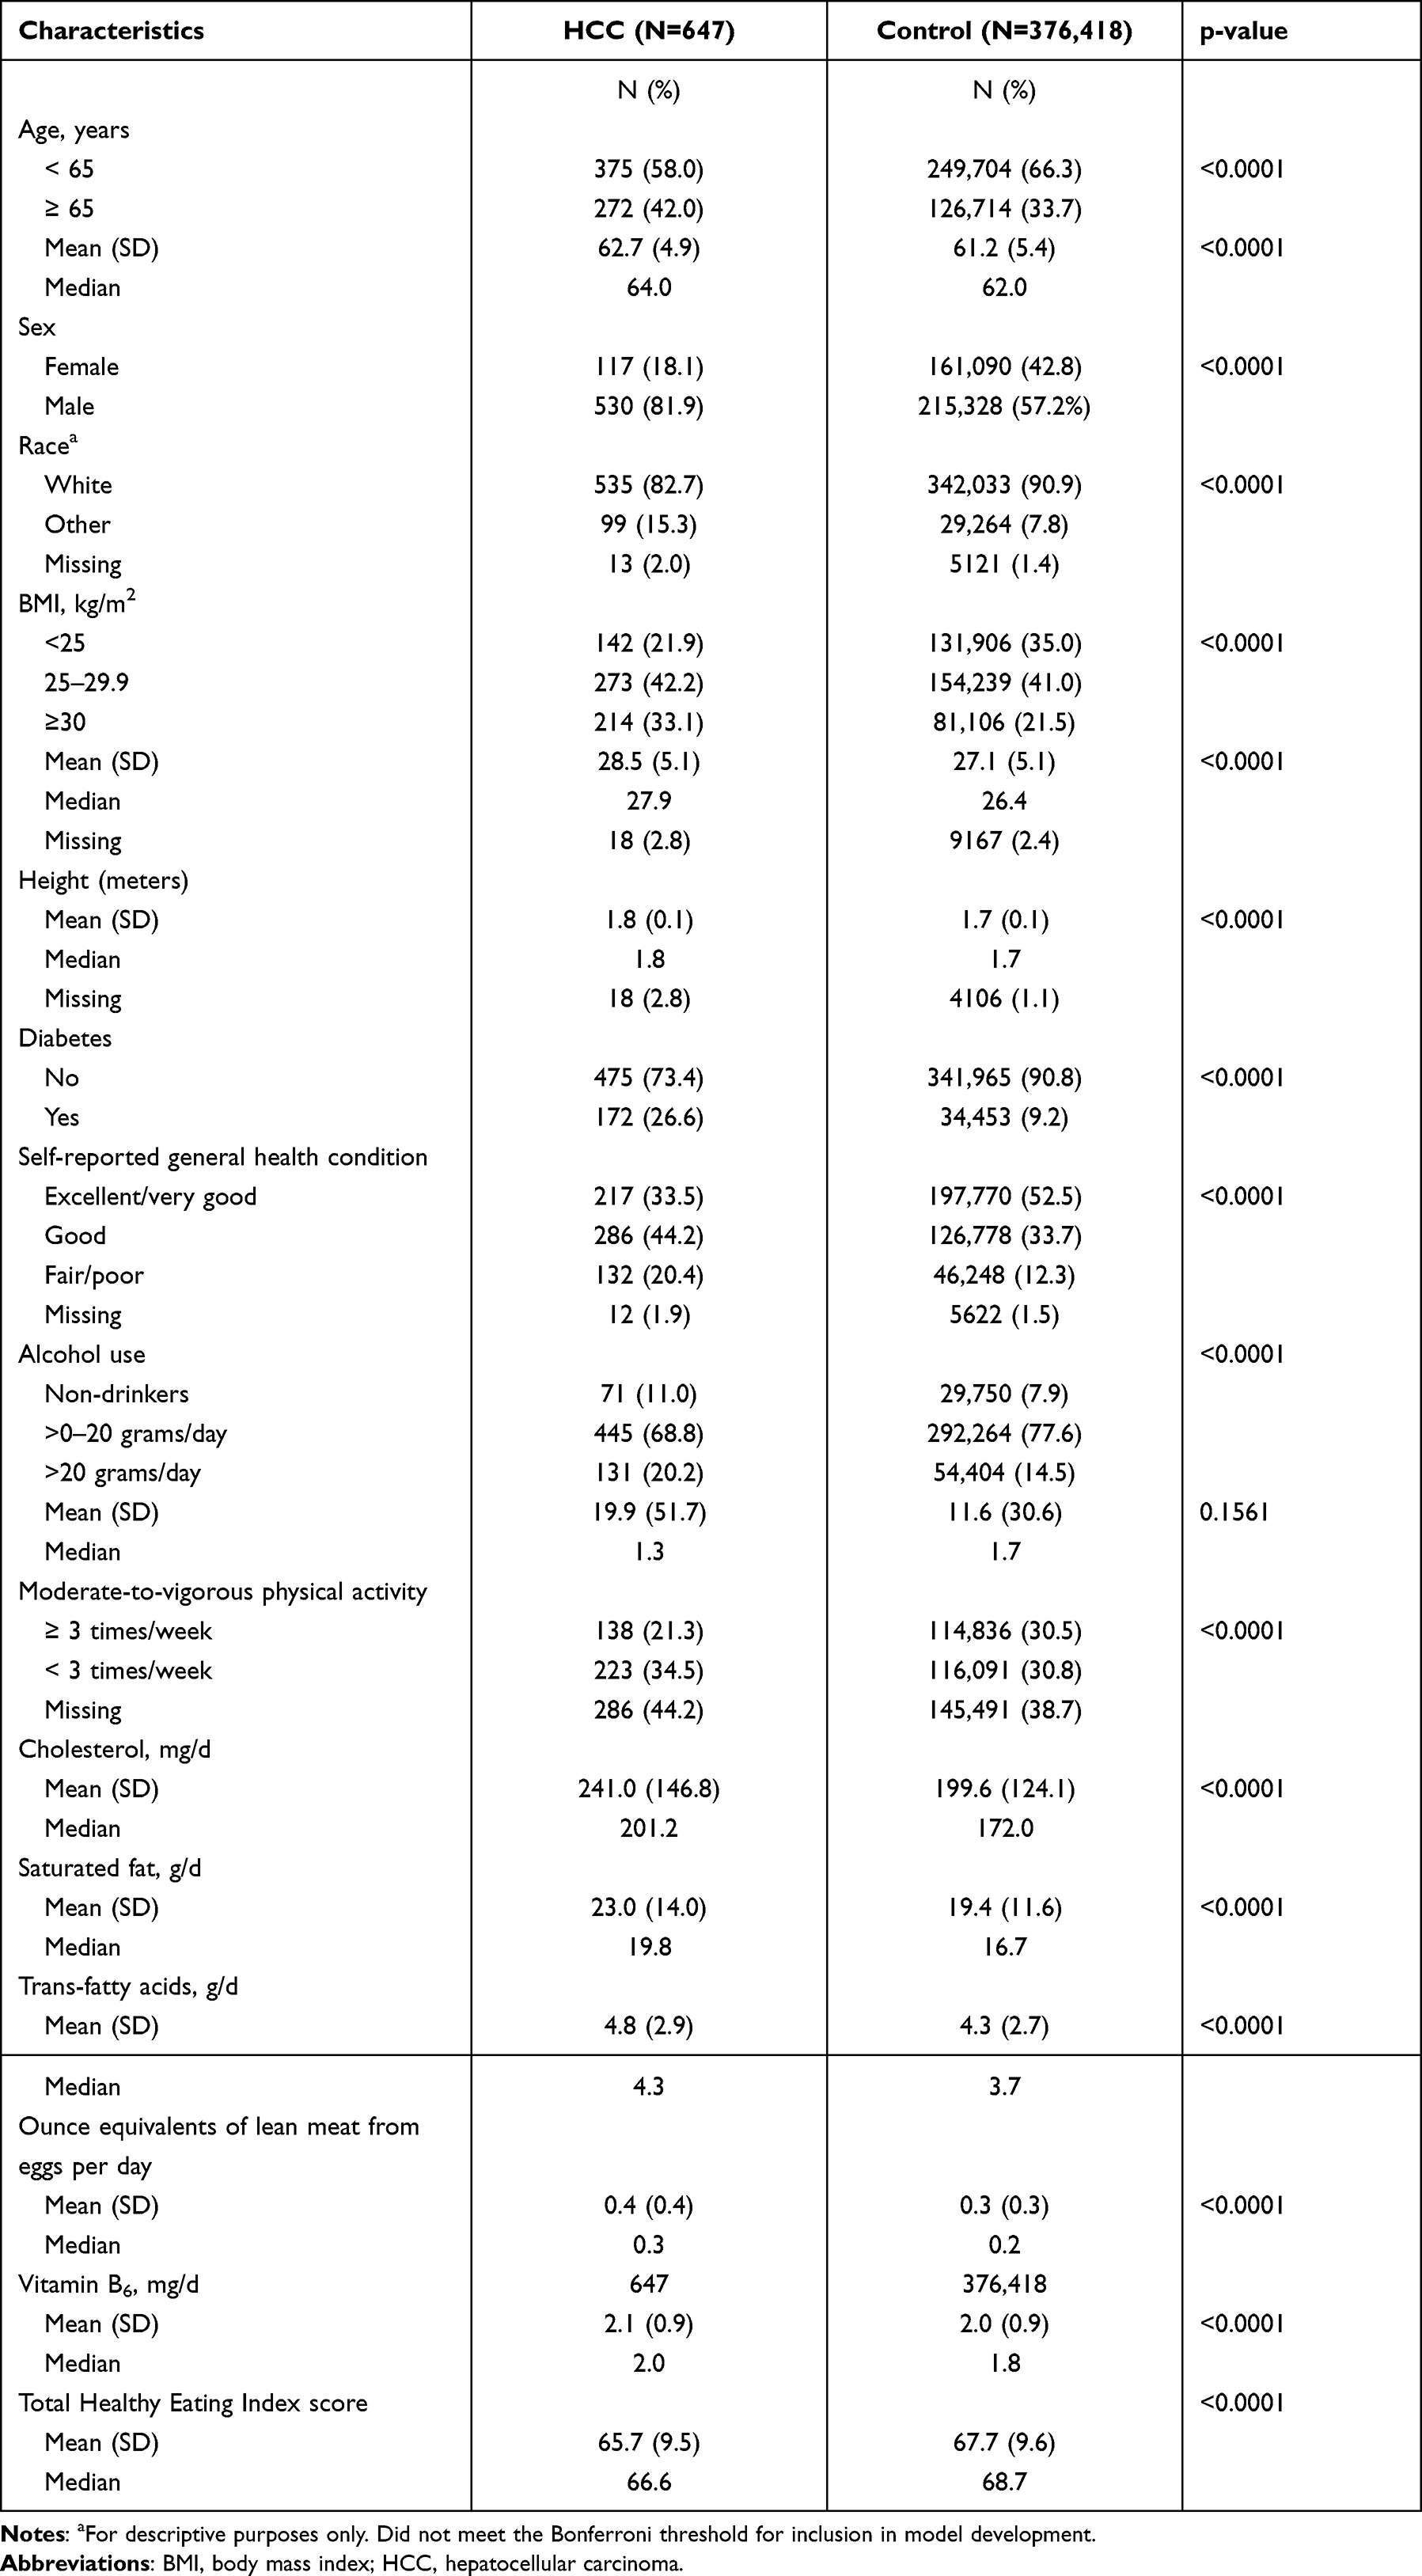 |
Table 1 Descriptive Characteristics of Study Participants; the NIH-AARP Diet and Health Study, N=377,065 (1995–1996, with Follow-Up to 2011) |
Further, we performed multivariable logistic regression analyses to reduce the 14-variable list to statistically significant variables only, by modeling all 14 variables simultaneously as predictors. Nine variables were found to be significantly associated with HCC risk in the multivariable logistic regression model (Table 2). The nine variables are age, sex, BMI, diabetes, self-reported general health condition, moderate-to-vigorous physical activity, alcohol use, ounce equivalents of lean meat from eggs/day, and the Health Eating Index 2015. We used these 9 variables to build a separate prediction model to compare with a model built with the more elaborate list of 14 variables.
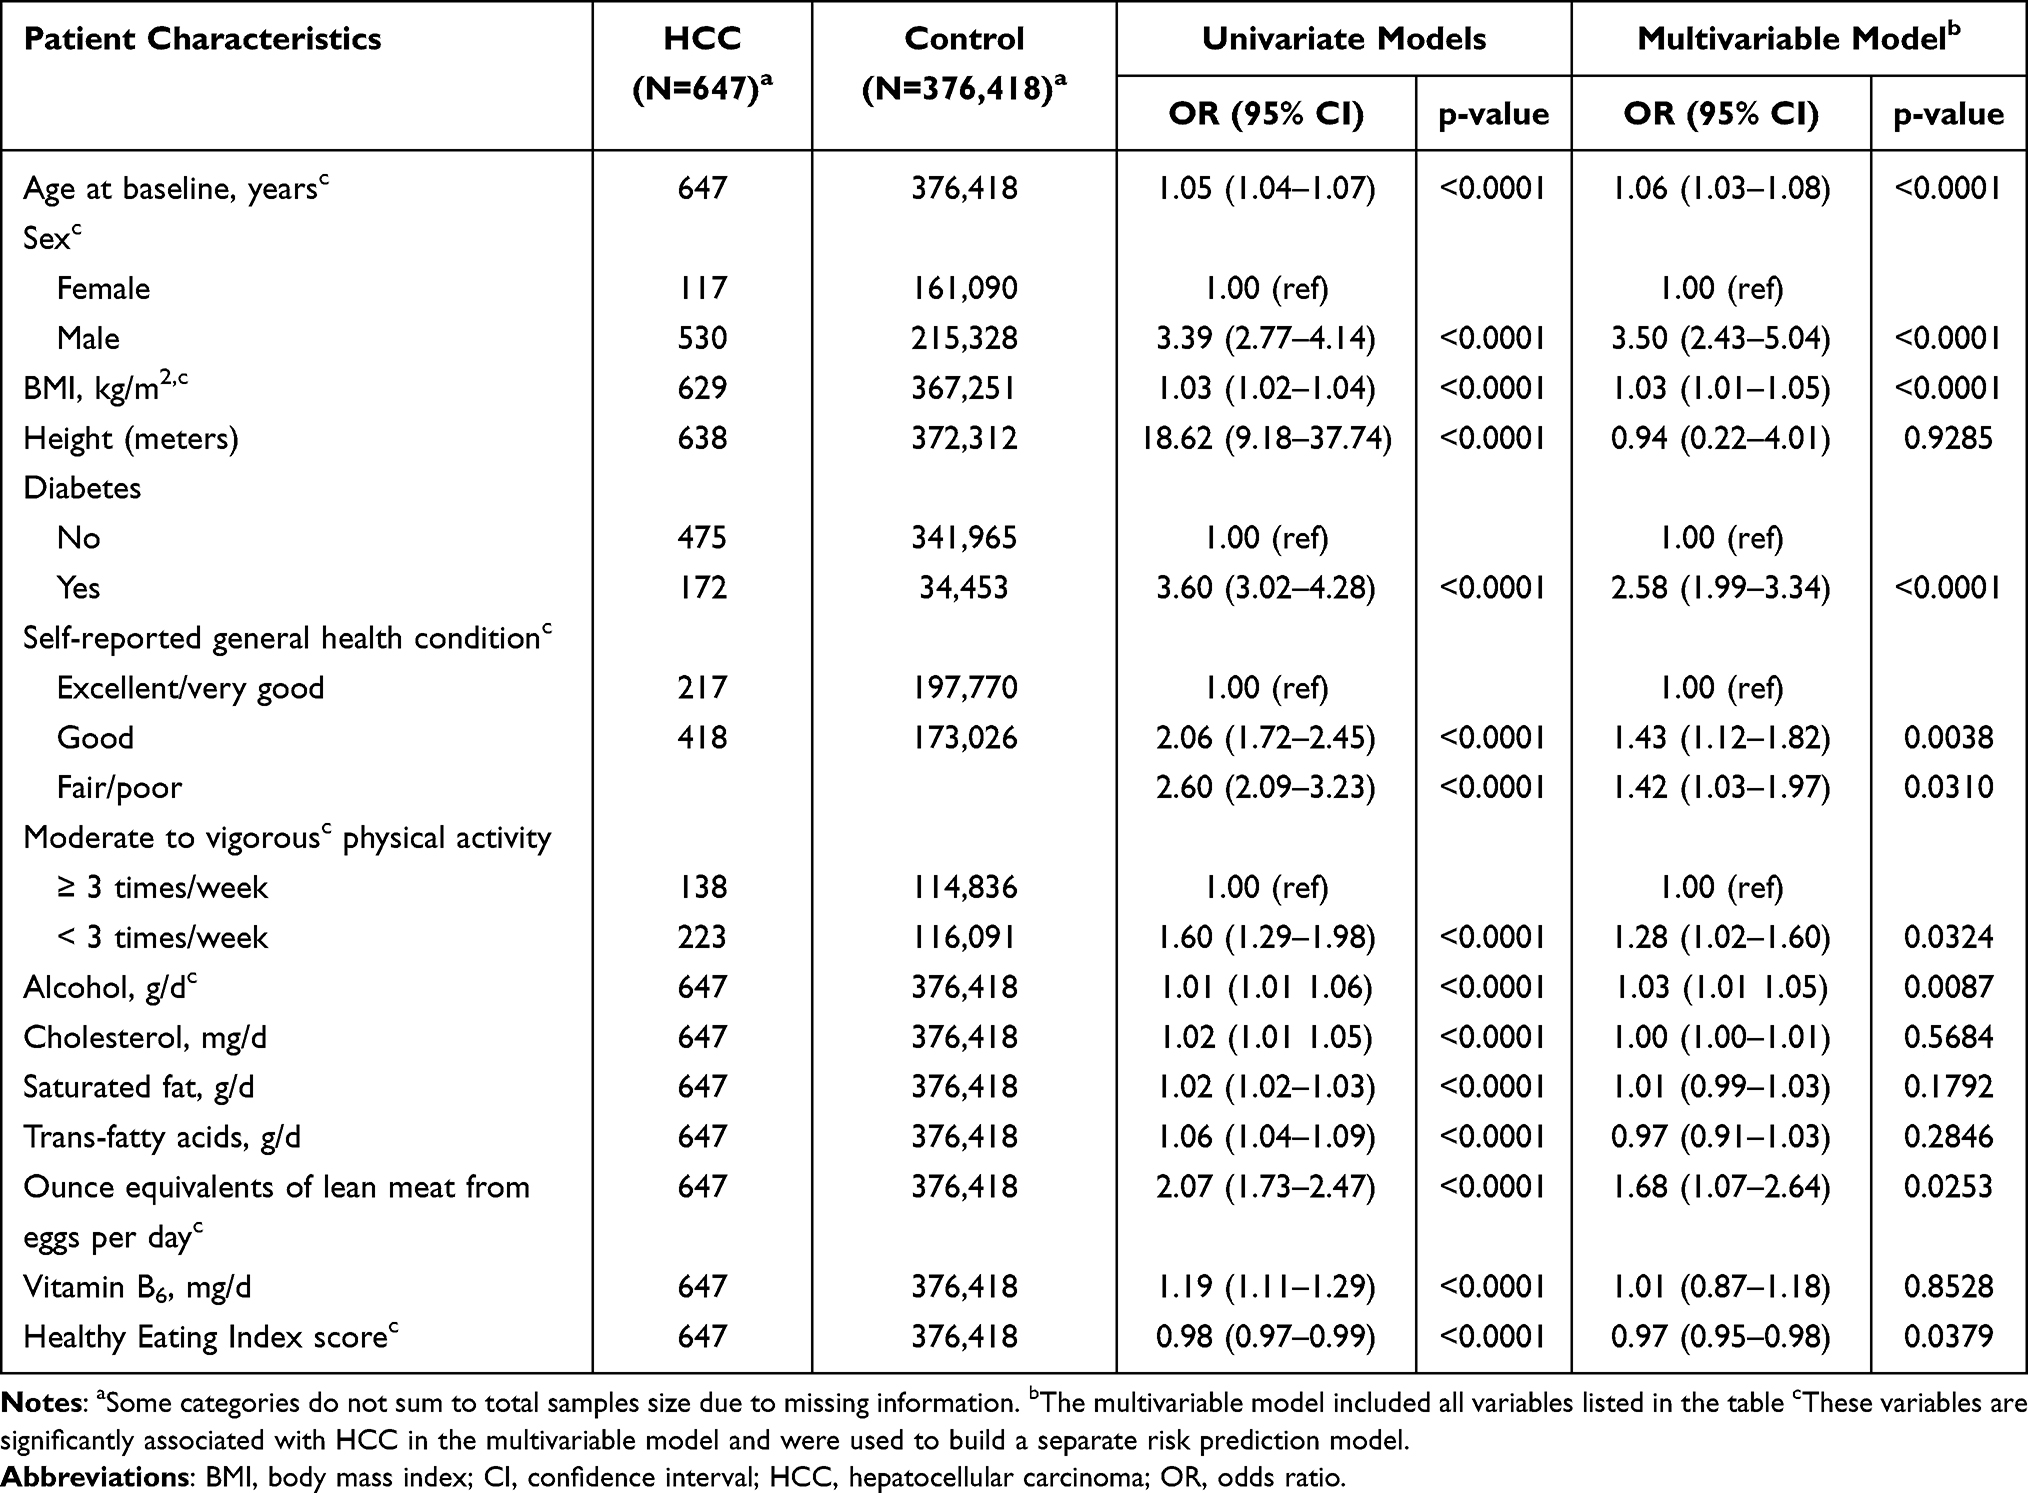 |
Table 2 Associations Between Selected Participant Characteristics and Hepatocellular Carcinoma Risk (N=377,065); the NIH-AARP Diet and Health Study (1995–1996, with Follow-Up to 2011) |
HCC risk prediction with the RUSBoosted trees model based on the 14-variable list (elaborate base model) achieved an AUC of 0.72 (sensitivity = 0.68, specificity = 0.63) in the training sample with 5-fold cross validation (Figure 2A). In an independent validation sample, AUC for the elaborate base model was 0.65 (sensitivity = 0.68, specificity = 0.63) (Figure 2A). A similar RUSBoosted tree analysis was performed using the 9 variables (parsimonious base model) selected from the multivariable logistic regression model and achieved an AUC of 0.72 (sensitivity = 0.67, specificity = 0.63) in the training sample with 5-fold cross validation (Figure 2B). AUC from the independent validation sample for the parsimonious base model was 0.65 (sensitivity = 0.70, specificity = 0.61) (Figure 2B). Because results from the parsimonious base model and the elaborate base model are nearly identical, but the parsimonious base model uses five fewer variables, we performed the remaining analyses with the parsimonious 9-variable list.
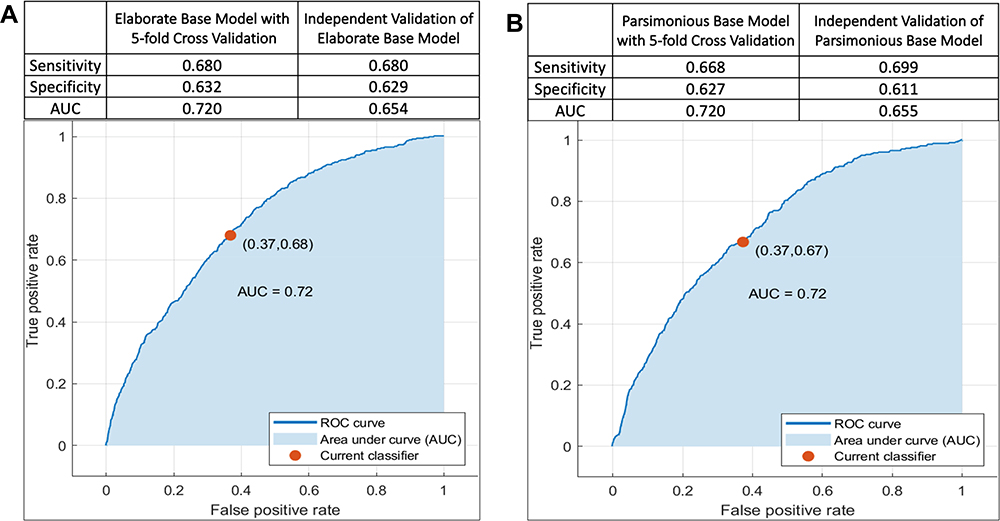 |
Figure 2 Area under the receiver operating characteristic curve (AUC-ROC) for prediction of hepatocellular carcinoma risk among participants of the NIH-AARP Diet and Health Study prospective cohort. A total of 377,065 participants (cases: n=647, controls, n=376,418) were included in the analysis, among whom 226,239 were used for training (cases: 388, controls: 225,851) and 150,826 participants were used for independent validation (cases: n=259, control: n=150,567). (A) (Elaborate Base Model) was based on 14 variables: age (continuous), sex, BMI (continuous), height (continuous) diabetes (yes, no), general health status (excellent/very good, good, fair/poor), alcohol (continuous), moderate-to-vigorous physical activity (< 3 times/week, ≥3 times/week), dietary cholesterol (continuous), saturated fat (continuous), trans-fatty acids (continuous), ounce equivalents of lean meat from eggs per day (continuous), dietary vitamin B6 (mg/d, continuous), and healthy eating index scores (continuous). (B) (Parsimonious Base Model) was based on 9 of the above variables: age, sex, BMI, diabetes, general health status, alcohol, moderate-to-vigorous physical activity, ounce equivalents of lean meat from eggs per day, and healthy eating index scores. |
The performance of the parsimonious RUSBoosted trees base model in predicting HCC risk was evaluated in analyses stratified by age, sex, race, BMI, diabetes, alcohol intake, and general health status. Figure 3 shows results of the stratified models from the independent validation sample. Performance of the parsimonious base model was roughly similar in participants younger than 65 years (AUC = 0.64, sensitivity = 0.63, specificity = 0.66) and those 65 years or older (AUC = 0.65, sensitivity = 0.79, specificity = 0.52). However, we observed an overall better model performance in men (AUC = 0.60, sensitivity = 0.85, specificity = 0.34) than women (AUC = 0.51, sensitivity = 0.06, specificity = 0.97). Performance of the parsimonious base model did not differ substantially between Whites and non-Whites, but it performed slightly better overall in participants with BMI < 25 kg/m2 (AUC = 0.69, sensitivity = 0.64, specificity = 0.74) than those with BMI 25–29.9 kg/m2 (AUC = 0.65, sensitivity = 0.75, specificity = 0.56) or BMI ≥30 kg/m2 (AUC = 0.58, sensitivity = 0.68, specificity = 0.49). Additionally, the parsimonious base model performed slightly better in non-diabetics (AUC = 0.65, sensitivity = 0.66, specificity = 0.64) than diabetics (AUC = 0.56, sensitivity = 0.79, specificity = 0.33). Similar modest differences were noted by alcohol use and self-reported general health status (Figure 3 and Supplementary Table 4).
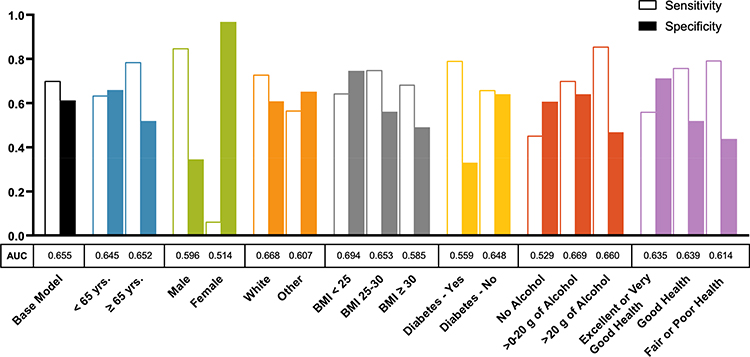 |
Figure 3 Performance of the parsimonious base model for hepatocellular carcinoma risk prediction across population subgroups defined by age, gender, race, body mass index (BMI), diabetes, alcohol intake, and self-reported general health condition among participants in the NIH-AARP Diet and Health Study prospective cohort (N= 377,065; cases: 647, controls=376,418). The parsimonious base model was built based on the following variables then stratified by the patient characteristics: age (continuous), sex, BMI (continuous), diabetes (yes, no), general health status (excellent/very good, good, fair/poor), alcohol (continuous), moderate-to-vigorous physical activity (< 3 times/week, ≥3 times/week), ounce equivalents of lean meat from eggs per day (continuous), and healthy eating index scores (continuous). |
In addition to the base models, individual models were developed separately using distinct sets of data created based on age, sex, diabetes status, and alcohol intake and each was developed using the parsimonious variable list with 60/40 data split proportions for training and validation, respectively. Results for the validation samples for these individual models are shown in Figure 4. HCC risk prediction was slightly better in the model developed for participants younger than 65 years of age (AUC = 0.68, sensitivity = 0.69, specificity = 0.66) than the model developed for those 65 years or older (AUC = 0.61, sensitivity = 0.62, specificity = 0.61). However, HCC risk prediction was similar for the models developed separately for males (AUC = 0.60, sensitivity = 0.55, specificity = 0.64) and females (AUC = 0.61, sensitivity = 0.55, specificity = 0.67). The model for non-diabetics was better in predicting HCC risk (AUC = 0.64, sensitivity = 0.67, specificity = 0.60) than the model developed for diabetics (AUC = 0.54, sensitivity = 0.48, specificity = 0.60). Additionally, the model developed for non-drinkers was less robust in predicting HCC risk (AUC = 0.55, sensitivity = 0.50, specificity = 0.60) than the model developed for those who consume < 20 g/day of alcohol (AUC = 0.66, sensitivity = 0.70, specificity = 0.63) or ≥20 g/day (AUC = 0.61, sensitivity = 0.60, specificity = 0.63) (Figure 4 and Supplementary Table 5). Similar results were obtained when we used the elaborate variable list to build the models (Supplementary Figures 2 and 3).
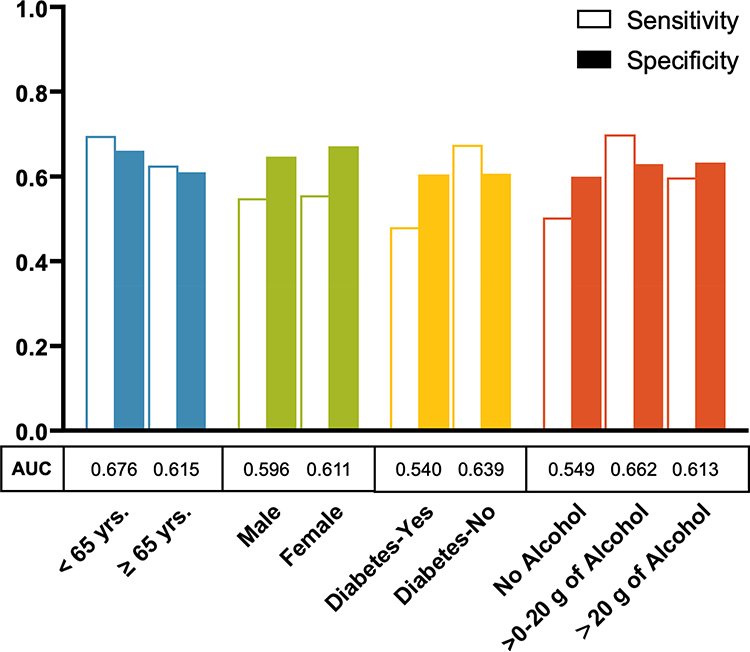 |
Figure 4 Hepatocellular carcinoma risk prediction models developed separately by age, gender, diabetes status, and alcohol intake among participants in the NIH-AARP Diet and Health Study prospective cohort. Each model was built separately based on the following 9 variables (the parsimonious model variables): age (continuous), sex, BMI (continuous), diabetes (yes, no), general health status (excellent/very good, good, fair/poor), alcohol (continuous), moderate-to-vigorous physical activity (< 3 times/week, ≥3 times/week), ounce equivalents of lean meat from eggs per day (continuous), and healthy eating index scores (continuous). |
Discussion
In this study, we used an unbiased machine-learning approach to predict HCC risk among individuals from the general US population based on demographic, lifestyle, and health history data obtained from the NIH-AARP Diet and Health Study. An ensemble of RUSBoosted decision trees machine learning model was used for risk prediction, and we identified a set of 14 variables through a systematic process to build the prediction model with a subset of 9 variables also identified through logistic regression for model building. We found that the two sets of variables had similar performance, with each achieving AUC of 0.72 in the training sample and AUC of 0.65 in the independent validation sample. It is worth noting that the AUCs obtained from our base models are similar to that obtained from another prospective population-based study in pancreatic cancer (AUC=0.62).32 We also developed distinct RUSBoosted trees models for subgroups defined by age, sex, diabetes, and alcohol use, and these models too had reasonable predictions for HCC. Because of the increasing incidence of HCC, use of computer aided techniques for prediction of HCC development among individuals in the general population could be useful for population-based risk assessment and could inform primary prevention strategies through targeted education and counseling about risk-modifying behaviors based on individuals’ risk profile.
Previous HCC models were developed primarily for secondary prevention among patients with chronic liver disease,8,12–17,33 as opposed to enhancing primary prevention strategies. It is important to emphasize two unique aspects of the models developed in this study, the present models were developed among individuals from the general population who were apparently healthy at the time of enrollment and the models were designed to provide insights to improve primary prevention of HCC. By contrast, the existing HCC models were developed in homogenous patients with underlying chronic liver disease and intended for early detection of HCC. For instance, the REACH-B,12 CU-HCC,15 GAG-HCC,16 NGM1 and NGM2,17 and the PAGE-B13 HCC prediction models were all developed for early detection of HCC among patients with chronic HBV infection, whereas the ADRESS-HCC model8 and the Toronto HCC risk index14 were developed for HCC detection in patients with liver cirrhosis. Additionally, most of the existing HCC models were developed among Asian patients,12,15–17,33 with few developed among White patients.8,13,14 Because our population-based machine learning models used routinely collected information that are easier to obtain (eg, through questionnaires) and to analyze than those obtained from clinical care (eg, imaging scans and laboratory tests), it could be easily adopted by others and improved cumulatively with data from a variety of sources for application in different populations.
In general, HCC risk varies by age, sex, BMI, diabetes, alcohol intake, and other patient characteristics.5,34,35 Hence, we performed stratified analyses of the parsimonious base model by participant characteristics. We additionally developed and validated distinct models based on participant characteristics for more tailored risk predictions. Results from the stratified analysis of the parsimonious base model showed varied HCC predictions across population subgroups, with better predictions in participants with certain characteristics (eg, age < 65 years, self-reported BMI < 25 kg/m2, and non-diabetics) than others (eg, females and individuals with diabetes). However, there were generally better HCC predictions with less variability across subgroups when distinct models were developed for each subgroup. This suggests that developing separate machine learning models may be more appropriate for subgroup-specific risk predictions at the population level.
Importantly, this study shows that HCC risk prediction can be performed using numerical data at the population level where clinical variables, such as laboratory test results and imaging scans may not be available. The parsimonious version of the model had 9 predictors and the elaborate version had 14 predictors; however, HCC predictions were similar with the two sets of variables. Because the parsimonious version requires fewer input variables, it is less computationally intensive, more user-friendly, and may be more easily adoptable. The elaborate model may be advantageous in situations where sample sizes are small. It is also important to emphasize that the models developed in this study were not designed to predict risk at the individual level, which could be achieved by including additional information, such as biological variables (eg, genetic risk variants), laboratory test results (eg, AFP, ATL, platelets, HBV, and HCV status), and hepatic imaging scans.
Our study has several strengths and limitations. The strengths include the systematic process of variable selection and the uniquely large sample size with sufficient data for model training with 5-fold cross-validation and an additional sample set for independent validation. However, while we had a large sample size, most (91%) participants were White, precluding development of separate models for individual minority groups, particularly Hispanics and African Americans who tend to have higher risk for HCC. Because the study was performed among individuals of age 50 to 71 years with 16 years of prospective follow-up, generalizability of findings is limited to persons of age 50 years or older. Additionally, the risk prediction metrics obtained from this study are generally lower than those typically obtained from clinical studies. However, our base models performed slightly better than another population-based risk prediction model developed for pancreatic cancer (AUC=0.62), despite the inclusion of genetic risk variants and circulating biomarkers in that pancreatic cancer risk model.32 As opposed to clinic-based studies that tend to use patients with underlying chronic liver disease for model development with the intention of early detection of HCC, the models developed in this study were based mostly on modifiable risk factors to enhance primary prevention in at-risk groups. Furthermore, most of the predictor variables were derived from self-report (eg, diet, physical activity, and BMI), as opposed to objective measurements, but the data used in this study were collected at baseline when none of the participants had cancer and therefore less prone to recall bias. We did not have data on HBV or HCV status, genetic risk factors, cirrhosis, or liver fibrosis stage, which could have improved predictions. The lack of data on viral hepatitis, cirrhosis status, and liver fibrosis stage in the NIH Diet and Health study cohort may have significantly limited the risk prediction ability of the models since patients with these conditions tend to have higher risk for HCC development. Verification of our findings in cohorts with available data on viral hepatitis and underlying liver disease is therefore recommended. Nonetheless, our study was designed to utilize routinely collected epidemiological variables, which are less costly and readily available in large population-based data.
Conclusion
Our study shows that population-level prediction of HCC risk can be performed with a machine learning-based algorithm using demographic, lifestyle, and health history information, which are routinely collected in population-based studies and are more readily available than clinical variables. The models developed in this study have potential applications for enhancing education and counseling about risk-reducing behaviors in healthy community-based individuals to help mitigate the rising incidence of HCC. We developed and validated the models in a single population-based cohort. Hence, external validation could support its applicability in different populations.
Abbreviations
AFP, Alpha-fetoprotein; ALT, Alanine aminotransferase; AUC, Area under the receiver operator curve; BMI, Body mass index; CI, Confidence interval; FFQ, Food-frequency questionnaire; HBV, Hepatitis B virus; HCC, Hepatocellular carcinoma; HCV, Hepatitis C virus; NAFLD, Nonalcoholic fatty liver disease; NGM, Nomogram; NIH-AARP, National Institutes of Health and formerly the American Association of Retired Persons; OR, Odds ratio; RUSBoost, Random under-sampling boosting machine learning classification method.
Disclaimer
The content is solely the responsibility of the authors and does not necessarily represent the official views of the NIH.
Data Sharing Statement
The study data can be made available to researchers upon request to and approval by the NIH-AARP Diet and Health Cohort Study. For instructions on how to apply for data, please visit https://www.nihaarpstars.com/.
Ethical Approval
The NIH-AARP study was approved by the National Cancer Institute’s Special Studies Institutional Review Board (IRB). Additional approval was obtained from the Mayo Clinic IRB. Both IRBs conform to the ethical principles set forth in the Helsinki Declaration of 1975 (revised in 2013) and are compliant with the requirements of the US Food and Drug Administration (FDA) regulations 21 CFR Parts 50 and 56 and the US Department of Health and Human Services (HHS) regulations 45 CFR 46, which are guided by the Belmont Report. All participants included in this study had previously provided written informed consent.
Funding
NIH/NCI, Grant/Award Number: K01 CA237875 (S.O. Antwi).
Disclosure
The authors declare no potential conflicts of interest in this work.
References
1. American Cancer Society. Cancer Facts & Figures 2020. Atlanta: American Cancer Society; 2020.
2. Petrick JL, Kelly SP, Altekruse SF, McGlynn KA, Rosenberg PS. Future of hepatocellular carcinoma incidence in the United States forecast through 2030. J Clin Oncol. 2016;34(15):1787–1794. doi:10.1200/jco.2015.64.7412
3. Rahib L, Wehner MR, Matrisian LM, Nead KT. Estimated projection of US cancer incidence and death to 2040. JAMA Netw Open. 2021;4(4):e214708. doi:10.1001/jamanetworkopen.2021.4708
4. Satriano L, Lewinska M, Rodrigues PM, Banales JM, Andersen JB. Metabolic rearrangements in primary liver cancers: cause and consequences. Nat Rev Gastroenterol Hepatol. 2019;16(12):748–766. doi:10.1038/s41575-019-0217-8
5. El-Serag HB, Kanwal F. Epidemiology of hepatocellular carcinoma in the United States: where are we? Where do we go? Hepatology. 2014;60(5):1767–1775. doi:10.1002/hep.27222
6. Makarova-Rusher OV, Altekruse SF, McNeel TS, et al. Population attributable fractions of risk factors for hepatocellular carcinoma in the United States. Cancer. 2016;122(11):1757–1765. doi:10.1002/cncr.29971
7. Ioannou GN, Tang W, Beste LA, et al. Assessment of a deep learning model to predict hepatocellular carcinoma in patients with Hepatitis C Cirrhosis. JAMA Netw Open. 2020;3(9):e2015626. doi:10.1001/jamanetworkopen.2020.15626
8. Flemming JA, Yang JD, Vittinghoff E, Kim WR, Terrault NA. Risk prediction of hepatocellular carcinoma in patients with cirrhosis: the ADRESS-HCC risk model. Cancer. 2014;120(22):3485–3493. doi:10.1002/cncr.28832
9. Ng R, Sutradhar R, Kornas K, et al. Development and validation of the Chronic Disease Population Risk Tool (CDPoRT) to predict incidence of adult chronic disease. JAMA Netw Open. 2020;3(6):e204669. doi:10.1001/jamanetworkopen.2020.4669
10. Rosella LC, Bornbaum C, Kornas K, et al. Evaluating the process and outcomes of a knowledge translation approach to supporting use of the Diabetes Population Risk Tool (DPoRT) in public health practice. Can J Program Eval. 2018;33(1). doi:10.3138/cjpe.31160
11. Rosella LC, Manuel DG, Burchill C, Stukel TA. A population-based risk algorithm for the development of diabetes: development and validation of the Diabetes Population Risk Tool (DPoRT). J Epidemiol Community Health. 2011;65(7):613–620. doi:10.1136/jech.2009.102244
12. Yang HI, Yuen MF, Chan HL, et al. Risk estimation for hepatocellular carcinoma in chronic hepatitis B (REACH-B): development and validation of a predictive score. Lancet Oncol. 2011;12(6):568–574. doi:10.1016/s1470-2045(11)70077-8
13. Papatheodoridis G, Dalekos G, Sypsa V, et al. PAGE-B predicts the risk of developing hepatocellular carcinoma in Caucasians with chronic hepatitis B on 5-year antiviral therapy. J Hepatol. 2016;64(4):800–806. doi:10.1016/j.jhep.2015.11.035
14. Sharma SA, Kowgier M, Hansen BE, et al. Toronto HCC risk index: a validated scoring system to predict 10-year risk of HCC in patients with cirrhosis. J Hepatol. 2017. doi:10.1016/j.jhep.2017.07.033
15. Wong VW-S, Chan SL, Mo F, et al. Clinical scoring system to predict hepatocellular carcinoma in chronic Hepatitis B carriers. J Clin Oncol. 2010;28(10):1660–1665. doi:10.1200/jco.2009.26.2675
16. Yuen MF, Tanaka Y, Fong DY, et al. Independent risk factors and predictive score for the development of hepatocellular carcinoma in chronic hepatitis B. J Hepatol. 2009;50(1):80–88. doi:10.1016/j.jhep.2008.07.023
17. Yang H-I, Sherman M, Su J, et al. Nomograms for risk of hepatocellular carcinoma in patients with chronic Hepatitis B virus infection. J Clin Oncol. 2010;28(14):2437–2444. doi:10.1200/jco.2009.27.4456
18. Goodfellow I, Bengio Y, Courville A. Machine learning basics. Deep Learning. 2016;1(7):98–164.
19. Alpaydin E. Introduction to Machine Learning. MIT press; 2020.
20. Zhang X-D. Machine learning. In: A Matrix Algebra Approach to Artificial Intelligence. Springer; 2020:223–440.
21. Jordan MI, Mitchell TM. Machine learning: trends, perspectives, and prospects. Science. 2015;349(6245):255–260. doi:10.1126/science.aaa8415
22. Schatzkin A, Subar AF, Thompson FE, et al. Design and serendipity in establishing a large cohort with wide dietary intake distributions: the National Institutes of Health-American Association of Retired Persons Diet and Health Study. Am J Epidemiol. 2001;154(12):1119–1125. doi:10.1093/aje/154.12.1119
23. Michaud D, Midthune D, Hermansen S, et al. Comparison of cancer registry case ascertainment with SEER estimates and self-reporting in a subset of the NIH-AARP Diet and Health Study. J Registry Manag. 2005;32(2):70–75.
24. Antwi SO, Petrick JL, Campbell PT, et al. One-carbon metabolism-related micronutrients intake and risk for hepatocellular carcinoma: a prospective cohort study. Int J Cancer. 2020;147(8):2075–2090. doi:10.1002/ijc.33007
25. Persson EC, Schwartz LM, Park Y, et al. Alcohol consumption, folate intake, hepatocellular carcinoma, and liver disease mortality. Cancer Epidemiol Biomarkers Prev. 2013;22(3):415–421. doi:10.1158/1055-9965.Epi-12-1169
26. Subar AF, Midthune D, Kulldorff M, et al. Evaluation of alternative approaches to assign nutrient values to food groups in food frequency questionnaires. Am J Epidemiol. 2000;152(3):279–286. doi:10.1093/aje/152.3.279
27. Thompson FE, Kipnis V, Midthune D, et al. Performance of a food-frequency questionnaire in the US NIH-AARP (National Institutes of Health-American Association of Retired Persons) Diet and Health Study. Public Health Nutr. 2008;11(2):183–195. doi:10.1017/s1368980007000419
28. Seiffert C, Khoshgoftaar TM, Van Hulse J, Napolitano A RUSBoost: improving classification performance when training data is skewed.
29. Seiffert C, Khoshgoftaar TM, Van Hulse J, Napolitano A. RUSBoost: a hybrid approach to alleviating class imbalance. IEEE Trans Syst Man Cybern A. 2009;40(1):185–197. doi:10.1109/TSMCA.2009.2029559
30. Mounce S, Ellis K, Edwards J, Speight V, Jakomis N, Boxall J. Ensemble decision tree models using RUSBoost for estimating risk of iron failure in drinking water distribution systems. Water Resour Manag. 2017;31(5):1575–1589. doi:10.1007/s11269-017-1595-8
31. Reedy J, Lerman JL, Krebs-Smith SM, et al. Evaluation of the healthy eating index-2015. J Acad Nutr Diet. 2018;118(9):1622–1633. doi:10.1016/j.jand.2018.05.019
32. Kim J, Yuan C, Babic A, et al. Genetic and circulating biomarker data improve risk prediction for pancreatic cancer in the general population. Cancer Epidemiol Biomarkers Prev. 2020;29(5):999–1008. doi:10.1158/1055-9965.Epi-19-1389
33. Michikawa T, Inoue M, Sawada N, et al. Development of a prediction model for 10-year risk of hepatocellular carcinoma in middle-aged Japanese: the Japan Public Health Center-based Prospective Study Cohort II. Prev Med. 2012;55(2):137–143. doi:10.1016/j.ypmed.2012.05.017
34. Polesel J, Zucchetto A, Montella M, et al. The impact of obesity and diabetes mellitus on the risk of hepatocellular carcinoma. Ann Oncol. 2009;20(2):353–357. doi:10.1093/annonc/mdn565
35. Shen Y, Risch H, Lu L, et al. Risk factors for hepatocellular carcinoma (HCC) in the northeast of the United States: results of a case–control study. Cancer Causes Control. 2020;31(4):321–332. doi:10.1007/s10552-020-01277-1
 © 2022 The Author(s). This work is published and licensed by Dove Medical Press Limited. The
full terms of this license are available at https://www.dovepress.com/terms
and incorporate the Creative Commons Attribution
- Non Commercial (unported, 3.0) License.
By accessing the work you hereby accept the Terms. Non-commercial uses of the work are permitted
without any further permission from Dove Medical Press Limited, provided the work is properly
attributed. For permission for commercial use of this work, please see paragraphs 4.2 and 5 of our Terms.
© 2022 The Author(s). This work is published and licensed by Dove Medical Press Limited. The
full terms of this license are available at https://www.dovepress.com/terms
and incorporate the Creative Commons Attribution
- Non Commercial (unported, 3.0) License.
By accessing the work you hereby accept the Terms. Non-commercial uses of the work are permitted
without any further permission from Dove Medical Press Limited, provided the work is properly
attributed. For permission for commercial use of this work, please see paragraphs 4.2 and 5 of our Terms.