
Back to Journals » International Journal of General Medicine » Volume 18
Hemoglobin Mass and Blood Volume at Moderate Altitude: Establishing Lean-Body-Mass-Adjusted Reference Values for Clinical Use
Authors Alkhaldy HY  , Alqahtani MM, Al Amri MS, Alasmari YD, Alassiri YA, Algathradi M, Al Ghamdi BA, Almalki JY, Almalki MS, Assiri AM , Alshehri N, Abohassan H, Algarni AM
Received 14 September 2025
Accepted for publication 26 November 2025
Published 2 December 2025 Volume 2025:18 Pages 7203—7211
DOI https://doi.org/10.2147/IJGM.S567360
Checked for plagiarism Yes
Review by Single anonymous peer review
Peer reviewer comments 2
Editor who approved publication: Dr Woon-Man Kung
Husain Y Alkhaldy,1,2 Meshal M Alqahtani,3 Mahdi S Al Amri,4 Yusra D Alasmari,5 Yousef Ali Alassiri,5 Mohammed Algathradi,5 Basma A Al Ghamdi,2 Jaber Y Almalki,6 Moosa S Almalki,7 Ali M Assiri,8 Nada Alshehri,9 Hossam Abohassan,9 Abdullah M Algarni10
1Central Labs, King Khalid University, Alqura’a, Abha, P.O. Box 960, Saudi Arabia; 2Department of Internal Medicine, College of Medicine, King Khalid University, Abha, Saudi Arabia; 3College of Medicine, King Khalid University, Abha, Saudi Arabia; 4Intensive Care Department, King Khalid University Medical City, Abha, Saudi Arabia; 5Radiology Department, King Khalid University Medical City, Abha, Saudi Arabia; 6Department of Respiratory Therapy, King Faisal Medical City, Abha, Saudi Arabia; 7Department of Respiratory Therapy, Abha Maternity and Children Hospital, Abha, Saudi Arabia; 8Internal Medicine Department, College of Medicine, Najran University, Najran, Saudi Arabia; 9Internal Medicine Department, King Khalid University Medical City, Abha, Saudi Arabia; 10Family Medicine Department, Aseer Central Hospital, Abha, Saudi Arabia
Correspondence: Husain Y Alkhaldy, Department of Internal Medicine, College of Medicine, King Khalid University, Abha, 61421, Saudi Arabia, Tel +966599915567, Email [email protected]
Background: Residing at high altitude is associated with increased red blood cell volume (RBCV) and reduced plasma volume (PV), changes that complicate interpretation of hemoglobin (Hb) and hematocrit (Hct). Here, we assess blood volume (BV), RBCV, PV, and hemoglobin mass (Hbmass) in individuals living at moderate altitude with the aim of deriving reference range for use in clinical practice.
Methods: One hundred and fifty-eight moderate-altitude residents (ALT; 51 women) from Abha, Saudi Arabia (2250 m above sea level) were recruited and compared to 40 control subjects (CON; 0 women). Blood volumes and Hbmass were determined by carbon monoxide rebreathing. Lean body mass (LBM) was quantified by dual-energy X-ray absorptiometry and adjusted for.
Results: When normalized to LBM, ALT men displayed an 8% increase in BV (109 vs 101 mL, p = 0.003), 14.8% increase in RBCV (54 vs 47 mL, p < 0.001), and 16.2% increase in Hbmass (18 vs 15 g, p < 0.001) compared to CON. ALT women exhibited lower BV (3928 vs 5476 mL), RBCV (1684 vs 2690 mL), PV (2276 vs 2767 mL), and Hbmass (558 vs 886 g), than ALT men, (p < 0.001 for all). When expressed per body weight, ALT men have higher RBCV (33 vs 30 g), lower PV (34 vs 40 mL) and no different BV (68 vs 69 mL, p = 0.443). When expressed per LBM, gender differences in RBCV and Hbmass disappeared (RBCV: 54 vs 51 mL/kgLBM, p = 0.164; Hbmass: 18 vs 17 g/kgLBM, p = 0.201). Women have significantly higher BV (120 vs 109 mL/kgLBM) owing to higher PV (72 vs 55 mL/kgLBM).
Conclusion: Moderate altitude is associated with a higher BV owing to a higher RBCV, which also explains the elevated Hb. A reference range based on the 5% and 97.5% percentiles of blood volumes and Hbmass adjusted for LBM is suggested for use in clinical practice.
Keywords: hemoglobin, high altitude, red blood cell volume, carbon monoxide rebreathing, lean body mass, altitude
Introduction
The blood volume (BV) is mainly comprised of two compartments, plasma volume (PV) and red blood cell volume (RBCV), and constitutes a controlled milieu that can be altered by both physiological and pathological processes. In clinical practice, Hemoglobin and hematocrit are easy-to-obtain indirect measurements of red cell volume; however, both have many shortfalls and need to be interpreted carefully.1 Since these measures are concentration-based, a patient with acute bleeding can have a Hb value that is minimally changed despite significant blood loss. Meanwhile, reduced plasma volume, like in a patient using diuretics, could lead to an erroneous polycythemia diagnosis, ie, spurious polycythemia. Conversely, expansion of plasma volume as occurs in cases of heart failure and chronic kidney disease leads primarily to dilutional anemia, with actual anemia occurring in lesser degree.2–4
The effect of plasma expansion on Hb and Hct is also noticed in cases of polycythemia vera, where expanded plasma can mask polycythemia, which subsequently might escape an early diagnosis.5 In the 2016 revision of polycythemia vera diagnosis criteria, Hb and Hct thresholds were lowered with the aim of capturing more cases that would perhaps otherwise be missed under the former cutoffs. However, these thresholds now overlap with reference range values, resulting in over-workup of otherwise normal individuals.6,7 This overlap is exaggerated at high altitudes, where physiological adaptations can complicate interpretation of Hb. When sea level residents’ sojourn to altitude, plasma volume decreases within 24 hours, and RBCV increases within weeks.8,9 Combined, these changes consistently elevate Hb, but in a manner that may not be uniform, as the contribution of RBCV change is initially absent, then increases over time. In the case of a concomitant pathological process, it cannot be determined which process is responsible for altering Hb. Furthermore, while greater hemoglobin mass is associated with greater Hb concentration, these parameters do not have a linear relationship; two individuals with equal Hb values might differ in hemoglobin mass and blood volume.10
At present, anemia is diagnosed as Hb below 120 g/L for females and 130 g/L for males based on reference values at sea level. However, since Hb and Hct are altered by altitude exposure, both anemia and polycythemia diagnosis criteria should be reevaluated for high-altitude contexts.11 How permanent residence at moderate altitude affects RBCV and PV remains poorly understood, as do the respective contributions of these parameters to altitude-induced increase in Hb.
The measurement of red cell blood volume and Hbmass has long been a key diagnostic tool, especially in patients with suspected polycythemia vera. Historical radioisotope-derived methods of measurement, such as with 51Cr and 125I, show equivalency and acceptable precision,12 but are cumbersome, costly, and suboptimal in diagnostic accuracy, and have lost favor in clinical practice.13 Many hematologists have shifted towards using genetic tests, bone marrow histology, and serum erythropoietin level.13 In addition, newer methods of assessing Hbmass and blood volumes in clinical practice, like the CO rebreathing method, are now available and have become widely utilized in a variety of patient populations.14–17 The CO rebreathing method especially has been demonstrated effective in various settings with a very low margin of error,18 and could be used to confirm true increases in Hbmass, thereby minimizing the number of individuals subjected to unnecessary evaluation for polycythemia.
We previously reported on blood volume and Hbmass measurements at moderate altitude, showing a possible increase of Hbmass in long-term dwellers when compared to the historical sea-level cohort.19 That study was limited by the absence of local controls and by not all subjects having available lean body mass assessment. Since a reliable reference range is a prerequisite for proper utility in clinical practice. The present study aimed to establish reference values for hemoglobin mass and blood volumes in a moderate-altitude population. These reference ranges are essential for future studies evaluating anemia, polycythemia, and other conditions affecting blood volume—such as cardiac, renal, and hepatic diseases—as well as pharmacological effects, including those of SGLT inhibitors.
Methods
The study protocol was approved by the Institutional Review Board at King Khalid University (ECM#2023-3219) and was conducted according to the principles outlined in the Declaration of Helsinki. Participants were recruited through directed advertisements targeting university students and clinic visitors. A total of 220 were enrolled (170 altitude residents and 46 international controls). Ultimately, 158 residents and 40 international controls were included in the final analysis. Sea-level controls were limited to men due to operational and safety constraints related to CO-rebreathing and DXA imaging; consequently, cross-altitude comparisons were prespecified for men only.
Inclusion and Exclusion Criteria
Healthy participants 18 years or older with hemoglobin ≥120 g/L for females and ≥130 g/L for males who are long-term dwellers at altitude were considered eligible for this study. All participants were provided with an informational video about the procedure and signed informed consent forms. Brief interviews were conducted to obtain information about any medical conditions, drug use, or smoking. A control cohort was recruited from healthy international university students originally from sea-level East African countries. The control cohort was recruited before traveling back to their countries of origin, where they stayed for a minimum of two months, after which measurements were collected within 48 hours of their return to Saudi Arabia.
Data Collection and Blood Volume Measurements
Lean body mass was assessed using dual-energy X-ray absorptiometry (Lunar iDXA, GE healthcare). Blood volumes were measured according to a published and validated CO rebreathing protocol20 also validated for clinical use.21 Briefly, the participant was seated in the recumbent position and an IV line secured in the dorsum of one hand for collection of venous blood. Hemoglobin (g/L), hematocrit (%), and carboxyhemoglobin (%) were determined by blood gas analyzer (Siemens Rapidpoint 500e analyzer or Radiometer ABL90). A CO rebreather device (Detalo Performance, Detalo Health, Denmark) was used to administer CO gas (99.9% pure, 1 mL/kg) according to the four-minute protocol. Venous samples were collected before CO administration and at minute six post-administration. CO-Hb% was determined immediately and hemoglobin mass (Hbmass) was calculated from the change in CO-Hb%. BV, RBCV, and PV were derived from Hb and HCT.
All CO-rebreathing assessments were performed using the Detalo Health device (Detalo, Denmark) with automated calibration and dose algorithms; primary outputs (HbCO kinetics, Hbmass, PV, RV) were device-calculated and exported directly, minimizing operator influence. Phlebotomy and body-composition technicians were not informed of participants’ control vs altitude status, and data cleaning and RI construction were conducted with group labels masked until the analysis plan was frozen. Order of testing was randomized within sessions, and device calibration logs were archived. While complete blinding is not feasible in physiological testing, these steps limit measurement and analytical bias.
Statistical Analysis
Participant characteristics were summarized as median (IQR). Hemoglobin mass (Hbmass) and intravascular volumes—red blood cell volume (RBCV), plasma volume (PV), and total blood volume (BV)—were analyzed as both absolute values and normalized per kilogram of body weight (BW) or lean body mass (LBM).
RI derivation followed CLSI EP28-A3c with ≥120 per partition whenever feasible. Our altitude cohort comprised 158 adults (107 men, 51 women), enabling nonparametric percentile RIs with bootstrap CIs. For male altitude vs sea-level comparisons (n = 107 vs n = 40), observed standardized effects for Hbmass (d = 0.77) and RBC volume (d = 0.68), and for LBM-normalized metrics (Hbmass/LBM d = 1.12; RBC-V/LBM d = 1.02) yielded >95% post-hoc power at α = 0.05; parameters with small effects appropriately showed low power.
Reference intervals (RIs) were derived from the altitude residents using nonparametric quantiles (2.5th–97.5th percentiles) with 90% confidence intervals based on 20,000 bias-corrected and accelerated (BCa) bootstrap replications. The Clinical & Laboratory Standards Institute (CLSI) EP28-A3c guideline was followed,22 and robustness was evaluated using 5th–95th and 5th–97.5th intervals. No winsorization was applied.
Sex partitioning was assessed using the CLSI “gate” procedure, which evaluates whether either sex shows disproportionate tail exceedance when using combined-sex RIs. One-sided exact binomial tests were used by design, since only upward deviation from the nominal 2.5% tail probability is relevant.
Altitude effect analysis was restricted to men and analyzed using three linear regression models with HC3 robust standard errors: (i) absolute outcomes adjusted for age and LBM, (ii) absolute outcomes adjusted for age and BW, and (iii) normalized outcomes adjusted for age. Results are reported as adjusted mean differences (AMEs) with 95% confidence intervals. Quantile regression at τ = 0.25, 0.50, and 0.75 was used to assess distributional shifts, with bootstrap-based variance estimation.
Sensitivity analyses included exclusion of high-residual leverage points, alternate RI tail definitions, and normalization contrasts between BW and LBM. Additionally, generalized linear models with Gamma distribution and log link were used to account for potential mean–variance coupling.
All tests were two-sided except for the CLSI gate procedure, which used one-sided testing as specified. Complete-case analysis was used throughout, with no imputation. Statistical analyses were performed in StataNow 19.5 (StataCorp, College Station, TX), with a fixed seed (12345) to enhance reproducibility.
Results
After initial inclusion, 12 altitude participants were excluded from analysis: 9 due to hemoglobin levels outside the reference range and 3 due to errors in measurements. In total, 158 high-altitude residents were included in the final analysis, with 51 (32%) being females. Among 46 initially recruited international students, 6 were excluded due to errors in measurements, leaving 40 to be included in the final analysis. LBM measurements were available for 60 altitude men, 30 altitude women and 31 control men. Most high-altitude participants (n = 151) were healthy college students aged 18–24 years; the other 7 were healthy men recruited from outpatients’ visitors. The median age was 21 years for altitude men, 22 years for altitude women, and 26 years for control men. The median Hb and Hct were 165 g/L (49.1%) in altitude men, 141 g/L (42.8%) and in altitude women, and 152 g/L (46.5%) in control men (Table 1).
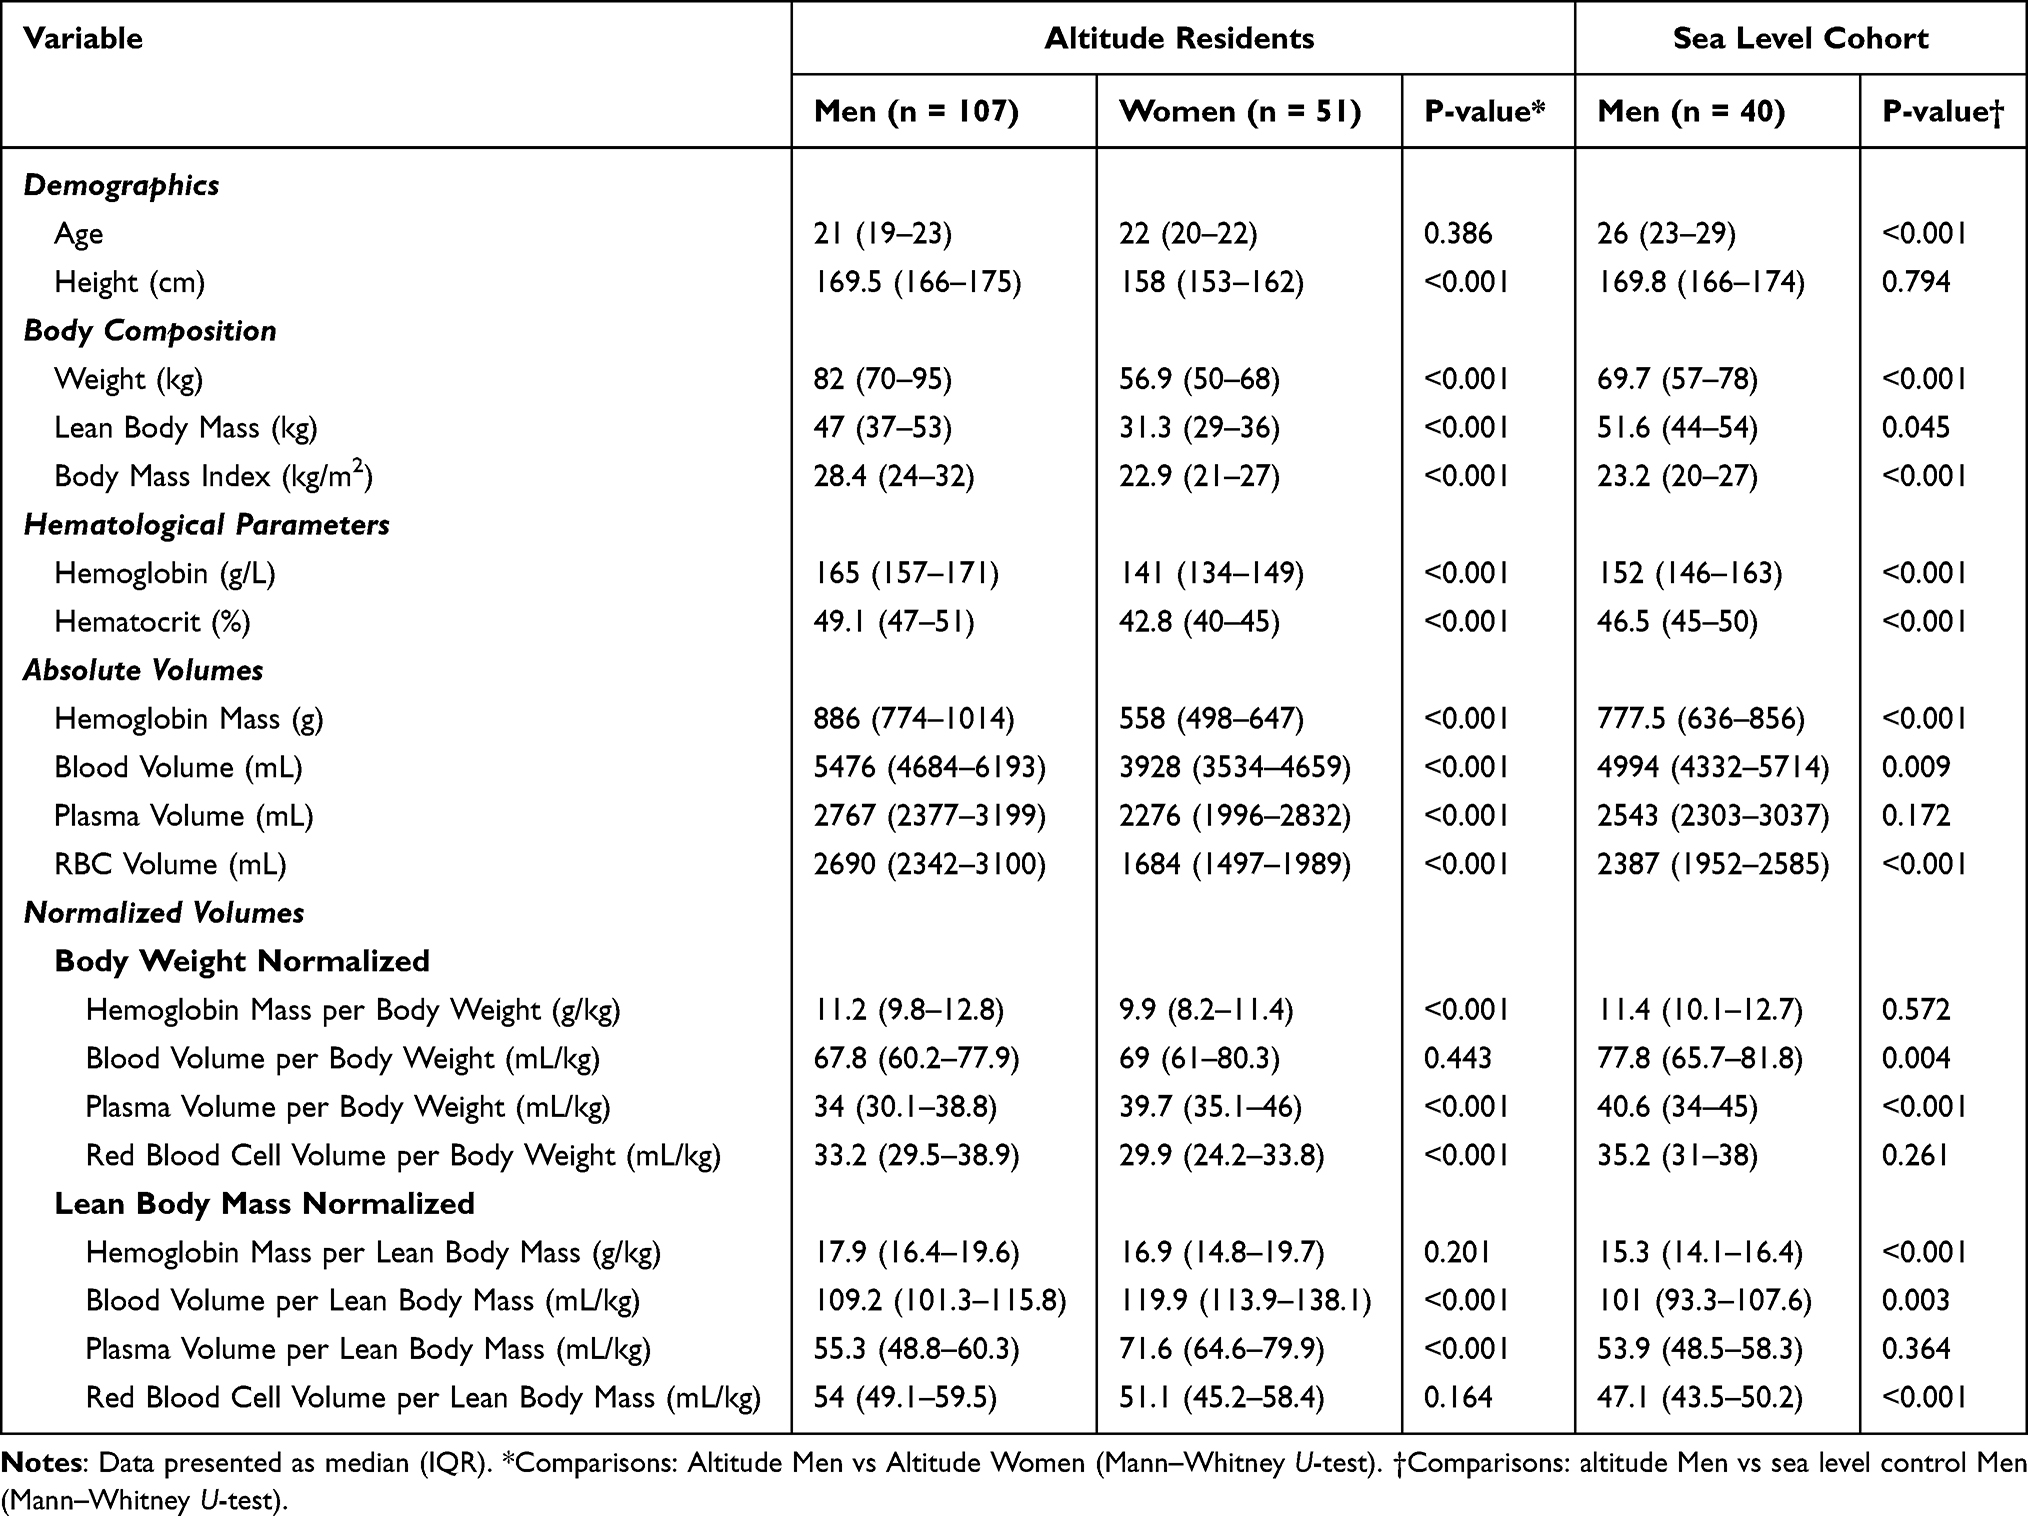 |
Table 1 Participant Characteristics |
Blood Volumes Measurement
Altitude men had higher absolute values for BV, RBCV, and PV compared to women (Table 1). The median BV was 5476 mL in men compared to 3928 mL in women (p < 0.001), PV: 2758 vs 2276 mL, and RBCV: 2677 vs 1684 mL, (P < 0.001 for all). Altitude men had higher RBCV per body weight (33.2 vs 29.9 mL/kg, p < 0.001) and lower PV (34 vs 39.7 mL/kg, p < 0.001) whereas BV was not statistically different between men and women when expressed per body weight (67.8 vs 69 mL/kg, p = 0.443). When expressed per LBM, BV was higher in females (120 vs 109 mL/kgLBM, p < 0.001) due to higher plasma volume (71.5 vs 55.2 mL/kgLBM, p < 0.001). The gender difference in RBCV vanished when expressed per LBM (54 vs 51 mL/kgLBM, p = 0.206).
Hemoglobin Mass
Hbmass was higher in altitude men compared to women both in absolute terms (885 vs 558 g, p < 0.001) and per total body weight (11.2 vs 9.8 g/kg, p < 0.001). However, normalization of Hbmass to lean body mass abrogated the difference between males and females (17.9 vs 16.9 g/kgLBM, p = 0.201).
Effect of Altitude on Hbmass and Blood Volumes
To explore the moderate altitude effect on blood volumes and Hbmass, altitude cohort were compared with recently relocating sea level cohort. The control group had a mean BMI of 23.7 ± 4.3 and LBM of 49.6 ± 7.6 kg, while altitude men had a mean BMI of 28.4 ± 5.7 kg and LBM of 38.9 ± 21.1 kg. Controls exhibited a lower mean Hb and Hct compared to altitude men (Hb 152.4 ± 12.1 g/L, Hct 46.6 ± 3.7% vs Hb 163.7 ± 11 g/L, Hct 49.1 ± 3.5%, p < 0.001 for both). Altitude men had significantly higher BV (5476 vs 4994 mL, p = 0.009) and when expressed per LBM (109 vs 101 mL/kgLBM, p = 0.003) whereas BV was higher in control group when reported per body weight (77.8 vs 67.8 mL/kg, p = 0.004). The RBCV was also higher in altitude men when expressed as total (2690 vs 2387 mL, p < 0.001) or per LBM (54 mL vs 47.1 mL/kgLBM, p < 0.001), but not when expressed per body weight (33.2 vs 35.2 mL/kg, p = 0.261). PV was not different between the two cohorts when expressed as total (2767 mL vs 2543, p = 0.172) or per LBM (55.3 mL vs 53.09 mL/kgLBM, p = 0.364) but was significantly higher in the control cohort when expressed per body weight (34 vs 40.6 mL/kgLBM, p < 0.001).
Hbmass was significantly higher in altitude men both as an absolute value (886 vs 777.5 g, p < 0.001) and when expressed per LBM (17.9 vs 15.3 g/kgLBM, p < 0.001) but not when expressed per body weight (11.2 g vs 11.4 g/kg, p = 0.625). The LBM assessment proves important for comparison due to the discrepancy between lean mass and body weight in the two groups, with the altitude cohort showing less lean body mass and more fat compared to the controls, underscoring the importance of LBM assessment when comparing two cohorts with different body composition (Table 1).
The net effect of altitude on blood volumes and Hbmass was presented in (Table 2) In men, the adjusted effect of moderate altitude on blood volume parameters varied according to the normalization framework. Under the LBM-adjusted framework, altitude was associated with significantly higher values for blood volume (601 mL, 95% CI: 1009–192 mL; p = 0.004), hemoglobin mass (145 g, 95% CI: 221–69 g; p < 0.001), and red blood cell volume (393 mL, 95% CI: 624–162; p = 0.001). Plasma volume also tended to be lower (208 mL, 95% CI: 428–12 mL; p = 0.064), though this did not reach statistical significance.
 |
Table 2 Adjusted Effect of Moderate Altitude on Blood Volume Parameters in Men |
By contrast, in the BW-adjusted framework, altitude effects were attenuated, with only hemoglobin mass showing a significant expansion (59 g, 95% CI: 115 to 2; p = 0.041). Other parameters, including blood volume, plasma volume, and red blood cell volume, were not significantly different. Overall, the LBM-based adjustment demonstrated greater sensitivity, detecting altitude-related changes in 3 of 4 parameters, compared with only 1 of 4 under the BW framework.
Suggested Reference Ranges for Blood Volumes and Hbmass
The complete altitude-specific reference intervals are presented in Supplementary Table S1, which provides the primary nonparametric 2.5th–97.5th percentiles with 90% bootstrap confidence intervals. Because the study inclusion criteria—based on sea-level hemoglobin and hematocrit cutoffs—could admit participants with borderline anemia at altitude, Supplementary Table S2 also reports the 5th–95th percentiles as a robustness check. Table 3 summarizes the comparison between the LBM- and BW-normalized frameworks rather than the raw intervals. The LBM-based reference range is preferred, particularly when comparing groups with differing body composition, as it minimizes the influence of adiposity on blood-volume estimates. For interpretive purposes, the 5th percentile was adopted as the lower bound because it provides greater clinical specificity in this population. Alternative cutoffs (2.5% and 95%) representing varying sensitivity thresholds are detailed in the Supplementary material (supplement Tables S1-S6). Graphical summaries of the reference intervals, gate-analysis results, and robustness checks are presented in Supplementary Figures S1–S5.
 |
Table 3 Comparison of LBM vs BW Normalization Approaches for Reference Intervals (5–97.5 Percentiles) |
Discussion
In this work, we determined intravascular blood volumes and Hbmass in healthy residents residing at moderate altitude in order to derive an altitude specific reference range to be used in future clinical practice. We employed a CO rebreathing technique that is safe and easy to use both in clinic and in other contexts. Our results demonstrate that in this population of healthy moderate-altitude residents, the blood volume, red cell volume, and Hbmass are increased compared to sea level residents. Moreover, our data also corroborate that normalization to lean body mass rather than total body weight is of greater value when interpreting blood volumes and Hbmass.23 The absence of female sea-level controls limits cross-altitude inference for women; we therefore report female RIs at altitude without cross-altitude contrasts and plan a dedicated female sea-level validation.
As expected, we observed that BV, RBCV, and Hbmass are higher in men compared to women both in absolute terms and when normalized to total body weight. However, consistent with a previous report,23 these sex-related differences not only diminished when normalizing to LBM but women in fact displayed a higher total BV per lean body mass, which was explained by higher PV. Hence, consideration of LBM is important for obtaining reliable and useful blood volume measurements. Indeed, given that fat tissue is hypovascular, such normalization should provide more clinically valid measurements, especially in patients with obesity. It is accordingly recommended that BV be reported as LBM-normalized values, particularly in the setting of obesity.24–26
To explore the effect of high altitude on Hbmass and intravascular volumes, we compared altitude residents with a newly arrived international sea level cohort. Lean body mass assessment proved valuable here, since the two groups differed in body composition: the controls had higher lean body mass and lower body fat compared to the altitude participants. The altitude cohort exhibited higher absolute baseline hemoglobin and hematocrit and significantly higher total Hbmass and which persisted when adjusted per lean mass compared to the controls (17.9 vs 15.3 g/kgLBM) Blood volume was increased in the altitude cohort on account of an increase in red blood cell volume, whereas the plasma volume was not different between groups. Since plasma volume contracts 24 h upon arrival to high altitude,27 we may have missed a true difference in PV between altitude and control subjects as the latter were measured only 24–48 h upon arrival to altitude, and which may accordingly lead to erroneous conclusions regarding the effects of RBCV and PV contribution to the altitude induced increase in Hb. Overall, the findings of this work indicate that moderate altitude residents have increased blood volume, red blood volume, and Hbmass, which poorly correlated with hemoglobin and hematocrit values. Therefore, clinical decisions for patients residing at altitude should be based on direct measurement of blood volume and Hbmass rather than relying on Hb or Hct alone.
The occurrence of altitude-associated increase in red blood cell volume complicates the diagnosis of pathological polycythemia at altitude. Furthermore, changes in both plasma volume and red blood cell volume are established to occur alongside polycythemia vera, leading to so-called masked polycythemia in which the patient presents with normal Hb and Hct.28 To account for such situations, the criteria for considering polycythemia have been lowered to Hb and Hct of 16 g/dL and 48% for females and 16.5 g/dL and 49% for males,29 values well into the normal ranges of these parameters at altitude. Hence, more specific screening methods are needed when selecting individuals for polycythemia evaluation at high altitudes. One diagnostic criterion for polycythemia vera is Hbmass >25% over predicted value, but applying this criterion depends on having a validated reference range. For our population, we suggest using a reference range based on the 5% and 97.5% percentiles (Table 3). The lean-body-mass-adjusted reference range is best as this adjustment also abolishes sex and limits obesity effects on RBCV and Hbmass. Furthermore, previous studies have shown that age is not an important factor when blood volumes and Hbmass are adjusted to lean mass, implying that the aging-associated decreases in blood volume and Hbmass are related to decreased muscle mass.23 Thus, our reference range can be used in an adult population of any age. Accordingly, regardless of Hb and HCT values, an adult high-altitude resident with Hbmass more than 22 g/kgLBM is likely pathological and warrants further investigation; such a finding would justify the request of a JAK2 mutation assay to rule out polycythemia vera. At higher elevations, the criteria likely need upwards adjustments, but the magnitude hereof is at present unknown. Employing this Hbmass-based criterion could significantly decrease unnecessary evaluation of people with normal altitude adaptations. Hbmass quantification also has important use in the crucial consideration of differentiating essential thrombocytosis from masked polycythemia vera.28 Moreover, blood volume and Hbmass measurements can be helpful to identify normal Hbmass in patients with volume expansion and dilutional anemia, for example, in individuals with heart failure, kidney failure, or chronic liver disease.
Conclusions
Residents living at moderate altitude (2250 meters) have elevated BV, RBCV, and Hbmass but normal PV when compared with recently arrived sea level controls. Lean mass assessment is more accurate especially with people with extreme weight and when comparing two groups with different body compositions. A local reference range is suggested based on the 5th and 97.5th percentiles. Direct assessment of blood volume will aid in managing a wide range of disorders impacting blood volume, such as liver, heart, and kidney diseases, pharmacologic effects (eg, SGLT-2 inhibitors). Meanwhile, evaluating total hemoglobin mass is crucial for selecting patients needing workup for polycythemia, especially to differentiate between masked polycythemia, essential thrombocytosis, and for dilutional anemia.
Data Sharing Statement
Supplementary Tables S1–S4 accompany this article (S1: 2.5–97.5% RIs; S2: 5–95% RIs; S3: CLSI gate for LBM-normalized endpoints; S4: Model summary). The datasets used and/or analyzed during the current study are available from the corresponding author.
Acknowledgment
The authors thank all the participants of this study for their commitment and the staff at the outpatient department of King Khalid University Hospital for facilitating this project. The authors extend their appreciation to University Higher Education Fund for funding this research under Research Support Program for Central Labs at King Khalid University through the project number CL/CO/C/7.
Disclosure
The authors report no conflicts of interest in this work.
References
1. Silver RT, Gjoni S. The hematocrit value in polycythemia vera: caveat utilitor. Leuk Lymphoma. 2015;56(5):1540–1541. doi:10.3109/10428194.2014.966243
2. Strobeck JE, Feldschuh J, Miller WL. Heart failure outcomes with volume-guided management. JACC Heart Fail. 2018;6(11):940–948. doi:10.1016/j.jchf.2018.06.017
3. Strobeck JE, Feldschuh J, Miller WL. Heart failure outcomes with volume-guided management in an over-65 population. J Card Fail. 2023;29(4):674–675. doi:10.1016/j.cardfail.2022.10.317
4. Lundby C, Ponte B, Lundby AK, Robach P, de Seigneux S. Red blood cell volume is not decreased in ESA-naive anemic chronic kidney disease patients. Physiol Rep. 2018;6(21):e13900. doi:10.14814/phy2.1390010.14814/phy2.13900
5. Otto J, Plumb J, Clissold E. 2017. Hemoglobin concentration, total hemoglobin mass and plasma volume in patients: implications for anemia. ncbi.nlm.nih.gov JM Otto, JOM Plumb, E Clissold, SB Kumar, DJ Wakeham, W Schmidt, MPW Grocotthaematologica, 2017•ncbi.nlm.nih.gov [Internet]. [cited August 8, 2024]; Available from: https://www.ncbi.nlm.nih.gov/pmc/articles/PMC5685237/.
6. Gulturk E, Yilmaz D, Sonmezoz GB, Yildirim ES. Contribution of lowered hemoglobin threshold value in the diagnosis of polycythemia vera: comparison of 2016 and 2008 WHO criteria. Medicine. 2023;102(31):E34462. doi:10.1097/MD.000000000003446210.1097/MD.0000000000034462
7. Eren R, Sevinçoğlu BF, Doğan EE, Aydın D, Nizam N, Demirel N. How does 2016 who criteria for polycythemia vera contribute to our daily practice? A single-center study from Turkey. Int J Hematol Oncol Stem Cell Res. 2020;14(4):232–236. doi:10.18502/ijhoscr.v14i4.4478
8. Siebenmann C, Robach P, Lundby C. Regulation of blood volume in lowlanders exposed to high altitude. J Appl Physiol. 2017;123(4):957–966. doi:10.1152/japplphysiol.00118.2017
9. Cobb AB, Levett DZH, Mitchell K, et al. Physiological responses during ascent to high altitude and the incidence of acute mountain sickness. Physiol Rep. 2021;9(7):e14809. doi:10.14814/phy2.14809
10. Otto JM, Plumb JOM, Clissold E, et al. Hemoglobin concentration, total hemoglobin mass and plasma volume in patients: implications for anemia. Haematologica. 2017;102(9):1477–1485. doi:10.3324/haematol.2017.169680
11. Schmidt WFJ, Wachsmuth N, Jimenez J, Soria R. Hemoglobin mass and blood volume in patients with altitude-related polycythemia. Front Physiol. 2022;13:867108. doi:10.3389/fphys.2022.867108
12. Fairbanks VF, Klee GG, Wiseman GA, et al. Measurement of blood volume and red cell mass: re-examination of 51Cr and 125I methods. Blood Cells Mol Dis. 1996;22(2):169–186. doi:10.1006/bcmd.1996.0024
13. Sirhan S, Fairbanks VF, Tefferi A. Red cell mass and plasma volume measurements in polycythemia: evaluation of performance and practical utility. Cancer. 2005;104(1):213–215. doi:10.1002/cncr.21105
14. Ahlgrim C, Schumacher YO, Wrobel N, Waller CF, Pottgiesser T. Application of the optimized CO-rebreathing method for determination of hemoglobin mass in patients with polycythemia vera. Ann Hematol. 2014;93(7):1159–1165. doi:10.1007/s00277-014-2020-5
15. Ahlgrim C, Birkner P, Seiler F, et al. Applying the optimized CO rebreathing method for measuring blood volumes and hemoglobin mass in heart failure patients. Front Physiol. 2018;9(NOV). doi:10.3389/fphys.2018.01603
16. Wachsmuth N, Soria R, Jimenez J, Schmidt W. Modification of the CO-rebreathing method to determine haemoglobin mass and blood volume in patients suffering from chronic mountain sickness. Exp Physiol. 2019;104(12):1819–1828. doi:10.1113/EP087870
17. Siebenmann C, Keiser S, Robach P, Lundby C. CORP: the assessment of total hemoglobin mass by carbon monoxide rebreathing. J Appl Physiol. 2017;123. doi:10.1152/japplphysiol.00185.2017
18. Gore CJ, Hopkins WG, Burge CM. Errors of measurement for blood volume parameters: a meta-analysis. J Appl Physiol. 2005;99(5):1745–1758. doi:10.1152/japplphysiol.00505.2005
19. Alkhaldy H, Alqahtani MM, Al Amri MS, Alasmari YD, Ghazy RM, Alshehri M. Assessment of hemoglobin mass and blood volumes at moderate altitude using carbon monoxide rebreathing method. Medicine. 2025;104(23):e42762. doi:10.1097/MD.0000000000042762
20. Krehl LM, Plumb JOM, Wachsmuth NB, et al. CORP: the assessment of total hemoglobin mass by carbon monoxide rebreathing. Exp Physiol. 2020;106(2):567–575. doi:10.1152/japplphysiol.00185.2017
21. Andersen AB, Bonne TC, Hansen, Joar. Validation of a clinically applicable device for fast and accurate quantification of blood volume. J Clin Lab Anal. 2023;37. doi:10.1002/jcla.24928wileyonlinelibrary.com/journal/jcla
22. Horowitz GL, Altaie S, Boyd JC, et al. EP28-A3c: defining, establishing, and verifying reference intervals in the clinical laboratory; approved guideline—third edition. Clin Lab Standards Institute. 2010;28(October):12.
23. Oberholzer L, Montero D, Robach, et al. Determinants and reference values for blood volume and total hemoglobin mass in women and men. Am J Hematol. 2024;99(1):99. doi:10.1002/ajh.27162
24. Pearson TC, Guthrie DL, Simpson J, et al. Interpretation of measured red cell mass and plasma volume in adults: expert Panel on Radionuclides of the International Council for Standardization in Haematology. Br J Haematol. 1995;89(4):748–756. doi:10.1111/j.1365-2141.1995.tb08411.x
25. Falz R, Fikenzer S, Hoppe S, Busse M. Normal values of hemoglobin mass and blood volume in young, active women and men. Int J Sports Med. 2019;40(4):236–244. doi:10.1055/a-0826-9235
26. Pearson TC, Glass UH, Wetherley‐Mein G. Interpretation of measured red cell mass in the diagnosis of polycythaemia. Scand J Haematol. 1978;21(2):153–162. doi:10.1111/j.1600-0609.1978.tb02506.x
27. Robach P, Lundby C. Plasma volume contraction at altitude: where does the plasma go? J Physiol. 2021;599(4):1013–1014. doi:10.1113/JP281028
28. Spivak JL. Myeloproliferative Neoplasms. N Engl J Med. 2017;376(22):2168–2181. doi:10.1056/NEJMra1406186
29. Tefferi A, of HTBAJ. Polycythemia vera: 2024 update on diagnosis, risk‐stratification, and management. Wiley Online Lib. 2023. doi:10.1002/ajh.27002
 © 2025 The Author(s). This work is published and licensed by Dove Medical Press Limited. The
full terms of this license are available at https://www.dovepress.com/terms
and incorporate the Creative Commons Attribution
- Non Commercial (unported, 4.0) License.
By accessing the work you hereby accept the Terms. Non-commercial uses of the work are permitted
without any further permission from Dove Medical Press Limited, provided the work is properly
attributed. For permission for commercial use of this work, please see paragraphs 4.2 and 5 of our Terms.
© 2025 The Author(s). This work is published and licensed by Dove Medical Press Limited. The
full terms of this license are available at https://www.dovepress.com/terms
and incorporate the Creative Commons Attribution
- Non Commercial (unported, 4.0) License.
By accessing the work you hereby accept the Terms. Non-commercial uses of the work are permitted
without any further permission from Dove Medical Press Limited, provided the work is properly
attributed. For permission for commercial use of this work, please see paragraphs 4.2 and 5 of our Terms.