Back to Journals » Journal of Inflammation Research » Volume 14
Helping Roles of Artificial Intelligence (AI) in the Screening and Evaluation of COVID-19 Based on the CT Images
Authors Xie H ![]() , Li Q, Hu PF, Zhu SH, Zhang JF, Zhou HD, Zhou HB
, Li Q, Hu PF, Zhu SH, Zhang JF, Zhou HD, Zhou HB
Received 14 January 2021
Accepted for publication 3 March 2021
Published 26 March 2021 Volume 2021:14 Pages 1165—1172
DOI https://doi.org/10.2147/JIR.S301866
Checked for plagiarism Yes
Review by Single anonymous peer review
Peer reviewer comments 2
Editor who approved publication: Professor Ning Quan
Hui Xie,1,2 Qing Li,2,3 Ping-Feng Hu,4 Sen-Hua Zhu,5 Jian-Fang Zhang,6 Hong-Da Zhou,1 Hai-Bo Zhou4
1Department of Radiation Oncology, Affiliated Hospital (Clinical College) of Xiangnan University, Chenzhou, 423000, People’s Republic of China; 2Key Laboratory of Medical Imaging and Artificial Intelligence of Hunan Province, Chenzhou, 423000, People’s Republic of China; 3Department of Interventional Vascular Surgery, Affiliated Hospital (Clinical College) of Xiangnan University, Chenzhou, 423000, People’s Republic of China; 4Department of Radiology, The Second People’s Hospital of Chenzhou City, Chenzhou, 423000, People’s Republic of China; 5Beijing Linking Medical Technology Co., Ltd, Beijing, 100085, People’s Republic of China; 6Department of Physical Examination, Disease Control and Prevention of Chenzhou, Chenzhou, 423000, People’s Republic of China
Correspondence: Qing Li
Department of Interventional Vascular Surgery, Affiliated Hospital (Clinical College) of Xiangnan University, 25 Renmin Street, Chenzhou, 423000, People’s Republic of China
Tel +86 19918761912
Email [email protected]
Objective: The aim of this study was to explore the role of the AI system which was designed and developed based on the characteristics of COVID-19 CT images in the screening and evaluation of COVID-19.
Methods: The research team adopted an improved U-shaped neural network to segment lungs and pneumonia lesions in CT images through multilayer convolution iterations. Then the appropriate 159 cases were selected to establish and train the model, and Dice loss function and Adam optimizer were used for network training with the initial learning rate of 0.001. Finally, 39 cases (29 positive and 10 negative) were selected for the comparative test. Experimental group: an attending physician a and an associate chief physician a read the CT images to diagnose COVID-19 with the help of the AI system. Control group: an attending physician b and an associate chief physician b did the diagnosis only by their experience, without the help of the AI system. The time spent by each doctor in the diagnosis and their diagnostic results were recorded. Paired t-test, univariate ANOVA, chi-squared test, receiver operating characteristic curves, and logistic regression analysis were used for the statistical analysis.
Results: There was statistical significance in the time spent in the diagnosis of different groups (P< 0.05). For the group with the optimal diagnostic results, univariate and multivariate analyses both suggested no significant correlation for all variables, and thus it might be the assistance of the AI system, the epidemiological history and other factors that played an important role.
Conclusion: The AI system developed by us, which was created due to COVID-19, had certain clinical practicability and was worth popularizing.
Keywords: CT, COVID-19, intelligent analysis, AI, helping role
Introduction
In December 2019, coronavirus disease (COVID-19) broke out in Wuhan.1 It was reported that this virus was first transmitted from animals to humans, and then spread rapidly in the humans.2,3 According to the data reported by the WHO, as of 12:43 am GMT+8 on 9 January 2021, 86,749,940 people were infected worldwide and 1,890,342 people died.4
Nucleic acid testing is the “gold standard” of diagnosing this disease. However, it was reported that nucleic acid testing has a low sensitivity of about 60% to 71% for detection of COVID-19,5 the reason for which might be the lower viral load in the test specimen or laboratory error. Therefore, experts suggested use of CT imaging as a complement to the nucleic acid test. On February 5, 2020, the National Health Commission (NHC) of China issued the Tentative 5th Edition of the Diagnosis and Treatment Protocol for COVID-19 Patients, which firstly proposed imaging characteristics of the suspected cases as the diagnostic criteria.6 This suggested the important role of chest CT in the diagnosis of COVID-19. Clinically, the chest CT of every patient has nearly 300 slices after being split and reconstructed. After reading the images slice by slice, radiologists could make a comprehensive judgment on the clinical diagnosis, which brought a particularly heavy workload to them, and made them physically and mentally exhausted when there were a large number of patients, especially during the outbreak of the epidemic. Thus, it became difficult for radiologists to maintain a high degree of attention, so that it was easy to make mistakes, such as missed diagnosis or misdiagnosis. However, some studies reported that artificial intelligence (AI) could play an important role in assisting doctors in making rapid and accurate diagnosis, and contribute to alleviating the epidemic.7–9 In particular, Abbasian Ardakani et al, further demonstrated the feasibility of AI in the auxiliary diagnosis of COVID-19 based on the CT images.10
Therefore, in order to relieve the work pressure of front-line radiologists, we developed an AI system based on a deep learning neural network, which can intelligently analyze the CT images to help radiologists to do the diagnosis, and our research team has created a global open platform ((https://www.paddlepaddle.org.cn/hub/scene/pneumonia) based on this project for those who need it.
The system can distinguish pneumonia and other lesions. At present, it has reached a satisfactory level in identifying ground glass opacity (GGO), and can provide important indicators about lesions, such as CT value, volume, proportion of the lung, dynamic changes of the lesions, and so on. All details were reported as follows.
Materials and Methods
This study was conducted in accordance with the Declaration of Helsinki. This study was conducted with approval from the Ethics Committee of Affiliated Hospital (Clinical College) of Xiangnan University. Written informed consent for patients was not applicable, because this paper did not disclose any personal information of the patients.
Data Collection
The data of patients who went to the Affiliated Hospital of Xiangnan University or Chenzhou City No. 2 People's Hospital from December 2019 to February 2020 due to fever, cough, travelling to areas affected by COVID-19, or contacting with confirmed or suspected COVID-19 patients were retrospectively analyzed.
Inclusion Criteria
Patients with inflammatory lesions in the lungs, identified by chest CT examination, and patients experiencing nucleic acid test for COVID-19
Exclusion Criteria
Patients with poor quality of CT images of the lung, and patients with lung tumors, pneumoconiosis, pulmonary fibrosis, or chest trauma.
Finally, a total of 159 patients were included in this study, of which 39 were true positives and 120 were false positives. Among them, the CT images of 139 cases were used as the training sets and 20 were used as the validation sets. Two associate chief physicians from the Affiliated Hospital of Xiangnan University manually were assigned to mark the lesion and the whole lung from the different patients, until all patients were marked.
The CT scanning equipment of the Affiliated Hospital of Xiangnan University is a 64-row 128-slice spiral CT Philips Ingenuity with scanning parameters: tube voltage 120 kV, using iDose3 technology, average tube current 150–175 C, scanning slice thickness 2.5 mm, slice interval 2.5 mm, pitch 0.9. The CT scanning equipment of the Chenzhou City No. 2 People's Hospital is a 16-row 32-slice spiral CT Hitachi ECLOS with scanning parameters: tube voltage 120.0 kV, tube current 100.0 C, scanning slice thickness 10.0 mm, slice interval 5.0 mm, and pitch 2.5.
Selected Neural Network
In order to ensure the speed and quality of segmentation, the research team adopted an improved U-shaped neural network to segment lungs and pneumonia lesions in CT images through multiple-layer convolution iterations.11 The segmentation network was refined from the encoder-decoder architecture of 2D U-net. We first constructed a 3D encoder-decoder network which comprised a encoder path (composed of four down-sampling dilated convolution stacks) and a decoder path (composed by four up-sampling dilated convolution stacks).
In the 3D encoder path, with a 1×2×2 max pooling size, the transverse resolution reduced to 1/8 of original size after three max-pooling operations while the axial resolution remained unchanged. Then, the decoder path used 3D deconvolution module to recover the image resolution to the original size correspondingly. Finally, all convolutions were followed by an activation layer with scaled exponential linear unit (SELU) function. Dice loss function and Adam optimizer were used for network training with the initial learning rate being 0.001. Dice loss function is defined as:
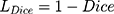
where Dice is defined in Equation 2 as below:
where VA is the volume of manual segmentation; VB is the volume of auto-segmentation of the same region; VA ∩ VB is the volume that manual segmentation and auto-segmentation have in common. The Dice coefficient was used to evaluate the quality of automatic segmentation of lungs and lesions by the AI system.
During the training phase, the early-stop mechanism was used to monitor the network iteration process, and it stopped the network training when the network performance on the validation data set was not continuing to improve. The model parameters giving the best network performance, with 0.92 of segmentation accuracy and 0.97 of recall rate, on the validation data set were saved and tested on the testing data set (Figures 1 and 2).
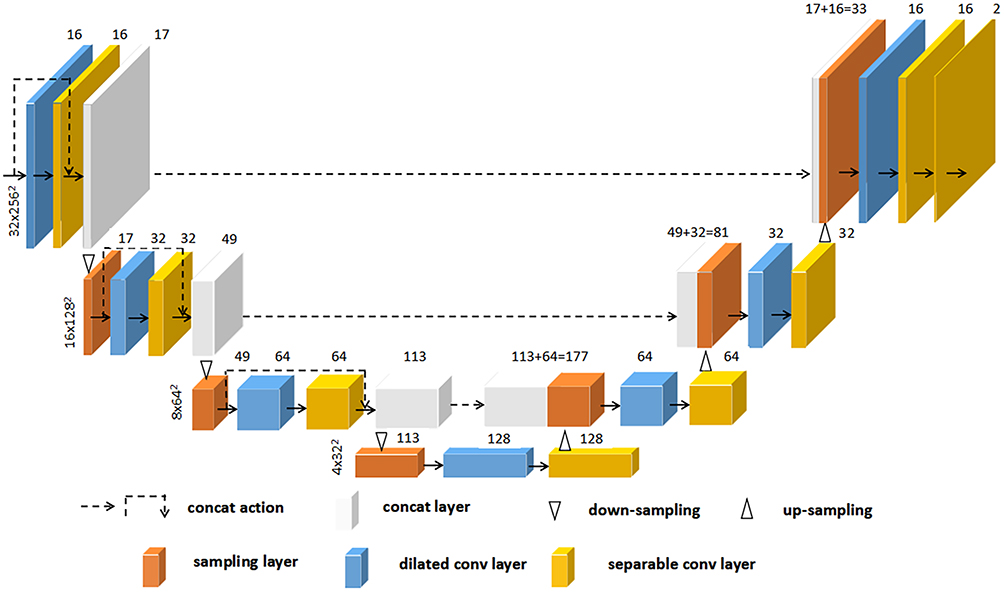 |
Figure 1 The architecture diagram of deep learning network. |
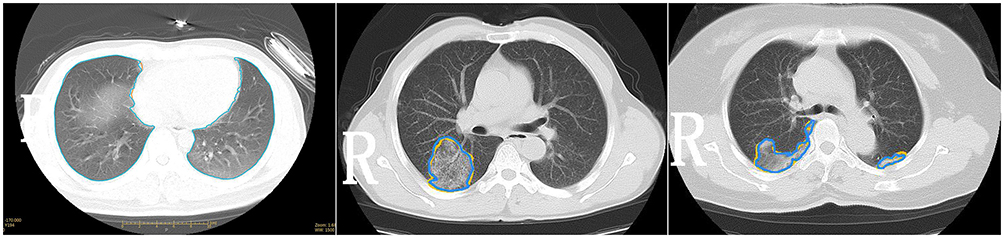 |
Figure 2 Plots during training the network. |
In order to achieve the purpose of putting the AI system into clinical practices, a comparative test to verify the effectiveness of the AI system was designed. Thirty-nine cases, of which 29 were true positive, and 10 were false positive, were picked up from the 159 cases as the subjects. Experimental group: an attending physician a and an associate chief physician a read the CT images to diagnose COVID-19 with the help of the AI system. Control group: an attending physician b and an associate chief physician b did the diagnosis only by their experience, without the help of the AI system. The four doctors were trained to do the diagnosis according to the same standard before the experiment,12 and none of them had read the CT images of the subjects before the comparative test. The time spent by each doctor in the diagnosis and their diagnostic results were recorded.
Statistical Analysis
IBM SPSS 21.0 software was used to do the statistical analysis. Paired t-test was used to analyze Dice and diagnostic time, which was expressed as  . For the accuracy of the diagnosis, univariate ANOVA was used to do the comparison between groups. For the optimal diagnostic result, chi-squared test was used for univariate analysis, and logistic regression analysis was used for multivariate analysis.
Results
Only the lungs and lesions were closely related with the diagnosis of COVID-19, so they were segmented by the AI system. A specific segmentation illustration was shown in Figure 3. Statistical analysis of Dice showed P-values were all greater than 0.05 without significant difference, as shown in Table 1.
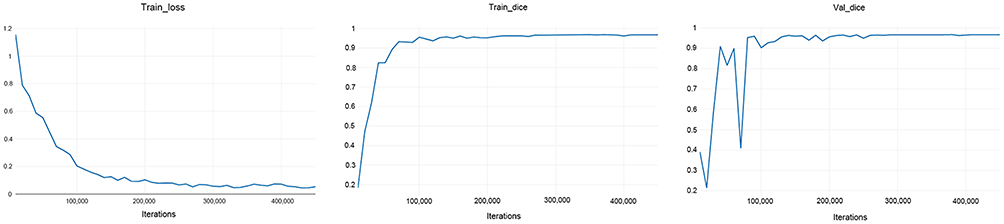 |
Figure 3 The illustration of machine-marked image and manual-marked image. |
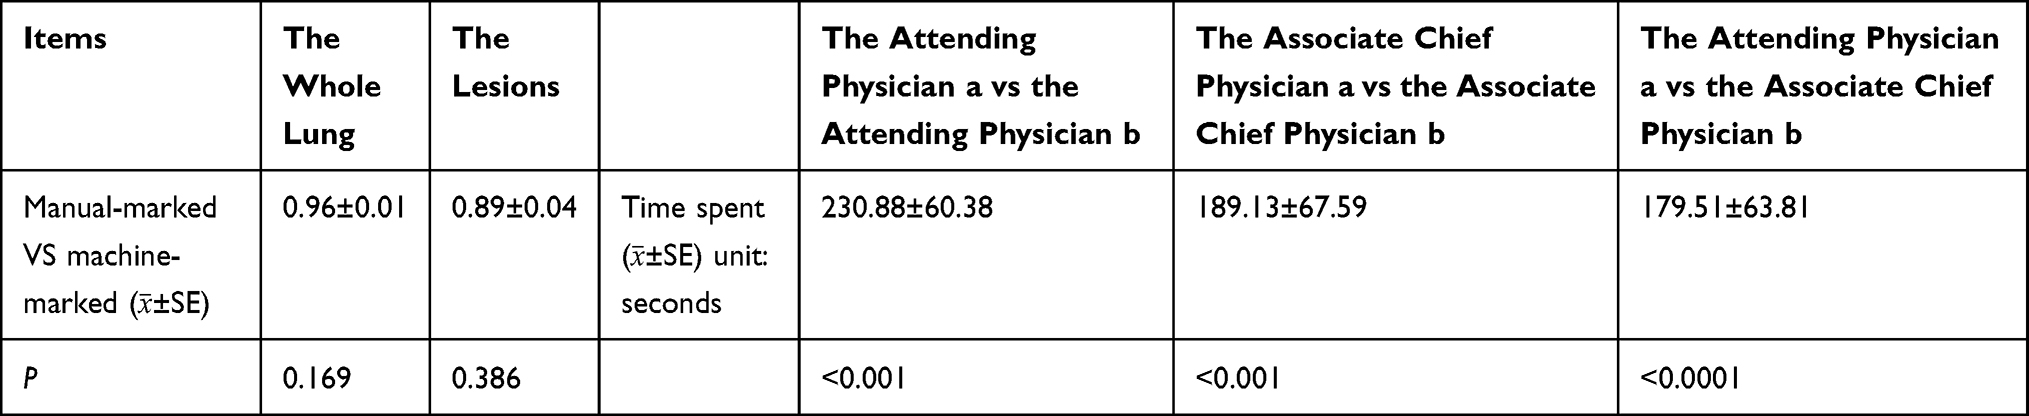 |
Table 1 The Paired Analysis of Model Segmentation Dice and Time Spent by Each Doctor on the Diagnosis |
The time spent by the doctors in the diagnosis in the experimental group was significantly less than that in the control group, P<0.05. Besides, the time spent by the attending physician a in the experiment was also significantly less than the time spent by the associate chief physician b in the control group, P<0.05 (Table 1).
For the accuracy of the diagnostic results, in the experimental group, the attending physician a was 64.1%, and the assistant chief physician a was 76.9%, and in the control group, the attending physician b was 56.4%, and the assistant chief physician b was 71.8%. The area under curves (AUCs) of the attending physician a, the assistant chief physician a, the attending physician b and the assistant chief physician b were 0.562 (95%CI: 0.35–0.78), 0.681 (95%CI: 0.47–0.89), 0.543 (95%CI: 0.33–0.75) and 0.647 (95%CI: 0.44–0.86), respectively (Figure 4). The results of ANOVA between groups for the four physicians were shown in Table 2. Only the results of the associate chief physician a showed a significant difference (P=0.019), and 76.9% of his accuracy rate was the highest. The results of chi-squared test and logistic regression analysis for the associate chief physician a were shown in Tables 3 and 4.
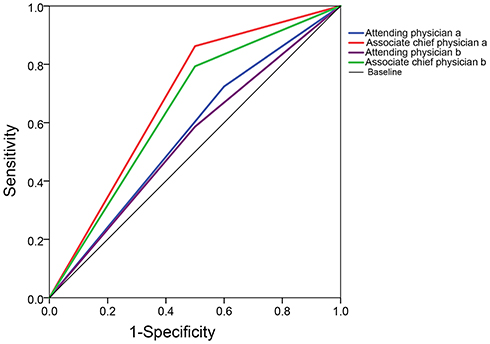 |
Figure 4 The receiver operating characteristic (ROC) curves of the diagnostic results of the four doctors. |
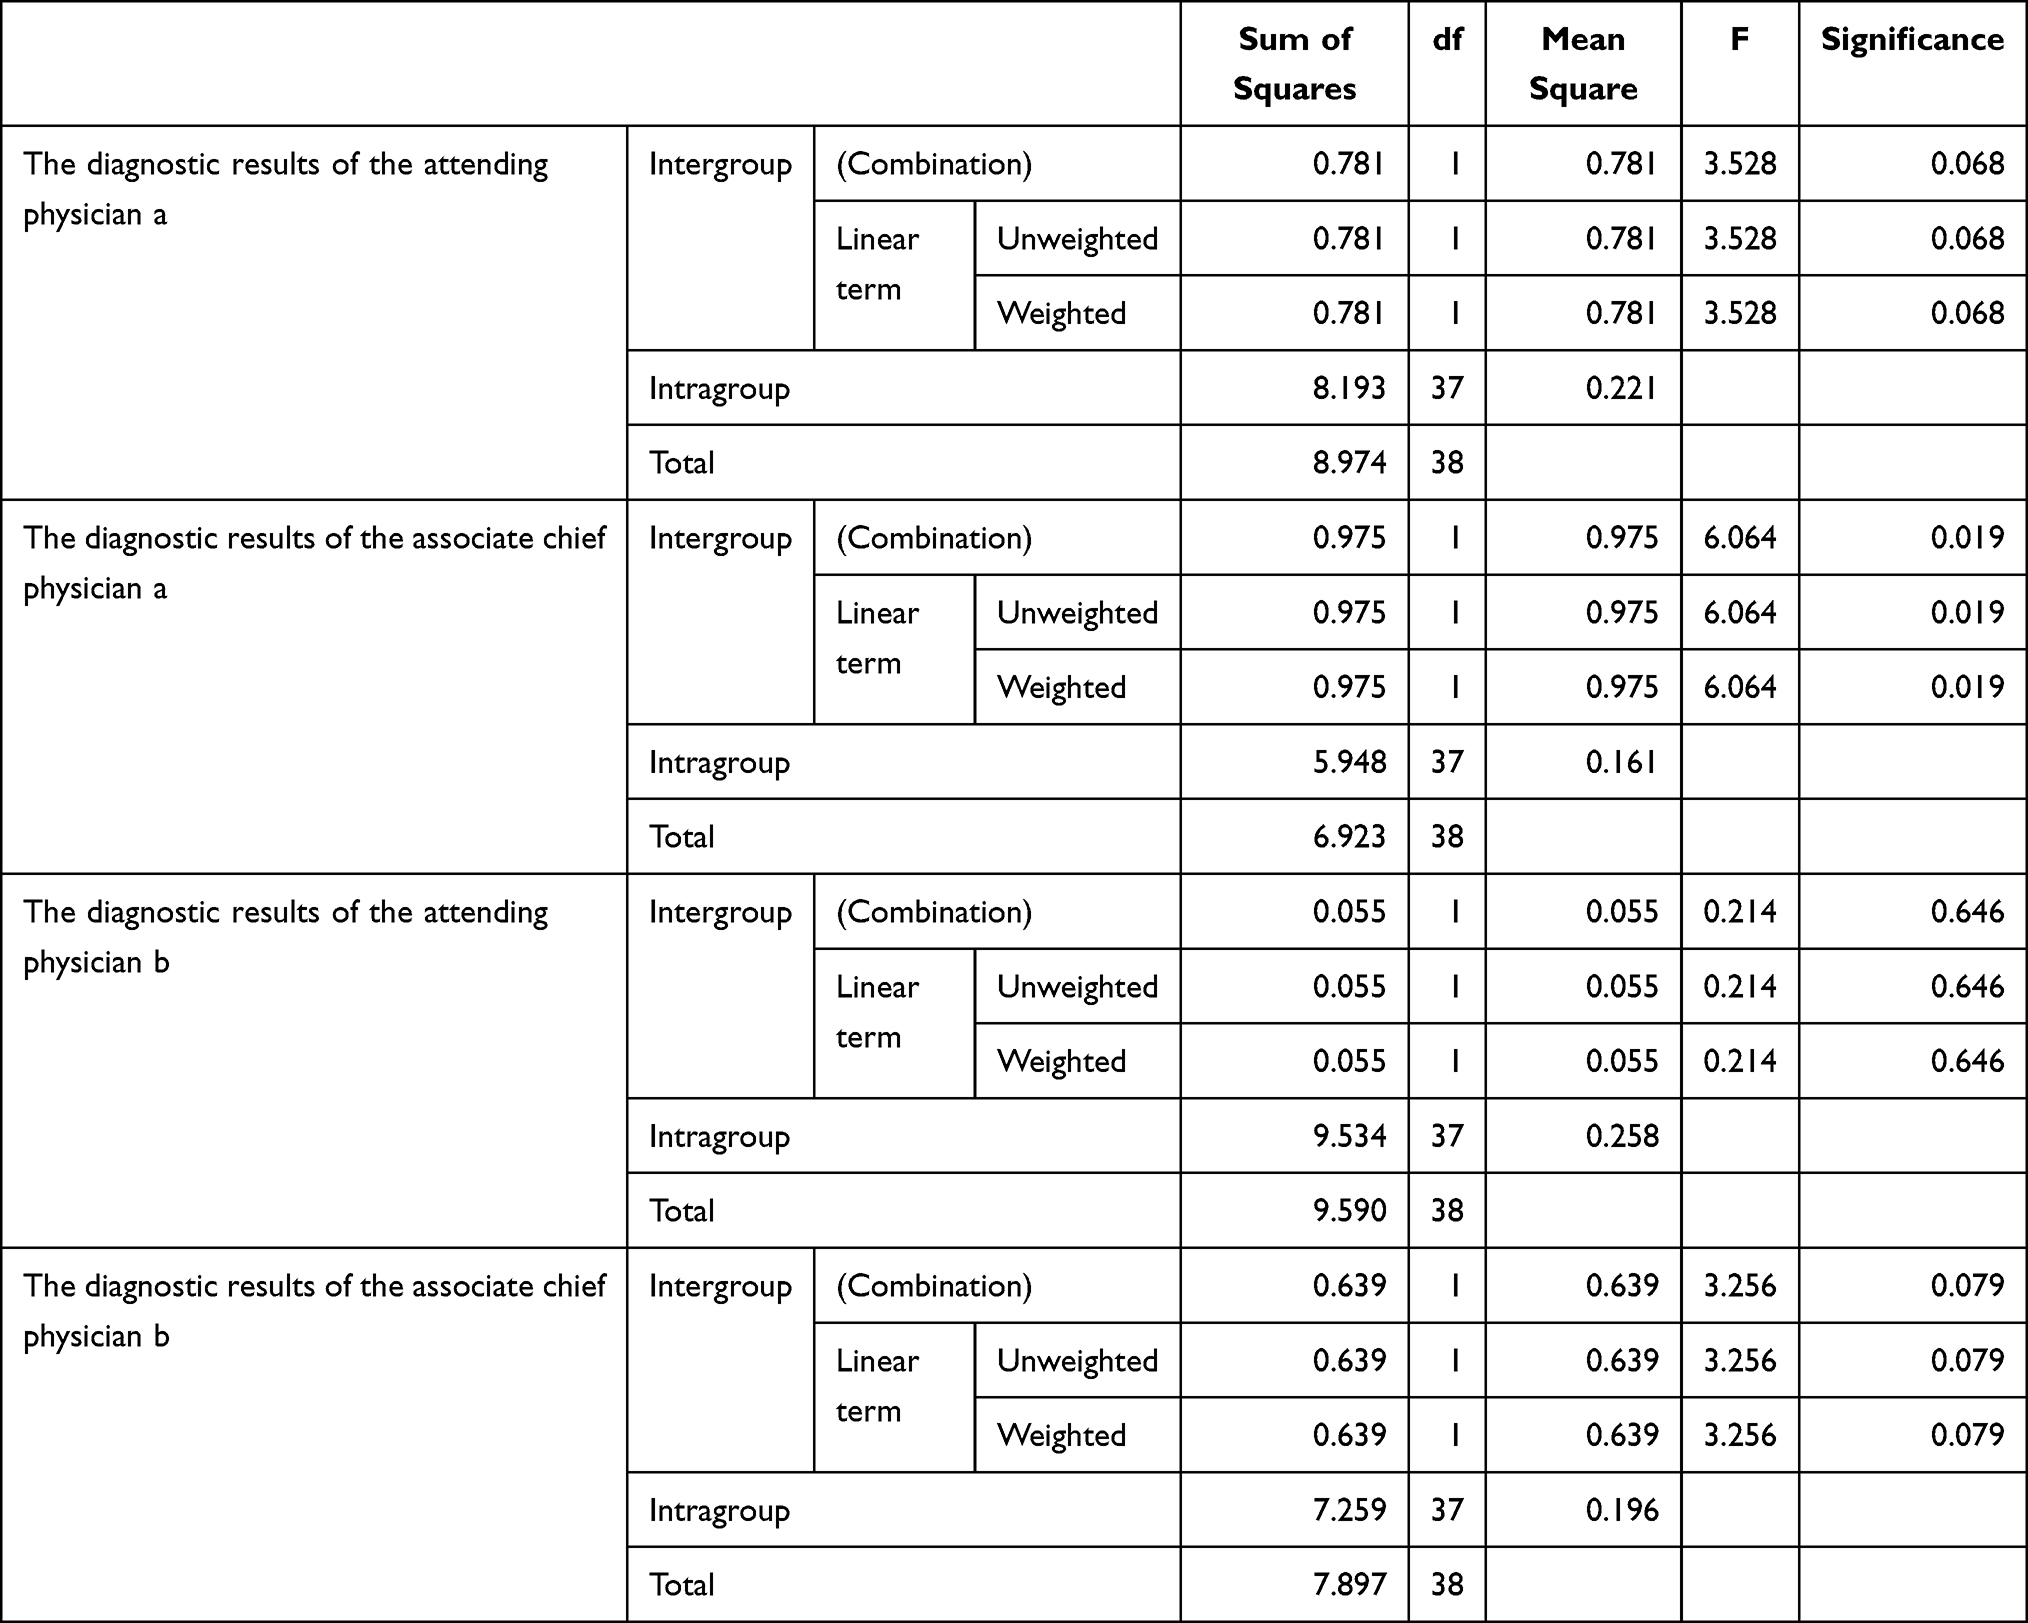 |
Table 2 The Results of ANOVA Between Groups for the Four Physicians |
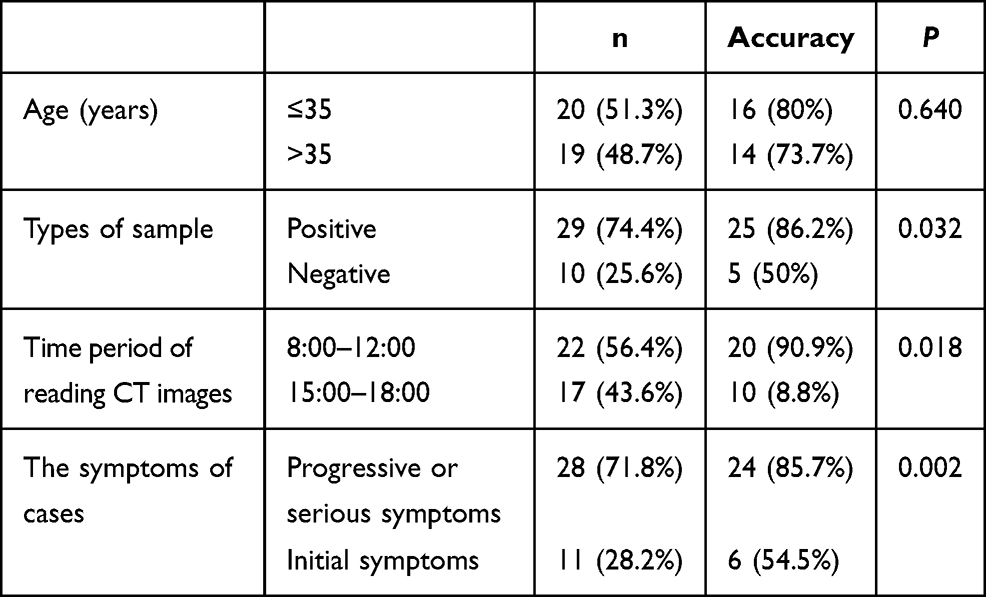 |
Table 3 The Results of Chi-squared Test for Every Factor was Performed on the Associate Chief Physician a |
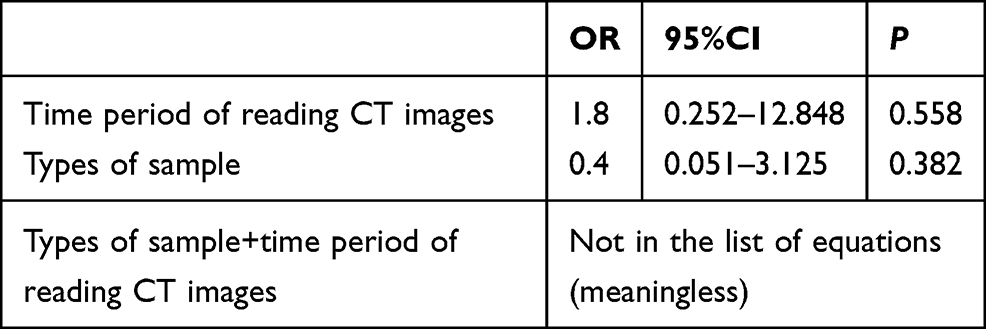 |
Table 4 Multivariate Analysis of the Diagnostic Results for the Associate Chief Physician a |
Discussion
In this study, the AI system developed by us could quickly and effectively mark the pneumonia lesions area (Figure 1 and Table 1). Under the current epidemic prevention and control, the AI system was expected to improve the efficiency of front-line imaging diagnosis, accurately and timely screen out suspected patients, accelerate the patient’s examination, and reduce the risk of cross-infection in the hospital.
GGO is an important indicator in the diagnosis of COVID-19.13 Research by academic organizations such as the Radiology Committee on Infectious and Inflammatory Disease showed that the imaging manifestations of COVID-19 are: in the early stage of the disease, the CT images of the chest are atypical, and the lesions are thin patches of GGO, of which most are scattered in the middle and low lung fields, especially under the pleura. In the progressive stage, there are many lesions which are characterized by GGO exudation, fusion or consolidation, they commonly appeared in the outer zone of the lung field, and may be accompanied by a small amount of pleural effusion. In the severe stage (critically ill), it is the late stage of the disease, and the density of both lungs diffusely and extensively increased further.14,15 Therefore, in clinical practice, if GGO in the lungs can be marked quickly and accurately, it can help the radiologist to quickly find the lesion area and make judgments on the lesion, and save the time and extra physical energy spent on other irrelevant slices. Table 1 showed that the time spent on the diagnosis in the experimental group was significantly less than that in the control group, which resulted from the model’s good segmentation of pneumonia lesions. The statistical analysis in Table 1 confirmed the accurate segmentation of “suspected pneumonia lesions” by the mathematical model of the AI system, and its Dice score was 0.89±0.04. In the field of image processing, Dice >0.7 was considered a better segmentation. Therefore, the correct diagnosis could be guaranteed, only if the high accuracy of automatically finding and marking the lesions by the AI system was achieved, which could be evidenced from the statistical analysis of the diagnostic accuracy rate in the experimental group and the control group: attending physician a with 64.1%, associate chief physician a with 76.9%, attending physician b with 56.4%; associate chief physician b with 71.8%. The area under curves (AUCs) of the attending physician a, the assistant chief physician a, the attending physician b and the assistant chief physician b were 0.562 (95%CI: 0.35–0.78), 0.681 (95%CI: 0.47–0.89), 0.543 (95%CI: 0.33–0.75) and 0.647 (95%CI: 0.44–0.86), which might be caused by the small sample size and, radiologists’ ability, segmentation accuracy of the network, and so on. In future study, a large sample size and more radiologists with high professional competence are necessary to train the network and improve the segmentation accuracy of the network. Uzelaltinbulat et al16 used the method of subtracting the threshold image to automatically segment various tumors in the lung, with a Dice score of 0.97, which is higher than that in this study. The reason might be that lung GGO has unclear edges and burrs, so that it was much more difficult to segment the edges than the tumors. Even so, the research of Uzelaltinbulat et al told us that our model still has room for improvement to increase the segmentation accuracy.
So far, there have been ten well-known convolutional neural networks used to screen and evaluate COVID-19 based on the CT images: AlexNet, VGG-16, VGG-19, SqueezeNet, GoogleNet, MobileNet-V2, ResNet-18, ResNet-50, ResNet-101, and Xception, and especially the ResNet-101 and Xception had very high sensitivity and specificity, with an AUC of 0.994 and AUC of 0.994, respectively (Supplemental Table 1).17 Compared with the above networks, our network in the comparative test of this paper did not perform very well, which meant a lot of effort will be necessary in the future study to improve the network.
For the radiologist, the patients’ own condition and other external environments did not have much influence on the diagnostic results. Tables 3 and 4 showed that the two variables had no significant effects on the diagnostic result. The research team performed a strong interaction analysis of the two variables, which showed that the strong interaction of the two variables did not have a significant effect on the diagnostic results. Therefore, what affected the accuracy of the diagnosis was the constants that the researchers did not include: help of the AI system, epidemiological history and personal qualifications. With the help of the AI system, the radiologist can improve the accuracy of their diagnosis. When diagnosing a disease, it was also necessary to comprehensively observe the growth area of the lesion. Many studies showed that GGO in COVID-19 commonly occurred in the subpleural region of the lung.18 Therefore, the occurrence area of GGO was also one of the important characteristics to diagnose COVID-19. The study by Shi et al showed that the typical GGO appeared in the CT of COVID-19 patients and the thickened and bright outlines of the trachea and blood vessels could be observed in GGO, which meant that the contours of the trachea and blood vessels were much clearer in GGO imaging.19,20 A study stated that the trachea with air bronchogram could be observed in the lungs of the dead caused by COVID-19.21 Therefore, careful observation of whether trachea with air bronchogram and the blood vessels with vascular enlargement in GGO existed or not22 was another favorable evidence for the diagnosis of COVID-19. The HU value directly reflects the physical density of the tissue in the body, and a study by Chen et al23 showed that compared with the GGO of other pneumonia, the GGO of COVID-19 was more blurred and had uneven density. Therefore, in the diagnosis of COVID-19, whether the HU value of the GGO was uniform or not was also a reference feature. Except for the imaging characteristic of the air bronchogram, the above information could be directly reflected in the AI system, so the results in Tables 3 and 4 could be obtained, which proved that the AI system did have certain clinical value.
A key point in the clinical diagnosis of COVID-19 was the evaluation of the progress of GGO. Whether the volumetric progress of GGO exceeded 50% or not within 24 h was one of the indicators that the radiologist needed to consider. In the study of academic organizations such as the Radiology Committee on Infectious and Inflammatory Disease, it was also stated that the “white lung” of COVID-19 could increase by more than 50% during 24–48 h in the severe stage. At this stage, it was difficult to treat, and the patient’s mortality rate was high.13 Therefore, dynamic analysis of the volume of GGO is important for clarifying the stage of the disease.24 The AI system developed by us could clearly show the radiologist a useful GGO volume value through automatic segmentation. According to incomplete statistics, it takes about two hours for an experienced radiologist from finding GGO to delineating its volume, which is much higher than the time spent with the help of the AI system. Therefore, the precise GGO volume given by the AI system quickly can help the radiologist to diagnose the disease and know about the changes of the disease.
However, the sample size of this study was not very large, so the model and algorithm were not perfect enough to directly give the diagnosis of COVID-19. The research was carried out only in two institutions, and lacked multicenter data. Therefore, our research has some limitations, which require further improvement and more effort in the future.
Conclusion
Early detection and diagnosis of COVID-19 is the key, and the AI system we developed can quickly provide the radiologist with the position of lesions, dynamic volume changes, GGO internal organ morphology, the HU value of the lesion and so on. These quantitative indicators can help the radiologist to do the diagnosis combined with the epidemiological history and their own knowledge and experience, which could make it easier for the radiologist to recognize COVID-19 from other diseases, and give a red warning to suspected patients.
Therefore, this AI system will play a very important role in accelerating clinical diagnosis, assisting young doctors in improving their diagnosis, and improving the accuracy of clinical diagnosis.
Funding
This study was supported by: Science and Technology Funding Project of Chenzhou City, Hunan Province China (No. ZDYF2020165) (Qing Li). Science and Technology Funding Project of Chenzhou City, Hunan Province China (No. ZDYF2020167) (Hui Xie). Science and Technology Funding Project of Hunan Province, China (No. 2020SK52201) (Hui Xie).
Disclosure
The authors report no conflicts of interest in this work.
References
1. Xu X, Yu C, Qu J, et al. Imaging and clinical features of patients with 2019 novel coronavirus SARS-CoV-2. Eur J Nucl Med Mol Imaging. 2020;47:1275–1280.
2. World Health Organization. Available from: https://www.who.int/zh/emergencies/diseases/novel-coronavirus-2019.
3. Stop the Wuhan virus. Nature. 2020;577(7791):450. doi:10.1038/d41586-020-00153-x
4. Available from: https://www.who.int/emergencies/diseases/novel-coronavirus-2019.
5. Zhao S, Lin Q, Ran J, et al. Preliminary estimation of the basic reproduction number of novel coronavirus (2019-nCoV) in China, from 2019 to 2020: a data-driven analysis in the early phase of the outbreak. Int J Infect Dis. 2020;92:214–217. doi:10.1016/j.ijid.2020.01.050
6. Tentative 5th edition of the diagnosis and treatment protocol for COVID-19 patients. Chin J Integr Trad Chin West Med. 2021;1–3. Available from: http://kns.cnki.net/kcms/detail/11.2787.R.20200208.1034.002.html. Accessed March 16, 2021.
7. Pham TD. A comprehensive study on classification of COVID-19 on computed tomography with pretrained convolutional neural networks. Sci Rep. 2020;10(1):16942. doi:10.1038/s41598-020-74164-z
8. Chen J, Lianlian W, Zhang J, et al. Deep learning-based model for detecting 2019 novel coronavirus pneumonia on high-resolution computed tomography: a prospective study. medRxiv. 2020. doi:10.1101/2020.02.25.20021568
9. Alakus TB, Turkoglu I. Comparison of deep learning approaches to predict COVID-19 infection. Chaos Solitons Fractals. 2020;140:110120. doi:10.1016/j.chaos.2020.110120
10. Abbasian Ardakani A, Acharya UR, Habibollahi S, Mohammadi A. COVIDiag: a clinical CAD system to diagnose COVID-19 pneumonia based on CT findings. Eur Radiol. 2021;31(1):121–130. doi:10.1007/s00330-020-07087-y
11. Ronneberger O, Fischer P, Brox T. U-Net: Convolution Networks for Biomedical Image Segmentation. Medical Image Computing and Computer-Assisted Intervention (MICCAI); 2015:234–241. Available from: https://www.researchgate.net/publication/276923248_U-Net_Convolutional_Networks_for_Biomedical_Image_Segmentation.
12. Tentative 7th edition of the diagnosis and treatment protocol for COVID-19 patients. [J/OL]. Available from: http://www.nhc.gov.cn/xcs/zhengcwj/202003/46c9294a7dfe4cef80dc7f5912eb1989/files/ce3e6945832a438eaae415350a8ce964.pdf.
13. Xie X, Zhong Z, Zhao W, Zheng C, Wang F, Liu J. Chest CT for typical coronavirus disease 2019 (COVID-19) pneumonia: relationship to negative RT-PCR testing. Radiology. 2020;296(2):E41–E45. doi:10.1148/radiol.2020200343
14. Specialized Committee of Infection and Inflammatory Radiology of Chinese Research Hospital Association; Chinese Association for Prevention and Control of STD/AIDS Infection (Infectious Diseases) Image Working Committee; Infectious Diseases Group, Radiology Society of Chinese Medical Association; Infectious Imaging Professional Committee of Radiologist Branch of Chinese Medical Doctor Association; Infectious Disease Imaging Group, Infectious Disease Branch, Chinese Hospital Association; Infectious Diseases Group of General Radiological Equipment Committee of China Equipment Association. Beijing Imaging Treatment Technology Innovation Alliance. Guideline for medical imaging in auxiliary diagnosis of coronavirus disease 2019. Chin J Med Imaging Technol. 2020;1–11. doi:10.13929/j.issn.1003-3289.2020.03.001
15. Lei J, Li J, Li X, et al. CT imaging of the 2019 novel coronavirus (2019-nCOV) pneumonia. Radiology. 2020;295(1):18
16. Uzelaltinbulat S, Ugur B. Lung tumor segmentation algorithm. Procedia Comput Sci. 2017;120:140–147. doi:10.1016/j.procs.2017.11.221
17. Ardakani AA, Kanafi AR, Acharya UR, Khadem N, Mohammadi A. Application of deep learning technique to manage COVID-19 in routine clinical practice using CT images: results of 10 convolutional neural networks. Comput Biol Med. 2020;121:103795. doi:10.1016/j.compbiomed.2020.103795
18. Song F, Shi N, Shan F, et al. Emerging 2019 novel coronavirus (2019-nCoV) pneumonia. Radiology. 2020;295(1):210–217.doi:10.1148/radiol.2020200274
19. Shi HS, Han XY, Fan YQ, et al. Radiologic features of patients with 2019-nCoV infection. J Clin Radiol. 2020;39:8–11. doi:10.13437/j.cnki.jcr.20200206.002
20. Huang C, Wang Y, Li X, et al. Clinical features of patients infected with 2019 novel coronavirus in Wuhan, China. Lancet. 2020;395(10223):497–506. doi:10.1016/S0140-6736(20)30183-5
21. Liu Q, Wang SR, Qu GQ, Wang YY, Liu P, Zhu YZ, Fei G, Ren L, Zhou YW, Liu L. Reports of systematic authopsy for the dead caused by COVID-19. Journal of Forensic Medicine 2020;36(01):21-23. doi:10.12116/j.issn.1004-5619.2020.01.00
22. Chung M, Bernheim A, Mei X, et al. CT imaging features of 2019 novel coronavirus (2019-nCoV). Radiology. 2020;295(1):202–207. doi:10.1148/radiol.2020200230
23. Chen N, Zhou M, Dong X, et al. Epidemiological and clinical characteristics of 99 cases of 2019 novel coronavirus pneumonia in Wuhan, China: a descriptive study. Lancet. 2020;395(10223):507–513. doi:10.1016/S0140-6736(20)30211-7
24. Pan F, Ye T, Sun P, et al. Time course of lung changes at chest CT during recovery from coronavirus disease 2019 (COVID-19). Radiology. 2020;295(3):715–721. doi:10.1148/radiol.2020200370
 © 2021 The Author(s). This work is published and licensed by Dove Medical Press Limited. The
full terms of this license are available at https://www.dovepress.com/terms
and incorporate the Creative Commons Attribution
- Non Commercial (unported, 3.0) License.
By accessing the work you hereby accept the Terms. Non-commercial uses of the work are permitted
without any further permission from Dove Medical Press Limited, provided the work is properly
attributed. For permission for commercial use of this work, please see paragraphs 4.2 and 5 of our Terms.
© 2021 The Author(s). This work is published and licensed by Dove Medical Press Limited. The
full terms of this license are available at https://www.dovepress.com/terms
and incorporate the Creative Commons Attribution
- Non Commercial (unported, 3.0) License.
By accessing the work you hereby accept the Terms. Non-commercial uses of the work are permitted
without any further permission from Dove Medical Press Limited, provided the work is properly
attributed. For permission for commercial use of this work, please see paragraphs 4.2 and 5 of our Terms.