Back to Journals » Clinical Interventions in Aging » Volume 17
Healthy Ageing Reflected in Innate and Adaptive Immune Parameters
Authors Munteanu AN ![]() , Surcel M
, Surcel M ![]() , Isvoranu G, Constantin C
, Isvoranu G, Constantin C ![]() , Neagu M
, Neagu M ![]()
Received 23 May 2022
Accepted for publication 6 September 2022
Published 13 October 2022 Volume 2022:17 Pages 1513—1526
DOI https://doi.org/10.2147/CIA.S375926
Checked for plagiarism Yes
Review by Single anonymous peer review
Peer reviewer comments 3
Editor who approved publication: Dr Maddalena Illario
Adriana Narcisa Munteanu,1,2 Mihaela Surcel,1 Gheorghița Isvoranu,1 Carolina Constantin,1,3 Monica Neagu1– 3
1Immunology Laboratory, Victor Babes National Institute of Pathology, Bucharest, 050096, Romania; 2Doctoral School of Biology, Faculty of Biology, University of Bucharest, Bucharest, 050095, Romania; 3Department of Pathology, Colentina University Hospital, Bucharest, 020125, Romania
Correspondence: Monica Neagu, Immunology Laboratory, Victor Babes National Institute of Pathology, 99-101 Splaiul Independentei, Bucharest, 050096, Romania, Tel/Fax +4021-3194528, Email [email protected]
Purpose: The aim of the paper is to establish and quantify the relation between healthy ageing and the innate and adaptive immune parameters as indicators of age-related diseases.
Patients: In order to observe the immunological changes that occur according to age, several humoral and cellular immune parameters were investigated for 288 healthy donors (30– 80 years). Subjects’ selection was done using clinical, biochemical and immunological parameters of inclusion/exclusion criteria from SENIEUR protocol.
Results: Age-related changes were observed for both humoral and cellular immune parameters. Lymphocyte immunophenotyping revealed several significant differences in the distribution of cells, both intra- and inter-age groups, namely decreased values of T-CD3+, T-CD8+ and NK cells, and elevated values for T-CD4+, T-CD4+/T-CD8+ ratio and B cells. The percentages of unstimulated neutrophils that show basal oxidative activity and the intensity of this activity had an increasing tendency age-related. The percentage of N-Formyl-Methionyl-Leucyl-Phenylalanine stimulated neutrophils clearly decreases with age, and is associated with an increasing intensity of oxidative activity. Our data also have shown an increased percentage of oxidative neutrophils after phorbol 12-myristate 13-acetate stimulation and an elevated oxidative activity with age.
Conclusion: Overall healthy ageing is governed by some immune-related deregulations that account for immune exhaustion due to numerous developed immune processes during a life-time and the age-related diseases.
Keywords: age-related, lymphocyte immunophenotyping, neutrophils, oxidative activity
Introduction
Globally, there is a fast growing of the elderly population in developed countries, and the healthcare burden faces increased issues regarding morbidity from infection, a declining response to vaccination and overall, an increased incidence of inflammatory diseases and malignancies. The reasons for these effects are clearly complex, but reduced efficiency of the innate and adaptive immune system is likely to be important in the pathology of old age.1,2
During the lifetime, the immune system undergoes profound reshaping culminating with immune senescence, process that has a major impact on health and survival. The mechanisms responsible for these age-related changes in innate and adaptive immunity are not fully elucidated, and their understanding may lead to the development of better strategies to overcome them.3
The quantification of cellular immune parameters in order to establish the phenotypic changes in lymphocyte populations and subpopulations is crucial in diagnosis, monitoring and prognosis of many disorders, the most representative being immunodeficiency, autoimmune diseases, transplant rejection, allergies, and leukemia. The evolution of cellular immune parameters distribution during the lifetime in healthy population has been in the attention of researchers for many years but the obtained results significantly differ depending on race, geographical area, sex, chosen age ranges, lifestyle, genetics and probably many other unknown factors. Several immunological age-related changes associated to adaptive immune system are well described: the decrease of naive peripheral T cells (particularly T-CD8+),4 increase of peripheral CD4+ and CD8+ memory T cells,5 decrease in naive B cell production and an increasing oligoclonal B cell repertoire,6 resulting in an altered responsiveness to novel antigens.
As age-related alterations within the adaptive immune system are better documented, in contrast, the innate immune system has been less researched so that the perception amongst many immuno-gerontologists is that this branch of the immune system is only slightly affected by age. However, it is becoming increasingly clear that the adaptive and innate immune systems cooperate at several levels to ensure the optimal immune response and any decline in adaptive immunity will impact on the function of the innate immune system and vice versa.7
In an ageing individual, the vulnerability to infections can be the consequence of a reduced number of neutrophils arriving at the inflammatory site or decrease of the intrinsic antibacterial activity, hence, with age the response to infection and vaccination decreases.7 For example, in the COVID-19 vaccination protocols, it was shown a reduction in both antibody responses and mild to moderate adverse events in older people compared to younger subjects.8 Studies on the actual number of neutrophils from the inflammatory site in correlation with age of subjects are scarce. There are studies that show that in aged subjects the wound healing is delayed due to less neutrophils that are infiltrating the wounded area.9 Elderly individuals can develop a normal neutrophil response to bacterial infection. The number of circulating neutrophils from elderly in the 66–93 years’ range is 2.0–7.5 x 10⁹/L, values that are in the normal range.7 During infections, elderly subjects may develop severe neutropenia that is contributing to the chronic status,10 findings that are suggesting that the production of neutrophils during persistent infections is affected when a body is already old.
All the gathered data support the theory called “Inflamm-aging”11 in which the basal oxidative activity phenomenon is due to an antigenic load over many decades and it is detrimental to longevity.12 The presented study evaluates a panel of parameters from the adaptive and innate immunity compartments accompanying healthy ageing to identify the physiological ageing effect upon the capacity to develop a proper immune response and hence to avoid age-related pathologies from cancer to neurodegenerative diseases. Therefore, in around 300 healthy subjects spanning the three adult stage ages we have evaluated innate functionality of peripheral phagocytes and adaptive immune cell circulatory populations and subpopulations to depict the immune ageing decline.
Materials and Methods
Study Population
The observational study included healthy donors aged between 30 and 80 years (1:1 gender ratio), enrolled in the time range 2017–2019; all the subjects were fully informed of the study procedures before they gave their consent. Thus, the subjects were explained the purpose of the study, namely evaluating immune parameters in relation to healthy ageing, they were explained that blood sampling will be done in one session for all the tested parameters, the subjects were explained that individual results can be forwarded to their GP physician if chosen in the consent form. The subjects were encouraged to participate as all the performed tests were done with IVD kits, hence all the obtained results can serve as medical information to their GP physician. The subjects were divided into three groups: group 30–45 yo* – subjects of 30–45 years (n = 113; n = number of subjects; 55 females, 58 males); group 46–59 yo – subjects of 46–59 years (n = 94; 48 females, 46 males); group 60–80 yo – subjects of 60–80 years (n = 81; 40 females, 41 males) (* years old). All subjects have Romanian citizenship and were geographically located only in the Southern part of the country; in 30–45 yo and 46–59 yo groups, 80% of subjects were employed at the moment of sampling; in 60–80 yo group, 90% were already retired at the moment of sampling.
All groups were established according to the selection criteria from SENIEUR protocol developed in the 80s.13 This international protocol used in gerontology studies provides the selection of apparently healthy subjects without major pathological conditions, obeying specific clinical, haematological, biochemical, immunological and pharmacological criteria. For subjects under 65 years of age, the values of the biochemical parameters were related to the normal reference values corresponding to age, and for subjects over 65 years the reference values from the SENIEUR protocol were used.
Biological Samples and Measurements
Peripheral blood samples were collected by venipuncture during morning hours in K2-EDTA and Li-Heparin coated tubes and anticoagulant-free tubes (Vacutest Kima, Arzergrande, Italy). Serum samples were separated by centrifugation and whole blood samples were processed within 4 hours of blood collection. Blood collection was done in Ana Aslan Institute for Geriatrics and Gerontology and in National Institute of Haematology and Transfusion, Bucharest, Romania.
Besides SENIEUR selection criteria, all subjects were tested for several immunological parameters. Serum levels of immunoglobulins (Ig), complement (C) fractions C3 and C4 were determined by nephelometry (Minineph, The Binding Site, UK): IgG (Minineph Human IgG Kit, The Binding Site, UK), IgA (Minineph Human IgA Kit, The Binding Site, UK), IgM (Minineph Human IgM Kit, The Binding Site, UK), C3 (Minineph Human C3 Kit, The Binding Site, UK) and C4 (Minineph Human C4 Kit, The Binding Site, UK). All procedures were done according to the manufacturer of kits and all the obtained data were compared to the reference intervals provided by the kits.14
White blood cells (WBC), percentages and absolute counts (abs) of lymphocytes and granulocytes were determined by complete blood count (CBC) (ABX MICROS 60 haematology analyzer, Horiba ABX SAS, Montpellier, France) according to manufacturer and previous publication.15 The body mass index (BMI) of each subject was calculated using the following formula: weight per height2 (kg/m2). According to BMI parameter that is following the standard criteria, subjects were classified as normal weight (<25 kg/m2), overweight (25–30 kg/m2) or obese (>30 kg/m2).
Flow Cytometry Analysis
Lymphocytes Immunophenotyping
Lymphocytes immunophenotyping allows quantification by flow cytometry of three main lymphocyte subsets: T lymphocytes (CD45+CD3+), B lymphocytes (CD45+CD3−CD19+) and NK cells (CD45+CD3−CD16+CD56+) from whole hemolyzed blood, using BD Multitest IMK Kit (IVD) (Becton Dickinson). There were also quantified T-CD4+ (helper) and T-CD8+ (suppressor/cytotoxic) lymphocytes. For cells labelling, the whole peripheral blood (K2-EDTA coated tubes) was incubated with a mixture of monoclonal antibodies (CD3-FITC (clone SK7)/CD8-PE (clone SK1)/CD45-PerCP (clone 2D1, HLe-1)/CD4-APC (clone SK3) in the first tube, and CD3-FITC (clone SK7)/CD16+CD56-PE (clone B73.1 for CD16 and clone NCAM 16.2 for CD56)/CD45-PerCP (clone 2D1, HLe-1)/CD19-APC (clone SJ25C1) in the second tube) for 15–20 min at room temperature and dark, followed by red blood cell lysis (lysing solution provided by the kit) and flow cytometry analysis. Sample acquisition and data analysis were performed on a BD FACSCalibur cytometer with BD Multiset software (Becton Dickinson); daily check-up of cytometer performances was performed using BD Calibrite 3 Beads kit and BD Calibrite APC Beads (BD Biosciences) and BD FACSComp software (BD). T-CD4+ and T-CD8+ lymphocytes were gated from CD3+ lymphocytes and expressed as percentage of T-CD3+ lymphocytes. B and NK cells were gated from CD3− lymphocytes and expressed as percentage of lymphocytes. Procedure was done according to the manufacturer and the protocols provided by the kit.16 For absolute count of circulating cells, we also used the WBC and percentage of lymphocytes obtained from a haematology analyzer (ABX MICROS 60, Horiba ABX SAS, Montpellier, France).
Oxidative Activity of Peripheral Neutrophils
Quantification of the phagocytes’ oxidative activity (monocytes and neutrophils) was performed by flow cytometry from heparinized whole blood using BURSTTEST kit, Phagoburst, (IVD) (BD Pharmingen). The kit contains unlabeled opsonized E. coli bacteria, PMA and fMLP as particulate, high and low physiological stimuli. It quantifies the percentage of leukocytes (monocytes and neutrophils) which oxidize the fluorogenic substrate dihydrorhodamine (DHR123) to rhodamine 123, and their enzymatic activity (amount of rhodamine 123). The test was performed using BD FACSCalibur cytometer (Becton Dickinson) and CellQuest software (BD); daily check-up of cytometer performances was performed using BD Calibrite 3 Beads kit (BD Biosciences) and BD FACSComp software (BD). The percentage of cells that have produced ROS (% gated) and their oxidative activity (mean fluorescence, GeoMean) were analyzed. When presented as stimulation index, the results were compared to the given stimuli (fMLP, E. coli and PMA) based on unstimulated control samples (ratio between the values obtained for stimulated and unstimulated samples). Test was performed according to the manufacturer and published studies.17
Statistics
Data were analyzed using GraphPad Prism 9.4.0 (GrapfPad Software, San Diego, CA, US) and Microsoft Excel (Microsoft, Redmond, US) and the results are presented as means ± SD. The data were processed using ordinary one-way ANOVA with the application of Tukey’s multiple comparison test, and adjusted P – values were considered. The levels of statistical significance were considered at P < 0.05 as follows: * (P ≤ 0.05), ** (P ≤ 0.01), *** (P ≤ 0.001), **** (P ≤ 0.0001) and NS (P > 0.05). Pearson’ correlation coefficient (−1 < r <1) was used to determine the correlation between the parameters. A positive value of r shows a direct correlation between the two variables, and a negative value indicates an inverse correlation. If r value is closer to ±1, the correlation is considered stronger. Depending on the parameter, the results are presented as absolute values, percentage or indexes calculated to control.
Results
Healthy subjects (aged between 30 and 80 years) were divided into three age groups according to previous published studies regarding the stages of human adulthood.18,19 The groups were investigated and the results are presented in Supplementary Tables 1–6
Immunological Standard Parameters
Although the humoral parameters’ mean values were in normal ranges for all tested groups, significant age-related differences were found (Supplementary Tables 1–2) When comparing 30–45 yo and 60–80 yo groups, significant differences were obtained for IgG (P = 0.0263), IgM (P = 0.0008), and C3 (P = 0.0048) values.
For IgA and C4 values, no statistically significant differences were obtained between the tested groups. Hence, all Igs, no matter the classes, and serum complement values are lower in aged groups compared to young adults. Significant differences between 30–45 yo and 60–80 yo groups were also obtained for WBC (P = 0.0104) (Supplementary Table 3, Figures 1 and 2). WBC values were found significant lower in the oldest group. A decreasing age-related trend was also observed for absolute counts of lymphocytes and granulocytes, but without statistical significance.
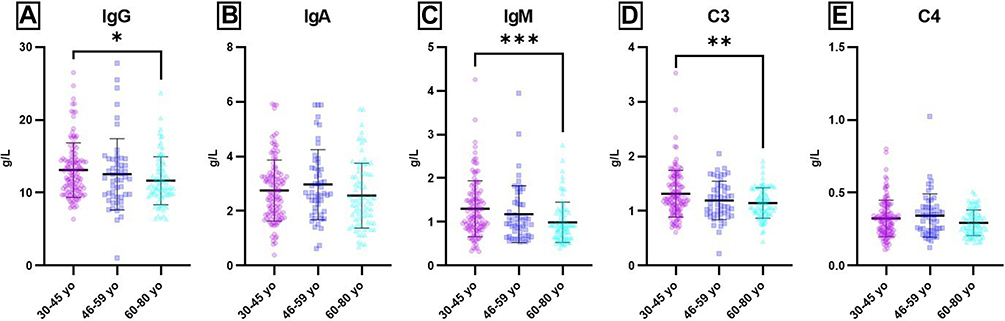 |
Figure 1 Age-related distribution of humoral parameters. Notes: Distribution of individual values for IgG (A), IgA (B), IgM (C), C3 (D) and C4 (E) in 30–45 yo (13.11 ± 3.74; 2.78 ± 1.22; 1.30 ± 0.64; 1.31 ± 0.43; 0.32 ± 0.13) (n = 113), 46–59 yo (12.54 ± 4.90; 2.97 ± 1.29; 1.18 ± 0.65; 1.19 ± 0.35; 0.34 ± 0.15) (n = 94) and 60–80 yo (11.66 ± 3.31; 2.56 ± 1.19; 0.99 ± 0.46; 1.15 ± 0.28; 0.29 ± 0.09) (n = 81) groups. The results are presented as individual values with mean ± SD; n = number of subjects. * P ≤ 0.05, ** P ≤ 0.01, *** P ≤ 0.001. |
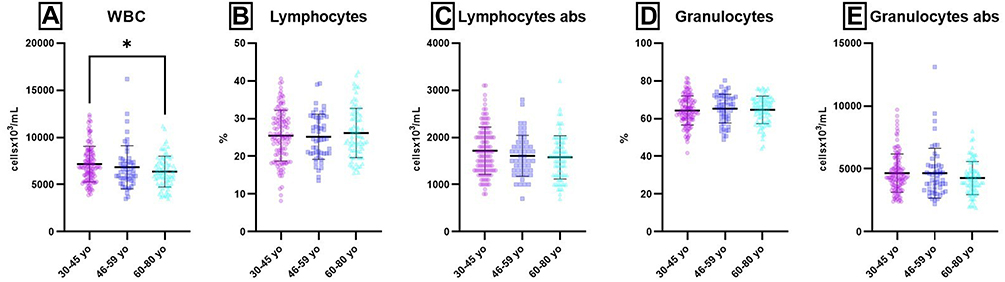 |
Figure 2 Age-related distribution of CBC parameters. Notes: Distribution of individual values for WBC (A), Lymphocytes (%) (B), Lymphocytes abs (C), Granulocytes (D) and Granulocytes abs (E) in 30–45 yo (7.17 ± 1.90; 25.48 ± 6.75; 1.72 ± 0.50; 64 ± 8; 4662 ± 1515) (n = 113), 46–59 yo (6.84 ± 2.30; 25.19 ± 5.99; 1.61 ± 0.44; 65 ± 8; 4652 ± 1979) (n = 94) and 60–80 yo (6.38 ± 1.63; 26.19 ± 6.54; 1.58 ± 0.46; 65 ± 7; 4269 ± 1315) (n = 81) groups. The results are presented as individual values with mean ± SD; n = number of subjects. WBC and Lymphocytes abs were expressed as cellsx106/mL; Granulocytes abs were expressed as cellsx103/mL. *P ≤ 0.05. |
BMI was significantly different for 30–45 yo group as compared to 46–59 yo (P = 0.0093) and 60–80 yo (P = 0.0201) groups (Supplementary Table 2). BMI is higher in aged groups compared to young adults.
Peripheral Adaptive Immune Cells
Flow-cytometry method was used for lymphocytes immunophenotyping and the tests revealed several age-related differences in the distribution of cells, both intra- and inter-age groups. Percentages and absolute counts for all lymphocyte populations are presented as mean values with standard deviations in Supplementary Table 1, as compared to normal values.18,20 Thus, for the 30–45 yo group, the majority of their cellular parameters mean values were within normal limits except for the percentage of T-CD8+ lymphocytes (30 ± 6 vs 31–40) and absolute count of NK cells (166 ± 109 vs 200–400), which were slightly lower than normal. T-CD8+ lymphocytes were strongly correlated with T-CD3+ (r = 0.63) and T-CD4+ (r = −0.54) (Supplementary Tables 1 and 6). The absolute count of lymphocytes was in normal limits and significantly positively correlated with T-CD3+ lymphocytes (r = 0.96) and B cells (r = 0.54). T-CD4+/T-CD8+ ratio was also slightly above the normal limit (1.6 ± 0.4, vs 1–1.5) and was strongly correlated to T-CD4+ (r = 0.78) and T-CD8+ (r = −0.89).
Changes in the cellular parameters’ values were observed with ageing. In 46–59 yo and 60–80 yo groups the lymphocyte distribution was similar. Increased mean values were obtained for T-CD4+ (%) (49 ± 8; 50±9 vs normal range 38–46), B cells (%) (18 ± 8; 18 ± 7 vs normal range 11–16) and T-CD4+/T-CD8+ ratio (2.3 ± 0.9; 2.5 ± 1.3 vs normal range 1–1.5). Decreased mean values were obtained for T-CD8+ (24 ± 7; 24 ± 9 vs normal range 31–40) and NK cells, in both percentages (9 ± 6; 7 ± 5 vs normal range 10–19) and absolute count (143 ± 116; 119 ± 105 vs normal range 200–400) (Supplementary Table 1). For both groups, the absolute count of lymphocytes was in normal limits and significantly positively correlated with T-CD3+ lymphocytes (r = 0.80, respectively, r = 0.93) and B cells (r = 0.58, respectively, r = 0.53); T-CD4+/T-CD8+ ratio was strongly correlated to T-CD4+ (r = 0.67, respectively, r = 0.74) and T-CD8+ (r = - 0.80, respectively, r = - 0.88) (Supplementary Table 6).
When compared the age-related distribution of lymphocytes, significant differences were obtained for all parameters, except for T-CD4+ lymphocytes and B cells (absolute counts for both) (Figure 3 and Supplementary Tables 4 and 5).
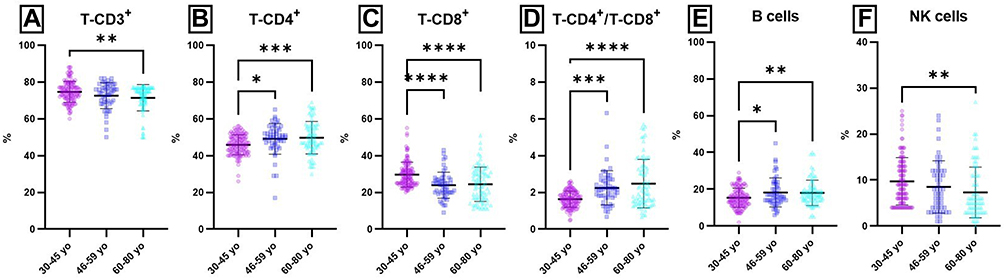 |
Figure 3 Age-related distribution of lymphocytes populations and subpopulations (percentages) from peripheral blood. Notes: Distribution of individual values for T-CD3+ (A), T-CD4+ (B), T-CD8+ (C), T-CD4+ / T-CD8+ (D), B (E) and NK cells (F) in 30–45 yo group (75 ± 6; 46 ± 5; 30 ± 6; 1.6 ± 0.4; 15 ± 5; 10 ±5) (n = 113), 46–59 yo group (72 ± 9; 49 ± 8; 24 ± 7; 2.3 ± 0.9; 18 ± 8; 9 ± 6) (n = 94) and 60–80 yo group (71 ± 8; 50 ± 9; 24 ± 9; 2.5 ± 1.3; 18 ± 7; 7 ± 5) (n = 81). The results are presented as individual values with mean ± SD; n = number of subjects.: * P ≤ 0.05, ** P ≤ 0.01, *** P ≤ 0.001, **** P ≤ 0.0001. |
Thus, significant differences were obtained for several lymphocyte populations, T-CD3+ (P (30–45 yo/60–80 yo) = 0.0022), T-CD4+ P (30–45 yo/46–59 yo) = 0.0202; P (30–45 yo/60–80 yo) = 0.0007), T-CD-8+ P(30–45 yo/46–59 yo) < 0.0001; P(30–45 yo/60–80 yo) < 0.0001), B P (30–45 yo/46–59 yo) = 0.0181; P (30–45 yo/60–80 yo) = 0.0092) and NK cells P (30–45 yo/60–80 yo) = 0.0054). These differences were obtained mainly when the values obtained for young adults were compared to the values obtained for 46–59 yo and 60–80 yo groups. As a consequence of the changes observed in T lymphocytes subpopulation distribution with ageing, significant differences were also obtained for T-CD4+/T-CD8+ ratio P (30–45 yo/46–59 yo) = 0.0002; P (30–45 yo/60–80 yo) < 0.0001).
Age-related distribution for absolute counts of lymphocytes populations and subpopulations from peripheral blood revealed significant differences for T-CD3+ P (30–45 yo/60–80 yo) = 0.0418), T-CD8+ P (30–45 yo/46–59 yo) = 0.0005; P (30–45 yo/60–80 yo) < 0.0001) and NK cells P (30–45 yo/60–80 yo) = 0.0040) (Figure 4 and Supplementary Tables 4 and 5).
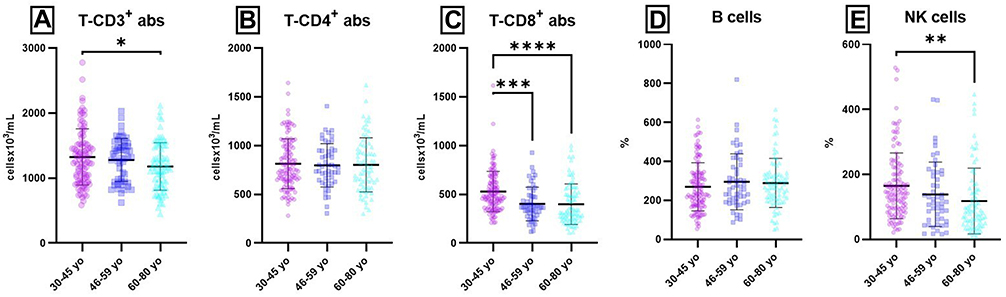 |
Figure 4 Age-related distribution of lymphocytes populations and subpopulations (absolute counts) from peripheral blood. Notes: Distribution of individual absolute count values for T-CD3+ (A), T-CD4+ (B), T-CD8+ (C), B (D) and NK cells (E) in 30–45 yo group (1326 ± 410; 814 ± 255; 529 ± 207; 269 ± 124; 166 ± 109) (n = 113), 46–59 yo group (1280 ± 333; 798 ± 222; 402 ± 172; 304 ± 184; 143 ± 116) (n = 94) and 60–80 yo group (1201 ± 3668; 810 ± 269; 399 ± 208; 289 ± 127; 119 ± 105) (n = 81). The results are presented as individual absolute values with mean ± SD; n = number of subjects; all cellular parameters were expressed as cellsx103/mL. * P ≤ 0.05, ** P ≤ 0.01, *** P ≤ 0.001, ****P ≤ 0.0001. |
There were also observed significant gender-related differences between the tested groups. Thus, females from 30–45 yo and 60–80 yo groups had statistically significant differences for T-CD-4+ (%) (P = 0.0015), T- CD8+ (% and abs) (P = 0.0018, respectively, P = 0.0006), T-CD-4+ / T-CD-8+ ratio (P < 0.0001), B (%) (P = 0.0028) and NK cells (% and abs) (P = 0.0012, respectively, P = 0.0008). When females from 46–59 yo and 60–80 yo groups were compared, statistically significant differences were observed only for T- CD8+ (% and abs) (P = 0.0124, respectively, P = 0.0031), B (%) (P = 0.002) and NK cells (abs) (P = 0.0191). In males, age-related differences were less obvious than in females. Thus, significant differences were observed for T-CD3+ (%) and T-CD-4+ / T-CD-8+ ratio when males from 30–45 yo and 60–80 yo groups were compared (P = 0.0043, respectively, P = 0.0402). When the younger groups (males) were compared (30–45 yo vs 46–59 yo) statistically significant differences were observed for T-CD8+ and T-CD-4+ / T-CD-8+ ratio (P = 0.0029, respectively, P = 0.0004).
Peripheral Innate Immune Cells
The main process that sustains the homeostasis of PMN is their oxidative activity. We have chosen to present only PMN’s oxidative activity as the other innate immune cells, eg, monocytes21 have low levels of oxidative activity even upon stimulation, hence the overall oxidative activity is mainly sustained by PMNs.
Un-Stimulated Oxidative Activity
The percentage of unstimulated peripheral blood PMN that show basal oxidative activity and the oxidative activity (amount of rhodamine 123) had an increasing trend with age (Figure 5), but without statistical significance.
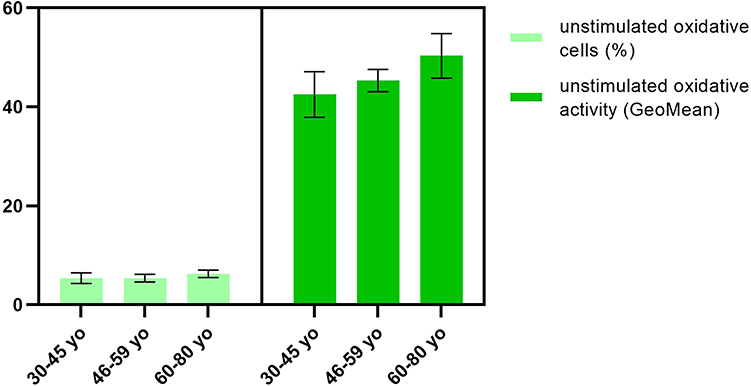 |
Figure 5 Unstimulated oxidative activity of PMN. Notes: Distribution of unstimulated oxidative cells (%) and oxidative activity (GeoMean) in 30–45 yo group (5.3 ± 1.1, respectively, 42.5 ± 4.8) (n = 113), 46–59 yo group (5.4 ± 0.7, respectively, 45.3 ± 2.3) (n = 94) and 60–80 yo group (6.3 ± 0.8, respectively, 50.3 ± 4.2) (n = 81). The results are presented as mean ± SD; n = number of subjects. |
Oxidative Activity Upon fMLP Stimulation
When in vitro stimulation of PMNs the recorded differences are more obvious. Hence, with ageing, the percentage of neutrophils that can respond and be activated by fMLP clearly decreases (12.6 ± 2.5 for group 1, 11.2 ± 1.6 for group 2, 9.9 ± 1.7 for group 3), although the differences between groups are not statistically significant (Figure 6). There was also observed an increasing tendency for the intensity of oxidative activity with age, so the older group (46.3 ± 3.5) has an oxidative activity more intense than younger groups (36.2 ± 1.9, respectively, 38.3 ± 1.6) (Figure 6).
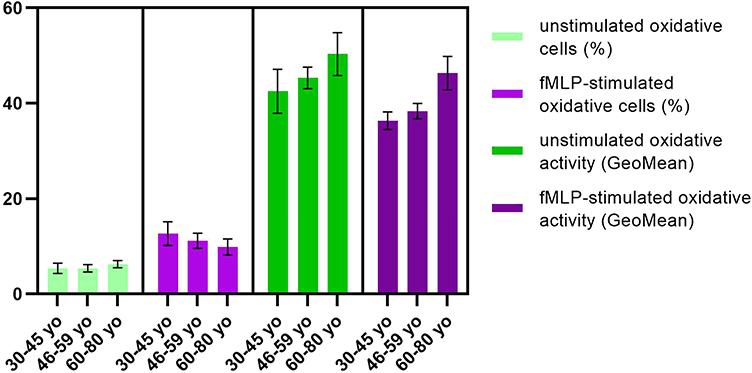 |
Figure 6 Oxidative activity upon fMLP stimulation. Notes: Distribution of fMLP-stimulated oxidative cells (%) and oxidative activity (GeoMean) in 30–45 yo group (12.6 ± 2.5, respectively, 36.2 ± 1.9) (n = 113), 46–59 yo group (11.2 ± 1.6, respectively, 38.3 ± 1.6) (n = 94) and 60–80 yo group (9.9 ± 1.7, respectively, 46.3 ± 3.5) (n = 81) as compared to unstimulated oxidative cells (%) and unstimulated oxidative activity (GeoMean). The results are presented as mean ± SD; n = number of subjects. |
The fMLP stimulation index (calculated for the percentage of oxidative cells) showed a statistically significant decrease with age (P30–45 yo/60–80 yo < 0.0001; P46–59 yo/60–80 yo = 0.0006) (Figure 7A).
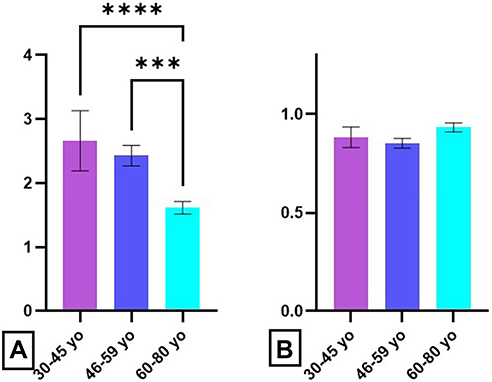 |
Figure 7 Age-related distribution of fMLP stimulation index. Notes: Stimulation index in presence of fMLP for oxidative cell percentage (A) and oxidative activity (B) in 30–45 yo group (2.7 ± 0.5 respectively 0.88 ± 0.05) (n = 113), 46–59 yo group (2.4 ± 0.2, respectively, 0.85 ± 0.02) (n = 94) and 60–80 yo group (1.7 ± 0.2, respectively, 0.93 ± 0.02) (n = 81). The results are presented as mean ± SD; n = number of subjects. *** P ≤ 0.001, **** P ≤ 0.0001. |
This decrease in the percentage of neutrophils that are fMLP responsive was accompanied by a slight increase of the oxidative activity, but the differences between groups are not statistically significant (Figure 7B).
Oxidative Activity Upon Opsonized E. Coli Stimulation
E. coli stimulation revealed a slight tendency to engage a higher percentage of neutrophils after stimulation with E. coli in 46–59 yo group (90.3 ± 5.1) as compared to 30–45 yo (78.8 ± 6.8) and 60–80 yo group (79.2 ± 12.5) (Figure 8).
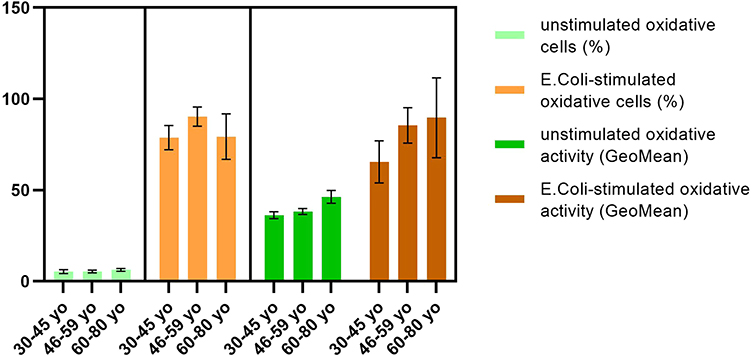 |
Figure 8 Oxidative activity upon E. coli stimulation. Notes: Distribution of E. coli-stimulated oxidative cells (%) and oxidative activity (GeoMean) in 30–45 yo group (78.8 ± 6.8, respectively, 65.7 ± 12.8) (n = 113), 46–59 yo group (90.3 ± 5.1, respectively, 85.8 ± 9.3) (n = 94) and 60–80 yo group (79.2 ± 12.5, respectively, 89.7 ± 24.4) (n = 81) as compared to unstimulated oxidative cells (%) and unstimulated oxidative activity (GeoMean). The results are presented as mean ± SD; n = number of subjects. |
For oxidative cells (%) were obtained statistically significant differences between 46–59 yo group and 30–45 yo group (P = 0.0083). The oxidative activity of neutrophils showed increased values for 46–59 yo (85.8 ± 9.3) and 60–80 yo group (89.7 ± 24.4) as compared to the youngest group (65.7 ± 12.8) (Figure 8).
The main change observed in the analysis of the E. coli stimulation index was the decrease of the values for 60–80 yo group (Figure 9A) but without statistical significance. Surprisingly, the oxidative activity does not change significantly with age (Figure 9B).
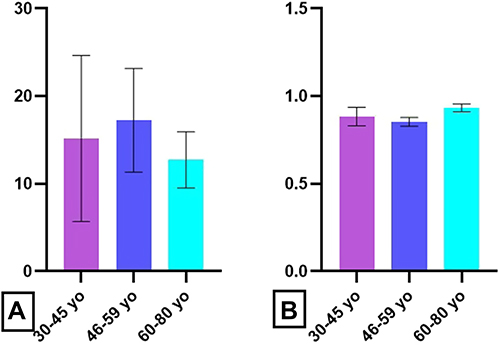 |
Figure 9 Age-related distribution of E. coli stimulation index. Notes: Stimulation index in presence of E. coli for oxidative cell percentage (A) and oxidative activity (B) in 30–45 yo group (15 ± 5, respectively, 1.6 ± 0.2) (n = 113), 46–59 yo group (17 ± 3, respectively, 1.9 ± 0.3) (n = 94) and 60–80 yo group (13 ± 2.5, respectively, 1.7 ± 0.0.25) (n = 81). The results are presented as mean ± SD; n = number of subjects. |
Oxidative Activity Upon PMA Stimulation
With ageing, an increased percentages of oxidative neutrophils (93.3 ± 5.1 for 30–45 yo group, 92.8 ± 3.4 for 46–59 yo group, 97.8 ± 1.2 for 60–80 yo group) was observed after PMA stimulation, although the differences between groups were not statistically significant (Figure 10). The oxidative activity was also higher in the oldest group (175.9 ± 43.8) as compared to 30–45 yo (131.6 ± 19.6) and 46–59 yo group (129.1 ± 23.3) (Figure 10).
 |
Figure 10 Oxidative activity upon PMA stimulation. Notes: Distribution of PMA-stimulated oxidative cells (%) and oxidative activity (GeoMean) in 30–45 yo group (93.3 ± 5.1, respectively, 131.6 ± 19.6) (n = 113), 46–59 yo group (92.8 ± 3.4, respectively, 129.1 ± 23.3) (n = 94) and 60–80 yo group (97.8 ± 1.2, respectively, 175.9 ± 43.8) (n = 81) as compared to unstimulated oxidative cells (%) and unstimulated oxidative activity (GeoMean). The results are presented as mean ± SD; n = number of subjects. |
PMA stimulation index for oxidative neutrophils percent had a declining trend with age (17.93 ± 4.2 for 30–45 yo group, 17.54 ± 3.4 for 46–59 yo group, 15.84 ± 2.2 for 60–80 yo group), but no significant differences were obtained between tested groups (Figure 11A). The higher values for PMA stimulation index for oxidative activity were obtained for the eldest group (3.62 ± 0.9), as compared to 30–45 yo (3.12 ± 0.9) and 46–59 yo group (2.92 ± 0.8) (Figure 11B).
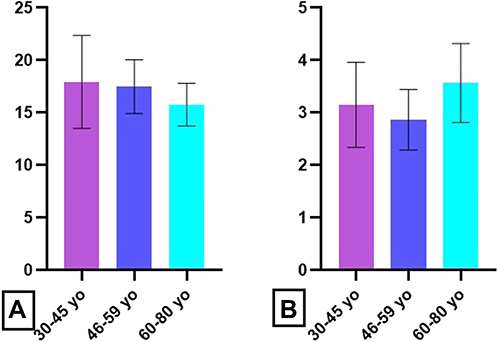 |
Figure 11 Age-related distribution of PMA stimulation index. Notes: Stimulation index in presence of PMA for oxidative cell percentage (A) and oxidative activity (B) in 30–45 yo group (17.93 ± 4.2, respectively, 3.12 ± 0.9) (n = 113), 46–59 yo group (17.54 ± 3.4, respectively, 2.92 ± 0.8) (n = 94) and 60–80 yo group (15.84 ± 2.2, respectively, 3.62 ± 0.9) (n = 81). The results are presented as mean ± SD; n = number of subjects. |
Discussion
We have enrolled a group of documented healthy subjects in a 1:1 gender ratio that span human early adulthood till old ages (30–80 years). The entire group had innate and adaptive immune parameters evaluated in relation to healthy ageing. Humoral and cellular immunocompetence develops throughout life and if deregulated, it induces susceptibility to developing infections, autoimmune disease, immunodeficiency, and malignancy. The easiest methodology to evaluate humoral immunity is to quantify the level of immunoglobulins, these immune molecules being important players in the defense against pathogens and in clearing aberrant cells, just to name two of their physiological functions. Low levels of serum Igs may indicate a predisposition to infections, autoimmune disorders and malignancies, while higher levels were associated with chronic infections, liver diseases, connective tissue diseases, and malignancies.22 Serum Igs levels are accepted as a surrogate marker for B-cell functionality in both healthy donors and patients.23 Our data have shown significant age-dependent differences for IgG, IgM, C3 and C4 between the extreme age groups, young adults and aged subjects. Although the humoral parameters’ mean values were in normal ranges for all tested groups, these humoral parameters showed a decreasing trend with age, even if the obtained values were within normal limits.
Lymphocyte immunophenotyping is important in diagnosis, monitoring and prognosis of many disorders, the most representative being immunodeficiency, autoimmune diseases, transplant rejection, allergies, and leukemia. It is widely accepted that the T cell compartment changes with age, as a consequence of thymus involution. Thus, a progressive decrease in absolute counts and percentage of T-CD3+ lymphocytes has been reported.24–26 Our data are in accordance with the previous reports as we have registered a decreasing tendency and significant differences for T-CD3+ lymphocytes’ absolute counts when extreme age groups were compared. Analysis of peripheral T lymphocyte subpopulations is important for assessing the immune status and can guide the dynamics and cooperation of immune cells.27 Data regarding the distribution of T lymphocyte subsets with age are contradictory: some authors report an increase in T-CD4+ along with a decrease in T-CD8+ cells,26 others note the decreasing tendency25 of both lymphocyte subsets, while other authors report no changes28 in T-subsets distribution with age. Overall, the reports show elevated T-CD4+/T-CD8+ ratio when studying their relation with healthy ageing.29 In our study, we have obtained the same increase of the T-CD4+/T-CD8+ ratio, increase that is based on the statistically significant decrease of T-CD8+ subset. The presented T-CD4+/T-CD8+ ratio is becoming an emerging cellular biomarker and potentially a useful predictor of aging,30 typically with a reduction in the ratio associating with disease, dysfunction, or poor health outcomes.31–33 The differences that we have obtained in this parameter comparing to other studies can be due to the differences in both to the genetical make-up of the populations and environmental conditions.
The number of peripheral B lymphocytes does not vary significant with age, but naive B lymphocytes are replaced by professional memory cells, characterized by decreased affinity and isotype change.34 We have reported previously that recurrent respiratory infections can alter percentages of peripheral T and B subsets35 and ageing is associated with a high frequency of infections. Similar to T subset reports, the reports regarding peripheral B cells in relation to healthy ageing are not congruent.25,26,29 We have identified that although Igs levels are significantly decreasing with ageing for all classes, peripheral B cells have a tendency to increase with age probably sustaining a compensatory mechanism. We do not rule out that the increase of B cells is due to the accumulation of cells that have a lower generation of antibodies. Peripheral NK cells, reported as elevated with regard to ageing but losing their cytotoxic activity.36 We have obtained peripheral NK cells decreased with ageing. The finding is interesting as our previous published results regarding oncological or autoimmune diseases have shown in various skin37 or oral cancers38 and in rheumatoid arthritis39 that peripheral NK and B cells are negatively correlated and subjected probably to unknown immune regulatory mechanisms that compensate these two cell types. The absolute values for T-CD3+, T-CD8+ and NK cells have a significant declining trend with ageing.
Regarding the innate immune cells and the normal process of ageing, our previous results regarding oxidative activity have shown that the susceptibility to infection increases with age due probably to the number of neutrophils that may be able to respond to stimulus that triggers oxidative activity.40,41
The immune senescence predisposes to a higher risk of acute viral and bacterial infections. Moreover, the mortality rates of these infections are three times higher among elderly patients compared with younger adult patients.34 Thus, the data obtained by us regarding the stimulation with E. coli supports prior reports showing that there is an exhaustion and inability of cytotoxic mechanisms in the recruiting a sufficient number of neutrophils able to respond to the pathogen. The percentages of unstimulated neutrophils that show basal oxidative activity and the intensity of this activity had an increasing trend with age, but without statistical significance. This finding may, however, emphasize that, with age, there is an increasing trend in the percentage of peripheral neutrophils that can develop a basal oxidative activity.
Chemotactic peptides of bacterial origin, like fMLP are weak stimuli, unlike particulated and opsonized stimuli such as E. coli.42 The capacity of fMLP to activate the mechanisms that generate ROS reflect neutrophil’s ability to respond effectively to a pathogen that secretes chemotactic peptides.43 Our data have shown that the percentage of neutrophils which can be activated by fMLP have the tendency to decrease with age. As a compensatory regulatory measure, the decrease of the percentage of cells responsive to this stimulus is correlated with the increase in the intensity of oxidative reaction with age, the older group having an oxidative activity more intense than younger groups. The fMLP stimulation index showed a statistically significant decrease with age. This decrease in the percentage of neutrophils that are fMLP responsive was accompanied by a slight increase of the oxidative activity, but without statistical significance. The percentage of neutrophils that respond to a weak stimulus like fMLP significantly decreases mainly in the oldest group.
The percentages of unstimulated neutrophils that show basal oxidative activity and the intensity of this activity had an increasing tendency with age, but the percentage of neutrophils which can be activated by fMLP clearly decreases with age. As a compensatory regulatory measure, these findings were associated with the increase in the intensity of oxidative reaction with age, the older group having an oxidative activity more intense than younger groups. The fMLP stimulation index showed a statistically significant decrease with age.
Unlike chemotactic peptides, particulated stimuli like opsonized bacteria induce enhanced oxidative activity.44 Studying the ability of these stimuli to activate the mechanisms generating ROS, neutrophils’ capacity to effectively respond to the pathogen at the site of infection can be evaluated. Our data revealed a slight tendency to engage a higher percentage of neutrophils after stimulation with E. coli, and the differences between the middle-aged group and the extreme age group were statistically significant. The oxidative activity of neutrophils also showed increased values for aged groups as compared to the youngest group. The main change observed in the analysis of the E. coli stimulation index was the significant decrease of the values for aged subjects. Protein kinase C (PKC) are involved in intracellular signal transmission after the activation of different pathways regulating the transcription and cell cycle. Certain isoforms (PKC-a) are activated by second messengers as diacyl-glycerols. Its effect can be mimicked by other phorbol esters like PMA.45 Lack of PMA response or a poor response indicates major malfunctions in oxidative mechanisms. Our data showed an increased percentage of oxidative neutrophils after PMA stimulation, although the differences between groups were not statistically significant. The oxidative activity was also higher in older group as compared to younger groups. PMA stimulation index for oxidative neutrophils percent had a declining trend with age, but no significant differences were obtained between tested groups. The higher values for PMA stimulation index for oxidative activity were obtained for the aged subjects. A recent paper has shown that there are differences at several proteomic, transcriptomic, metabolomics levels in bone marrow neutrophils in ageing mice, females and males.46 Hence, the molecular rate of neutrophil aging differs between sexes with an increased pro-inflammatory profile in males compared to aged females.46 In our study, we did not obtain statistically significant gender-related differences in the respiratory burst functions of peripheral neutrophils. We do not exclude the enlargement of the groups with higher numbers of males and females that could prove also differences in this cellular compartment. As shown in the adaptive immune section, gender differences were obtained with a clear predominance of age-related differences in females compared to males that have a more stable immunological profile while ageing. This finding is due to both hormonal and chromosomal – related mechanisms that are involved to immunological sex differences data provided for human47 as well as for mice models.48
In general, healthy ageing can display immune-related deregulations accounting for age-related diseases, and hence investigating immune parameters new approaches can be designed to alleviate the effect of normal ageing.
Conclusions
Healthy ageing is a physiological process and in order to evaluate the immunological alterations that follow ageing, several humoral and cellular immune parameters were investigated for a large range of adult ages (30–80 years). For both humoral and cellular immune parameters age-related changes were observed. Thus, humoral parameters showed a decreasing trend with age, even if the values obtained were within normal limits. Lymphocyte immunophenotyping revealed several significant differences in the distribution of cells, both intra- and inter-age groups, namely decreased values of T-CD3+, T-CD8+ and NK cells, and elevated values for T-CD4+, T-CD4+/T-CD8+ ratio and B cells.
Our data have also shown an increased percentage of oxidative neutrophils after PMA stimulation, and the oxidative activity as well. In normal ageing there is a tendency that lesser percentage of circulating neutrophils that are oxidative active are compensating with a more intense oxidative activity to aid the decreased pool of innate immunity cells. In terms of adaptive immune cells ageing is governed by lesser T total lymphocyte population that compensates by an increased Th subpopulation and B lymphocyte population. We can conclude that healthy ageing is governed by some immune-related deregulations that account for immune exhaustion on both innate and adaptive immune cells, this exhaustion is probably due to numerous developed immune processes during a life-time and the age-related diseases.
Data Sharing Statement
The datasets used and/or analyzed during the present study are available from the corresponding author on reasonable request.
Ethics Statement
The study was conducted in accordance with the Declaration of Helsinki (1964) and with approval of the Local Ethics Committee of Ana Aslan Institute for Geriatrics and Gerontology, Bucharest and Victor Babes National Institute of Pathology, Bucharest (25/2017). Informed consent was obtained for all the involved participants.
Acknowledgments
The presented study will be integrated in the original part of the PhD thesis of first author and PhD student ANM. The authors would like to thank colleagues from Ana Aslan Institute for Geriatrics and Gerontology and from National Institute of Haematology and Transfusion, Bucharest, Romania for thoroughly supplying the samples and Dr Cornel Ursaciuc for critical review of the paper.
Author Contributions
All authors made a significant contribution to the work reported, whether that is in the conception, study design, execution, acquisition of data, analysis and interpretation, or in all these areas; took part in drafting, revising or critically reviewing the article; gave final approval of the version to be published; have agreed on the journal to which the article has been submitted; and agree to be accountable for all aspects of the work.
Funding
The work and open access fee was supported by a grant of the Ministry of Research, Innovation and Digitization, CCCDI- UEFISCDI, project number [PN-III-P2-2.1-PED-2021-2243], within PNCDI III. This study was also supported by the Core Program, implemented with the support of NASR, projects [PN19.29.01.01], [PN19.29.02.03], [PN-III-P4-PCE-2021-0549].
Disclosure
The authors declared no potential conflicts of interest with respect to the research, authorship, and/or publication of this article.
References
1. Pawelec G, Bronikowski A, Cunnane SC, et al. The conundrum of human immune system “senescence”. Mech Ageing Dev. 2020;192:111357. doi:10.1016/j.mad.2020.111357
2. Montecino-Rodriguez E, Berent-Maoz B, Dorshkind K. Causes, consequences, and reversal of immune system aging. J Clin Invest. 2013;123(3):958965. doi:10.1172/JCI64096
3. Batista MA, Calvo-Fortes F, Silveira-Nunes G, et al. Inflammaging in endemic areas for infectious diseases. Front Immunol. 2020;12(11):579972. doi:10.3389/fimmu.2020.579972
4. Palmer DB. The effect of age on thymic function. Front Immunol. 2013;4:316. doi:10.3389/fimmu.2013.00316
5. Yanes RE, Gustafson CE, Weyand CM, Goronzy JJ. Lymphocyte generation and population homeostasis throughout life. Semin Hematol. 2017;54(1):33–38. doi:10.1053/j.seminhematol.2016.10.003
6. de Bourcy CFA, Angel CJL, Vollmers C, Dekker CL, Davis MM, Quake SR. Phylogenetic analysis of the human antibody repertoire reveals quantitative signatures of immune senescence and aging. Proc Natl Acad Sci USA. 2017;114(5):1105–1110. doi:10.1073/pnas.1617959114
7. Drew W, Wilson DV, Sapey E. Inflammation and neutrophil immunosenescence in health and disease: targeted treatments to improve clinical outcomes in the elderly. Exp Gerontol. 2018;1(105):70–77. doi:10.1016/j.exger.2017.12.020
8. Soiza RL, Scicluna C, Thomson EC. Efficacy and safety of COVID-19 vaccines in older people. Age Ageing. 2021;50(2):279–283. doi:10.1093/ageing/afaa274
9. Gould L, Abadir P, Brem H, et al. Chronic wound repair and healing in older adults: current status and future research. Wound Repair Regen. 2015;23(1):1–13. doi:10.1111/wrr.12245
10. Asensio Á, Vallejo-Plaza A, Parra LM, et al. Epidemiology of Clostridioides difficile infection in hospitalized patients in Spain: an eight-year review (2012–2019). Enferm Infecc Microbiol Clin. 2022;40(3):125–130. doi:10.1016/j.eimc.2021.04.006
11. De Martinis M, Franceschi C, Monti D, Ginaldi L. Inflamm-ageing and lifelong antigenic load as major determinants of ageing rate and longevity. FEBS Lett. 2005;579(10):2035–2039. doi:10.1016/j.febslet.2005.02.055
12. Fragkou PC, Moschopoulos CD, Reiter R, Berger T, Skevaki C. Host immune responses and possible therapeutic targets for viral respiratory tract infections in susceptible populations: a narrative review. Clin Microbiol Infect. 2022;28(10):1328–1334. doi:10.1016/j.cmi.2022.03.010
13. Ligthart GJ, Corberand JX, Fournier C, et al. Admission criteria for immunogerontological studies in man: the SENIEUR protocol. Mech Ageing Dev. 1984;28(1):47–55. doi:10.1016/0047-6374(84)90152-0
14. Dati F, Schumann G, Thomas L, et al. Consensus of a group of professional societies and diagnostic companies on guidelines for interim reference ranges for 14 proteins in serum based on the standardization against the IFCC/BCR/CAP reference material (CRM 470). Eur J Clin Chem Clin Biochem. 1996;34:517–520.
15. Nicolai L, Schiefelbein K, Lipsky S, et al. Vascular surveillance by haptotactic blood platelets in inflammation and infection. Nat Commun. 2020;11:5778. doi:10.1038/s41467-020-19515-0
16. Aiello A, Farzaneh F, Candore G, et al. Immunosenescence and Its Hallmarks: How to Oppose Aging Strategically? A Review of Potential Options for Therapeutic Intervention. Front Immunol. 2019;10:2247. doi:10.3389/fimmu.2019.02247
17. Hirt W, Nebe T, Birr C. Phagotest und Bursttest (Phagoburst), testkits zur untersuchung von phagozytenfunktionen [Phagotest and Bursttest (Phagoburst), test kits for study of phagocyte functions]. Wien Klin Wochenschr. 1994;106(8):250–252. German.
18. Medley ML. Life satisfaction across four stages of adult life. Int J Aging Hum Dev. 1980;11(3):193–209. doi:10.2190/D4LG-ALJQ-8850-GYDV
19. Hartung J, Spormann SS, Moshagen M, Wilhelm O. Structural differences in life satisfaction in a U.S. adult sample across age. J Pers. 2021;89(6):1232–1251. doi:10.1111/jopy.12654
20. Hannet I, Erkeller-Yuksel F, Lydyard P, Deneys V, DeBruyère M. Developmental and maturational changes in human blood lymphocyte subpopulations. Immunol Today. 1992;13(6):215–218. doi:10.1016/0167-5699(92)90157-3
21. Jeraiby M, Sidi Yahya K, Depince-Berger AE, Lambert C. Microbicidal activity measured by flow cytometry: optimization and standardization for detection of primary and functional deficiencies. J Immunol Methods. 2017;441:8–14. doi:10.1016/j.jim.2016.09.010
22. Khan SR, Chaker L, Ikram MA, Peeters RP, van Hagen PM, Dalm VASH. Determinants and reference ranges of serum immunoglobulins in middle-aged and elderly individuals: a population-based study. J Clin Immunol. 2021;41(8):1902–1914. doi:10.1007/s10875-021-01120-5
23. Blanco E, Pérez-Andrés M, Arriba-Méndez S, et al. Age-associated distribution of normal B-cell and plasma cell subsets in peripheral blood. J Allergy Clin Immunol. 2018;141(6):2208–2219.e16. doi:10.1016/j.jaci.2018.02.017
24. Sansoni P, Vescovini R, Fagnoni F, et al. The immune system in extreme longevity. Exp Gerontol. 2008;43(2):61–65. doi:10.1016/j.exger.2007.06.008
25. Tavares SMQMC, Bravo Junior WL, Silva MRL. Normal lymphocyte immunophenotype in an elderly population. Rev Bras Hematol Hemoter. 2014;36:180–183. doi:10.1016/j.bjhh.2014.03.021
26. Choi J, Lee SJ, Lee YA, Maeng HG, Lee JK, Kang YW. Reference values for peripheral blood lymphocyte subsets in a healthy Korean population. Immune Netw. 2014;14(6):289–295. doi:10.4110/in.2014.14.6.289
27. Holcar M, Goropevšek A, Ihan A, Avčin T. Age-related differences in percentages of regulatory and effector T Lymphocytes and their subsets in healthy individuals and characteristic STAT1/STAT5 signalling response in helper T lymphocytes. J Immunol Res. 2015;2015:352934. doi:10.1155/2015/352934
28. Stulnig T, Maczek C, Böck G, Majdic O, Wick G. Reference intervals for human peripheral blood lymphocyte subpopulations from ‘healthy’ young and aged subjects. IAA. 1995;108(3):205–210.
29. Jentsch-Ullrich K, Koenigsmann M, Mohren M, Franke A. Lymphocyte subsets’ reference ranges in an age- and gender-balanced population of 100 healthy adults—A monocentric German study. J Clin Immunol. 2005;116(2):192–197. doi:10.1016/j.clim.2005.03.020
30. Garrido-Rodríguez V, Herrero-Fernández I, Castro MJ, et al. Immunological features beyond CD4/CD8 ratio values in older individuals. Aging. 2021;13(10):13443–13459. doi:10.18632/aging.203109
31. Serrano-Villar S, Pérez-Elías MJ, Dronda F, et al. Increased risk of serious non-AIDS-related events in HIV-infected subjects on antiretroviral therapy associated with a low CD4/CD8 ratio. PLoS One. 2014;9(1):e85798. doi:10.1371/journal.pone.0085798
32. Serrano-Villar S, Moreno S, Fuentes-Ferrer M, et al. The CD4: CD8ratio is associated with markers of age-associated disease in virally suppressed HIV-infected patients with immunological recovery. HIV Med. 2014;15(1):40–49. doi:10.1111/hiv.12081
33. Muller GC, Gottlieb MG, Luz Correa B, Gomes Filho I, Moresco RN, Bauer ME. The inverted CD4: CD8ratio is associated with gender-related changes in oxidative stress during aging. Cell Immunol. 2015;296(2):149–154. doi:10.1016/j.cellimm.2015.05.006
34. Simon AK, Hollander GA, McMichael A. Evolution of the immune system in humans from infancy to old age. proceedings of the royal society B. Proc Biol Sci. 2015;282(1821):20143085. doi:10.1098/rspb.2014.3085
35. Munteanu AN, Surcel M, Huică RI, et al. Peripheral immune cell markers in children with recurrent respiratory infections in the absence of primary immunodeficiency. Exp Ther Med. 2019;18(3):1693–1700. doi:10.3892/etm.2019.7714
36. Gounder SS, Abdullah BJJ, Radzuanb NEIBM, et al. Effect of aging on NK cell population and their proliferation at ex vivo culture condition. Anal Cell Pathol. 2018;2(2018):7871814.
37. Neagu M, Constantin C, Zurac S. Immune parameters in the prognosis and therapy monitoring of cutaneous melanoma patients: experience, role, and limitations. Biomed Res Int. 2013;2013:107940. doi:10.1155/2013/107940
38. Caruntu A, Moraru L, Surcel M, et al. Assessment of immune cell populations in tumor tissue and peripheral blood samples from head and neck squamous cell carcinoma patients. Anal Cell Pathol. 2021;15(2021):e2328218.
39. Manda G, Neagu M, Livescu A, Constantin C, Codreanu C, Radulescu A. Imbalance of peripheral B lymphocytes and NK cells in rheumatoid arthritis. J Cell Mol Med. 2003;7(1):79–88. doi:10.1111/j.1582-4934.2003.tb00206.x
40. Constantin C, Gradinaru D, Manda G, Neagu M, Rusu C, Ursaciuc C. The respiratory burst evaluation by flow cytometry in normal elderly subjects, invited abstracts presented at the 6th euroconference on clinical cell analysis, organized by the European Society for Clinical Cell Analysis (ESCCA). Cytom B - Clin Cytom. 2007;72B(2):112–152.
41. Neagu M, Constantin C, Manda G, et al. Immune response in healthy ageing: immunosenescence versus immunodeficiency, joint conference of the 33rd FEBS congress/11th IUBMB conference. FASEB J. 2008;275(s1):99–437.
42. Sachouli E, Tsiridou DM, Takata M, Gordon A, O’Dea KP. Stimulation of neutrophils in whole blood enhances the pro-inflammatory activity of neutrophil-derived microvesicles. FASEB J. 2022;36(Suppl):1. doi:10.1096/fasebj.2022.36.S1.L7545
43. Walrand S, Guillet C, Boirie Y, Vasson MP. Insulin differentially regulates monocyte and polymorphonuclear neutrophil functions in healthy young and elderly humans. J Clin Endocrinol Metab. 2006;91(7):2738–2748. doi:10.1210/jc.2005-1619
44. Murugaiah V, Tsolaki AG, Kishore U. Collectins: innate immune pattern recognition molecules. Adv Exp Med Biol. 2020;1204:75–127. doi:10.1007/978-981-15-1580-4_4
45. Dröge W. Free radicals in the physiological control of cell function. Physiol Rev. 2002;82(1):47–95. doi:10.1152/physrev.00018.2001
46. Lu RJ, Taylor S, Contrepois K, et al. Multi-omic profiling of primary mouse neutrophils predicts a pattern of sex and age-related functional regulation. Nat Aging. 2021;1(8):715–733. doi:10.1038/s43587-021-00086-8
47. Peckham H, Webb K, Rosser EC, Butler G, Ciurtin C. Gender-diverse inclusion in immunological research: benefits to science and health. Front Med. 2022;14(9):909789. doi:10.3389/fmed.2022.909789
48. Surcel M, Constantin C, Caruntu C, Zurac S, Neagu M. Inflammatory cytokine pattern is sex-dependent in mouse cutaneous melanoma experimental model. J Immunol Res. 2017;2017:9212134. doi:10.1155/2017/9212134
 © 2022 The Author(s). This work is published and licensed by Dove Medical Press Limited. The
full terms of this license are available at https://www.dovepress.com/terms
and incorporate the Creative Commons Attribution
- Non Commercial (unported, 3.0) License.
By accessing the work you hereby accept the Terms. Non-commercial uses of the work are permitted
without any further permission from Dove Medical Press Limited, provided the work is properly
attributed. For permission for commercial use of this work, please see paragraphs 4.2 and 5 of our Terms.
© 2022 The Author(s). This work is published and licensed by Dove Medical Press Limited. The
full terms of this license are available at https://www.dovepress.com/terms
and incorporate the Creative Commons Attribution
- Non Commercial (unported, 3.0) License.
By accessing the work you hereby accept the Terms. Non-commercial uses of the work are permitted
without any further permission from Dove Medical Press Limited, provided the work is properly
attributed. For permission for commercial use of this work, please see paragraphs 4.2 and 5 of our Terms.