Back to Journals » Vascular Health and Risk Management » Volume 21
H-FABP and Hs-cTnI Serum Concentrations Associate with the Development of Cardiovascular Events in Newly Diagnosed T2D, Pre-DM, and Normoglycemic Individuals
Authors Simon R ![]() , Hammoud T, Alsayed R
, Hammoud T, Alsayed R ![]()
Received 7 August 2025
Accepted for publication 30 November 2025
Published 10 December 2025 Volume 2025:21 Pages 1031—1046
DOI https://doi.org/10.2147/VHRM.S559031
Checked for plagiarism Yes
Review by Single anonymous peer review
Peer reviewer comments 3
Editor who approved publication: Dr Konstantinos Tziomalos
Reham Simon,1 Taghrid Hammoud,2 Ranwa Alsayed1
1Department of Biochemistry and Microbiology, Faculty of Pharmacy, Damascus University, Damascus, Syria; 2Department of Physiology and Pharmacology, Faculty of Medicine, Damascus University, Damascus, Syria
Correspondence: Reham Simon, Email [email protected]; [email protected]
Background: CVD remains the leading global cause of mortality, especially in individuals with T2D and Pre-DM, where insulin resistance increases cardiometabolic risk and early myocardial injury often goes unrecognized. This study aimed to evaluate baseline serum concentrations of H-FABP and Hs-cTnI, biomarkers linked to myocardial injury, in newly diagnosed T2D, Pre-DM, and normoglycemic individuals, to assess their predictive value for CVEs and the association between H-FABP and HOMA-IR.
Methods: In a prospective cohort study of 72 medication-free participants (25 T2D, 22 Pre-DM, 25 normoglycemic) without clinical myocardial symptoms, baseline anthropometric and biochemical measurements were obtained, including H-FABP, Hs-cTnI, HbA1c, fasting glucose, fasting insulin, and HOMA-IR was calculated. Participants were followed one year to evaluate the occurrence of CVE.
Results: Strong correlations between baseline H-FABP and Hs-cTnI across all glycemic groups (all p< 0.01) with no significant intergroup differences. In abnormal weight T2D participants, baseline fasting insulin correlated moderately with baseline H-FABP (ρ=0.50, p=0.029) and strongly with baseline HOMA-IR (ρ=0.74, p< 0.001). CVEs occurred in 33.3% of participants and were associated with elevated baseline H-FABP and Hs-cTnI (p< 0.001 and p=0.001), alongside strong biomarker inter-correlation (ρ=0.64 overall; ρ=0.84 in CVEs). Both biomarkers independently predicted CVEs; H-FABP had higher sensitivity and NPV, while Hs-cTnI showed greater specificity and PPV. Glycemic status was not statistically associated with CVE occurrence, although higher HOMA-IR and insulin were observed in the CVE group (p=0.073 and p=0.054).
Conclusion: These findings support H-FABP as a cardiac biomarker for myocardial injury across normoglycemic, Pre-DM, and T2D groups. The link between H-FABP and insulin resistance in individuals with greater burden of metabolic disturbance highlights its role as a cardiometabolic indicator. Both biomarkers predicted CVEs in asymptomatic individuals, with H-FABP potentially useful for early risk exclusion and Hs-cTnI for confirming high-risk status.
Keywords: heart-type fatty acid binding protein, high-sensitivity cardiac troponin I, insulin resistance, prediabetes, diabetes, cardiovascular events
Background
Cardiovascular diseases (CVDs), affecting the heart and blood vessels, have been the leading cause of death worldwide for decades, accounting for approximately one-third of all global mortality.1 The number of CVD-related deaths has increased markedly from 12.1 million in 1990 to 20.5 million in 2021.1
Notably, CVDs are the number one cause of death among individuals with type 2 diabetes (T2D),2 accounting for approximately 75% of diabetes-related mortality.3 Moreover, patients with T2D may have seemingly asymptomatic cardiovascular damage, with ischemic episodes remaining undetected at a reported prevalence of one in three patients with diabetes.4–7 In addition, silent myocardial infarction is estimated to affect nearly 20% of this population.4 Furthermore, diabetic cardiac autonomic neuropathy—with a prevalence of up to 34% in T2D patients— may cause abnormalities in heart rate control and vascular dynamics that can result in asymptomatic ischemia, and painless infarction.4,8
Therefore, cardiovascular sequelae may develop much earlier than detected, with the disease only recognized once symptoms are more pronounced.4 However, patients with T2D often report only weakness and shortness of breath during exertion, which in many cases might mask significant CVD.4 These findings underscore the importance of employing sensitive and specific biomarkers for the early detection of myocardial injury and proactive cardiovascular screening, particularly in prediabetes (Pre-DM) and T2D populations.
In this context, heart-type fatty acid binding protein (H-FABP) is a 132-amino-acid, 15 kDa soluble cytoplasmic protein that is abundantly present in cardiomyocytes, comprising 5–15% of the total cytosolic protein pool, and is also found in lower concentrations in extra-cardiac tissues.9,10 Its primary function is to transport hydrophobic long-chain polyunsaturated fatty acids (PUFAs) from the cell membrane to the mitochondria for oxidation.11 Recent studies have identified H-FABP as a sensitive biomarker for acute myocardial damage,10,12 and have demonstrated associations between H-FABP elevated circulating concentrations with the development of major adverse cardiac events and increased mortality in patients with acute coronary syndrome (ACS).13–16
Similarly, cardiac troponin I (cTnI), a key component of the troponin complex, is specific to cardiac tissue and predominantly bound to the myocardial contractile apparatus, with a minor fraction present in the cytoplasm.17 High-sensitivity cardiac troponin I (Hs-cTnI) assays have emerged as a cornerstone biomarker for detecting myocardial injury.17 Furthermore, elevated circulating concentrations of Hs-cTnI have been linked to an increased risk of future cardiovascular events (CVEs),15,18 potentially enhancing predictive accuracy and improving risk assessment.19
Taken together, these considerations support further investigation into the predictive potential of H-FABP and Hs-cTnI for future CVEs. Accordingly, this study aimed to evaluate and compare baseline serum concentrations of H-FABP and Hs-cTnI in newly diagnosed patients with T2D, Pre-DM, and normoglycemic controls, to assess their predictive value for CVE, and to investigate potential correlations between H-FABP concentrations and insulin resistance.
Materials and Methods
Study Population
This prospective cohort study was conducted from January 2024 to January 2025, encompassing a follow-up period of approximately one year after sample collection. At the end of this period, participants were re-contacted to determine whether they had experienced CVE during follow-up.
Between April 2023 and January 2024, participants were recruited using stratified randomization based on glycemic status at the National University Hospital Endocrine Clinic and Al-Zahira Specialized Medical Centers Diabetic Clinic in Damascus, Syria.
Ethical approval was obtained from the Biomedical Research Ethics Committee (BMREC) of Damascus University (Session 5, Date 29/01/2022; Reference PH-290122-28). The study was conducted in accordance with the Declaration of Helsinki (1964). Written informed consent was obtained from all participants prior to sample collection.
A total of of 72 medication-free participants without clinical myocardial symptoms were categorized into three groups based on glycemic status: newly diagnosed T2D (n=25; 17 males and 8 females), Pre-DM (n=22; 13 males and 9 females), and normoglycemic controls (n=25; 13 males and 12 females).
Glycemic status was defined according to the American Diabetes Association (ADA, 2022) criteria. T2D was defined by fasting plasma glucose >125 mg/dL and hemoglobin A1C (HbA1c) >6.4%, while prediabetes was characterized by fasting plasma glucose between 100 and 125 mg/dL and HbA1c between 5.7 and 6.4%. Participants classified as normoglycemic had fasting plasma glucose <100 mg/dL and HbA1c <5.7%.
Participants were selected based on the following inclusion criteria:
- Males aged 18–65 years and females aged post-menopause to 65 years.
- Newly diagnosed, medication-free individuals with T2D or prediabetes.
- Absence of clinical myocardial symptoms.
We excluded participants based on the following exclusion criteria:
- Presence of congenital or acquired heart disease.
- Diagnosed with type 1 diabetes (T1D), gestational diabetes (GD), specific types of diabetes.
- Diagnosed with type 2 diabetes and managed with medication.
- Known dyslipidemia, renal dysfunction, hypertension, or clinical myocardial symptoms.
- Ongoing treatment for chronic or acute medical conditions.
- Smoking habits (current or former smoker).
Baseline clinical and anthropometric data were recorded, and blood samples were collected from all participants. Measured biochemical parameters included H-FABP and Hs-cTnI serum concentrations, HbA1c, fasting glucose and insulin. Insulin resistance was assessed using the homeostatic model assessment of insulin resistance (HOMA-IR). Samples were analyzed according to the manufacturers’ standardized protocols.
In January 2025—approximately one year following the completion of sample collection—all participants were re-contacted to collect clinical data related to CVE.
Clinical Examination
Participants completed a standardized questionnaire, to gather medical history, current medication use, and smoking status. An anthropometric assessment was then conducted, including measurements of height (using a stadiometer), weight (using a digital weight scale), and waist circumference (measured at the upper borders of the hip bones using a standardized measuring tape).
Resting systolic and diastolic blood pressures were recorded using a mercury sphygmomanometer following a 5-minute resting period. Body mass index (BMI) was calculated as body weight (kg) divided by height squared (m2).
Laboratory Investigation
Approximately 5 mL of fasting venous blood was collected via venipuncture and centrifuged at 1210 relative centrifugal force (RCF) for 10 minutes. Plasma from heparin tubes was used for fasting glucose and insulin measurements, followed by HOMA-IR calculation. Whole blood collected in EDTA tubes was analyzed for HbA1c levels. Serum from plain tubes was aliquoted and stored at −80 °C until batch analysis for Hs-cTnI and H-FABP.
Laboratory Tests Methods and Principles
Serum concentrations of H-FABP and Hs-cTnI were analysed using two distinct commercial human sandwich enzyme-linked immunosorbent assay (ELISA) kits from MyBioSource laboratories (USA), in accordance with the manufacturer’s instructions. Absorbance was measured using a BioTek ELx800 Absorbance Microplate Reader.
The lower detection limit for H-FABP assay was 0.01 ng/mL, with an inter-assay coefficient of variation below 10% and an intra-assay coefficient of variation below 8%. Similarly, the lower detection limit for Hs-cTnI assay was 3.62 ng/L, with an inter-assay and intra-assay coefficients of variation below 10.0% and 8.0%, respectively.
The determination of HbA1c, fasting insulin, and fasting glucose was performed using turbidimetric inhibition immunoassay (TINIA) with Cobas® Tina-quant Hemoglobin A1c Gen.3, sandwich electrochemiluminescence immunoassay (ECLIA) with Cobas® Elecsys Insulin, and enzymatic reference method with hexokinase via Cobas® Glucose HK GLUC3, respectively, all from Roche Diagnostics (USA), analyzed on COBAS INTEGRA 400 plus, COBAS E601, and COBAS C311 analyzers.
The HOMA-IR was calculated using the following formula:

Study End Points
CVE status was assessed at the end of the one-year follow-up period from baseline sampling. The primary endpoint of the study was the occurrence of CVE, defined as clinically significant events including arrhythmia, stable or unstable angina, and nonfatal myocardial infarction. Clinical diagnoses were determined by experienced cardiologists, and data were collected via structured telephone interviews.
Statistical Analysis
The statistical analysis was performed using IBM SPSS statistics (version 25) software, originally known as the Statistical Package for the Social Sciences.
Categorical variables were expressed as counts and percentage (%), while continuous variables were presented as mean ± standard deviation (SD). Data normality was assessed using the Shapiro–Wilk and Kolmogorov–Smirnov tests. When normality was not met, appropriate nonparametric tests were applied.
The chi-square test was used to evaluate the statistical association between categorical variables, assessing whether differences in their distributions were significant.
Comparison of quantitative variables across the three groups was performed using one-way ANOVA for normally distributed data and the Kruskal–Wallis H-test when the assumption of normality was not met.
Comparison of quantitative variables between two groups was performed using the independent samples t-test for normally distributed data and the Mann–Whitney U-test when the assumption of normality was not met.
Spearman’s rank correlation coefficient was used to assess the strength and direction of associations between selected parameters. Linear regression analysis was performed to evaluate the relationship between independent and dependent variables.
Binomial logistic regression analysis was used to assess the effect of independent variables on the likelihood of developing cardiovascular events.
The Receiver Operating Characteristics (ROC) Curves were constructed, and the Area Under the Curve (AUC) was calculated to evaluate the predictive performance of H-FABP and Hs-cTnI serum concentrations for CVE. Optimal cut-off values, along with corresponding sensitivity and specificity, were determined to assess classification accuracy.
A p-value < 0.05 was considered to indicate statistical significance.
Results
At baseline, we studied 72 participants, including 43 males (59.7%) and 29 females (40.3%). The mean age of males was 44.51±11.45 years (range: 21–65 years), with a mean BMI of 27.39±3.99 Kg/m2 (range: 18.61–34.96 Kg/m2). Females had a mean age of 54.66±5.53 years (range: 45–65 years) and a mean BMI of 27.60±4.50 Kg/m2 (range: 18.55–34.08 Kg/m2).
Participants were divided into three groups based on glycemic status: newly diagnosed T2D (n=25; 68.0% males, 32.0% females; mean age 50.80±9.42 years; BMI 29.11±3.67 Kg/m2), Pre-DM (n=22; 59.1% males, 40.9% females; mean age 51.73±8.35 years; BMI 29.22±3.45 Kg/m2), and normoglycemic controls (n=25; 52.0% males, 48.0% females; mean age 43.64±12.25 years, BMI 24.30±3.40 Kg/m2). All participants were medication-free and showed no clinical myocardial symptoms at the time of enrollment.
The mean age of the T2D patients was 50.80±9.42 years, Pre-DM patients 51.73±8.35 years, and normoglycemic individuals 43.64±12.25 years (p=0.076). The mean BMI was 29.11±3.67 Kg/m2 for T2D patients, 29.22±3.45 Kg/m2 for Pre-DM patients, and 24.30±3.40 Kg/m2 in the normoglycemic group (p<0.001). The mean waist circumference was 104.56±8.50 cm in T2D patients, 106.95±9.36 cm in Pre-DM patients, and 91.00±8.03 cm among normoglycemic group (p<0.001).
Our study showed no significant difference in baseline serum concentrations of H-FABP and Hs-cTnI among the T2D, Pre-DM and normoglycemic groups (p=0.165, p=0.467, respectively). Baseline characteristics and biochemical parameters of the subjects are summarized in Table 1.
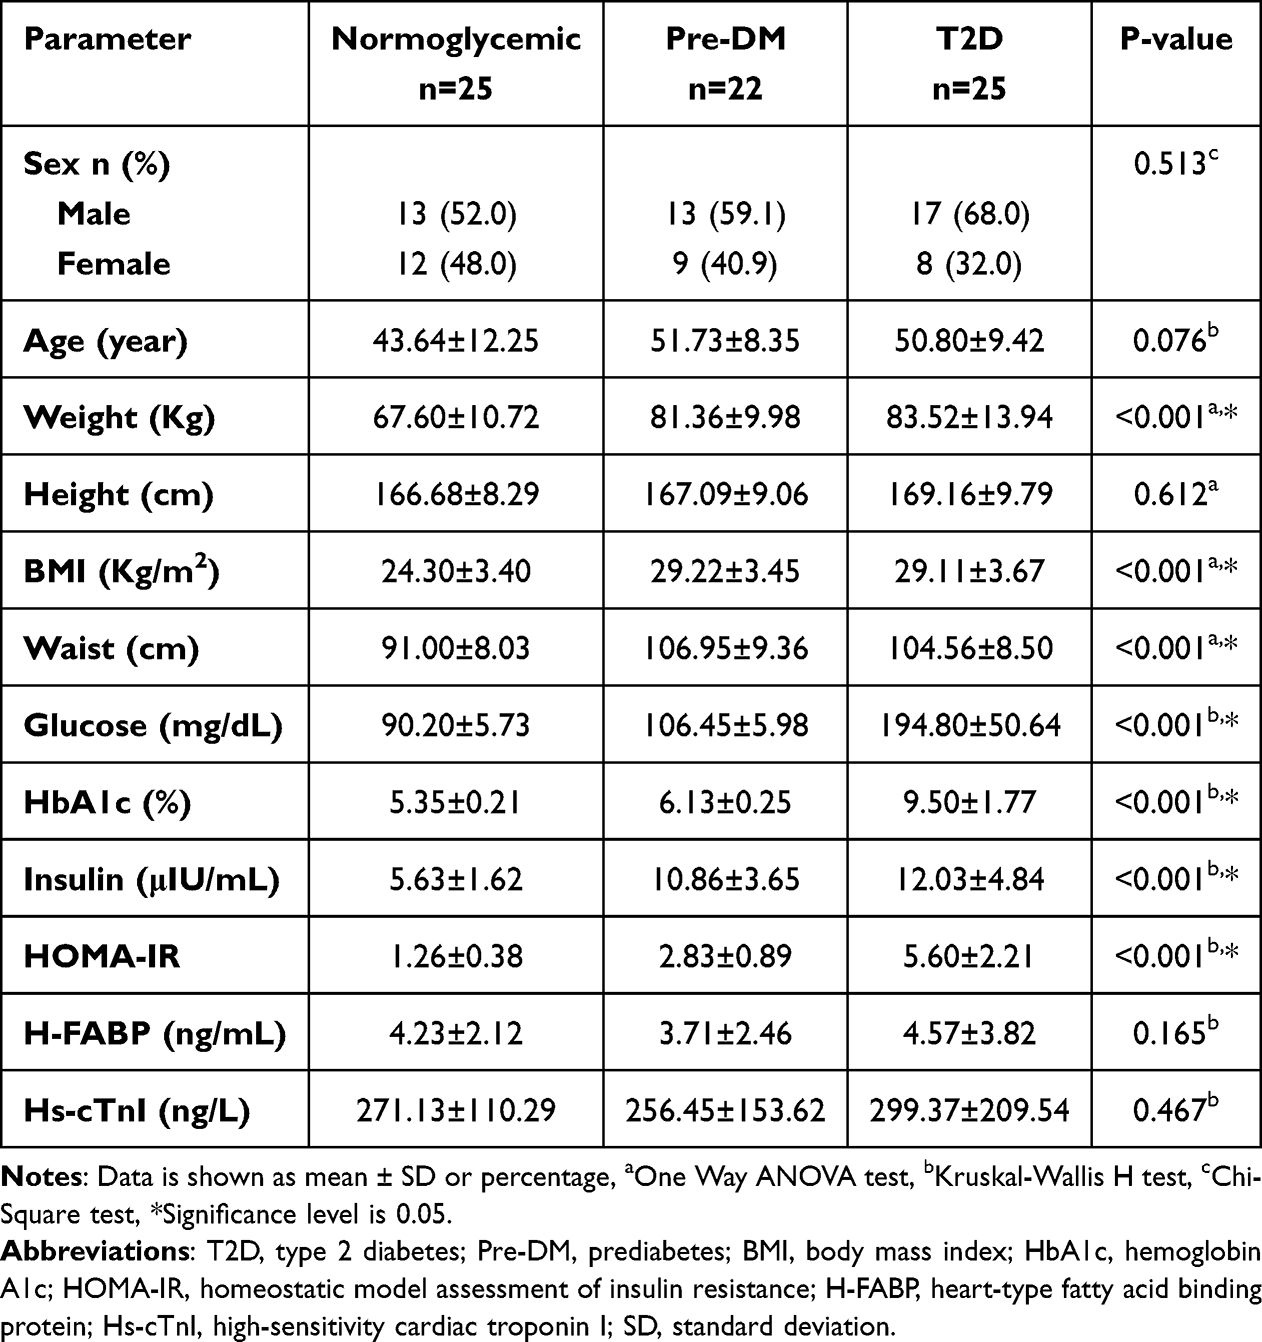 |
Table 1 Baseline Characteristics of Participants in Normoglycemic, Pre-DM, and T2D Groups |
No significant correlation was found between baseline serum concentrations of H-FABP and HOMA-IR in the overall study group (p=0.381). Similarly, baseline serum concentrations of Hs-cTnI showed no statistically significant correlation with HOMA-IR (p=0.310).
Participants were divided into two subgroups based on the upper limit of the normal BMI range, normal weight and abnormal weight. In the abnormal weight T2D subgroup, baseline fasting insulin concentrations showed a moderate positive correlation with baseline serum H-FABP concentrations (ρ=0.50, p=0.029), and a strong positive correlation with baseline HOMA-IR levels (ρ=0.74, p<0.001). In the normal weight T2D subgroup, baseline fasting insulin concentrations showed strong positive correlation with baseline HOMA-IR levels (ρ=0.83, p=0.042), whereas no statistically significant correlation was found with baseline serum H-FABP concentrations (p=0.787).
A strong positive correlation was observed between baseline serum concentrations of H-FABP and Hs-cTnI in the overall study group (ρ=0.64, p<0.001). Similarly, strong positive correlations were found within the normoglycemic group (ρ=0.57, p=0.003), Pre-DM group (ρ=0.55, p=0.008) and T2D group (ρ=0.66, p<0.001), as shown in Figures 1–4, respectively.
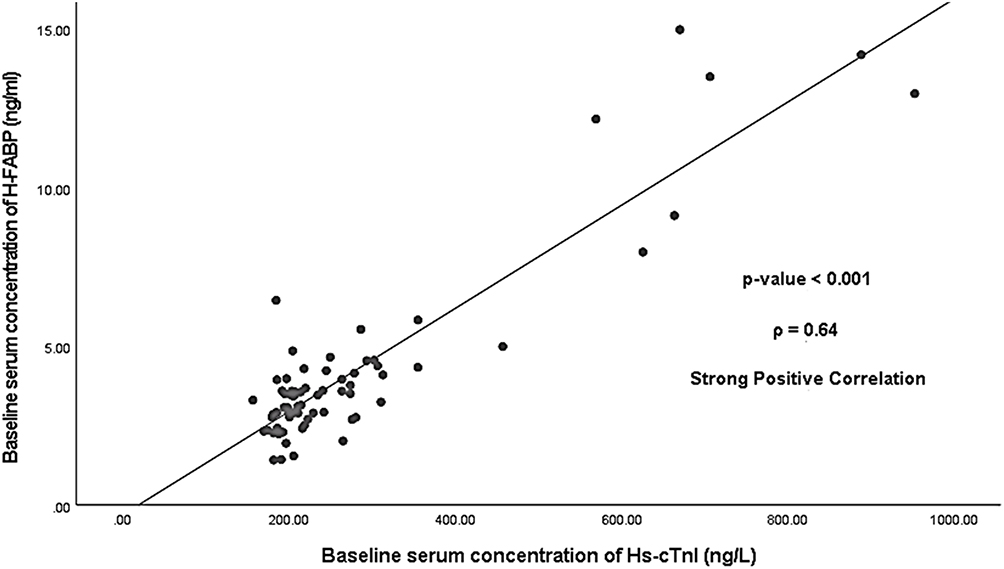 |
Figure 1 Correlation between baseline serum concentrations of H-FABP and Hs-cTnI in the overall study group. |
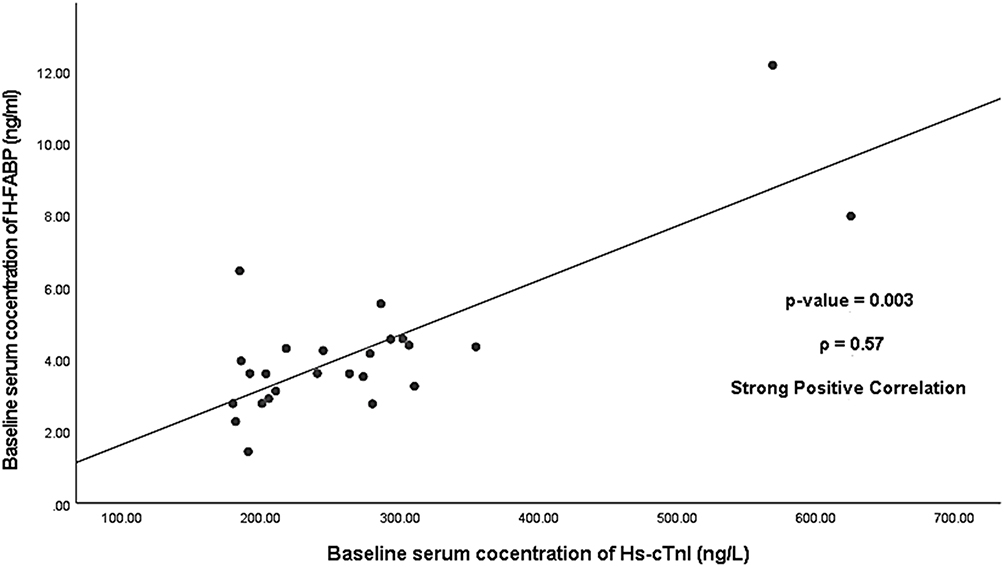 |
Figure 2 Correlation between baseline serum concentrations of H-FABP and Hs-cTnI in the normoglycemic group. |
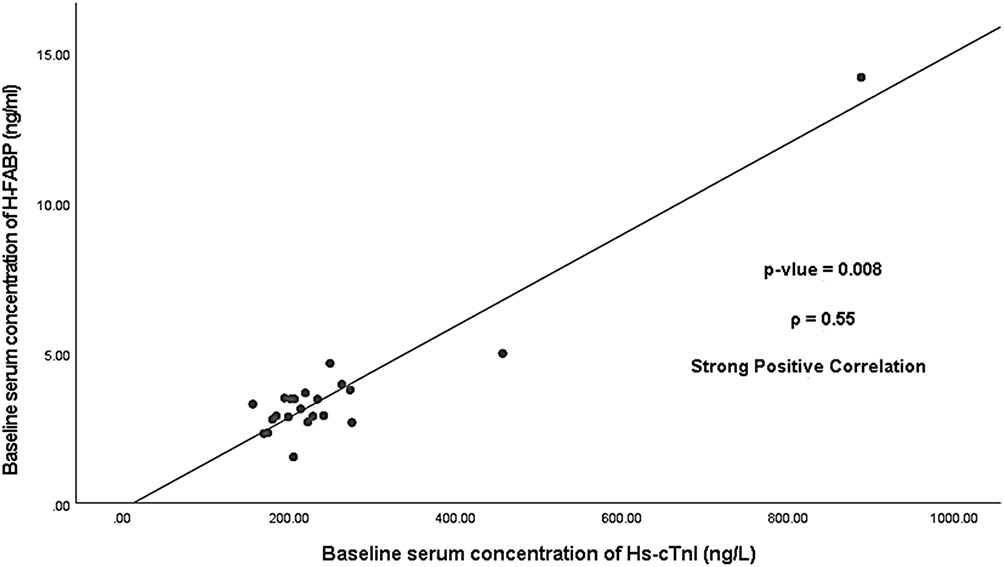 |
Figure 3 Correlation between baseline serum concentrations of H-FABP and Hs-cTnI in the Pre-DM group. |
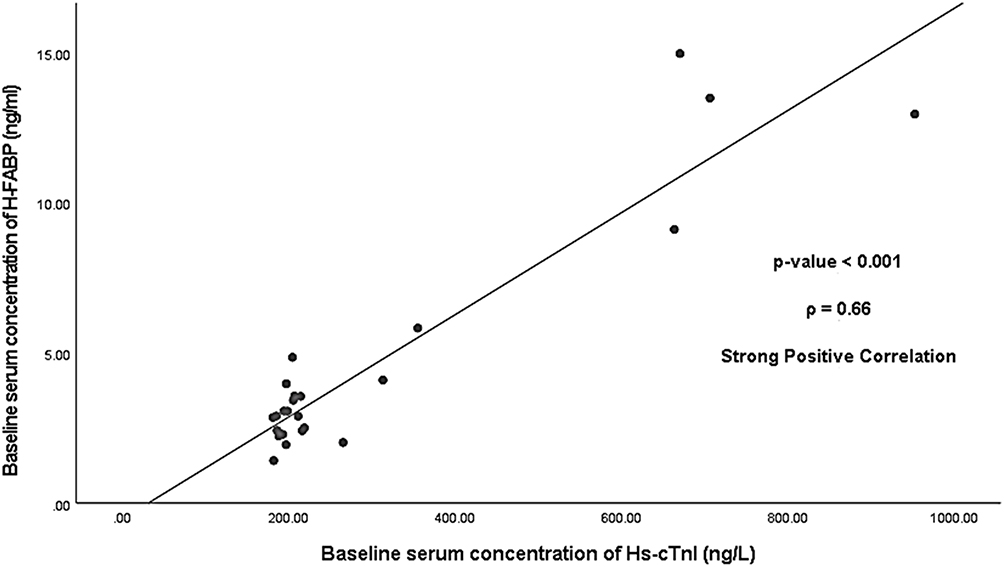 |
Figure 4 Correlation between baseline serum concentrations of H-FABP and Hs-cTnI in the T2D group. |
Linear regression analysis revealed a significant linear relationship between Hs-cTnI and H-FABP baseline serum concentrations in the overall study group (p<0.001). The regression coefficient for Hs-cTnI was 16.27 (p<0.001), while the model intercept was not statistically significant (−306.35, p>0.05), as detailed in Table 2.
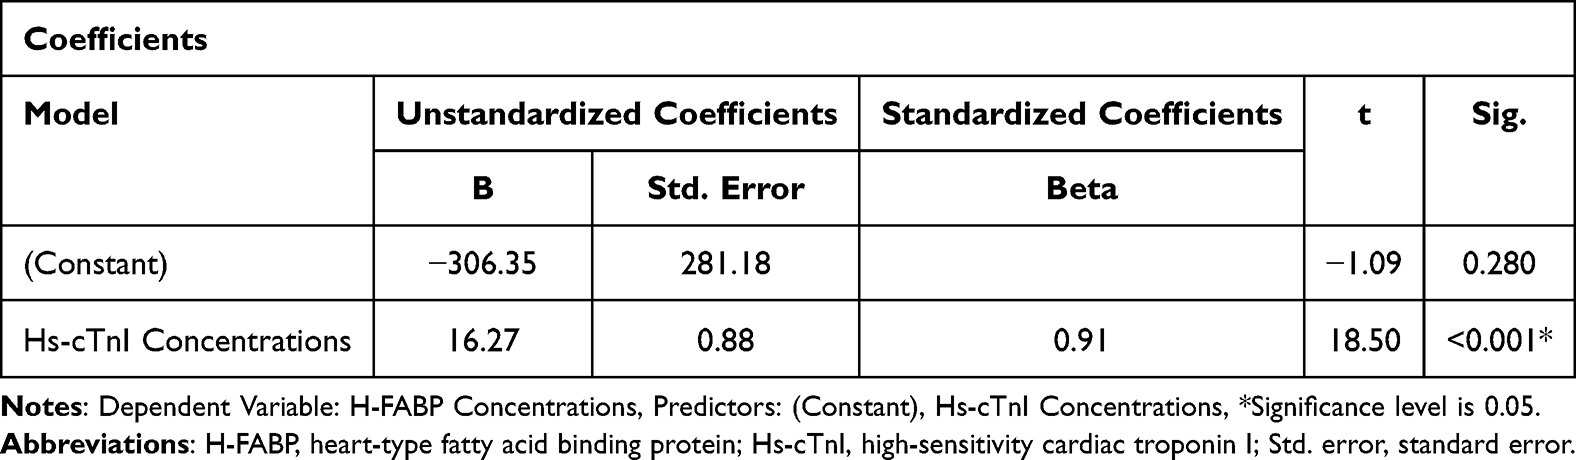 |
Table 2 Linear Relationship Coefficients Between Hs-cTnI and H-FABP Concentrations |
Based on the regression model, for every 1-unit increase in Hs-cTnI, H-FABP concentrations increase by 16.27 units, described by the equation:

The coefficient of determination (R2) was 0.83, indicating that 83.0% of the variability in H-FABP concentrations is explained by Hs-cTnI concentrations.
One year after sampling, all participants were re-contacted to collect clinical data related to CVE. Based on CVE occurrence, participants were categorized into two outcome groups: the developed-CVE group (n=24, 33.3%) and the non-CVE group (n=48, 66.7%).
The mean age in the developed-CVE group was 50.92±6.26 years, and 47.44±12.25 years in the non-CVE group (p=0.507). The mean BMI in the developed-CVE group was 28.12±4.31 Kg/m2, while in the non-CVE group was 27.15±4.11 Kg/m2 (p=0.225). The mean waist circumference was 101.96±11.32 cm in the developed-CVE group, and 99.90±11.00 cm in the non-CVE group (p=0.460).
Baseline glycemic status (normoglycemic, Pre-DM, and T2D groups) was not significantly associated with CVE development at the end of the one-year follow-up period (p=0.319), participants who developed CVE exhibited a trend toward higher baseline HOMA-IR and fasting insulin concentrations (p=0.073 and p=0.054, respectively). The characteristics and biochemical parameters of subjects are summarized in Table 3.
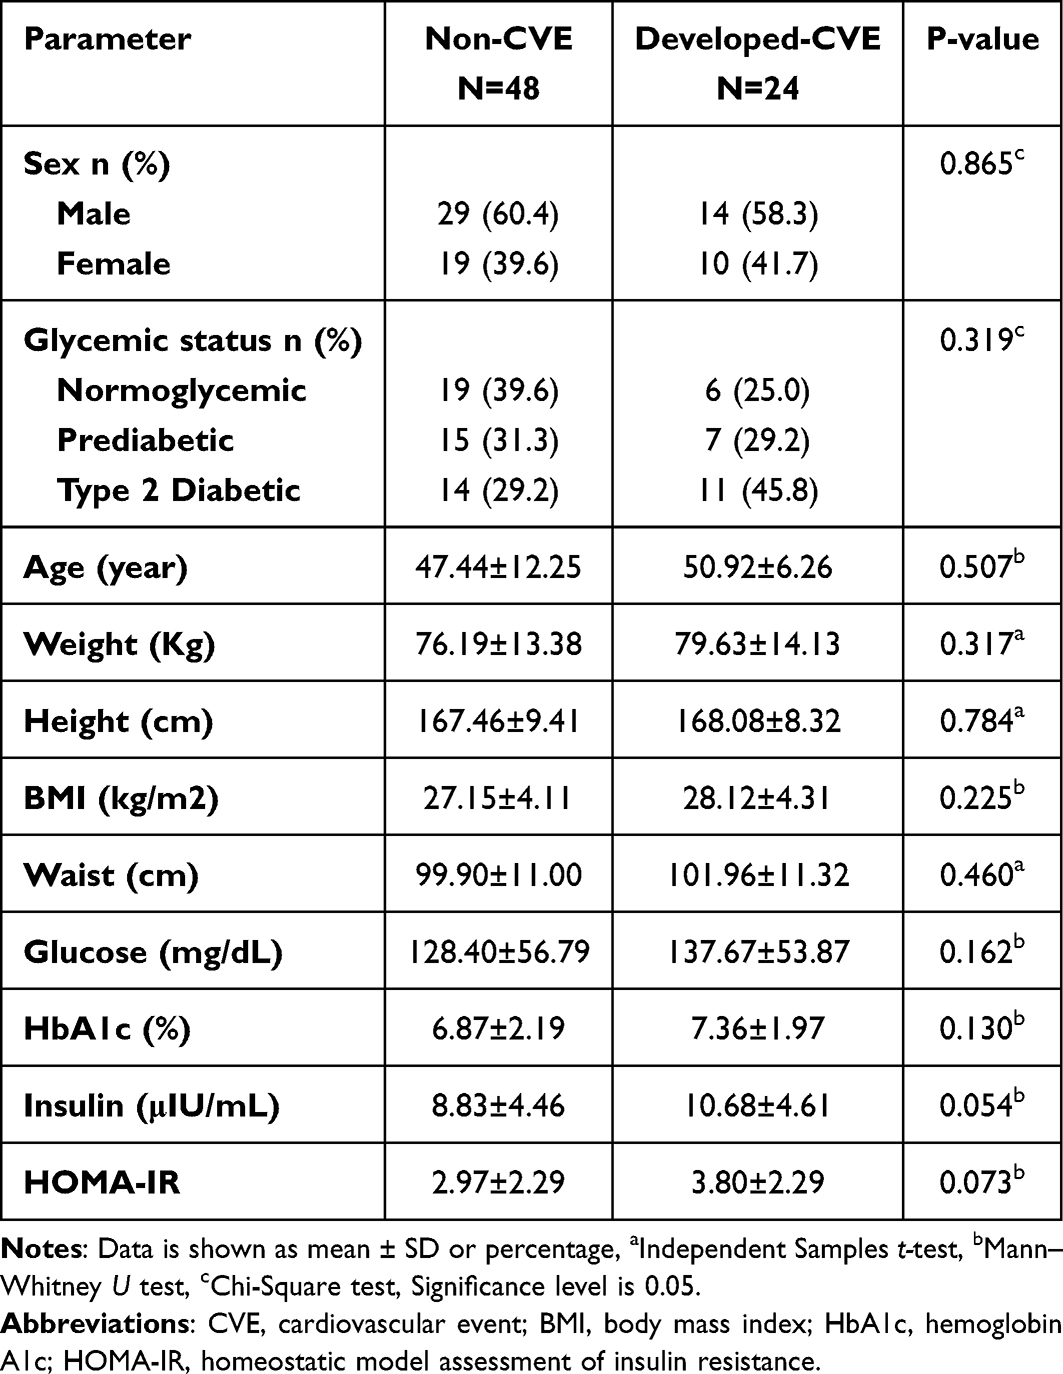 |
Table 3 Baseline Characteristics of Participants in Developed-CVE and Non-CVE Groups |
Our study revealed a significant difference in baseline serum concentrations of H-FABP and Hs-cTnI between the developed-CVE and non-CVE groups at the end of the one-year follow up period (p<0.001, p=0.001 respectively). Notably, baseline serum concentrations of both biomarkers were higher in the developed-CVE group, as shown in Figures 5 and 6, respectively.
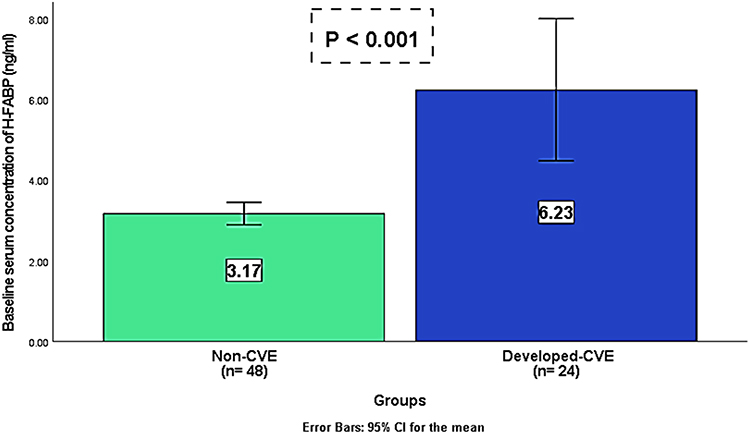 |
Figure 5 Comparison of H-FABP baseline serum concentrations between developed-CVE and non-CVE groups. |
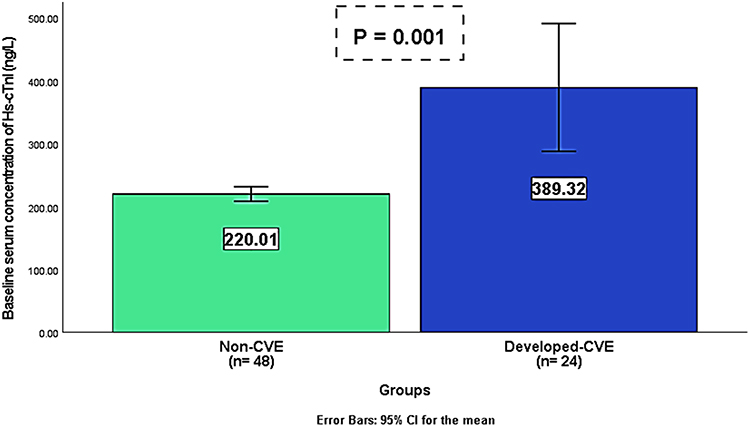 |
Figure 6 Comparison of Hs-cTnI baseline serum concentrations between developed-CVE and non-CVE groups. |
In addition, baseline serum concentrations of H-FABP and Hs-cTnI were positively correlated in both the developed-CVE and non-CVE groups. The correlation was stronger in the developed-CVE group (ρ=0.84, p<0.001), whereas a moderate positive correlation was observed in the non-CVE group (ρ=0.45, p=0.001), as shown in Figures 7 and 8, respectively.
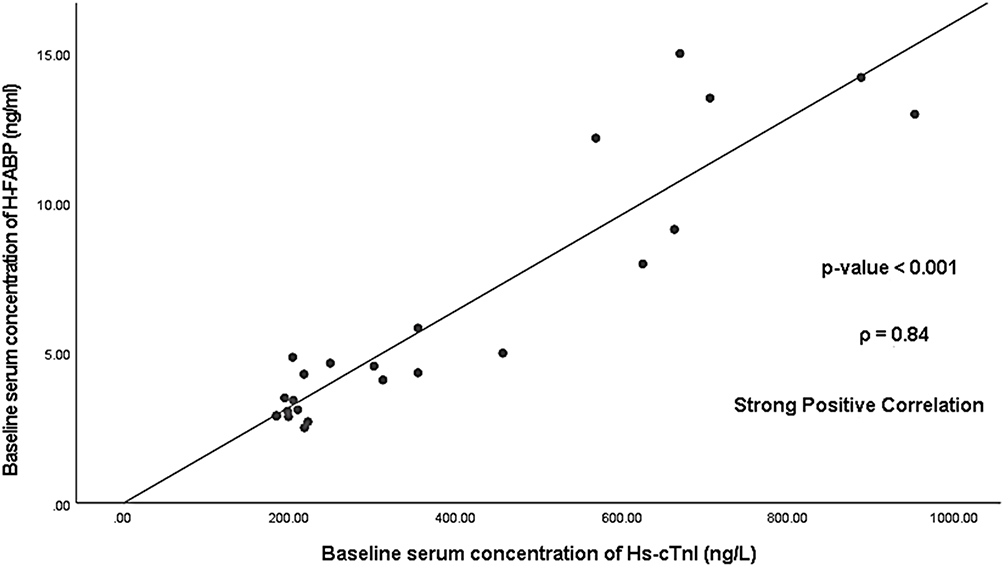 |
Figure 7 Correlation between baseline serum concentrations of H-FABP and Hs-cTnI in the developed-CVE group. |
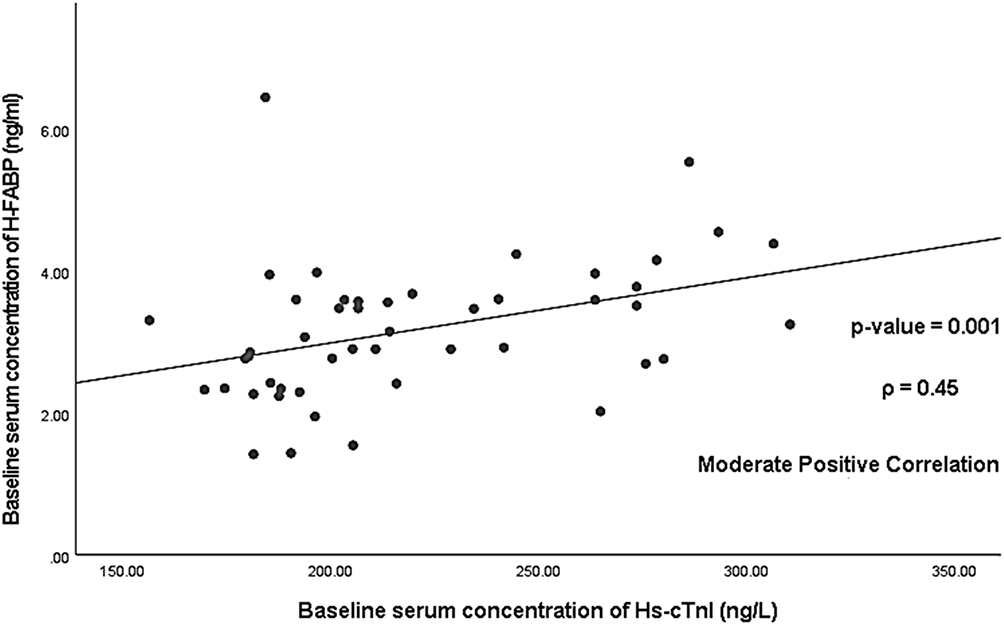 |
Figure 8 Correlation between baseline serum concentrations of H-FABP and Hs-cTnI in the non-CVE group. |
Binomial logistic regression models were employed to evaluate the likelihood of developing CVE one year after sampling. Each model incorporated a distinct biomarker—H-FABP or Hs-cTnI—alongside the same five additional predictor variables: glycemic status, sex, age, BMI, and HOMA-IR.
Model 1: H-FABP as a Predictor
The regression model evaluating baseline serum H-FABP concentrations as a predictor was statistically significant (p<0.001), explaining 43.9% of the variance in CVE development (Nagelkerke’s R2) and correctly classifying 79.2% of cases.
Among the six predictor variables, only H-FABP was statistically significant (p<0.001), with an odds ratio (OR) of 2.62 (95.0% CI: 1.33–5.15) per unit increase in baseline serum H-FABP concentrations, indicating an increased likelihood of CVE development.
Model 2: Hs-cTnI as a Predictor
Similarly, the regression model assessing baseline serum Hs-cTnI concentrations as a predictor was statistically significant (p<0.001), explaining 42.1% of the variance in CVE development (Nagelkerke’s R2) and correctly classifying 79.2% of cases.
Among the six predictor variables, only Hs-cTnI was statistically significant (p<0.001), with an OR of 1.02 (95.0% CI: 1.00–1.03) per unit increase in baseline serum Hs-cTnI concentrations, indicating an increased likelihood of CVE development.
The cut-off values for baseline serum concentrations of H-FABP and Hs-cTnI (4.04 ng/mL and 297.62 ng/L, respectively) were determined using ROC curve analysis, based on enrolment blood samples and comparison between patients who developed CVE and those who did not.
H-FABP demonstrated better predictive performance, with an AUC of 0.77 (95.0% CI: 0.65–0.89, p<0.001), compared to Hs-cTnI, which had an AUC of 0.73 (95% CI: 0.60–0.86, p=0.001).
Using the H-FABP cut-off value among 72 participants, 15 patients were true positive (TP), 6 were false positive (FP), 9 were false negative (FN), and 42 were true negative (TN). However, using the Hs-cTnI cut-off value, there were 12 TP, 2 FP, 12 FN, and 46 TN. The sensitivity, specificity, positive predictive value (PPV), and negative predictive value (NPV) for H-FABP and Hs-cTnI are presented in Table 4.
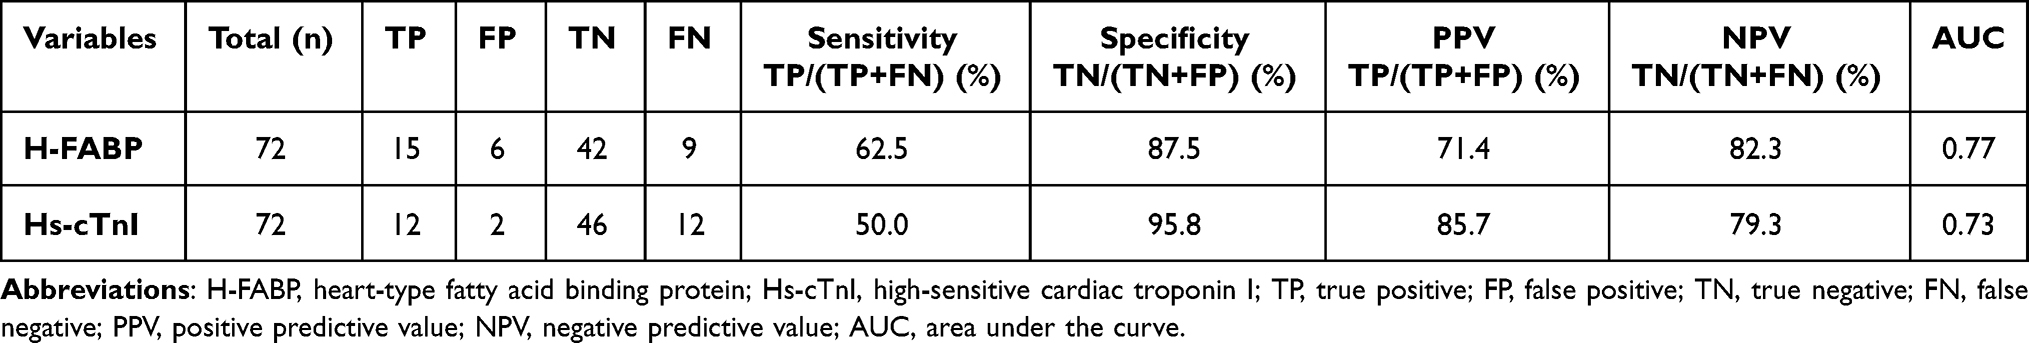 |
Table 4 Predictive Value of Baseline Serum Concentrations of H-FABP and Hs-cTnI in CVE Development |
Discussion
At baseline, the study cohort comprised newly diagnosed patients with T2D and Pre-DM, as well as normoglycemic participants. All were medication-free with no clinical myocardial symptoms. After one year, some participants had developed clinical CVE.
The purpose of this study was to evaluate and compare baseline serum concentrations of H-FABP and Hs-cTnI in newly diagnosed patients with T2D, Pre-DM, and normoglycemic controls, to assess the predictive value of these biomarkers for CVE, and to investigate potential correlations between H-FABP concentrations and HOMA-IR.
Apart from myocardial infarction,15,16 recent research has focused on H-FABP and its association with myocardial injury in the context of various metabolic disturbances, including diabetes, prediabetes, obesity, and non-alcoholic fatty liver disease, highlighting possible relationships between H-FABP and these metabolic conditions.20–23
In line with existing literature, our study demonstrated a strong and significant positive correlation between baseline serum concentrations of H-FABP and the established myocardial injury biomarker Hs-cTnI across participants with T2D, Pre-DM and normoglycemic groups.
These findings may indicate that cardiomyocytes are the likely source of baseline serum H-FABP concentrations and suggest that H-FABP could potentially reflect myocardial injury in T2D, Pre-DM, and normoglycemic groups. This is supported by the exclusive presence of cTnI within cardiomyocytes, in contrast to the broader tissue distribution of H-FABP.15,24
Moreover, based on the regression model, our study demonstrated that for every 1-unit increase in Hs-cTnI, H-FABP concentrations increased by 16.27 units. This finding may be explained by the fact that, within cardiomyocytes, H-FABP is abundantly located in the cytoplasm in a freely soluble form, whereas cTnI is predominantly bound within the contractile apparatus (despite of its cytoplasmic small fraction, approximately 3.0–4.0% of cardiac troponin I).9,17
The unique localization, molecular form, and distribution of H-FABP and Hs-cTnI may impact their sensitivity and specificity, highlighting their potential utility as myocardial injury indicators in T2D, Pre-DM, and normoglycemic populations.
Notably, no statistically significant correlation was observed between baseline myocardial injury indicators (H-FABP and Hs-cTnI) and insulin resistance, as measured by HOMA-IR, in the overall study population. Furthermore, our study found no significant differences in the baseline serum concentrations of these indicators across T2D, Pre-DM, and normoglycemic groups.
Our findings suggest that the newly identified type 2 diabetes without cardiometabolic comorbidities—representing a less advanced form of metabolic disturbance compared to established diabetes with complications—did not significantly impact the incidence of myocardial injury. This observation may, in part, be influenced by the relatively small sample size. However, prolonged exposure or progression to more advanced metabolic disturbances may contribute to significant myocardial damage and warrants further investigation. Additionally, the potential presence of subclinical or undetected cardiac risk factors may have influenced biomarkers concentrations among normoglycemic and prediabetic participants, potentially contributing to myocardial injury at a subclinical level.
The study by Akbal et al,25 reported that serum H-FABP concentrations were significantly higher in diabetic patients with metabolic syndrome (MTS) compared to nondiabetic MTS patients. Additionally, a significant difference was observed between nondiabetic MTS patients and control subjects, further supporting the association between H-FABP concentrations and the severity of metabolic disturbance.
In our study, T2D individuals with abnormal weight, reflecting a greater burden of metabolic disturbance relative to those with normal weight, exhibited a moderate positive correlation between baseline fasting insulin and baseline serum H-FABP concentrations.
This correlation highlights a broader metabolic interplay, where insulin resistance, through its influence on fasting insulin, may contribute to variations in H-FABP concentrations. These findings suggest a possible metabolic link between H-FABP and insulin resistance, particularly in individuals with greater burden of metabolic disturbances. This relationship likely reflects the effect of insulin resistance on the regulatory mechanisms governing H-FABP expression and serum concentrations.
H-FABP is involved in lipid transport and cardiomyocyte metabolic homeostasis. Its expression is influenced by microRNA-1 (miR-1), which is downregulated by insulin-like growth factor 1 (IGF-1).26 Additionally, fatty acids contribute to FABPs transcription through peroxisome proliferator-activated receptor α (PPAR-α).27 As ligand-activated transcription factor, PPAR-α regulates genes associated with fatty acid oxidation, including intracellular free fatty acid (FFA) transporters, mitochondrial import proteins, and essential enzymes for lipid metabolism.28
These insights could support the potential role of H-FABP as a cardiometabolic indicator of myocardial injury and may enhance its sensitivity, especially in conditions characterized by insulin resistance.
In addition, the present study demonstrated a positive correlation between baseline serum concentrations of H-FABP and Hs-cTnI in both the developed-CVE and non-CVE groups, with the association appearing more pronounced among individuals who subsequently developed CVE. This finding reinforces the notion that cardiomyocytes are the likely source of elevated baseline serum H-FABP concentrations.
Baseline serum concentrations of H-FABP and Hs-cTnI were significantly higher among participants who developed CVE compared to those who did not, suggesting that latent cardiac damage in the form of subclinical myocardial injury may have been present at baseline. Over the following year, this injury appeared to progress to clinical myocardial injury, manifesting as a CVE.
Binary logistic regression analysis, adjusted for glycemic status, HOMA-IR, sex, age, and BMI, revealed a statistically significant association between baseline serum concentrations of H-FABP and Hs-cTnI with CVE occurrence at the end of the one-year follow-up period. Both models demonstrating good predictive accuracy at 79.2%.
Sensitivity and specificity analysis demonstrated that the H-FABP model outperformed in terms of sensitivity, with an odds ratio of 2.62 (95.0% CI: 1.33–5.15). Conversely, the Hs-cTnI model showed superior specificity, with an odds ratio of 1.02 (95.0% CI: 1.00–1.03).
The predictive characteristics of the two biomarkers become evident at their respective cutoff values (4.04 ng/mL for H-FABP and 297.62 ng/L for Hs-cTnI). However, given the preliminary nature of this assessment, larger and more diverse cohorts are needed to validate their stability and clinical applicability.
H-FABP exhibited higher sensitivity (62.5%) and a superior negative predictive value (82.3%), but lower specificity (87.5%) and positive predictive value (71.4%) compared to Hs-cTnI. Conversely, Hs-cTnI demonstrated greater specificity (95.8%) and a higher positive predictive value (85.7%) but had lower sensitivity (50.0%) and a negative predictive value (79.3%) compared to H-FABP.
Based on the findings, the significance of both biomarkers cannot be overlooked, as each exhibits distinct characteristics that enhance its role as a cardiac biomarker. Given the superior sensitivity and negative predictive value of H-FABP compared to Hs-cTnI, future studies—if aligned and complementary—may benefit from utilizing H-FABP for the early exclusion of myocardial injury and indicating a reduced likelihood of developing CVE in the near future.
This advantage is attributed to its rapid release into the bloodstream upon myocardial injury, occurring earlier and at a higher rate than cardiac troponin due to its lower molecular weight and abundant free soluble presence within cardiomyocytes.10
H-FABP is believed to leak into the systemic circulation upon a transient increase in sarcolemmal membrane permeability, even following short-term ventricular stress, a phenomenon referred to as “wounding” of myocytes.11 Additionally, its serum concentrations can rise to more than 100 times those of cardiac troponin,10 which is predominantly bound to the myocardial contractile apparatus despite of its small cytoplasmic fraction.17
The high specificity of Hs-cTnI and its superior positive predictive value compared to H-FABP may be beneficial in strengthening the confirmation of myocardial injury and the cardiac origin of these biomarker concentrations in the bloodstream. Additionally, it may help indicate an increased likelihood of developing CVE in the future, following the initial indication of myocardial injury via H-FABP. This is attributable to the exclusive presence of cTnI within cardiomyocytes, in contrast to the broader distribution of H-FABP.15,24
In our study, baseline glycemic status did not have a significant impact on cardiac outcomes. However, a tendency toward higher HOMA-IR and fasting insulin concentrations was observed among participants who developed CVE, potentially due to several factors, including differences in medication management, patient compliance, dietary habits, blood sugar control, familial history or the presence of undetected cardiac risk factors. These variables may have contributed to CVE risk throughout the follow-up period. Additionally, this trend may have been influenced by the relatively small sample size of the study groups.
This follow-up study was conducted over approximately one year following sample collection, which may have limited our ability to capture the full clinical spectrum of CVEs, including symptoms that could emerge over a longer observation window. Furthermore, the limited sample size and the absence of repeated measurements of serum concentrations of the cardiac biomarkers H-FABP and Hs-cTnI following the initial sampling restricted our ability to fully assess their association with specific types of CVEs.
Additionally, the lack of cardiologist assessment at baseline may have impacted the identification of congenital or acquired cardiac conditions. Furthermore, CVE occurrence data was collected via phone interviews, introducing potential recall bias and limiting the accuracy of event verification.
Further studies are required to validate our findings. Larger prospective studies are essential to investigate the potential associations of H-FABP with various metabolic conditions, conventional myocardial injury indicators, atherosclerosis, and inflammatory markers.
Conclusions
The strong correlation found between H-FABP and Hs-cTnI concentrations across T2D, Pre-DM, and normoglycemic groups highlights the potential utility of H-FABP as a cardiac biomarker for myocardial injury across different glycemic statuses. In cases of newly identified glucose dysregulation without cardiometabolic comorbidities, myocardial damage may not be significantly affected, although subclinical or undetected cardiac risk factors may still contribute. However, among individuals with a greater burden of metabolic disturbance, a potential link between H-FABP and insulin resistance, suggesting that H-FABP may serve as a cardiometabolic indicator of myocardial injury in metabolic disorders, especially in conditions associated with insulin resistance.
This study suggests that baseline serum concentrations of H-FABP and Hs-cTnI could have predictive value for CVEs in medication- free individuals newly diagnosed with T2D, prediabetes, or normoglycemia, and without clinical myocardial symptoms. Both biomarkers were independently associated with CVE occurrence after adjustment for confounding variables.
H-FABP appeared to demonstrate greater sensitivity and negative predictive value, which may support its potential use in early exclusion of myocardial injury and in identifying individuals at lower short-term risk. Conversely, Hs-cTnI showed relatively higher specificity and positive predictive value, indicating its possible utility in confirming myocardial injury and identifying those at higher short-term risk for future CVE.
Abbreviations
CVD, Cardiovascular Disease; T2D, Type 2 Diabetes; Pre-DM, Prediabetes; CAN, Cardiac Autonomic Neuropathy; H-FABP, Heart-Type Fatty Acid Binding Protein; PUFA, Polyunsaturated Fatty Acid; PPAR, Peroxisome Proliferator-Activated Receptor; ACS, Acute Coronary Syndrome; cTnI, Cardiac Troponin I; Hs-cTnI, High-Sensitivity Cardiac Troponin I; CVE, Cardiovascular Event; BMREC, Biomedical Research Ethics Committee; ADA, American Diabetes Association; HbA1c, Hemoglobin A1C; T1D, Type 1 Diabetes; GD, Gestational Diabetes; HOMA-IR, Homeostatic Model Assessment of Insulin Resistance; BMI, Body Mass Index; RCF, Relative Centrifugal Force; ELISA, Enzyme-Linked Immunosorbent Assay; TINIA, Turbidimetric Inhibition Immunoassay; ECLIA, Electrochemiluminescence Immunoassay; SPSS, Statistical Package for the Social Sciences; SD, Standard Deviation; ROC, Receiver Operating Characteristics; AUC, Area Under the Curve; OR, Odds Ratio; TP, True Positive; FP, False Positive; FN, False Negative; TN, True Negative; PPV, Positive Predictive Value; NPV, Negative Predictive Value; MTS, Metabolic Syndrome; miR-1, MicroRNA-1; IGF-1, Insulin-Like Growth Factor 1; FFA, Free Fatty Acid.
Data Sharing Statement
All materials and data generated during this study are included in this article.
Ethics Approval and Informed Consent
Blood samples were obtained after receiving ethical approval by the Biomedical Research Ethics Committee (BMREC) of Damascus University (Session 5, Date 29/01/2022) (reference number PH-290122-28), in accordance with the Declaration of Helsinki (1964). A written informed consent was obtained from each participant.
Author Contributions
All authors made a significant contribution to the work reported, whether that is in the conception, study design, execution, acquisition of data, analysis and interpretation, or in all these areas; took part in drafting, revising, or critically reviewing the article; gave final approval of the version to be published; have agreed on the journal to which the article has been submitted; and agree to be accountable for all aspects of the work.
Funding
The authors received no specific grant from any funding agency for the research or for the publication.
Disclosure
The authors declare that they have no competing interests. This declaration includes all financial and non-financial competing interests.
References
1. Cesare MD, Bixby H, Gaziano T, et al. World Heart Report 2023: confronting the World’s Number One Killer. 2023.
2. Battault S, Renguet E, Van Steenbergen A, Horman S, Beauloye C, Bertrand L. Myocardial glucotoxicity: mechanisms and potential therapeutic targets. Arch Cardiovasc Dis. 2020;113(11):736–748. doi:10.1016/j.acvd.2020.06.006
3. Wu H, Norton V, Cui K, et al. Diabetes and its cardiovascular complications: comprehensive network and systematic analyses. Front Cardiovasc Med. 2022;9:841928. doi:10.3389/fcvm.2022.841928
4. Schernthaner G, Lotan C, Baltadzhieva-Trendafilova E, et al. Unrecognised cardiovascular disease in type 2 diabetes: is it time to act earlier? Cardiovasc Diabetol. 2018;17(1):145. doi:10.1186/s12933-018-0788-7
5. Abdul Manan H, Chishti HR, Hewlett FD. Prevalence and predictors of silent myocardial ischemia in diabetic patients. Cureus. 2025;17(4):e82407. doi:10.7759/cureus.82407
6. Rokicka D, Bożek A, Wróbel M, et al. Identification of silent myocardial ischemia in patients with long-term type 1 and type 2 diabetes. Int J Environ Res Public Health. 2022;19(3):1420. doi:10.3390/ijerph19031420
7. Theofilis P, Antonopoulos AS, Sagris M, et al. Silent myocardial ischemia: from pathophysiology to diagnosis and treatment. Biomedicines. 2024;12(2):259. doi:10.3390/biomedicines12020259
8. Mfeukeu-Kuate L, Meyanui VA, Jingi AM, et al. Prevalence and determinants of silent myocardial ischemia in patients with type 2 diabetes in Cameroon: a cross-sectional study. Pan Afr Med J. 2022;42:41. doi:10.11604/pamj.2022.42.41.34941
9. Jaiswal A. H-FABP as a diagnostic marker for early detection of young myocardial infarction among Indians. Bioinformation. 2022;18(6):506–512. doi:10.6026/97320630018506
10. Goel H, Melot J, Krinock MD, Kumar A, Nadar SK, Lip GYH. Heart-type fatty acid-binding protein: an overlooked cardiac biomarker. Ann Med. 2020;52(8):444–461. doi:10.1080/07853890.2020.1800075
11. Rezar R, Jirak P, Gschwandtner M, et al. Heart-type fatty acid-binding protein (H-FABP) and its role as a biomarker in heart failure: what do we know so far? J Clin Med. 2020;9(1):164. doi:10.3390/jcm9010164
12. Das UN. Heart-type fatty acid-binding protein (H-FABP) and coronary heart disease. Indian Heart J. 2016;68(1):16–18. doi:10.1016/j.ihj.2015.07.030
13. Zhang HW, Jin JL, Cao YX, et al. Heart-type fatty acid binding protein predicts cardiovascular events in patients with stable coronary artery disease: a prospective cohort study. Ann Transl Med. 2020;8(21):1349. doi:10.21037/atm-20-2493
14. Ho SK, Wu YW, Tseng WK, et al. The prognostic significance of heart-type fatty acid binding protein in patients with stable coronary heart disease. Sci Rep. 2018;8(1):14410. doi:10.1038/s41598-018-32210-x
15. Wong YK, Tse HF. Circulating biomarkers for cardiovascular disease risk prediction in patients with cardiovascular disease. Front Cardiovasc Med. 2021;8:713191. doi:10.3389/fcvm.2021.713191
16. Ye XD, He Y, Wang S, Wong GT, Irwin MG, Xia Z. Heart-type fatty acid binding protein (H-FABP) as a biomarker for acute myocardial injury and long-term post-ischemic prognosis. Acta Pharmacol Sin. 2018;39:1155–1163. doi:10.1038/aps.2018.37
17. Chaulin A. Metabolic pathway of cardiac troponins and its diagnostic value. Vasc Health Risk Manag. 2022;18:153–180. doi:10.2147/VHRM.S335851
18. Sigurdardottir FD, Lyngbakken MN, Holmen OL, et al. Relative prognostic value of cardiac Troponin I and C-reactive protein in the general population (From the HUNT Study). Am J Cardiol. 2018;121(8):949–955. doi:10.1016/j.amjcard.2018.01.004
19. Lan NSR, Bell DA, Mccaul KA, et al. High-sensitivity cardiac Troponin I improves cardiovascular risk prediction in older men: HIMS (The Health in Men Study). J Am Heart Assoc. 2019;8:e011818. doi:10.1161/JAHA.118
20. Beysel S, Kizilgul M, Ozbek M, et al. Heart-type fatty acid binding protein levels in elderly diabetics without known cardiovascular disease. Clin Interv Aging. 2017;12:2063–2068. doi:10.2147/CIA.S137247
21. Ramesh P, Chauhan A, Goyal P, Singh A, Singhal A, Gupta A. Serum heart type fatty acid binding protein levels in prediabetes-an invaluable cardiovascular biomarker. J Assoc Phys India. 2020;68(4):42–46.
22. Ramesh P, Chauhan A, Goyal P, Singh A. H-FABP: a beacon of hope for prediabetic heart disease. J Family Med Prim Care. 2020;9(7):3421–3428. doi:10.4103/jfmpc.jfmpc_296_20
23. Başar O, Akbal E, Köklü S, et al. Increased H-FABP concentrations in nonalcoholic fatty liver disease: possible marker for subclinical myocardial damage and subclinical atherosclerosis. Herz. 2013;38(4):417–422. doi:10.1007/s00059-012-3714-x
24. Venu AP, Rajkumar R, Roy DD, et al. Association of H-FABP with cardiovascular events: a systematic review. J Cardiovasc Thorac Res. 2024;16(2):77–87. doi:10.34172/jcvtr.33039
25. Akbal E, Özbek M, Güneş F, Akyürek Ö, Üreten K, Delibaşı T. Serum heart type fatty acid binding protein levels in metabolic syndrome. Endocrine. 2009;36(3):433–437. doi:10.1007/s12020-009-9243-6
26. Varrone F, Gargano B, Carullo P, et al. The circulating level of FABP3 is an indirect biomarker of microRNA-1. J Am Coll Cardiol. 2013;61(1):88–95. doi:10.1016/j.jacc.2012.08.1003
27. Catalucci D, Latronico MVG, Condorelli G. FABP3 as biomarker of heart pathology. In: General Methods in Biomarker Research and Their Applications. Vols. 1-2. Springer International Publishing; 2015:439–454. doi:10.1007/978-94-007-7696-8_22
28. Ormazabal V, Nair S, Elfeky O, Aguayo C, Salomon C, Zuñiga FA. Association between insulin resistance and the development of cardiovascular disease. Cardiovasc Diabetol. 2018;17(1):122. doi:10.1186/s12933-018-0762-4
 © 2025 The Author(s). This work is published and licensed by Dove Medical Press Limited. The
full terms of this license are available at https://www.dovepress.com/terms
and incorporate the Creative Commons Attribution
- Non Commercial (unported, 4.0) License.
By accessing the work you hereby accept the Terms. Non-commercial uses of the work are permitted
without any further permission from Dove Medical Press Limited, provided the work is properly
attributed. For permission for commercial use of this work, please see paragraphs 4.2 and 5 of our Terms.
© 2025 The Author(s). This work is published and licensed by Dove Medical Press Limited. The
full terms of this license are available at https://www.dovepress.com/terms
and incorporate the Creative Commons Attribution
- Non Commercial (unported, 4.0) License.
By accessing the work you hereby accept the Terms. Non-commercial uses of the work are permitted
without any further permission from Dove Medical Press Limited, provided the work is properly
attributed. For permission for commercial use of this work, please see paragraphs 4.2 and 5 of our Terms.