Back to Journals » Clinical and Experimental Gastroenterology » Volume 13
Gut Dysbiosis and Increased Intestinal Permeability Drive microRNAs, NLRP-3 Inflammasome and Liver Fibrosis in a Nutritional Model of Non-Alcoholic Steatohepatitis in Adult Male Sprague Dawley Rats
Authors Longo L ![]() , Tonin Ferrari J
, Tonin Ferrari J ![]() , Hirata Dellavia G
, Hirata Dellavia G ![]() , Pasqualotto A, P Oliveira C
, Pasqualotto A, P Oliveira C ![]() , Thadeu Schmidt Cerski C, Reverbel da Silveira T, Uribe-Cruz C
, Thadeu Schmidt Cerski C, Reverbel da Silveira T, Uribe-Cruz C ![]() , Álvares-da-Silva MR
, Álvares-da-Silva MR ![]()
Received 25 May 2020
Accepted for publication 23 July 2020
Published 18 September 2020 Volume 2020:13 Pages 351—368
DOI https://doi.org/10.2147/CEG.S262879
Checked for plagiarism Yes
Review by Single anonymous peer review
Peer reviewer comments 2
Editor who approved publication: Professor Everson Artifon
Larisse Longo, 1, 2 Jéssica Tonin Ferrari, 2 Pabulo Henrique Rampelotto, 2, 3 Gustavo Hirata Dellavia, 4 Amanda Pasqualotto, 2 Claudia P Oliveira, 5 Carlos Thadeu Schmidt Cerski, 1, 4, 6 Themis Reverbel da Silveira, 2 Carolina Uribe-Cruz, 1, 2 Mário Reis Álvares-da-Silva 1, 2, 4, 7
1Graduate Program in Gastroenterology and Hepatology, Universidade Federal do Rio Grande do Sul, Porto Alegre, Rio Grande do Sul, Brazil; 2Experimental Laboratory of Hepatology and Gastroenterology, Center for Experimental Research, Hospital de Clínicas de Porto Alegre, Porto Alegre, Rio Grande do Sul, Brazil; 3Graduate Program in Pharmaceutical Sciences, Universidade Federal do Rio Grande do Sul, Porto Alegre, Rio Grande do Sul, Brazil; 4School of Medicine, Universidade Federal do Rio Grande do Sul, Porto Alegre, Rio Grande do Sul, Brazil; 5Department of Gastroenterology (LIM07), Faculdade de Medicina da Universidade de São Paulo, São Paulo, Brazil; 6Unit of Surgical Pathology, Hospital de Clínicas de Porto Alegre, Porto Alegre, Rio Grande do Sul, Brazil; 7Division of Gastroenterology, Hospital de Clínicas de Porto Alegre, Porto Alegre, Rio Grande do Sul, Brazil
Correspondence: Larisse Longo Email [email protected]
Background/Aim: The interactions between the gut and liver have been described in the progression of non-alcoholic steatohepatitis (NASH). The aim of this study was to develop an experimental nutritional model of NASH simulating metabolic changes occurring in humans.
Materials and Methods: Adult male Sprague Dawley rats were randomized into two groups: controls (standard diet) and intervention (high-fat and choline-deficient diet) for 16 weeks, each experimental group with 10 animals. Biochemical analysis, hepatic lipid content, microRNAs, inflammatory, gut permeability markers and gut microbiota were measured.
Results: Animals in the intervention group showed significantly higher delta Lee index (p=0.017), abdominal circumference (p< 0.001), abdominal adipose tissue (p< 0.001) and fresh liver weight (p< 0.001), as well as higher serum levels of alanine aminotransferase (p=0.010), glucose (p=0.013), total cholesterol (p=0.033), LDL cholesterol (p=0.011), and triglycerides (p=0.011), and lower HDL cholesterol (p=0.006) compared to the control group. Higher TLR4 (p=0.041), TLR9 (p=0.033), MyD88 (p=0.001), Casp1 (p< 0.001), NLPR3 (p=0.019), liver inflammation index interleukin (IL)-1β/IL10 (p< 0.001), IL6/IL10 (p=0.002) and TNFα/IL10 (p=0.001) were observed in the intervention group, and also lower permeability markers Ocln (p=0.003) and F11r (p=0.041). Gene expression of miR-122 increased (p=0.041) and miR-145 (p=0.010) decreased in the intervention group. Liver steatosis, inflammation and fibrosis, along with collagen fiber deposition increment (p< 0.001), were seen in the intervention group. Regarding gut microbiota, Bray-Curtis dissimilarity index and number of operational taxonomic units were significantly different (p< 0.001) between the groups. Composition of the gut microbiota showed a significant correlation with histopathological score of NAFLD (r=0.694) and index IL-1β/IL-10 (r=0.522).
Conclusion: This experimental model mimicking human NASH demonstrated gut and liver interaction, with gut microbiota and intestinal permeability changes occurring in parallel with systemic and liver inflammation, miRNAs regulation and liver tissue damage.
Keywords: fatty liver disease models, fibrosis, gut microbiota, non-alcoholic fatty liver disease, non-alcoholic steatohepatitis
Erratum for this paper has been published
Introduction
Non-alcoholic fatty liver disease (NAFLD) encompasses a large spectrum of histological features ranging from simple steatosis, characterized by fat accumulation in the liver, to non-alcoholic steatohepatitis (NASH), associated with hepatocytes ballooning, inflammation and/or fibrosis, finally driving to liver cirrhosis and hepatocellular carcinoma (HCC).1,2 NAFLD affects over 20% of people in the West, and up to one-third of people living in South America or the Middle East.2 Currently, NASH‐associated cirrhosis has become the second leading indication for adult liver transplantation in the United States and several data suggest that the problem will become even more common and more serious not only in the United States but worldwide.1,3,4 With the increased prevalence of NAFLD, it is expected that by 2030, there will be an increase in the number of cases of decompensated cirrhosis (168%), HCC (137%) and hepatic death (178%).3
Sedentary lifestyle, inappropriate food intake with high fat and fructose consumption, as well as obesity, metabolic disorders, hormonal status and genetic background, have been described as the primary “culprits” of NASH.5,6 Despite its complexity, most cases of hepatic steatosis are reversible if the causative factor is eliminated. Independent of this knowledge, the reason why some patients develop NASH with fibrosis and progress to advanced liver disease is still unclear, it is known that there is a complex interplay that involves either liver cell population (both parenchymal and nonparenchymal) and pathological signals coming from other organs, such as adipose tissue and the gut, these factors being the target of several studies.5,7,8 The interactions between the gut and liver, called the gut–liver axis, play an essential role in this situation.7,8
The gut microbiota is a complex ecosystem where 1014 microorganisms coexist and your composition differs along the different portions of the intestine, this being strictly associated with physiological conditions, such as gastrointestinal content flow rates, disposability of substrates for microorganisms, lumen pH, oxygen availability and immunological features.7,8 In the absence of disease, the gut microbiota maintains a symbiotic relationship with the host, the mucosal barriers within the intestinal tract remain intact, preventing the transport of luminal microbes into the liver and intestinal bacteria act energy metabolism regulation.7–9 A regular healthy balanced diet has been shown to maintain a stable and healthy gut microbiota, however, long-term intake of unhealthy diet (eg, high-fat, carbohydrates or fructose) initiates dysbiosis of gut microbiota which in turn leads to disruption in barrier function and immune homeostasis, increasing the risk of developing obesity and NAFLD.10,11 In these cases, there is an increased intestinal permeability leads to translocation to the liver through the portal vein of microbes and microbial products including cell-wall components and DNA, together referred to as microbial- (or pathogen-) associated molecular patterns (MAMPs/PAMPs). These patterns are recognized by immune receptors on liver cells such as Kupffer cells and hepatic stellate cells which initiate and maintain inflammatory cascades that ultimately lead to liver damage in the form of fibrosis.8,12 During this process, epigenetic changes also occur, mediated by microRNAs that act in the expression or suppression of genes responsible for the worsening of liver damage. These factors not only drive hepatic inflammation and progressive fibrosis but also contribute to mortality in end-stage liver disease due to their role in secondary infections such as spontaneous bacterial peritonitis and hepatic encephalopathy.9 While intestinal permeability is not the primary driver of liver inflammation and fibrosis, it has become evident that the inflammatory response to microbial antigens as a result of increased intestinal permeability strongly influences the progression of disease.9,12
Despite the growing public health impact of NASH, treatment options remain limited and there are no FDA-approved therapies.6,8 Accordingly, well-designed experimental models and clinical studies are useful to elucidate the molecular events involved in the interaction between the intestine and the liver, as well as to develop effective therapeutic strategies. Various models of NASH have been described, whether nutritional, genetic or pharmacological, but most show limitations in the replication of the disease phenotypes seen in humans.13–16 Among the nutritional models, those that use a diet deficient in essential amino acids, such as methionine and choline, promote the reduction of hepatic secretion of very low-density lipoproteins (VLDL), causing liver inflammation and fibrosis, but the animals do not have other metabolic characteristics observed in NASH, including obesity, insulin resistance and dyslipidemia.17–19 The same changes are observed in high-fat diets; however, the degree of liver damage is not as severe.20 The challenge of researchers will be to establish the optimal animal model which could mirror human disease by providing the same pathological triggers, as well as reproducible mechanisms of progression towards NASH and its complications, in order to elucidate NASH pathogenesis and allow the development of effective therapies.6,8 Thus, the objectives of this study were: 1) to develop an experimental dietary model of metabolic origin that reproduces the poor eating habits of the human population, culminating in the development of obesity and NASH; and 2) evaluate the role of gut microbiota composition, intestinal permeability and inflammation in the progression of liver fibrosis in this model.
Materials and Methods
Animals
Twenty adults (60 days old) male Sprague Dawley rats weighing 280–350 g were used. The animals were randomized by weight, and two rats were housed per polypropylene cage with sawdust-covered floors. The animals were kept in a controlled temperature environment (22 ± 2°C) and a 12-hour light/dark cycle. All experimental procedures were approved by the Ethics Committee for the Use of Animals of Hospital de Clínicas de Porto Alegre (protocol approval number No. 2017–0021) and were compliant with Brazilian guidelines involving the use of animals in research (Law No. 11794). The minimum number of animals required to produce reliable scientific data were used.
Study Design and Dietary Interventions
After acclimatization to the environment, the animals were randomized into two experimental groups: a control group (n = 10) that received standard diet and an intervention group (n = 10) that received high-fat and choline-deficient (HFCD) diet.
The animals in the control group received a standard diet (Nuvilab CR-1, Quimtia S.A., Brazil) with an energy value of 2.93 kcal/g (information provided by the manufacturer). This diet consisted of 55.0% carbohydrates, 22.0% protein, 4.5% fat and 18.5% other constituents (fiber and vitamins). The animals in the intervention group received a HFCD diet (RH19576 – Rhoster, Brazil) with an energy value of 4.3 kcal/g (information provided by the manufacturer). This product consisted of 54.5% carbohydrates, 14.0% protein and 31.5% fat (enriched with 54.0% trans fatty acids). The diet of the intervention group was chosen because it recalls many of the phenotypes observed in humans with NAFLD. The diet offered to the animals of the control and intervention groups was replaced every two days. Both groups had water and food supplied ad libitum during the experiment period.
The animals were weighed (g) weekly for 16 weeks. Naso-anal length (cm) was measured in the initial and final week of the study for determination of delta Lee index. This index is calculated as the ratio between the cube root of body weight and the naso-anal length of animals multiplied by 10 (g/cm).21 Animals of both groups were euthanized after 16 weeks. Serum samples, abdominal adipose tissue, feces present in the intestine, fragments of liver and small intestine were collected aseptically, frozen in liquid nitrogen and stored in a freezer −80 ºC until the proposed evaluations were carried out. A portion of the liver tissue and small intestine was fixed in 10% formalin for histological analysis.
Biochemical Analysis
Prior to euthanasia, the animals fasted for eight hours and were then anesthetized with 5% isoflurane (Instituto BioChimico, Indústria Farmacêutica Ltda.). The animals were euthanized by cardiac exsanguination. Serum levels of aspartate aminotransferase (AST), alanine aminotransferase (ALT), glucose, albumin, total cholesterol, low-density lipoprotein (LDL), high-density lipoprotein (HDL) and triglycerides were determined using Labmax 560.
Quantitative Analysis of Liver Fat Deposition
Liver fat deposition was determined using the modified protocol of Gómez-Lechón et al.22 In brief, liver tissue fragments were homogenized in phosphate buffer (20 mg tissue/mL) and incubated with 1 μL of Nile Red solution (1 mg/mL in acetone) at 37°C for 15 minutes. Fluorescence was measured at 488 nm excitation and 550 nm emission (SpectraMax M3). The values obtained were normalized to total protein present in the homogenate.23 The results were expressed as fluorescence/μg protein.
Protein Evaluation of Hepatic Inflammatory Mediators
We performed the assessment of inflammatory cytokine, tumor necrosis factor (TNF)-α, interleukin (IL)-6, IL-10 (Invitrogen, USA) and IL-1β (Thermo Scientific, USA), through the ELISA technique. All analyses were done in duplicate and according to the manufacturer’s instructions. Absorbance was measured in a spectrophotometer at 450 nm (Zenyth 200 rt). Cytokine concentrations were determined using a standard curve and the results were expressed in pg/mg protein. The data obtained were used to calculate the balance between pro-inflammatory and anti-inflammatory cytokines, an inflammatory index.
Assessment of the Gene Expression of Gut Permeability Markers and Hepatic Inflammation
The total RNA was extracted from fragments of the small intestine and liver tissue using the RNeasy mini kit (Qiagen, USA). The cDNA conversion, from 2 μg of RNA, was performed using the High-capacity cDNA Reverse Transcription kit (Applied Biosystems, USA). qRT-PCR with TaqMan assay (Applied Biosystems, USA) was used to assess the gene expression of Cldn1, Cldn4, Ocln e F11r (JAM-1) in small intestine. From the liver tissue, we carry out the analysis of the gene expression of Tnfa, Il1b, Il6, Il10, Il18, Myd88, Tlr4, Tlr2, Tlr9, Ppara, Casp1 and Nlrp3. The Actb gene was used as a normalizer in both tissues. The probes used are described in Supplementary Table 1. Values were calculated with the formula 2 −(ΔΔCt).
Analysis of the Circulating microRNAs
To analyze the circulating microRNAs from serum, total RNA was extracted using the miRNeasy serum/plasma kit (Qiagen, USA). Then, cel-miR-39 (1.6×10⁸ copies) spike in control (Qiagen, USA) was added to provide an internal reference. cDNA conversion was performed from 10ng of total RNA using the TaqMan microRNA Reverse Transcription kit (Applied Biosystems, USA). Analysis of the gene expression of miR-122, miR-145 and miR-143, together with the cell-miR-39 normalizer, was performed by RT-qPCR using TaqMan assay (Applied Biosystems, USA). The sequences and codes of the assessed microRNAs are described in Supplementary Table 1. Values were calculated by formula 2 −(ΔΔCt).
DNA Extraction, 16S rRNA Sequencing and Bioinformatics Analyses
The bacterial DNA was isolated from the fecal samples using the QIAamp fast DNA stool mini kit (Qiagen, USA), following the manufacturer’s instructions. The hypervariable V4 region from the rRNA gene was amplified by PCR using the 515F–806R primer pair. To pool different samples in the same reaction, we used the primer-fusion method and each sample had a distinct barcode attached on the corresponding PCR product. The purified products were subjected to emulsion PCR using Ion PGM™ Hi-Q™ view OT2 kit (Thermo Fisher Scientific, USA). After the resulting enriched beads were sequenced in an NGS machine (Ion Torrent PGM, Life Technologies) using Ion PGM™ Hi-Q™ view sequencing kit (Thermo Fisher Scientific, USA). The sequence data exported from the Ion PGM™ System were processed using a custom pipeline in Mothur v.1.41.1.24 Quality control was conducted by trimming the low-quality reads, those with incorrect length, those containing an ambiguous base, or containing homopolymers longer than 8 bp. All potentially chimeric sequences were identified and removed using VSEARCH.25 After these initial quality filtering and trimming steps, the remaining sequences were clustered into Operational Taxonomic Units (OTUs) based on a 99% identity level and were classified against the SILVA v132 reference database at 97% similarity.26
To reduce spurious OTUs caused by PCR or sequencing errors, an additional filtering step was performed by removing OTUs with less than 10 reads. The resulting OTU table was normalized using the cumulative sum scaling (CSS) method. Subsequent analyses of the sequence dataset were performed in R v. 3.6.1 (using vegan, phyloseq and ggplot2 packages) or QIIME v. 1.9.1.27 To identify differentially abundant phyla, the linear discriminant effect size (LEfSe) method was performed.28 The algorithm performs a nonparametric factorial Kruskal–Wallis sum rank test and linear discriminant analysis (LDA) to determine statistically significant different features among taxa and estimates the effect size of the difference. Differences were considered significant for a logarithmic LDA score threshold of ±1.0 and a p-value <0.05 after adjusting for multiple hypotheses testing with the Benjamini–Hochberg method.
Histopathological Analysis
Formalin-fixed liver tissue samples were embedded in paraffin and subjected to hematoxylin and eosin (H&E) and picrosirius staining. Histopathological lesions of the different evolutionary stages of NAFLD were performed according to the score by Liang et al, which is a highly reproducible scoring system and applicable to the experimental models in rodents.29 The analysis was performed by an experienced pathologist, blinded to the experimental groups. Fibrosis was quantified by morphometric analysis after picrosirius staining. Ten randomly selected field images were obtained per animal, using the Olympus BX51 microscope, and the QCapture X64 program with 200X magnification was used to determine staining intensity. This evaluation was performed using the ImageJ program (version 1.51p).
Formalin-fixed small intestine tissue samples were embedded in paraffin and subjected to H&E. The evaluation was performed by an experienced pathologist, blinded to the experimental groups. The slides were photographed using the Olympus BX51 microscope with 40X magnification. The images were used to evaluate the intestinal lesion for
Correlations Between the Analyzed Markers
For this analysis, we selected the NAFLD scoring system, index TNF-α/IL-10 and index IL-1β/IL-10 as markers of severity and inflammation of NASH. For the correlation of intestinal permeability, we selected Ocln and F11r (JAM-1). The overall microbiota composition was correlated with all these variables.
Statistical Analysis
Data symmetry was tested using the Shapiro–Wilk test. Student t, Mann–Whitney U and chi-square tests complemented by adjusted residual analysis were performed. A longitudinal data analysis was carried out using the generalized estimating equations (GEE) followed by Bonferroni’s post hoc test. Spearman correlation coefficient was performed, with a moderate (0.3 < r < 0.6) or strong (0.6 < r < 0.9) correlation were adopted. Quantitative variables were expressed as mean ± standard deviation or median and minimum and maximum values. p ≤ 0.05 was considered statistically significant. Data were analyzed in the Statistical Package for Social Sciences 18.0 (SPSS Inc., USA).
Results
General Characteristics of the Dietary Model
Baseline bodyweight of the animals in the two groups was similar (p = 0.962), demonstrating homogeneity. From the first week after the introduction of the HFCD diet, animals in the intervention group showed a gradual increase in body weight, and a significant difference between the groups became evident starting on the 6th week of the experiment (p < 0.001) (Figure 1A). The animals in the intervention group showed significantly greater delta Lee index (p = 0.017) (Figure 1B), abdominal circumference (p < 0.001) (Figure 2A) and abdominal adipose tissue accumulation (p < 0.001) (Figure 2B) compared to the control group. There were no abnormalities in the macroscopic appearance of the liver in the control animals, whereas in the intervention group the liver had a yellowish and greasy appearance, characteristic of steatosis (Figure 2C-D). Fresh liver weight (Figure 2E) and liver weight/body weight ratio (Figure 2F) were significantly higher (both p < 0.001) in intervention animals compared to the control group.
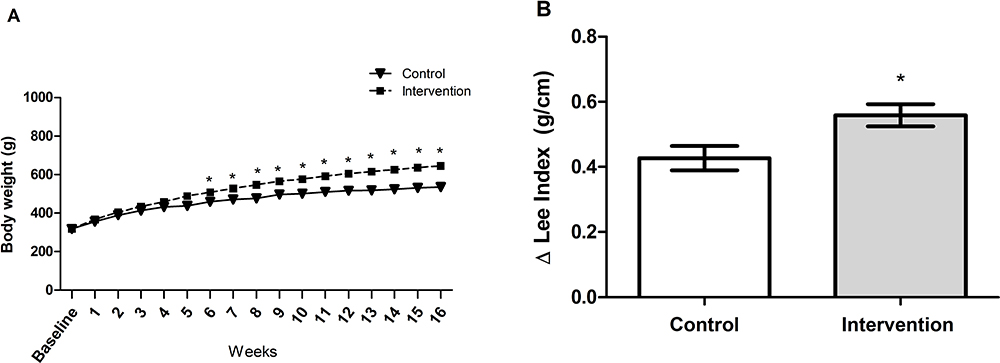 |
Figure 1 (A) Determination of body weight parameters (p <0.001): a significant difference between groups is observed starting in the sixth week. * significant effect of the high-fat and choline-deficient diet according generalized estimating equations (GEE) followed by Bonferroni’s test. (B) Delta Lee index, *significant effect of the high-fat and choline-deficient diet (p = 0.017). Data expressed as mean ± standard deviation, Student’s t-test. Each experimental group with 10 male Sprague Dawley rats. |
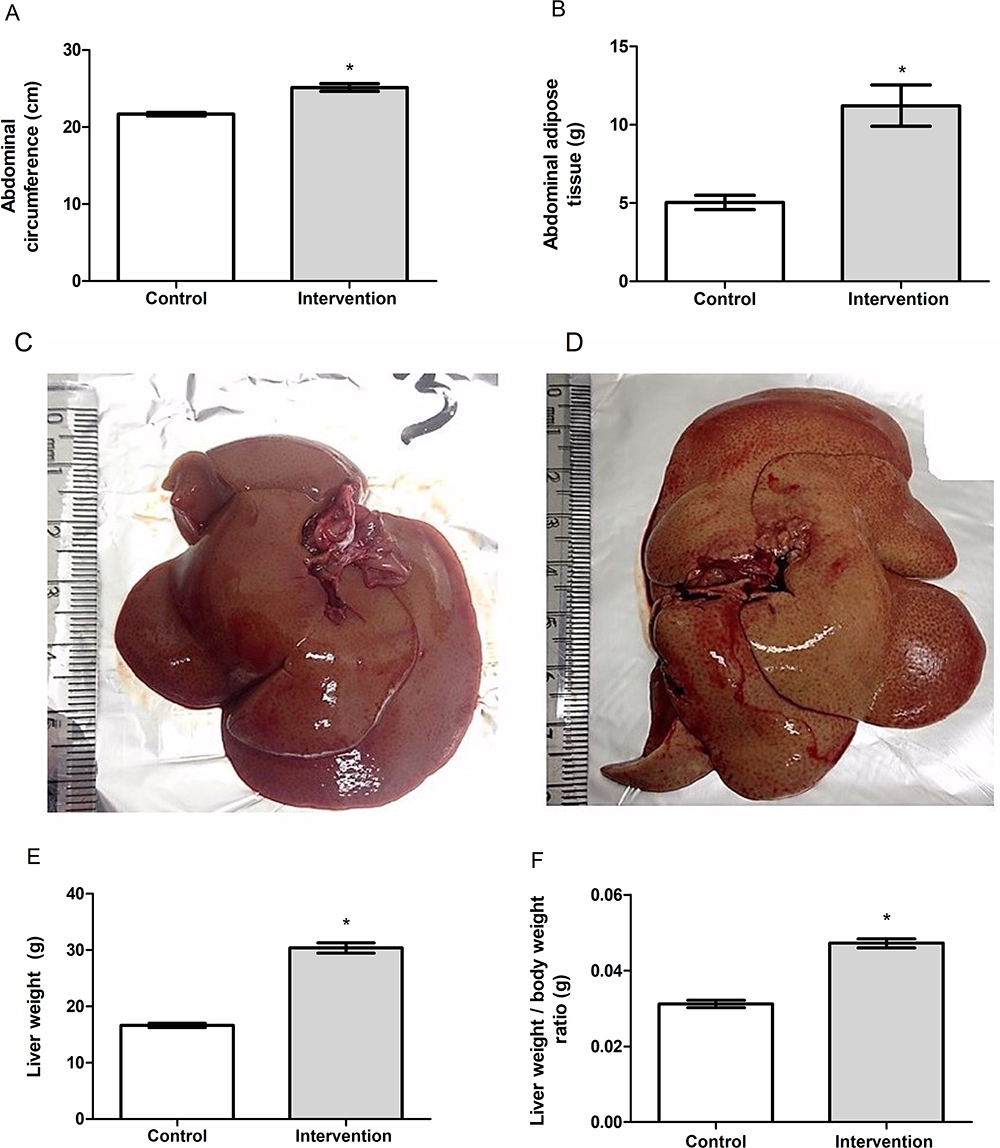 |
Figure 2 (A) Abdominal circumference, (B) abdominal adipose tissue, (C) macroscopic appearance of liver in the control group, (D) macroscopic appearance of liver in the intervention group, (E) liver weight and (F) liver weight/body weight ratio of the animal. *Significant effect of the high-fat and choline-deficient diet (p < 0.001). Data expressed as mean ± standard deviation, Student’s t-test. Each experimental group with 10 male Sprague Dawley rats. |
Biochemical Parameters
In the evaluation of liver function parameters, the intervention group showed significantly higher serum levels of ALT, glucose, total cholesterol, LDL cholesterol and triglycerides compared to the control group, the reverse was observed in relation to the serum levels of HDL cholesterol (Table 1). No significant difference was observed between the groups for serum levels of AST and albumin.
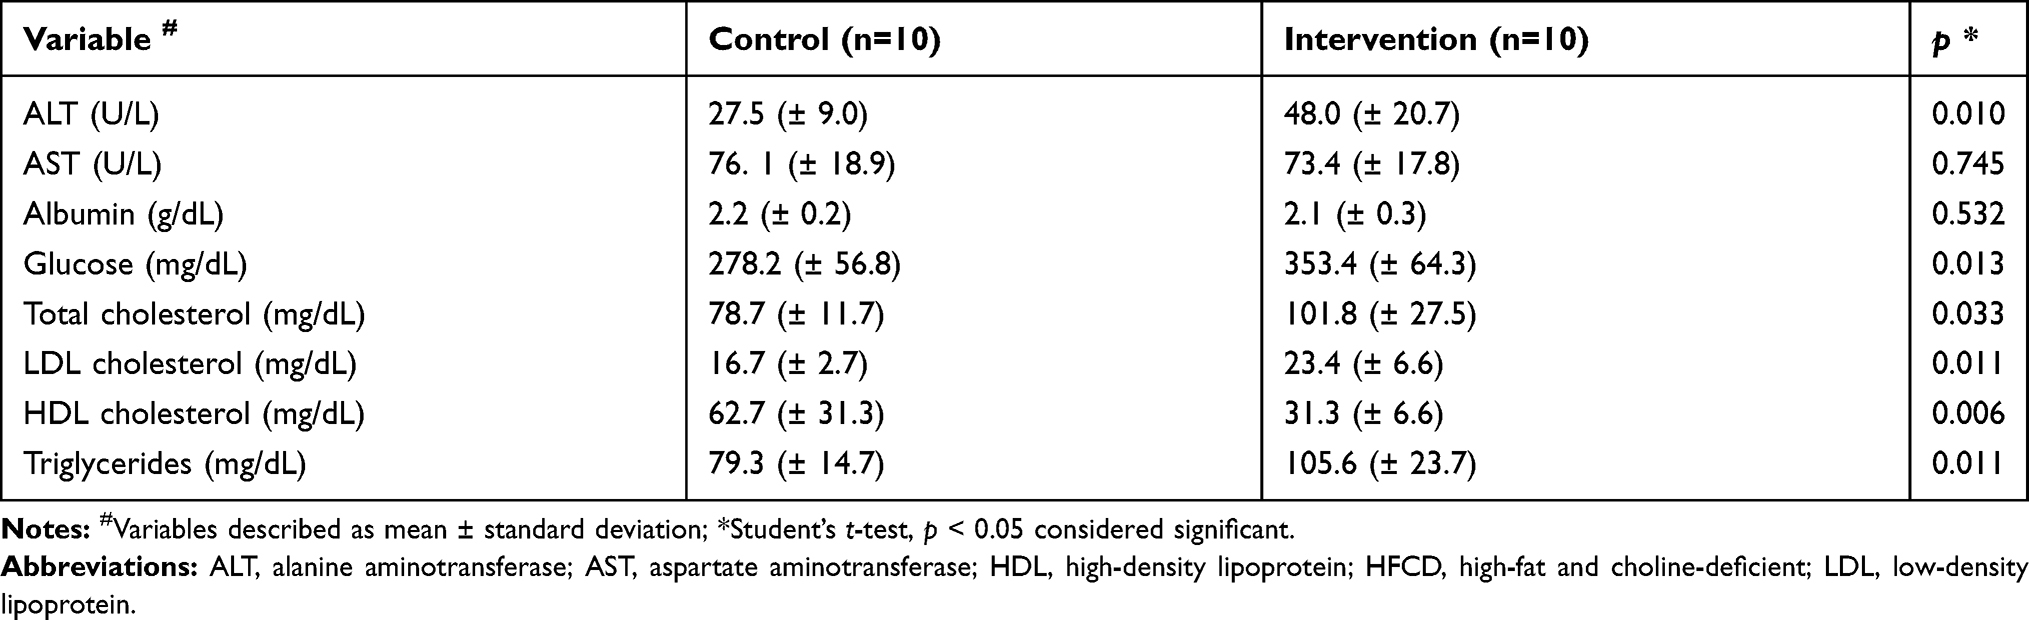 |
Table 1 Biochemical Parameters of Animals Fed with HFCD Diet versus Standard Diet |
Analysis of Fat Deposition in Liver Tissue
In the quantitative analysis of fat deposition, the animals in the intervention group (563.8 ± 178.3 fluorescence/μg protein) showed a significantly greater (p < 0.001) accumulation of fat in liver tissue (approximately 18 times), compared to the control group (83.7 ± 24.5 fluorescence/μg protein) (Figure 3).
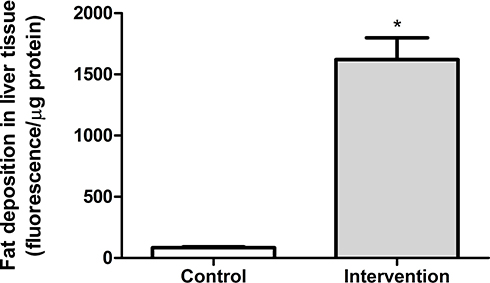 |
Figure 3 Quantitative analysis of fat deposition in liver tissue *Significant effect of the high-fat and choline-deficient diet (p < 0.001). Data expressed as mean ± standard deviation, Student’s t-test. Each experimental group with 10 male Sprague Dawley rats. |
Liver Inflammatory Parameters
The data obtained are shown in Table 2. Hepatic concentrations of the pro-inflammatory cytokines IL-1β (p = 0.001) and TNF-α (p = 0.008) were significantly higher in the intervention group compared to the control group. No significant difference was observed between the groups for IL-6 concentration (p = 0.736). The intervention group showed a significantly lower concentration of the anti-inflammatory cytokine IL-10 in relation to the control group (p < 0.001). The proportion of pro-inflammatory cytokines in relation to the anti-inflammatory cytokine in liver was significantly higher in the intervention group than in the control group for the three variables analyzed.
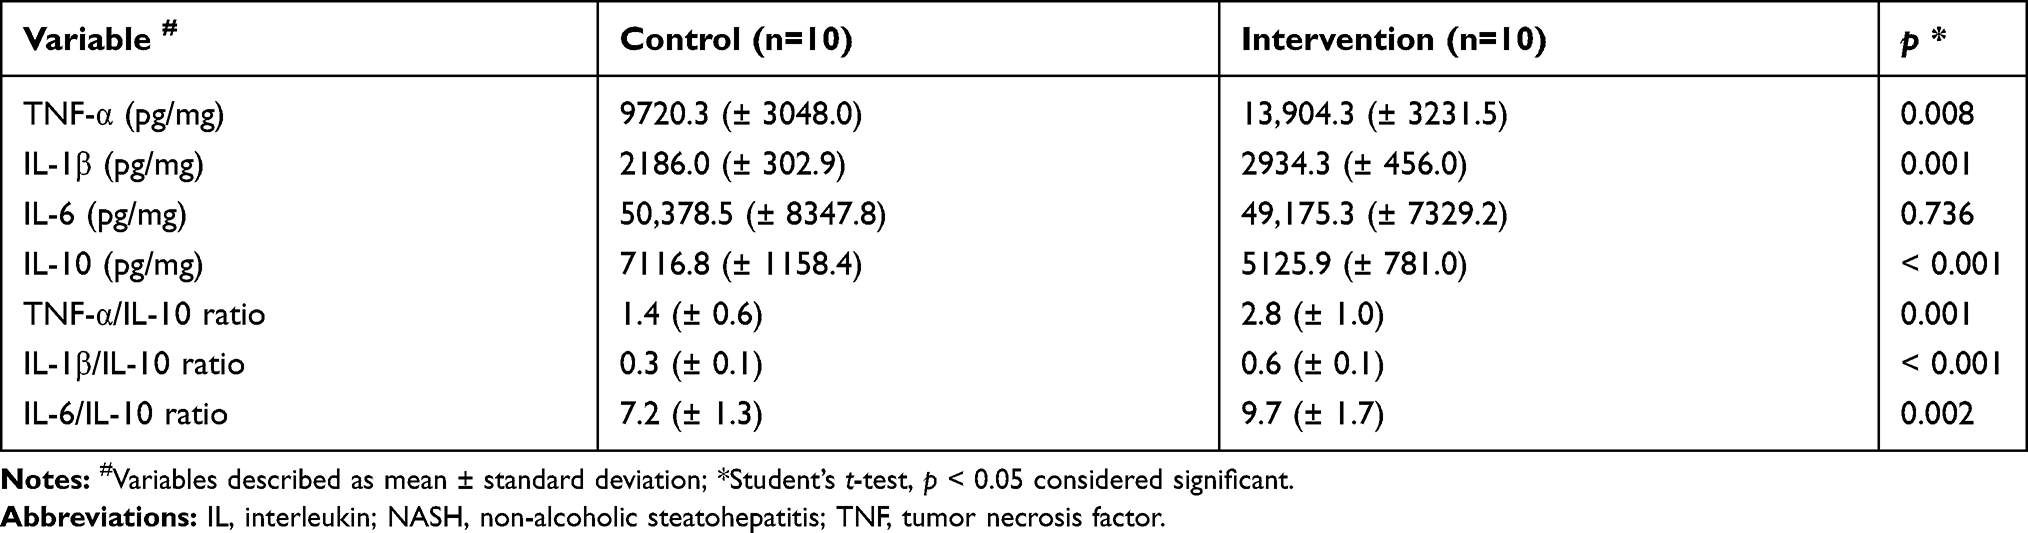 |
Table 2 Changes in Liver Concentration of Pro- and Anti-Inflammatory Cytokines Related to Pathophysiology of NASH |
Expression of Genes Involved in NASH Pathogenesis
The results obtained for the gene expression of gut permeability markers, mediators and hepatic inflammatory receptors related to the pathogenesis of NASH are reported in Table 3. Regarding the intestinal permeability markers, we observed a significant decrease in the intervention group in the expression of the Ocln (p = 0.003) and F11r (JAM-1 - p = 0.041) genes compared to the control group. We found no significant difference between groups in the expression of Cldn1 (p = 0.495) and Cldn4 (p = 0.657). There was a significant increase in gene expression in the liver tissue of Tlr4 (p = 0.041), Tlr9 (p = 0.033), Myd88 (p < 0.001), Nlrp3 (p = 0.019), Casp1 (p < 0.001), Tnfa (p = 0.028), Il6 (p = 0.013) and Il18 (p = 0.007) in the intervention group compared to the control group. The intervention group showed a significant decrease in Ppara (p = 0.008) gene expression compared to the control group. We did not find any significant difference between the groups in the expression of Tlr2 (p = 0.364), Il1b (p = 0.082) and Il10 (p = 0.940).
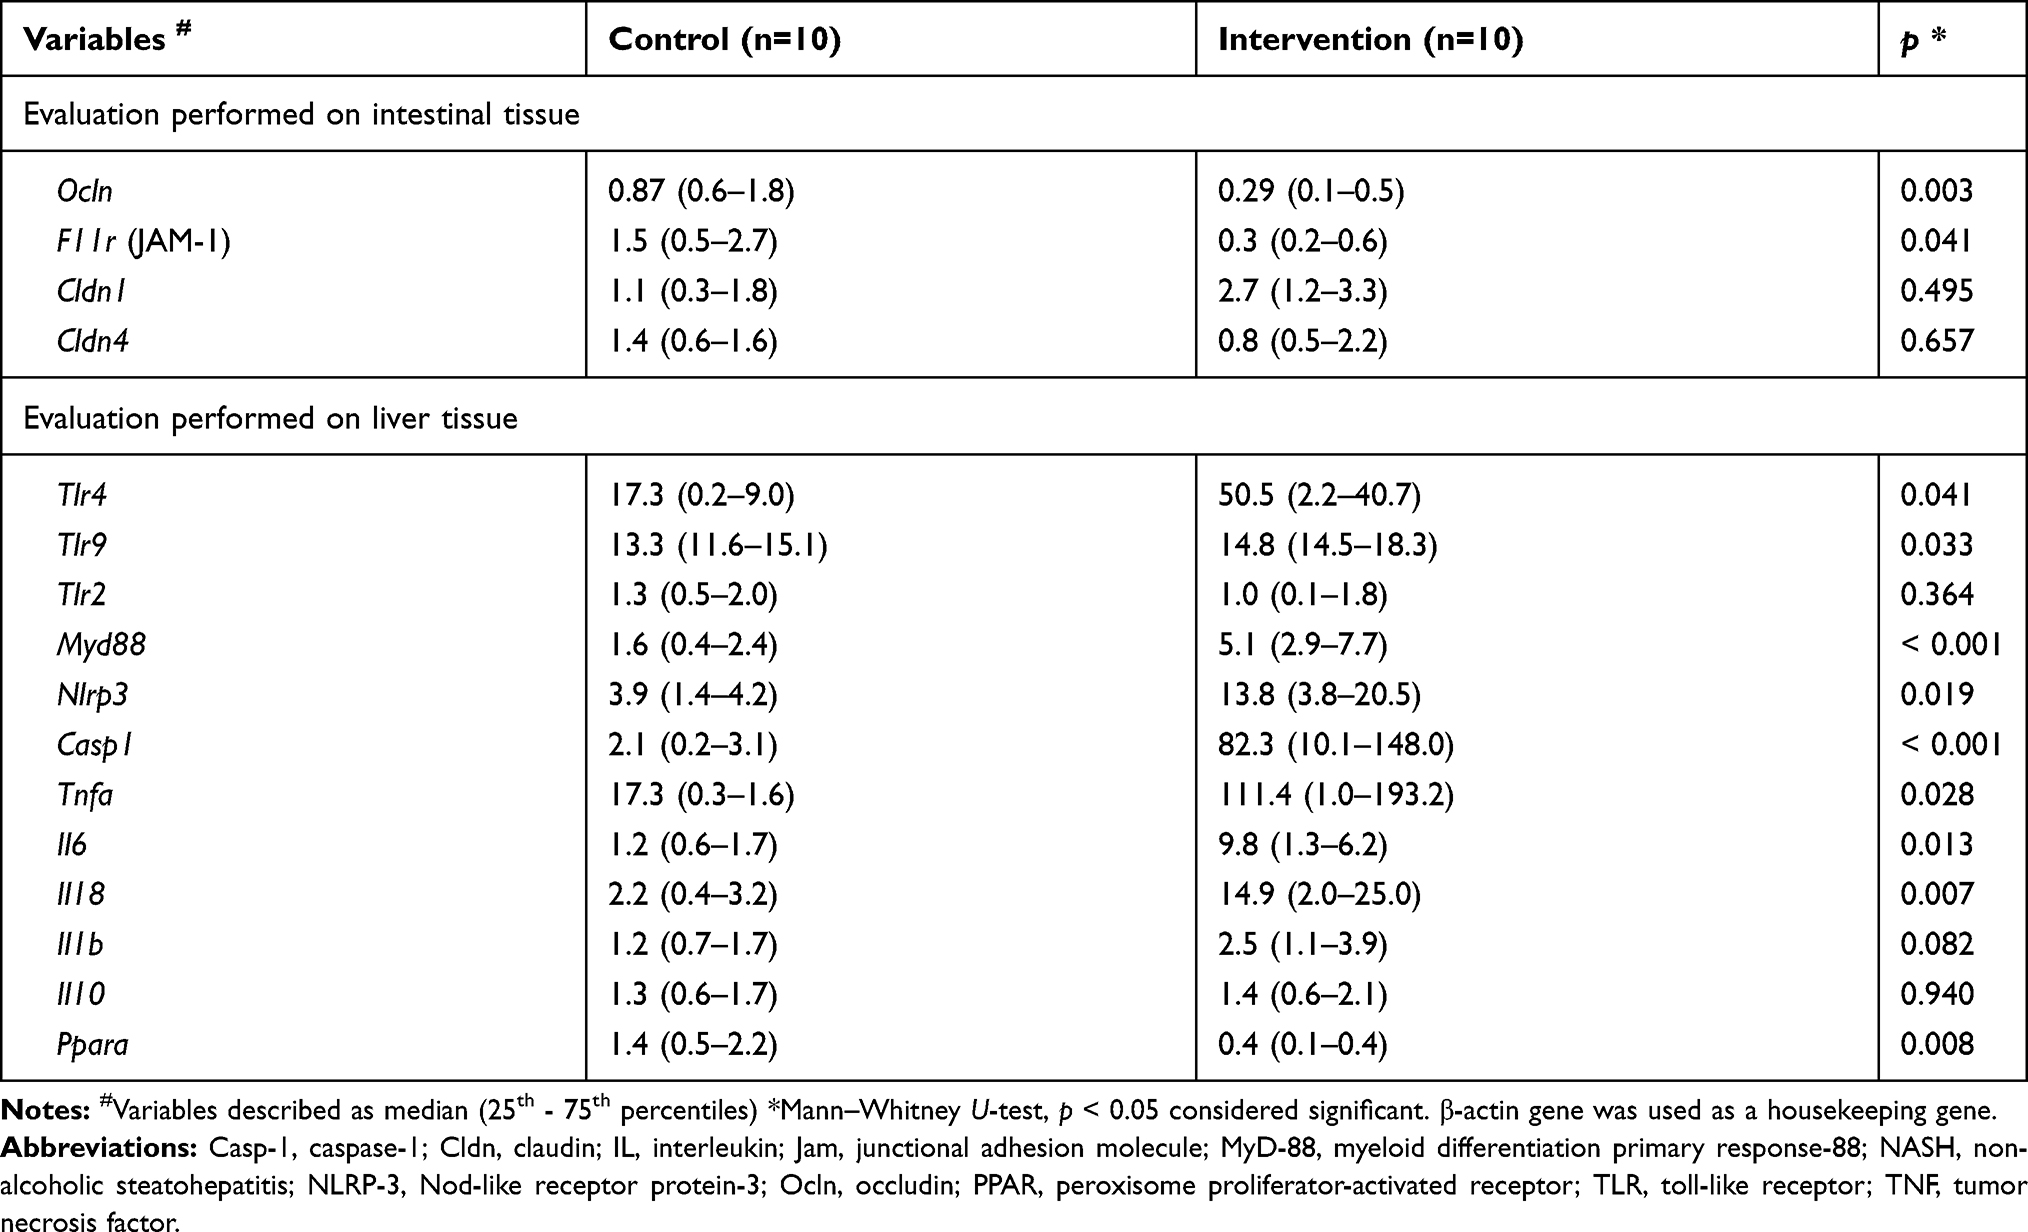 |
Table 3 Gene Expression of Gut Permeability Markers and Hepatic Inflammation Involved in NASH Pathogenesis |
Gene Expression of the Circulating microRNAs
The results obtained from the gene expression of the circulating microRNAs are demonstrated in Figure 4A-C. There was a significant increase in the gene expression of miR-122 (p = 0.041) in the intervention group compared to the control group, the reverse was observed in relation to the expression of miR-145 (p = 0.010). There was no difference between groups in the expression of miR-143 (p = 0.199).
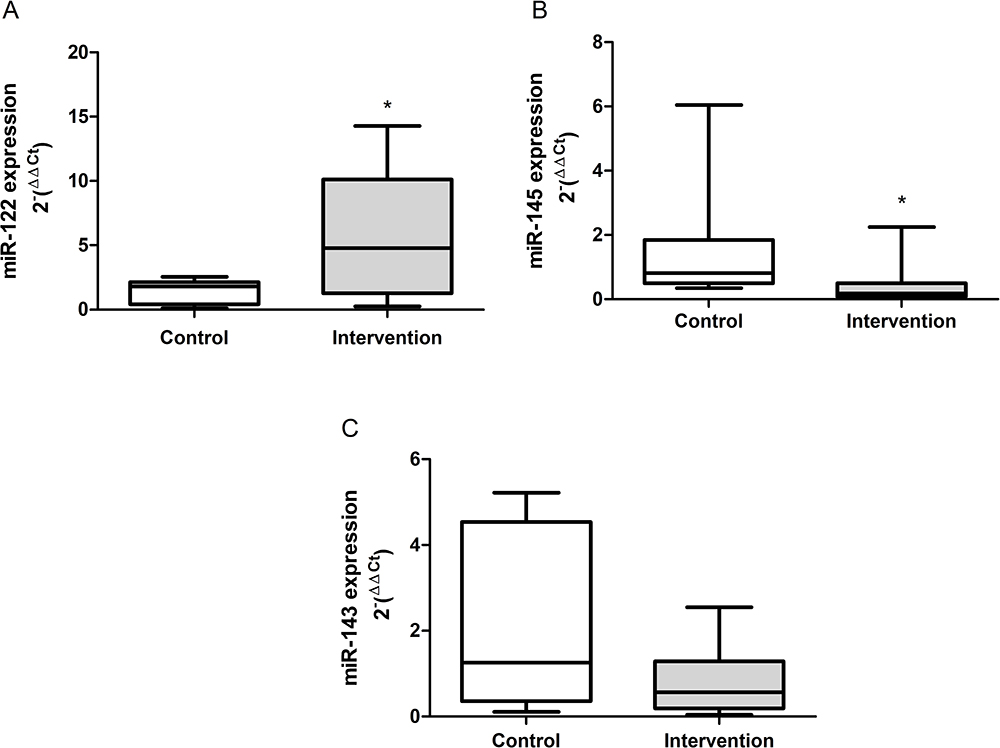 |
Figure 4 Gene expression of the circulating microRNAs. (A) mir-122 (p = 0.041), (B) miR-145 (p = 0.010) and (C) miR-143 (p = 0.199). *Significant effect of the high-fat and choline-deficient diet. Data expressed as median (25th-75th percentile), Mann–Whitney U-test. Each experimental group with 10 male Sprague Dawley rats. |
Gut Microbiota Analysis
Sample structuring taking into account the observed gut microbiota was distinct from control group according to hierarchical clustering dendrogram based on the Bray–Curtis dissimilarity index (Figure 5A). In addition, the number of OTUs was significantly lower (p < 0.001) in intervention group (Figure 5B). In terms of composition, 1266 bacterial taxa (OTUs) were identified in this study, which belong to eight phyla. Firmicutes (53.1%) and Bacteroidetes (43.1%) were the most abundant phyla in all samples (Figure 5C); their distributions are presented in Figure 5D, which indicates that prevalent phyla in control group were less prevalent (or absent) in intervention group, while the reverse was also observed. The differential abundance analysis identified Bacteroidetes and Proteobacteria associated with intervention group while Tenericutes and Cyanobacteria were differentially abundant in the control group (LDA score > 1, p < 0.001; Figure 5E).
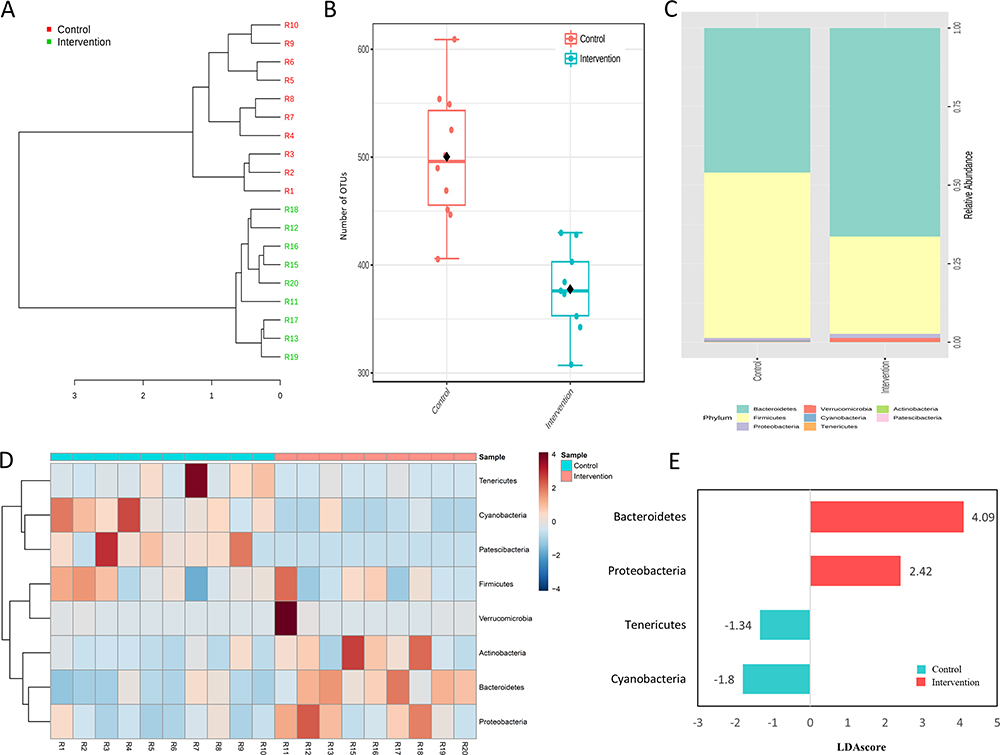 |
Figure 5 Gut microbiota features in control and intervention. (A) Hierarchical clustering dendrogram based on the Bray-Curtis dissimilarity index, (B) Number of OTUs, (C) Relative abundance, (D) distribution of the eight observed phyla and (E) Histogram of the LDA scores (log10) computed for the four differentially abundant phyla. Each experimental group with 10 male Sprague Dawley rats. |
Histopathological Analysis
No abnormalities were seen in the liver tissue of the control group animals (Figure 6A and B), whereas the animals in the intervention group had predominantly microvesicular steatosis along with macrovesicular steatosis of moderate intensity, with inflammatory activity and a mild degree of fibrosis (Figure 6C and D). The quantification of collagen, using picrosirius staining, showed a significantly greater amount of connective tissue fibers in the intervention group in relation to the control group (p < 0.001) (Figure 6E). According to the general NAFLD scoring system established for experimental rodent models, seven animals of the intervention group developed NASH and three animals showed non-alcoholic fatty liver (NAFL). No hepatic histopathological changes were observed for the control group (Table 4).
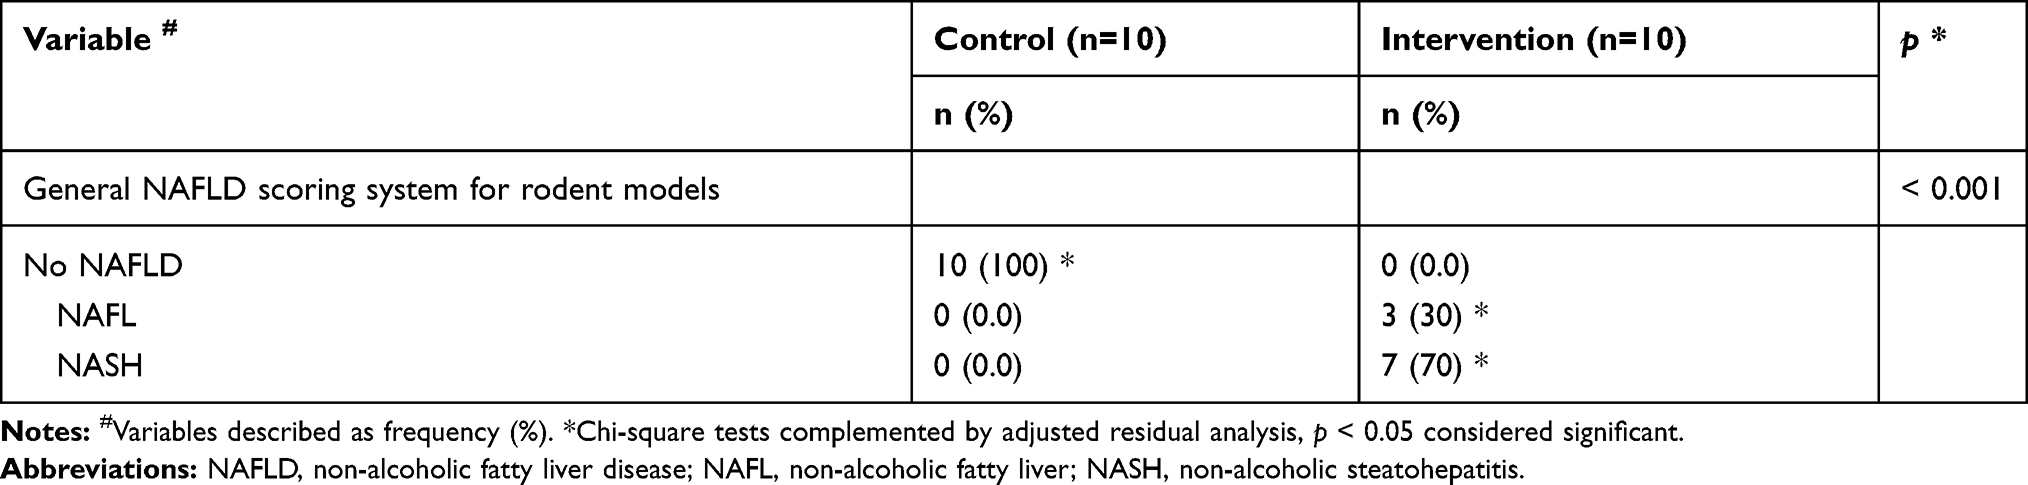 |
Table 4 Distribution of Liver Histopathological Findings |
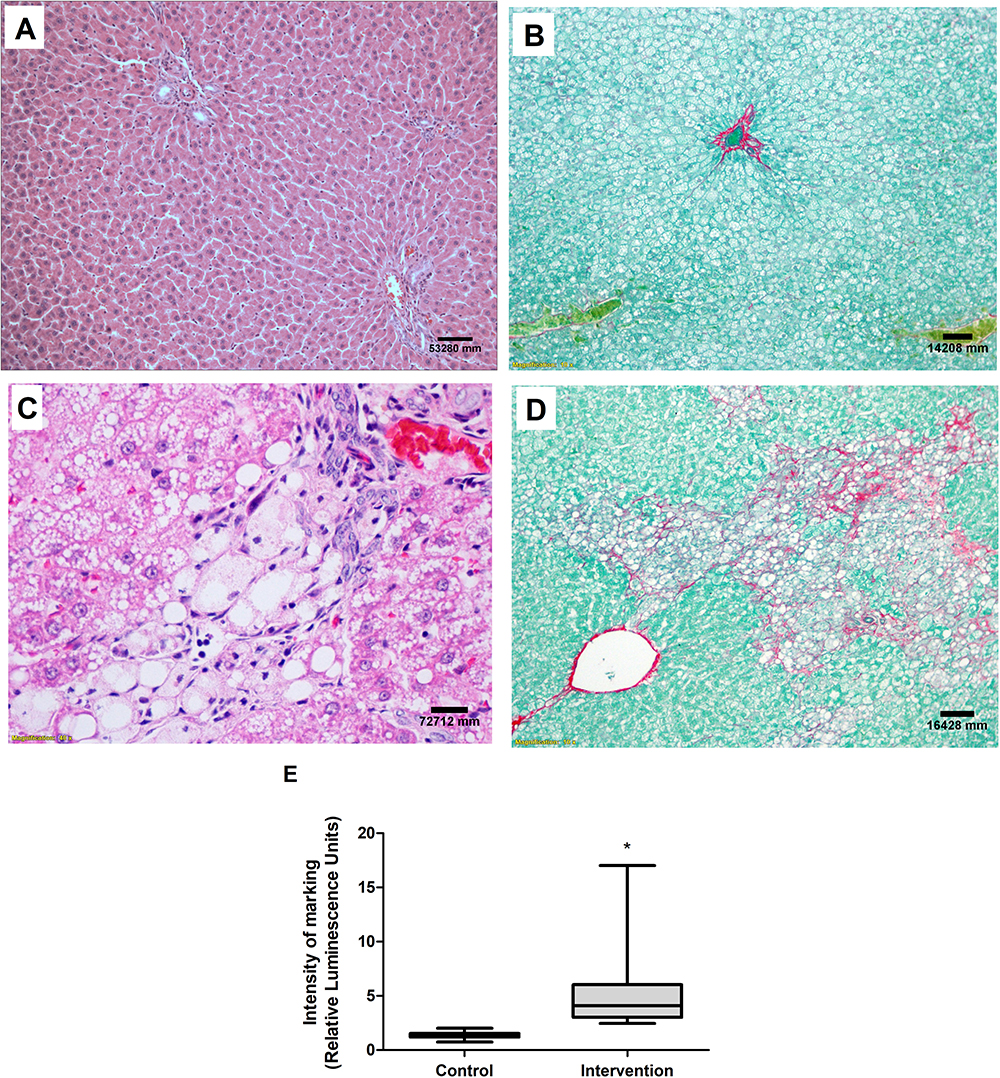 |
Figure 6 Liver histological evaluation. Images referring to the control (A) and intervention (C) groups, H&E staining and both at 40X magnification. Picrosirius staining in the control (B) and intervention (D) groups, both at 10X magnification. (E) Quantification of collagen fibers. *Significant effect of the high-fat and choline-deficient (p < 0.001). Data expressed as median (25th-75th percentile), Mann–Whitney U-test. Each experimental group with 10 male Sprague Dawley rats. |
In the histopathological evaluation of the small intestine, the animals in the control group showed no lesions or epithelial layer lifting from the lamina propria (Figure 7A). In the intervention group, moderate lesions were observed from the epithelial cell layer lifting from the lamina propria (Figure 7B) and severe lesions with loss of some villi, with massive epithelial lifting from the lamina propria and a few denuded villi (Figure 7C).
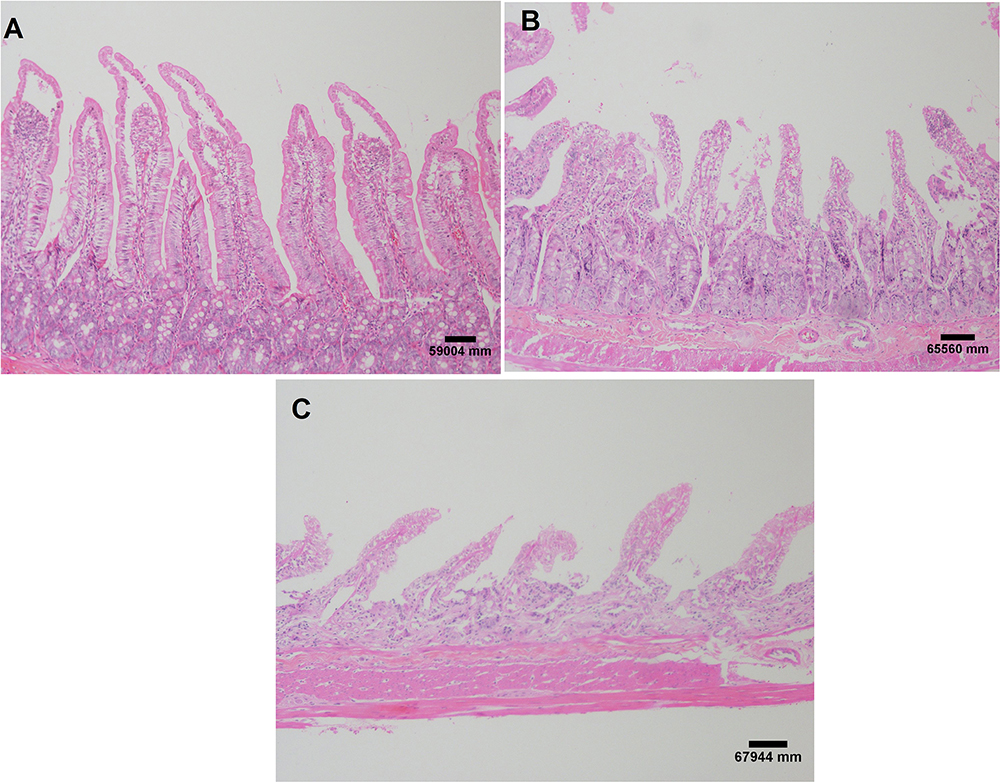 |
Figure 7 Small intestine histological evaluation. Images referring to the control group without injury (A); moderate injuries (B) and severe lesions (C) in the intervention group. H&E staining and both at 40X magnification. Each experimental group with 10 male Sprague Dawley rats. |
Correlations Between NASH and Gut Microbiota
The values obtained from the correlations between markers of liver disease severity, liver inflammation, intestinal permeability and microbiota composition are described in Table 5. The histopathological score of NAFLD showed a strong significant correlation with the hepatic inflammatory index’s TNF-α/IL-10 and IL-1β/IL-10. In addition, the histopathological lesion severity of the disease showed a significant negative correlation with the gene expression of the Ocln and F11r (JAM-1) markers, both related to intestinal permeability. The TNF-α/IL-10 and IL-1β/IL-10 indices showed a moderate negative correlation with the expression of the Ocln gene. The composition of the gut microbiota showed a strong significant correlation with the histopathological score of NAFLD, in addition to having a significant moderate correlation with the hepatic inflammatory index, IL-1β/IL-10.
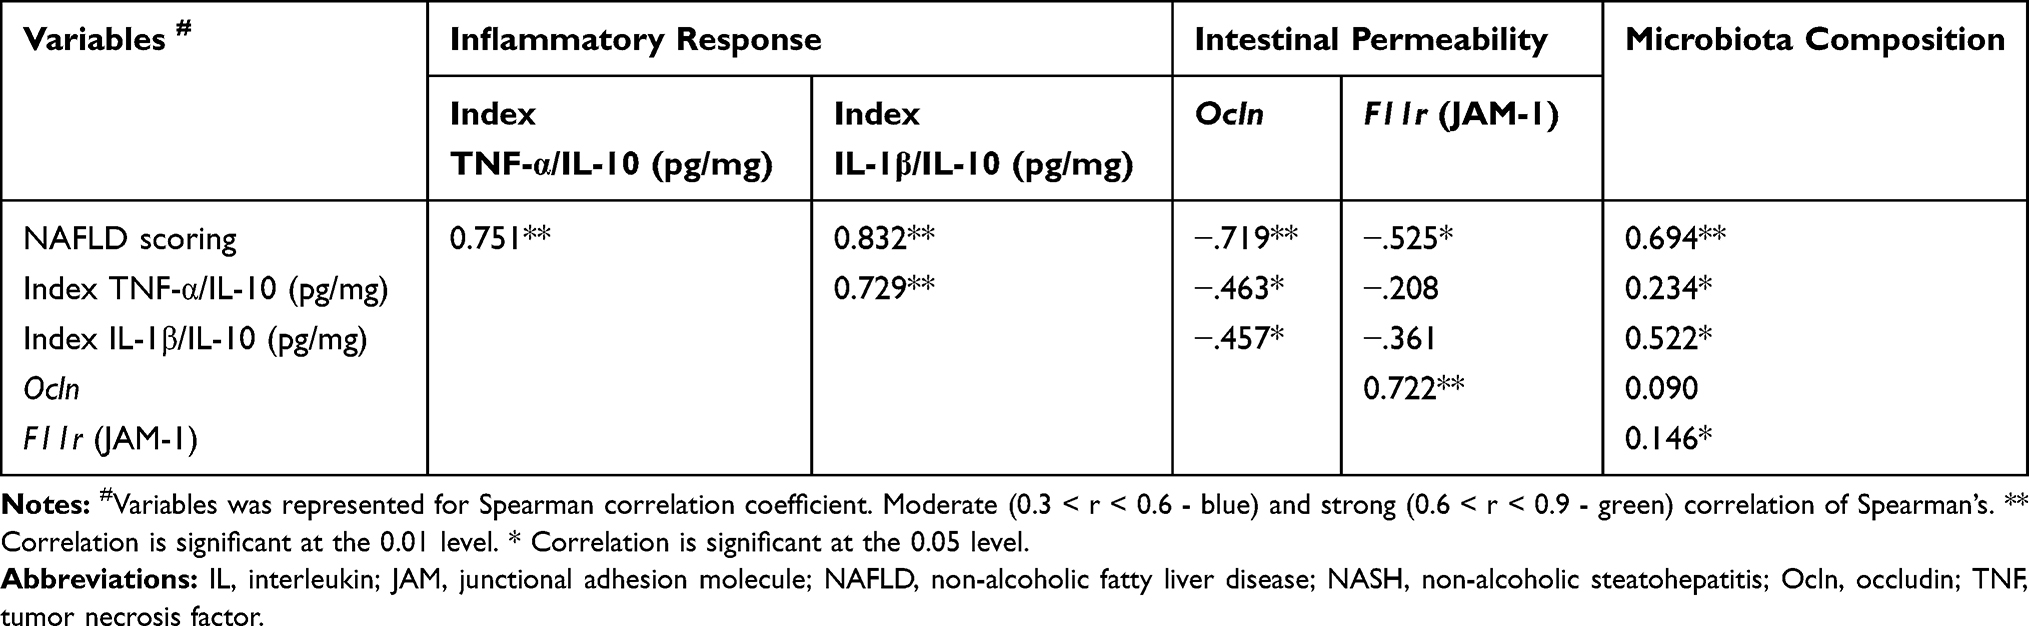 |
Table 5 Correlations Between NASH Markers and Microbiota Composition |
Discussion
We demonstrated in this experimental model that the free access of animals to a HFCD diet for 16 weeks was able to cause marked deposition of body and liver fat, activation of microRNAs, receptors, mediators and inflammatory cytokines, in addition to observing changes in the composition of the gut microbiota with consequent increase in gene expression of intestinal permeability markers. This model has promoted histopathological changes similar to those observed in NASH in humans, with intense deposition of collagen fibers in liver tissue. In our study, we used Sprague Dawley rats, which present an intrinsic propensity for the development of obesity and NASH.30 Indeed, the ideal experimental model for the study of NAFLD in its different evolutionary stages that resemble the disease in humans should not require genetically modified animals, at the same time it should be able to induce obesity through a diet containing at least one macronutrient similar to that consumed by humans.15 Furthermore, this model should induce adiposity, insulin resistance (IR) and dyslipidemia, leading to visceral obesity and systemic inflammation; in addition, the model should activate cell signals relevant to disease progression and show histopathological accordance with the disease in humans and uniformity in lipidomic and transcriptomic profiles. As a matter of fact, the model described here meets all, but the last two requirements, which were not evaluated in this study.
Experimental models are essential to further explore the pathophysiological mechanism of the disease, in order to develop methods to improve targeting and therapeutic strategies. The execution of clinical research on the mechanisms of NAFLD/NASH development is limited, sometimes due to ethical considerations, particularly with regard to the collection of tissue samples and the administration of medications to patients. In this sense, in the literature, various experimental models have been described for the study of the different stages of NAFLD, but most of them have limitations in the replication of the disease phenotype observed in humans6,13-15,20,31. Genetic models use animals with a spontaneous mutation in order to generate an imbalance in lipid homeostasis, so that liver steatosis develops.14,16,20 Among the nutritional models widely described in the literature are those that use diets deficient in essential amino acids, such as methionine and choline.19,32-34 Depriving animals of these nutrients impairs hepatic secretion of VLDL, resulting in accumulation of hepatic fat, oxidative stress and cell death, causing steatosis in three weeks of experiment and fibrosis in five weeks.14,17,19,34 However, the animals do not exhibit any other metabolic characteristics that are observed in NASH, including obesity and dyslipidemia.17–19 These models can be used to establish lean NAFLD/NASH. In future studies, the comparison of experimental models of obese NASH and lean NASH may be useful in understanding the pathophysiology of these two conditions. Due to the association between NASH and metabolic syndrome, animals can be subjected to a Western-style diet, which causes obesity, IR and liver damage.16,20 In these models, animals are fed a high-fat diet (HFD) in which 45–75% of the caloric intake is derived from fat and/or variations containing trans-fat or cholesterol.16 In most HFD models, the degree of liver damage is not severe compared to the methionine- and choline-deficient model.20 In our study, we developed a hybrid experimental nutritional model based on the association of choline-deficient (CD) diet and HFD, causing an increase in fat liver deposition in the animals and the phenotypes observed were similar to NASH in humans. Supplying a CD diet to animals may be considered a limitation of this study. However, until recently it was not known that CD could occur under pathophysiological conditions. Intestinal dysbiosis due to HFD leads to decreasing levels of intestinal lumen choline, thereby reducing plasma phosphatidylcholine levels.35 This is an important constituent of the cell membrane and if it is not present, the triglycerides begin to accumulate in the hepatic tissue, causing NAFLD.35
Since visceral obesity, hyperglycemia, dyslipidemia, liver tests abnormalities, systemic and histopathological inflammation are required for NASH, it is doubtful whether the results of an experimental model that do not fully meet these conditions can be extrapolated to humans.15,36 In fact, we described significant change in relation to lipid profile, glucose, body weight, fresh liver weight, delta Lee index, abdominal circumference and the amount of abdominal adipose tissue in the intervention group. In this study, we did not carry out the assessment of IR, but the elements presented strongly suggest its presence. In addition to body weight, the weight of adipose tissue is often used as an index of obesity and IR is strongly correlated these factors, influencing directly in the hepatic lipid metabolism. Higher adiposity is a common finding in experimental nutritional models, similar to the data obtained in this study,13,14,37,38 although there are some disagreements in the literature probably due to different animal models and feeding protocols.39,40
In the histopathological evaluation of this study, after 16 weeks, livers from the HFCD fed animals showed moderate steatosis, inflammation and fibrosis. Actually, seven animals developed NASH and three animals showed NAFL, according to the general NAFLD scoring system for rodent models. In addition to a significant increase in collagen fiber deposition was observed. Although all animals in the intervention group were submitted to the same stimuli for the development of the disease, not all of them presented the diagnosis of NASH. Susceptibility to NALFD in determining the progressive phenotype is highly variable and in clinical practice, it remains unclear why only some individuals who are obese develop steatosis and why only a fraction of at-risk individuals develop NASH. Our histological data are in accordance with experimental studies of NAFLD developed through caloric excess, with simple steatosis usually being demonstrated in 8 weeks of experiment, NASH with progressive fibrosis between 16 and 24 weeks and hepatocellular carcinoma in 52 weeks.13,38 The study of HCC through dietary models can be performed by adding inducing carcinogenic substances, reducing the experiment time by 16 weeks and consequently decreasing the cost of maintaining the animals.31
A “two-hit” hypothesis has been proposed for NAFLD development in which hepatic steatosis, the “first hit,” increases susceptibility to NASH caused by a “second hit” such as oxidative stress and inflammatory cytokines.41 In this study, no oxidative stress assessment was carried out and this can be considered a limitation. Recently, the “multiple-parallel hit” theory has been proposed in which NASH develops through the activation of multiple intracellular/extracellular events in different liver cell types and by inter-organ crosstalk between the liver and other tissues including adipose tissue or the intestine.42 The accumulation of fat in the liver has been associated with changes in the composition of the gut microbiota, which promotes increased intestinal permeability, activation of microRNAs, a class of small endogenous non-coding RNAs (19 to 22 nucleotides in length) that regulate gene expression at the post-transcriptional level and also the synthesis of pro-inflammatory cytokines, culminating in the influx of inflammatory cells to the liver, activating stellate cells and leading to collagen deposition events that may explain the progression of hepatic steatosis for NASH.9,43,44 In this study, we demonstrate a clear distinction of bacterial communities between experimental groups, in addition, the intervention group showed a significant decrease in observed OTUs. Our data corroborate with experimental and clinical studies that demonstrate as a common denominator a lower bacterial diversity and dysbiosis in NASH.45,46 These, in turn, contribute to IR and increase free fatty acids, which can lead to metabolic syndrome characteristics.47 Among the eight phyla of bacteria detected in our study, Firmicutes and Bacteroidetes were the most abundant, in the distribution analysis we demonstrated that the most abundant phyla in the intervention group were less prevalent (or absent) in the animals of the control group. In the analysis of differential abundance, we identified that Bacteroidetes and Proteobacteria are more associated with the intervention group, while Tenericutes and Cyanobacteria with the control group. The composition of the total microbiota of the intervention group showed a significant correlation with the hepatic inflammatory index, IL-1β/IL-10 and histopathological score of NAFLD. According to the literature, although several species of bacteria have been described so far, two phyla, Firmicutes and Bacteroidetes, predominate, representing 90% of the total.9 However, these phyla not only play an important role in the progression of NAFLD but also other bacteria, such as Proteobacteria, Verrucomicrobia, Actinobacteria, Fusobacteria and Cyanobacteria.45,48 In agreement with our data, studies report that in gut dysbiosis there is a reduction in the relative abundance of autochthonous bacteria of the Firmicutes phylum49,50 and an increase in Bacteroidetes, but the reverse has also been reported.51,52 The autochthonous bacteria (Firmicutes) produce short-chain fatty acids (SCFAs) that nourish the colonic mucosal cells and reduce local colonic inflammation, and also produce anti-bacterial peptides and hence help maintain the intestinal barrier.49 In this study, the animals in the intervention group showed a reduction in the abundance of Firmicutes and, consequently, an increase in intestinal permeability, liver inflammation and development of NASH. In the literature, several mechanisms can explain the increase in the abundance of Bacteroidetes, in the intestine and its relationship with NASH. The abundance of Bacteroidetes has strong positive correlations with the fecal content of deoxycholic acid, D-pinitol, choline, raffinose and stachyose (the two last contain glucose and fructose) and these compounds influence the pathogenesis of the disease.53–55 However, it is currently difficult to identify which microbiota differences are causal and which are coincidental in the development of NASH and it is known that composition of gut microbiome is not homogeneous and displays a considerable heterogeneity between individuals and animals.
Diet and gut microbiota are major factors in regulating intestinal permeability, the alteration of which is central in the derangement of the gut-liver axis.56 The intestinal epithelial barrier is composed of several elements, the first line of defense being provided by the intestinal mucus layer and after the second physical barrier, it is composed of epithelial cells, sealed by tight junctions.57 There are three major types of cell junction that typically form near the apical end of the cells’ side walls: tight junctions, gap junctions, and adherens junctions.9 In this study, we report a significant decrease in the intervention group in gene expression of Ocln and F11r (JAM-1), which are junction transmembrane proteins. The integrity of gut epithelium can be disturbed by HFD, leading to the change on gut permeability and then to endotoxemia and systemic inflammation, data that corroborate with our results.12,58,59 Below the epithelium, the gut vascular barrier actively controls hematogenous bacterial dissemination via the portal circulation.57 In the context of NASH, it is unclear if increased intestinal permeability due to disrupted intestinal epithelial barrier alone is sufficient to induce bacteria and lipopolysaccharides (LPS) translocation and drive liver damage, or if gut vascular barrier disruption is also required.57 In this study, we did not evaluate the LPS, which can be considered a limitation. Studies are being carried out for the treatment of NASH using obeticholic acid, an agonist of the farnesoid X receptor that has been shown to control gut barrier dysfunction, bacterial translocation and hepatic metabolism processes.60
Corroborating the theory that changes in lifestyle, including the introduction of a healthy diet is able to reduce intestinal permeability and consequently the activation of inflammatory and fibrogenesis pathways that contribute to the progression of NAFLD. In our study, in addition to reporting changes in gut permeability, we observed a significant increase in expression of TLR-4 and TLR-9, activating Myd-88 and triggering an inflammatory response, by inducing the expression of inflammatory cytokines and chemokine. In parallel, activation of the NLRP-3 inflammasome complex occurred in animals of the intervention group. It is known that pattern recognition receptors, including TLRs and NLRPs, are essential initiators of inflammatory and immunological responses, in response to their prolonged activation they can contribute to chronic inflammation and the progression of fibrosis.8,12,61 High serum levels of TLR-4 and TLR-9 have also been proposed as a predictive non-invasive marker for liver fibrosis development in NASH patients.9,61 Corroborating with our data, Sui et al reported that hepatic steatosis induced by high-fat diet in mice directly stimulated the TLRs to activate the NLRP-3 complex, triggering an inflammatory response with worsening liver lesions.62 However, the contribution of NLRP-3 activation in the development of NAFLD remains uncertain. Inhibition of one of the components of this pathway has been shown to protect animals against IR and NASH and may be a therapeutic target.63,64 However, another study demonstrated that Nlrp3−/− mice showed increase in fat mass, adipose tissue inflammation, infiltration of macrophages, IR and greater severity of liver damage.12
Inflammation plays a central role in several acute and chronic liver diseases, contributing to the progression of liver damage to more severe stages, such as fibrosis, cirrhosis and HCC. In this study, we demonstrated a significant increase in gene expression and protein concentration of inflammatory liver cytokines, in addition to a significant decrease in the PPARα gene expression in the intervention group compared to the control group. As described in the literature, the expression of TNF-α and IL-6 represents a link between IR and liver inflammatory process, similar description to that found in this study.59 Raso et al reported that HFD in experimental model of rats promoted increased expression of TNF-α associated with reduced expression of PPAR-α, promoting the expression of several cytokines in hepatic stellate cells, with a concomitant increase in the release of the regulatory cytokines IL-10 and IL-1RA.59 PPAR-α is expressed ubiquitously but is most highly expressed in the liver. It plays a critical role in the regulation of fatty acid uptake, beta oxidation, ketogenesis, bile acid synthesis, triglyceride turnover and also modulates inflammatory genes.65 PPAR-α activation prevents triglyceride accumulation by increasing fatty acid turnover and catabolism, showing a protective effect on fatty liver and NASH inflammation in experimental model and human, being now a definite therapeutic target.59,65,66
Assessment of microRNAs is being used for early detection of chronic liver diseases or to monitor their progression.44 In this study, we observed a significant increase of miR-122 and decrease of miR-145 in the intervention group in relation to the control group. miR-122 is a liver-characteristic miRNA that composes about 70% of the total miRNAs found in normal hepatocytes, most probably due to the fact that it positively regulates the accumulation of cholesterol and triglycerides and the metabolism of fatty acids. Pirola et al demonstrated that, among 84 analyzed microRNAs, the expression of miR-122, miR-192, miR-125b and miR-375 was positively regulated in NASH patients, however, only miR-122 was associated with histological progression of the disease.44 Importantly, miR-145 is considered as a regulator in some fibrosis diseases. Corroborating with our data, Yang et al found that miR-145 was significantly down-regulated in liver fibrosis tissues by activation and proliferation of hepatic stellate cells.43 These findings are in accordance with the cascade of events that we observed in this study, demonstrating that different hits act in parallel promoting the progression from steatosis to NASH. The expression of miR-122 and miR-145 act on the hepatic stellate cells, promoting higher deposition of collagen fibers, which were observed at the histopathological evaluation. While steatosis is always present in NAFLD, only a small fraction develops the more severe forms, and it is currently not clear whether progression from steatosis to NASH with inflammation and fibrosis is a temporal continuum or the result of multiple parallel injuring impacts.67 Since it is not feasible to take repeated liver biopsies from the same patient to study mechanisms underlying disease progression, animal models that resemble the course of human NASH development could be helpful.67 Our experimental model, developed through the association of the CD and HFD diet, was able to cause a histopathological lesion with inflammation and fibrosis characteristic of NASH and could be used in preclinical studies of therapeutic targets.
In summary, as the prevalence of NAFLD has reached alarming proportions in many parts of the world and will increase in the next decades, and there are no approved drugs to halt NAFLD progression as well, preclinical models mimicking the human – namely obesity, IR/hyperglycemia and hyperlipidemia,2,6,13,15 are still necessary, especially if NASH and fibrosis can be achieved.6,13,15 Therefore, in conclusion, this simple and easily accomplished dietary model of NASH of metabolic origin here described and broadly documented regarding the mechanisms of disease progression, like gut dysbiosis, intestinal permeability, microRNAs, receptors, mediators and hepatic inflammatory cytokines, can be probably useful in developing further studies to elucidate not only the disease pathophysiology but also to identify some new therapeutic targets.
Abbreviations
ALT, alanine aminotransferase; AST, aspartate aminotransferase; Casp-1, caspase-1; CD, choline-deficient, Cldn, claudin, HCC, hepatocellular carcinoma; HDL, high-density lipoprotein; H&E, hematoxylin and eosin; HFCD, high-fat and choline-deficient; HFD, high-fat diet, IL, interleukin; IR, insulin resistance, JAM, junctional adhesion molecule; LDA, linear discriminant analysis; LDL, low-density lipoprotein; LPS, lipopolysaccharides; Myd-88, myeloid differentiation primary response-88; NAFL, non-alcoholic fatty liver; NAFLD, non-alcoholic fatty liver disease; NLRP, NOD-like receptor protein; NASH, non-alcoholic steatohepatitis; Ocln, occludin; OTUs, operational taxonomic units; PPAR, peroxisome proliferator-activated receptor; SCFAs, short-chain fatty acids; TLRs, toll-like receptors; TNF, tumor necrosis factor and VLDL, very low-density lipoproteins.
Acknowledgments
We would like to thank Research Incentive Fund – Hospital de Clínicas de Porto Alegre (FIPE – HCPA), CNPq (National Council for Technological and Scientific Development) and CAPES (Coordination for the Improvement of Higher Education Personnel) for financial support.
Disclosure
The authors report no conflicts of interest in this work.
References
1. Wong RJ, Aguilar M, Cheung R, et al. Nonalcoholic steatohepatitis is the second leading etiology of liver disease among adults awaiting liver transplantation in the United States. Gastroenterology. 2015;148(3):547–555. doi:10.1053/j.gastro.2014.11.039
2. Younossi ZM. Non-alcoholic fatty liver disease - a global public health perspective. J Hepatol. 2019;70(3):531–544. doi:10.1016/j.jhep.2018.10.033
3. Estes C, Razavi H, Loomba R, Younossi Z, Sanyal AJ. Modeling the epidemic of nonalcoholic fatty liver disease demonstrates an exponential increase in burden of disease. Hepatology. 2018;67(1):123–133. doi:10.1002/hep.29466
4. Estes C, Anstee QM, Arias-Loste MT, et al. Modeling NAFLD Disease Burden in China, France, Germany, Italy, Japan, Spain, United Kingdom, and United States for the period 2016-2030. J Hepatol. 2018;69(4):896–904. doi:10.1016/j.jhep.2018.05.036
5. Duarte SMB, Stefano JT, Miele L, et al. Gut microbiome composition in lean patients with NASH is associated with liver damage independent of caloric intake: a prospective pilot study. Nutr Metab Cardiovasc Dis. 2018;28(4):369–384. doi:10.1016/j.numecd.2017.10.014
6. Tsuchida T, Lee YA, Fujiwara N, et al. A simple diet- and chemical-induced murine NASH model with rapid progression of steatohepatitis, fibrosis and liver cancer. J Hepatol. 2018;69(2):385–395. doi:10.1016/j.jhep.2018.03.011
7. Safari Z, Gérard P. The links between the gut microbiome and non-alcoholic fatty liver disease (NAFLD). Cell Mol Life Sci. 2019;76(8):1541–1558. doi:10.1007/s00018-019-03011-w
8. Pierantonelli I, Svegliati-Baroni G. Nonalcoholic fatty liver disease: basic pathogenetic mechanisms in the progression from NAFLD to NASH. Transplantation. 2019;103(1):e1–e13. doi:10.1097/TP.0000000000002480
9. Chen D, Le TH, Shahidipour H, Read SA, Ahlenstiel G. The role of gut-derived microbial antigens on liver fibrosis initiation and progression. Cells. 2019;8:11. doi:10.3390/cells8111324
10. Hills RD, Pontefract BA, Mishcon HR, Black CA, Sutton SC, Theberge CR. Gut microbiome: profound implications for diet and disease. Nutrients. 2019;11:7. doi:10.3390/nu11071613
11. Houghton D, Stewart CJ, Day CP, Trenell M. Gut microbiota and lifestyle interventions in NAFLD. Int J Mol Sci. 2016;17(4):447. doi:10.3390/ijms17040447
12. Pierantonelli I, Rychlicki C, Agostinelli L, et al. Lack of NLRP3-inflammasome leads to gut-liver axis derangement, gut dysbiosis and a worsened phenotype in a mouse model of NAFLD. Sci Rep. 2017;7(1):12200. doi:10.1038/s41598-017-11744-6
13. Asgharpour A, Cazanave SC, Pacana T, et al. A diet-induced animal model of non-alcoholic fatty liver disease and hepatocellular cancer. J Hepatol. 2016;65(3):579–588. doi:10.1016/j.jhep.2016.05.005
14. Van Herck MA, Vonghia L, Francque SM. Animal models of nonalcoholic fatty liver disease-a starter’s guide. Nutrients. 2017;9:10. doi:10.3390/nu9101072
15. Oseini AM, Cole BK, Issa D, Feaver RE, Sanyal AJ. Translating scientific discovery: the need for preclinical models of nonalcoholic steatohepatitis. Hepatol Int. 2018;12(1):6–16. doi:10.1007/s12072-017-9838-6
16. Lau JK, Zhang X, Yu J. Animal models of non-alcoholic fatty liver disease: current perspectives and recent advances. J Pathol. 2017;241(1):36–44. doi:10.1002/path.4829
17. Veteläinen R, van Vliet A, van Gulik TM. Essential pathogenic and metabolic differences in steatosis induced by choline or methione-choline deficient diets in a rat model. J Gastroenterol Hepatol. 2007;22(9):1526–1533. doi:10.1111/j.1440-1746.2006.04701.x
18. Machado MV, Michelotti GA, Xie G, et al. Mouse models of diet-induced nonalcoholic steatohepatitis reproduce the heterogeneity of the human disease. PLoS One. 2015;10(5):e0127991. doi:10.1371/journal.pone.0127991
19. Kishida N, Matsuda S, Itano O, et al. Development of a novel mouse model of hepatocellular carcinoma with nonalcoholic steatohepatitis using a high-fat, choline-deficient diet and intraperitoneal injection of diethylnitrosamine. BMC Gastroenterol. 2016;16(1):61. doi:10.1186/s12876-016-0477-5
20. Sanches SC, Ramalho LN, Augusto MJ, da Silva DM, Ramalho FS. Nonalcoholic steatohepatitis: a search for factual animal models. Biomed Res Int. 2015;2015:574832. doi:10.1155/2015/574832
21. de Moura RF, Ribeiro C, de Oliveira JA, Stevanato E, de Mello MA. Metabolic syndrome signs in Wistar rats submitted to different high-fructose ingestion protocols. Br J Nutr. 2009;101(8):1178–1184. doi:10.1017/S0007114508066774
22. Gómez-Lechón MJ, Donato MT, Martínez-Romero A, Jiménez N, Castell JV, O’Connor JE. A human hepatocellular in vitro model to investigate steatosis. Chem Biol Interact. 2007;165(2):106–116. doi:10.1016/j.cbi.2006.11.004
23. Bradford MM. A rapid and sensitive method for the quantitation of microgram quantities of protein utilizing the principle of protein-dye binding. Anal Biochem. 1976;72:248–254. doi:10.1016/0003-2697(76)90527-3
24. Schloss PD, Westcott SL, Ryabin T, et al. Introducing mothur: open-source, platform-independent, community-supported software for describing and comparing microbial communities. Appl Environ Microbiol. 2009;75(23):7537–7541. doi:10.1128/AEM.01541-09
25. Rognes T, Flouri T, Nichols B, Quince C, Mahé F. VSEARCH: a versatile open source tool for metagenomics. PeerJ. 2016;4:e2584. doi:10.7717/peerj.2584
26. Quast C, Pruesse E, Yilmaz P, et al. The SILVA ribosomal RNA gene database project: improved data processing and web-based tools. Nucleic Acids Res. 2013;41(Databaseissue):D590–596. doi:10.1093/nar/gks1219
27. Caporaso JG, Kuczynski J, Stombaugh J, et al. QIIME allows analysis of high-throughput community sequencing data. Nat Methods. 2010;7(5):335–336. doi:10.1038/nmeth.f.303
28. Segata N, Izard J, Waldron L, et al. Metagenomic biomarker discovery and explanation. Genome Biol. 2011;12(6):R60. doi:10.1186/gb-2011-12-6-r60
29. Liang W, Menke AL, Driessen A, et al. Establishment of a general NAFLD scoring system for rodent models and comparison to human liver pathology. PLoS One. 2014;9(12):e115922. doi:10.1371/journal.pone.0115922
30. Recena Aydos L, Aparecida do Amaral L, Serafim de Souza R, et al. Nonalcoholic fatty liver disease induced by high-fat diet in C57bl/6 models. Nutrients. 2019;11:12. doi:10.3390/nu11123067
31. de Lima VM, Oliveira CP, Alves VA, et al. A rodent model of NASH with cirrhosis, oval cell proliferation and hepatocellular carcinoma. J Hepatol. 2008;49(6):1055–1061. doi:10.1016/j.jhep.2008.07.024
32. Ikawa-Yoshida A, Matsuo S, Kato A, et al. Hepatocellular carcinoma in a mouse model fed a choline-deficient, L-amino acid-defined, high-fat diet. Int J Exp Pathol. 2017;98(4):221–233. doi:10.1111/iep.12240
33. Matsumoto M, Hada N, Sakamaki Y, et al. An improved mouse model that rapidly develops fibrosis in non-alcoholic steatohepatitis. Int J Exp Pathol. 2013;94(2):93–103. doi:10.1111/iep.12008
34. Sun WW, ShangGuan T, Zhu P, et al. Role of hepatic neuropeptide Y-Y1 receptors in a methionine-choline-deficient model of non-alcoholic steatohepatitis. Life Sci. 2020;245:117356. doi:10.1016/j.lfs.2020.117356
35. Schnabl B, Brenner DA. Interactions between the intestinal microbiome and liver diseases. Gastroenterology. 2014;146(6):1513–1524. doi:10.1053/j.gastro.2014.01.020
36. Takahashi Y, Soejima Y, Fukusato T. Animal models of nonalcoholic fatty liver disease/nonalcoholic steatohepatitis. World J Gastroenterol. 2012;18(19):2300–2308. doi:10.3748/wjg.v18.i19.2300
37. Honda T, Ishigami M, Luo F, et al. Branched-chain amino acids alleviate hepatic steatosis and liver injury in choline-deficient high-fat diet induced NASH mice. Metabolism. 2017;69:177–187. doi:10.1016/j.metabol.2016.12.013
38. Cortez-Pinto H, Borralho P, Machado J, et al. Microbiota modulation with synbiotic decreases liver fibrosis in a high fat choline deficient diet mice model of Non-Alcoholic Steatohepatitis (NASH). GE Port J Gastroenterol. 2016;23(3):132–141. doi:10.1016/j.jpge.2016.01.004
39. Raubenheimer PJ, Nyirenda MJ, Walker BR. A choline-deficient diet exacerbates fatty liver but attenuates insulin resistance and glucose intolerance in mice fed a high-fat diet. Diabetes. 2006;55(7):2015–2020. doi:10.2337/db06-0097
40. Wu G, Zhang L, Li T, Lopaschuk G, Vance DE, Jacobs RL. Choline deficiency attenuates body weight gain and improves glucose tolerance in ob/ob mice. J Obes. 2012;2012:319172. doi:10.1155/2012/319172
41. Day CP, James OF. Steatohepatitis: a tale of two “hits”? Gastroenterology. 1998;114(4):842–845. doi:10.1016/S0016-5085(98)70599-2
42. Buzzetti E, Pinzani M, Tsochatzis EA. The multiple-hit pathogenesis of non-alcoholic fatty liver disease (NAFLD). Metabolism. 2016;65(8):1038–1048. doi:10.1016/j.metabol.2015.12.012
43. Yang J, Liu Q, Cao S, et al. MicroRNA-145 increases the apoptosis of activated hepatic stellate cells induced by TRAIL through NF-κB signaling pathway. Front Pharmacol. 2017;8:980. doi:10.3389/fphar.2017.00980
44. Pirola CJ, Fernández Gianotti T, Castaño GO, et al. Circulating microRNA signature in non-alcoholic fatty liver disease: from serum non-coding RNAs to liver histology and disease pathogenesis. Gut. 2015;64(5):800–812. doi:10.1136/gutjnl-2014-306996
45. Gómez-Zorita S, Aguirre L, Milton-Laskibar I, et al. Relationship between changes in microbiota and liver steatosis induced by high-fat feeding-a review of rodent models. Nutrients. 2019;11:9. doi:10.3390/nu11092156
46. Demir M, Lang S, Martin A, et al. Phenotyping non-alcoholic fatty liver disease by the gut microbiota: ready for prime time? J Gastroenterol Hepatol. 2020. doi:10.1111/jgh.15071
47. Leung C, Rivera L, Furness JB, Angus PW. The role of the gut microbiota in NAFLD. Nat Rev Gastroenterol Hepatol. 2016;13(7):412–425.
48. Boursier J, Mueller O, Barret M, et al. The severity of nonalcoholic fatty liver disease is associated with gut dysbiosis and shift in the metabolic function of the gut microbiota. Hepatology. 2016;63(3):764–775. doi:10.1002/hep.28356
49. Acharya C, Bajaj JS, Microbiota G. Complications of Liver Disease. Gastroenterol Clin North Am. 2017;46(1):155–169. doi:10.1016/j.gtc.2016.09.013
50. Zhu L, Baker SS, Gill C, et al. Characterization of gut microbiomes in nonalcoholic steatohepatitis (NASH) patients: a connection between endogenous alcohol and NASH. Hepatology. 2013;57(2):601–609. doi:10.1002/hep.26093
51. Ishioka M, Miura K, Minami S, Shimura Y, Ohnishi H. Altered gut microbiota composition and immune response in experimental steatohepatitis mouse models. Dig Dis Sci. 2017;62(2):396–406. doi:10.1007/s10620-016-4393-x
52. Liu JP, Zou WL, Chen SJ, et al. Effects of different diets on intestinal microbiota and nonalcoholic fatty liver disease development. World J Gastroenterol. 2016;22(32):7353–7364. doi:10.3748/wjg.v22.i32.7353
53. Ferreira DM, Afonso MB, Rodrigues PM, et al. c-Jun N-terminal kinase 1/c-Jun activation of the p53/microRNA 34a/sirtuin 1 pathway contributes to apoptosis induced by deoxycholic acid in rat liver. Mol Cell Biol. 2014;34(6):1100–1120. doi:10.1128/MCB.00420-13
54. Aranha MM, Cortez-Pinto H, Costa A, et al. Bile acid levels are increased in the liver of patients with steatohepatitis. Eur J Gastroenterol Hepatol. 2008;20(6):519–525. doi:10.1097/MEG.0b013e3282f4710a
55. Jensen T, Abdelmalek MF, Sullivan S, et al. Fructose and sugar: A major mediator of non-alcoholic fatty liver disease. J Hepatol. 2018;68(5):1063–1075. doi:10.1016/j.jhep.2018.01.019
56. Bischoff SC, Barbara G, Buurman W, et al. Intestinal permeability–a new target for disease prevention and therapy. BMC Gastroenterol. 2014;14:189.
57. Mouries J, Brescia P, Silvestri A, et al. Microbiota-driven gut vascular barrier disruption is a prerequisite for non-alcoholic steatohepatitis development. J Hepatol. 2019;71(6):1216–1228. doi:10.1016/j.jhep.2019.08.005
58. Jegatheesan P, Beutheu S, Freese K, et al. Preventive effects of citrulline on Western diet-induced non-alcoholic fatty liver disease in rats. Br J Nutr. 2016;116(2):191–203. doi:10.1017/S0007114516001793
59. Raso GM, Simeoli R, Iacono A, et al. Effects of a Lactobacillus paracasei B21060 based synbiotic on steatosis, insulin signaling and toll-like receptor expression in rats fed a high-fat diet. J Nutr Biochem. 2014;25(1):81–90. doi:10.1016/j.jnutbio.2013.09.006
60. Abenavoli L, Falalyeyeva T, Boccuto L, Tsyryuk O, Obeticholic Acid: KN, New A. Era in the treatment of nonalcoholic fatty liver disease. Pharmaceuticals (Basel). 2018;11:4. doi:10.3390/ph11040104
61. Cengiz M, Ozenirler S, Elbeg S. Role of serum toll-like receptors 2 and 4 in non-alcoholic steatohepatitis and liver fibrosis. J Gastroenterol Hepatol. 2015;30(7):1190–1196. doi:10.1111/jgh.12924
62. Sui YH, Luo WJ, Xu QY, Hua J. Dietary saturated fatty acid and polyunsaturated fatty acid oppositely affect hepatic NOD-like receptor protein 3 inflammasome through regulating nuclear factor-kappa B activation. World J Gastroenterol. 2016;22(8):2533–2544. doi:10.3748/wjg.v22.i8.2533
63. Wree A, McGeough MD, Peña CA, et al. NLRP3 inflammasome activation is required for fibrosis development in NAFLD. J Mol Med (Berl). 2014;92(10):1069–1082. doi:10.1007/s00109-014-1170-1
64. Wen H, Gris D, Lei Y, et al. Fatty acid-induced NLRP3-ASC inflammasome activation interferes with insulin signaling. Nat Immunol. 2011;12(5):408–415. doi:10.1038/ni.2022
65. Jain MR, Giri SR, Bhoi B, et al. Dual PPARα/γ agonist saroglitazar improves liver histopathology and biochemistry in experimental NASH models. Liver Int. 2018;38(6):1084–1094. doi:10.1111/liv.13634
66. Ratziu V, Harrison SA, Francque S, et al. Elafibranor, an agonist of the peroxisome proliferator-activated receptor-α and -δ, induces resolution of nonalcoholic steatohepatitis without fibrosis worsening. Gastroenterology. 2016;150(5):1147–1159.e1145. doi:10.1053/j.gastro.2016.01.038
67. Henkel J, Coleman CD, Schraplau A, et al. Induction of steatohepatitis (NASH) with insulin resistance in wildtype B6 mice by a western-type diet containing soybean oil and cholesterol. Mol Med. 2017;23:70–82. doi:10.2119/molmed.2016.00203
 © 2020 The Author(s). This work is published and licensed by Dove Medical Press Limited. The
full terms of this license are available at https://www.dovepress.com/terms
and incorporate the Creative Commons Attribution
- Non Commercial (unported, 3.0) License.
By accessing the work you hereby accept the Terms. Non-commercial uses of the work are permitted
without any further permission from Dove Medical Press Limited, provided the work is properly
attributed. For permission for commercial use of this work, please see paragraphs 4.2 and 5 of our Terms.
© 2020 The Author(s). This work is published and licensed by Dove Medical Press Limited. The
full terms of this license are available at https://www.dovepress.com/terms
and incorporate the Creative Commons Attribution
- Non Commercial (unported, 3.0) License.
By accessing the work you hereby accept the Terms. Non-commercial uses of the work are permitted
without any further permission from Dove Medical Press Limited, provided the work is properly
attributed. For permission for commercial use of this work, please see paragraphs 4.2 and 5 of our Terms.