Back to Journals » Diabetes, Metabolic Syndrome and Obesity » Volume 13
Guidelines and Considerations for Metabolic Tolerance Tests in Mice
Authors Benedé-Ubieto R ![]() , Estévez-Vázquez O, Ramadori P, Cubero FJ
, Estévez-Vázquez O, Ramadori P, Cubero FJ ![]() , Nevzorova YA
, Nevzorova YA ![]()
Received 15 October 2019
Accepted for publication 24 December 2019
Published 18 February 2020 Volume 2020:13 Pages 439—450
DOI https://doi.org/10.2147/DMSO.S234665
Checked for plagiarism Yes
Review by Single anonymous peer review
Peer reviewer comments 3
Editor who approved publication: Prof. Dr. Antonio Brunetti
Raquel Benedé-Ubieto,1,* Olga Estévez-Vázquez,1,* Pierluigi Ramadori,2 Francisco Javier Cubero,3,4 Yulia A Nevzorova1,4,5
1Department of Physiology, Genetics and Microbiology, Faculty of Biology, Complutense University, Madrid, Spain; 2Division of Chronic Inflammation and Cancer, German Cancer Research Center Heidelberg (DKFZ), Heidelberg, Germany; 3Department of Immunology, Ophthalmology & ENT, Complutense University School of Medicine, Madrid, Spain; 4 12 de Octubre Health Research Institute (imas12), Madrid, Spain; 5Department of Internal Medicine III, University Hospital RWTH Aachen, Aachen, Germany
*These authors contributed equally to this work
Correspondence: Yulia A Nevzorova
Department of Physiology, Genetics and Microbiology, Faculty of Biology, Complutense University, c/José A. Novais, 2, Madrid 28040, Spain
Tel +49-(0)241-80-80662
Fax +49-(0)241-80-82455
Email [email protected]
Abstract: The epidemic of the century, Diabetes Mellitus (DM) is continuously rising. Intensive research is urgently needed whereby experimental models represent an essential tool to optimise the diagnostic strategy and to improve therapy. In this review, we describe the central principles of the metabolic tests available in order to study glucose and insulin homeostasis in mice, focusing on the most widely used – the glucose and insulin tolerance tests. We provide detailed experimental procedures as well as the practical implementation of these methods and discuss the main factors that should be taken into account when using this methodology.
Keywords: metabolic tolerance test, T2DM, obesity, metabolic syndrome, insulin resistance, glucose intolerance
Introduction
Diabetes mellitus (DM) is a serious threat to the health that affects people from basically every country in the world. Globally, the number of people with DM has quadrupled in the past three decades. Nowadays, about 1 in 11 adults worldwide have DM, 90% of whom have type 2 DM (T2DM). This escalation is partly due to increasing rates of overweight, obesity, and a sedentary lifestyle.1,2 In order to mitigate this pandemic, there is an urgent need for new approaches to handle T2DM, obesity and their associated complications. This requires the use of animal models to develop, validate and optimize novel therapeutics for their safe use in patients.3 However, in order to improve the transition from bench to bedside, researchers must not only carefully select the appropriate in vivo model but also draw the right conclusions.
The metabolic tolerance tests (MTT) have been the mainstay for diagnosing diabetes for decades. These tests represent simple but powerful screening methods to diagnose impaired carbohydrate metabolism, glucose intolerance and early Insulin Resistance (IR).4
Generally, the MTT are widely used in the literature, are relatively easy to perform and require only basic experience and handling skills with lab animals. However, the outcome of the tests and reproducibility of results can have great variability if the procedure is not correctly performed. By using the most relevant literature5–8 and our experience,9–11 in this review, we standardize and describe easy-to-follow detailed protocols for main MTT, and highlight the advantages, limitations and important caveats of each of these methods.
Basic Considerations
Before the beginning of any MTT, it is critical that researchers seriously take into account the impact of several factors, including mouse strain, age, gender, control groups, husbandry and fasting conditions. All these details should be also clearly and accurately described in the methodological section of the publication. Most critical factors that can lead to misinterpretation of phenotypic results are specified below and outlined in Table 1 (bullet points).
 |
Table 1 Bullet Points: General Experimental Pre-Settings, Quick Procedure and Considerations for MTT |
Animal Husbandry
Animals should be housed under standard pathogen-free conditions and regular 12:12-hr light–dark cycle. The light–dark regime should be strictly followed and researchers should eschew to perform experiments or even enter the mouse room during the dark cycle to avoid any potential impact on the animal´s metabolism. Along these lines, the time of the day during which the metabolic tests are to be conducted represents also a key factor. Over a 24-hr period, mice, similarly to humans, experience variations in glucose and metabolic hormones which can affect the interpretation of results. The circadian rhythm of glucose concentration – is characterized by a peak in the middle of the photophase (light period) decreasing to the beginning of the scotophase (dark period).12 It is therefore important for all experiments in a given study to be carried out at the same time of the day.5
From current codes of practice, assuming the daily cost of animal housing, there is a strong motivation to group housing of mice. Whilst the natural behaviour of female mice simplifies their housing in groups even during extended periods of chronic treatment, male mice do not naturally share territories, and aggression can be a serious welfare problem. Even without aggression, the distribution of food, water, resting places between animals within a group can be affected by the subordination and social hierarchies. Therefore, if harmonious grouping is not possible, providing male mice with a more suitable environment through single-housing may be more favourable from the perspectives of research validity. However, for a better comparison between the groups, it is recommendable to have the same number of mice per cages during the whole experimental period.13
It is also extremely important to reduce environmental stress of the experimental animals, since it is well established that stress response and subsequent elevations in adrenaline and noradrenaline have major physiological effects on glucose homeostasis. This includes plasma glucose concentrations in mice which are significantly elevated following primary handling or cage transporting.14 Hence, a quiet environment nearby the mice cages is essential and any disturbance such as noise, lightening vibration, strong odours should be minimized. The harmful influence of stress during experimental protocols can be potentially reduced with acclimatization of mice to being handled. It is advisable to handle experimental mice at least once every week after weaning, for example, by weighting. It is also recommendable to transport mice to the experimental room in their home cages, at least 1 hr prior to the start of metabolic testing.5,7,15,16 It is also critical to state, that many models of diet-induced obesity or diabetes are associated with polyuria and require more frequent changes of the bedding in the cage.17
Fasting
Accurate metabolic tolerance tests depend on the appropriate preparation of the mice. The proper fasting is essential to provide stable baseline measurements and to obtain consistent excursions in plasma glucose after tolerance tests. Fasting for 10–12 hrs (overnight) is a standard procedure and commonly used in most metabolic studies.12 Mice consume most of their daily calories during the dark cycle. Therefore, overnight fasting provokes a catabolic state in mice, dramatically mobilize the glucose reservoirs, depletes liver glycogen stores and produces low (Figure 1), stable baseline blood glucose levels with small variability.5,7
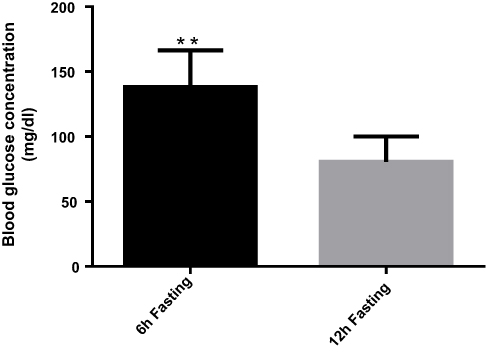 |
Figure 1 Graphical representation of the basal level of glucose after 6 and 12 hrs of fasting. Due to the much intensive mobilization of the glucose reservoirs the basal glucose values after overnight fasting are significantly lower compared to morning fast. C57BL/6J, male mice, n= 5, **P<0.01. |
However, several recent studies have expressed concern since overnight fasting is not ideal and may induce a state more similar to starvation in humans. Rodents are nocturnal feeders, and their metabolic rate is much higher than humans, meaning that an overnight fast is a relatively long time for mice to be deprived of food. In lean mice, overnight fasting reduces lean body mass by ~15%.6 It is also worth to remark that muscle shows increased insulin sensitivity following an overnight fast but not after shorter fasting periods of 5–6 hrs. Thus, sometimes the differences in glucose intolerance between chow- and high-fat diet (HFD)-fed animals are less evident following standard overnight (12 hr) fast compared with shorter fasting times.5,6
The protocols presented below can be used both for overnight, and for morning fasting. However, the appropriate duration of fasting should be carefully chosen based on the animal model and the planned scientific outcome. It seems appropriate, in regard to both animal welfare, and the validity of a study, to apply the shortest possible fasting, and preferably to fast mice in the photophase, to comply with the behaviour of the species.12 Nevertheless, once the scheme of fasting is chosen, it should be kept constant throughout the study. It is also necessary to clearly report when animals were fasted and for how long, in order to enhance the reproducibility of the study.
The Route of Administration
The most common methods for the administration of glucose in mice during tolerance tests are oral gavage (OG) or intraperitoneal injection (i.p.) injection. Both routes of administration are generally accepted as appropriate; however, there are differences in the dynamics of the plasma glucose and insulin response to oral and i.p. delivery that should be considered. The plasma glucose levels are significantly lower in response to oral GTT compared with the same glucose dose administered i.p.5,6 It is mainly due to the fact that glucose absorption from the gut leads to the release of gastrointestinal hormones which significantly potentiate glucose-induced insulin release with consequently lower blood glucose levels compared with i.p. injection.18 This would indicate that administration by OG is the most physiological route of glucose entry. However, based on our experience, oral administration is very stressful for animals and more challenging from the technical point of view, requiring a certain level of expertise from the lab personnel performing the tests. It frequently introduces significant variability in the outcome and is often associated with incomplete glucose retention, inadvertent tracheal administration, aspiration pneumonia, oesophageal perforation and even gastric rupture, resulting in the removal of animals from the study.19
One mechanism to minimise stress and complications during oral gavage is to use anaesthesia when performing MTT. Although anaesthesia may influence gastrointestinal motility, blood glucose, plasma insulin dynamics and therefore likely to give highly aberrant results. Administration of isoflurane (2–3%) triggers a significant increase in blood glucose concentration in both fasted and fed rats and mice and induces an impaired glucose tolerance.20 The i.p. injection with a combination of ketamine/xylazine (100 mg/kg/10 mg/kg) lowers insulin responses and leads to severe hyperglycemia throughout the experiment.21,22 Pentobarbital (40 mg/kg; i.p.) results in both increased insulin secretion and impaired glucose tolerance.22 Thus, the application of anaesthetics for metabolic studies can potentially lead to a confounding interpretation of the experimental data and should not be used for MTTs in animals.
The i.p. route is an alternative method for glucose delivery successfully used in our laboratory for many years.9,10 Although i.p. delivery is considered a parenteral route of administration, the pharmacokinetics of substances administered i.p. are more similar to those seen after OG, because the primary absorption occurs into mesenteric vessels, and drains into the portal vein, passing through the liver.23 It is technically a simple procedure to perform; however, training and competent lab personnel should ensure that substances are delivered accurately and that needle perforation of the gut or stomach lumen is avoided.23,24 In the protocols presented below the i.p. route of administration has been described as a basic method.
Strains of Mice
As it has been documented in many studies, mouse strains exhibit remarkable differences in glucose homeostasis as well as in their inherent predispositions to develop metabolic disease.
Overall, the C57BL/6 mouse strain is generally suggested to be the best strain for studying the metabolic disease. For example, BALB/c mice display preserved glucose tolerance and insulin action under HFD, and this seems to be directly related to the lack of fat accumulation, despite lipid accumulation in the muscle.25,26 There are, nonetheless, important differences in the metabolic phenotypes of the 6J and 6N substrains of the C57BL/6 mice. In lean animals, 6J has higher glucose levels than 6N after GTT.20,27 A similar situation was observed in HFD studies, where both substrains develop glucose intolerance, but glucose levels were higher and insulin secretion was significantly lower in the 6J.28,29 Therefore, the 6J substrain of the C57BL/6 mouse has been widely used in metabolic research, since these mice are more prone to develop diabetes and diet-induced obesity. It is also the background strain for ob/ob mouse. However, this substrain cannot be used for the generation of knockout animals, since the 6J embryonic stem cells have low rates of germline transmission. Recently, a stem cell (SC) line was developed from the 6N substrain and selected for the generation of targeted alleles in the International Knockout Mouse Consortium (IKMC). Hence, for 6N-derived knockouts the backcrossing strategy and consecutive mating with 6J for few generations will eliminate genetic variability as a complicating factor in comparing results and, therefore, is strongly recommendable.28,30
Sex
Metabolic processes are known to be regulated in a sex-specific manner. There are significant alterations in models of glucose intolerance, IR and diabetes between male and female mice. In general, male mice exhibit a stronger phenotype than females. In turn, female animals manifest improved glucose tolerance, likely due to greater insulin sensitivity in liver, muscles and adipose tissue.31
These sex-related differences could be partly due to the action of sex hormones. For example, the increased sensitivity to insulin and lipogenesis observed in adipocytes from females may account for their lower risk of IR and diabetes incidence, despite similar or higher fat content than in males. The decrease in estrogen and increase in testosterone levels – which occur during menopause – are associated with loss of subcutaneous as well as gain of visceral fat plus an increase in IR.32,33 Moreover, the leptin signalling within the brain is sexually different to influence the regulation of glucose homeostasis and fat distribution, with females relying on leptin to a greater extent than males.34
Thus, mouse sex can have a critical impact on the performance of the metabolic model and only animals of the same sex should be used in the studied cohorts.
Age
Aging is associated with a progressive deterioration in most endocrine functions, responsible for metabolic disorders. Many studies have reported hyperglycaemia, declining glucose tolerance and increasing IR as an important characteristic of aging. The main possible mechanisms are alterations of hepatic glucose production, insensitivity to the actions of insulin at the post-receptor/receptor levels, and decreased insulin sensitivity of pancreatic cells to insulinotropic gut hormones.35–37
However, in mice up to 20 months of age, the increase in β-cell mass and in insulin secretion is capable of compensating the growing IR. In contrast, at older ages (over 30 months), the β cell areas are decreased and, due to a failure of β cell compensation, the insulin levels decline and glucose intolerance is normally observed.38 The age-related changes may be worsened due to obesity, renal failure or the ingestion of certain drugs.35 Therefore, age of animals plays an important role in the experimental setting and metabolic tests should be carried out using age-matched mice.5
Ethical Considerations
All MTTs should be carried only after authorisation from the competent local Animal Ethics Committee by personnel trained in animal experimentation in strict compliance with 3R (Replacement, Reduction and Refinement) principle for animal welfare postulated by Russel and Burch in 1959.39
Hence, there are no physiologically significant “Replacement” alternatives for MTT methods that allow to avoid the use of animals, the “Reduction” and “Refinement” tenets should be respected.
Specifically, “Reduction” refers to any strategy that will result in fewer animals being used to obtain sufficient data to answer the research question. From our own previous work, during MTT we observe approximately 25% variation in the levels of basal glucose (after 12 hrs of fasting) in the control animals as well as in the animals treated with Western diet. Using the software G Power V.3.1.9, a statistical power of 90% and a specific α error probability of 0.05, we calculated that the minimal required number of animals should be n = 5 per group.40 We also recommend repeating the tests several times using different animals and combining the data sets.
“Refinement” requires the modification of husbandry or experimental procedures to minimize pain and distress, and to enhance the welfare of an animal used in the experiment.39 According to Article 15 of the EU Directive 2010/63 the metabolic tolerance tests as a procedure resulting in short-term distress with no significant impairment of the well-being or general condition of the animals, should be classified as “mild” (the details can be found at https://eur-lex.europa.eu/legal-content/EN/TXT/?uri=celex%3A32010L0063). We think that the presented protocol entirely supports the “Refinement” principle and represents the basis of new animal welfare rules that are presently implemented in many countries within the European Framework.
Practical Implementation
Note: Please note that all procedures described in this protocol should only be performed after institutional and governmental approval as well as by staff that are technically proficient.
Glucose Tolerance Test (GTT)
The rise and fall of the blood glucose concentration following oral or intravenous administration of glucose “the tolerance curve” has long been widely used both clinically in patients and experimentally in animals as an index of efficiency of the mechanisms regulating the concentration of glucose in the blood.41 The fact that carbohydrate ingestion results in blood glucose fluctuations had actually been known, since the beginning of the 20th century. In 1940 Jerome W. Conn investigated this issue and primarily implemented the GTT in his clinical research, showing that a low-carbohydrate diet can cause deterioration of glucose tolerance.
Nowadays, GTT is recommended by the World Health Organization (WHO)42 and should be retained as a diagnostic test to identify people with impaired glucose tolerance. In fact, the use of fasting glucose alone for screening fails to diagnose approximately 30% of people with diabetes. This discrepancy is even more obvious in the elder population. Around 70% of women and 48% of men aged 50–89 years had new diagnosed diabetes at the time they underwent oral glucose tolerance.43
In mice, the GTT is the simplest, and usually the first, test applied to an animal model, and it provides a physiological overview of any changes in glucose tolerance without determining the causative mechanisms. Briefly, mice are routinely fasted before the administration of glucose. Baseline blood glucose concentrations are taken before the application of glucose, and the following measurements are made at certain intervals over a span of 2 hrs.7 However, the influence of the factors described above (see bullet points) on the glucose-tolerance curve is well documented and should not be ignored. Moreover, in order to avoid misinterpretation of results, the conditions of the test should be standardized and kept consistently during the running study.
Materials and Equipment (Figure 2A1)
- 1-mL Syringes and 25–27-G needle or, preferentially, insulin syringes with needles
- Sharp scissors or surgical blades
- Hand-held whole-blood glucose meter (glucometer) and corresponding glucose test strips.
 |
Figure 2 Illustrative representation of the GTT experimental protocol. (A1) Material and equipment required for GTT (20% glucose stock solution, 1-mL syringes, 25–27-G needles, microsurgery scissors, glucose test strips, glucometer, lab balance). (A2) Material and equipment required for ITT (Insulin, sterile saline, 1-mL syringes, 25–27-G needles, microsurgery scissors, glucose test strips, glucometer, lab balance). (B) Animals are weighed before the beginning of the experimental procedure for the estimation of proper amount of Glucose/Insulin. (C) Tail tip of the manually restrained mouse is cautiously snipped with sharp scissors. (D) Measurement of the basal glucose. The blood is obtained from the lifted tail of the mouse and the small drop is placed directly on a test strip. (E) i.p. injection. (F) Evaluation of blood glucose 30, 60, 90 and 120 mins after injection. |
Note: Typical hand-held glucometers are small in size and require minor volumes of blood (typically 5 μL or less) and therefore very practical when performing multiple experiments at once. Nowadays many companies, for example, Bayer (Barmen, German), Becton Dickinson (BD) (New Jersey, USA), Roche (Basel, Switzerland) and LifeScan (California, USA) provide a wide range of glucometers. In our lab, we have traditionally used the Aviva (Roche. REF: 06988580037) and Accu-Check Aviva reactive strips (Roche REF:06916686001).
CAUTION: Given the differences between glucometers, investigators should not change the brand of the monitor through the whole experimental period. It is also recommendable to evaluate the technical accuracy of the device by comparing the results of glucometer against clinical laboratory methods that use plasma/serum-based samples.
CAUTION: Test strips should not be stored in closed vehicles for extended periods and must be protected from extremes of temperature and humidity.27
- 20% glucose stock solution.
Note: The stock solution can be prepared by dissolving 2 g of D-glucose (Sigma-Aldrich), in 10 mL of sterile saline solution. The solution should be additionally sterilized by passing it through a 0.2-μm filter into a sterile 15-mL Falcon tube. Another option is to use commercially available 20% Glucose Solution for w/v Infusion (e.g. G-20%, BRAUN, REF: 18046406).
Caution: Prior to administration the solution should be pre-warmed to room or body temperature since injection of cold substances can cause discomfort and drop in body temperature of mice.
- Timer
- Lab balance and a beaker for weighing mice
- Experimental record sheet
Note: the attached example of the record sheet (see Supplementary Table 1).
Experimental Protocol
- Place mice in a clean cage without food. Keep the water bottle.
Caution: Rodents are coprophagic, therefore for true fasting conditions make sure that the cage is clean and has new bedding.
Note: For overnight fasting, it is recommendable to remove food just before the dark cycle, i.e. approximately at 7:00 pm. The morning fasting can start at 8:00 a, until 2:00 pm.
Dosage: 1.5g of glucose/kg body mass
Formula: Volume of glucose for injection (μL) = 7.5 x body weight (g)
Example: for a 25 g mouse the volume for injection should be 187.5 μL.
Note: There is no consistent amount of glucose administered for GTT, with either 1 or 2 g/kg glucose being typically used in the literature. However, in the HFD-fed as well as in many other diabetic models, the body weight is typically increased due to the fat mass, without proportionately changes in lean mass which is in fact the principal site of glucose disposal (muscle, brain and liver). Therefore, obese mice could be misdiagnosed as glucose intolerants simply because they received a disproportionately high amount of glucose for the same lean body mass.44 Consequently, impaired glucose tolerance in obese mice may only occur in response to a higher glucose loading (1.5-2g/kg).5–7,45
Prepare the glucometer device: insert the test strip in the direction of the arrows. The meter turns on and beeps. Manually carefully restrain the mouse. Pinch tail of the mouse between thumb and forefinger, and cautiously snip a tip of the tail with sharp scissors or a scalpel blade (Figure 2C).
Note: Typically, blood is taking from the tail tip. This simple and fast technique does not require any special surgical skills and can be easily performed in conscious animals.5 However, the total amount of removed tail tissue should be as small as possible. In most cases, 2 mm should be adequate.
Obtain the blood drop by direct flow or by gentle squeezing/massaging the tail (Figure 2D). Make sure that the blood drop symbol flashes on the glucometer, place the device firmly against the tail tip, touch the blood drop to the front edge of the yellow window of the test strip. The glucometer beeps and flashes once enough blood is placed on the test strip. The test results appear on the display. Return the mouse to the cage. Remove and discard the used test strip. Record the result (t=0) in the experimental record sheet. Proceed with the following mouse until the basal levels of each mouse are collected.
Prepare the syringe with an appropriate amount of glucose solution. Hold the conscious mouse in a supine position (abdomen side up) by the nape of the neck and extend by pressing the tail to the palm of the hand with its head pointed lower than the body.
Note: It is not necessary to sterilize the skin with antiseptics as their use is ineffective and may only cause additional disturbance to the animal. However, a new needle and syringe should be used for each mouse.
The injection should be performed in the animal’s lower right quadrant of the abdomen in order to avoid damage to the urinary bladder, cecum and other abdominal organs. Insert the syringe at an approximately 30-400 angle to horizontal. Push the needle to the depth in which the entire bevel is within the abdominal cavity. Slowly inject the appropriate amount of glucose solution into the intraperitoneal cavity, pull the needle straight out and discard properly into a sharp container without recapping. Carefully place the animal back into the cage. Note the time-point of injection. Continue i.p. injections on subsequent mice, maintaining a 2–5-min interval between animals.
Caution: The syringe plunger may be withdrawn prior to injection. If urine, blood, or digesta are seen in the needle hub, the needle should be withdrawn, replaced, and repositioned prior to injection.
Caution: Too acute an angle of puncture should be avoided, as it results in subcutaneous rather than intraperitoneal administration.23
Caution: In obese animals (upon HFD, for example), almost the entire needle length may need to be inserted.
Note: The time management is very important; follow the time intervals in the record sheet as closely as possible.
Note: For all subsequent measurements, in order to avoid additional stress, instead of removing and restraining the animal just lift the tail of the mouse, while leaving it in the cage. Squeeze the tail and start the bleeding again by removing the clot from the first incision, or gentle massage the tail if blood flow is inadequate. Discard the first drop and place the next small drop of blood on a new test strip and document the measurements in the record sheet.
Caution: Monitor the mice carefully at least for 2 hrs for any abnormal behaviour.5
Insulin Tolerance Test (ITT)
To complement the analysis of glucose tolerance in vivo, it is recommendable to include some measurements of IR to the study. Here, the ITT is the first-choice method. It is simple and technically very similar to the GTT as it involves monitoring of blood glucose levels over time, but in response to insulin administration rather than glucose loading. Many of the technical considerations that apply to GTTs also apply to ITTs, even though with some additional factors.
Materials and Equipment (Figure 2A2)
- Insulin syringes
- Sharp scissors or surgical blades
- Glucometer
- Glucose Test Strips
- 0.25 IU Insulin stock solution (e.g. Actrapid 100 UI/mL. Human Insulin. Novo nordisk. REF: 775502.9)
Note: The stock solution can be prepared by diluting 100 IU human insulin (Actrapid) in sterile saline 1:400 (9,975mL of saline and 25 μL of 100 IU Insulin). The solution should be mixed by vortexing and sterilized by passing it through a 0.2-μm filter into a sterile 15-mL Falcon tube.
Experimental Protocol
Note: The MTTs are very exhausting for the mice. Therefore, minimum of 1 week between tolerance tests should be taken to regain lost blood volume and to recover.8
Note: most of the steps are similar to the GTT and described above
- Fast animals in a clean cage from 8:00 am until 2:00 pm (morning fast). Keep the water bottle!
Note: In order to avoid the hypoglycaemic conditions during the test we recommend to do 6-hr fasting intervals.
Dosage: 0.75 IU insulin/kg body mass
Formula: volume of insulin for injection (μL) = 3 x body weight (g)
Example: for 25 g mouse the volume for injection should be 75 μL.
Note: Take into account the differences in the fat mass in obese animals, including those >40g on a HFD or such, and increase the dose up to 2 U/kg.
Note: If blood glucose drops below 20 mg/dL, or animal appears hypoglycaemic (tremor, heightened anxiety or apathy, paresthesia, loss of consciousness and rarely convulsions), inject i.p. 300 μL of the glucose solution prepared above to rescue the mouse and prevent shock. Ignore the data from this animal.
Note: Due to the short half-life of insulin (10 min), the blood glucose measurements are usually limited to 90 min after i.p. injection.7
Interpretation of Results
The results should be presented as a time course of absolute blood glucose measurements (mg/dL) and as the area under the curve (AUC). The statistical comparison of glucose levels can be processed through an analysis of variance by any statistical and graphing program, for example, Prism 8.0 (GraphPad Software, San Diego, CA).
A typical GTT for chow-fed female 20 weeks old mice with C57BL/6J background after overnight fasting is shown in Figure 3A. The following parameters can be analysed here: glucose concentration at basal level and at each time point after glucose administration, the dynamic of the curve decrease. Generally, a healthy mouse with normal glucose tolerance shows a characteristic rapid rise in blood glucose, reaching its peak 15 min after the glucose challenge. Subsequent glucose uptake, primarily conducted by muscle, fat and liver-tissue leads to a gradual decrease of the blood glucose concentration to the normal level after approximately 60–90 min.
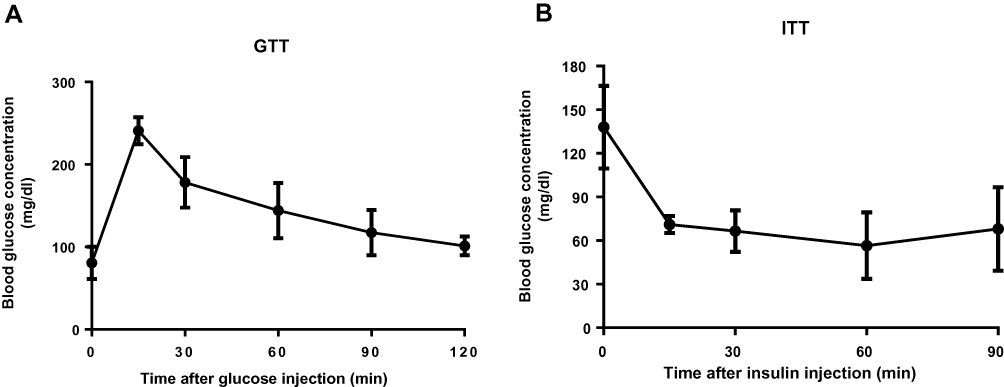 |
Figure 3 GTT (A) and ITT (B) in C57BL/6J, 20 weeks old female mice fed with chow diet. (A) After 12 hrs, fasting animals received i.p. injection of 1.5 g/kg glucose. The blood glucose levels (mg/dl) were measured at different time points using hand-held glucometer. (B) Mice were fasted for 6 h and glucose response to i.p. insulin administration (0.75 IU/kg) was measured at the indicated time (n=5). |
Altogether, the signs of increased concentration of glucose at certain time-points or the elevated cumulative AUC in the experimental animals during GTT compare to the control group can pinpoint the impaired glucose tolerance. Moreover, the initial spike response is generally referred to as first-phase insulin release, and the subsequent decrease is considered to represent the less-prominent but sustained the second phase. Normally, partial or complete loss of the first phase of glucose-induced insulin release is a characteristic deterioration in the early stages of type 2 diabetes.46 Still, the researchers should be aware that glucose tolerance and insulin action are not equivalent and try to avoid the over-interpretation of results, additional more detailed studies are certainly required (e.g. euglycemic clamp).5,7
Nevertheless, ITT helps to determine the sensitivity of insulin-responsive tissues. The degree to which glucose falls following the insulin bolus is indicative of whole-body insulin action. The data should be presented as a time course of absolute blood glucose measurements (Figure 3B), as reverse AUC, and additionally by percentual changes in fasting glucose. The impaired IR becomes apparent if insulin administration is less effective in lowering blood glucose levels compared with the control group.
Additionally, few more supplementary metabolic tests to assess glucose metabolism have been developed. Although they are of little value, they can be extraordinarily helpful to add substantive data and properly characterize impaired glucose homeostasis and accurately assess metabolic phenotypes in the mice (Table 2).
 |
Table 2 Other Metabolic Tolerance Tests |
Conclusions
Metabolic tolerance tests are among the key methods in experimental animal research. They are easy to perform, non-invasive and affordable. However, the improper technical accuracies can dramatically alter the reliability and reproducibility of the results. Here, we provided an easy to follow very detail protocol that allows the performance of GTT and ITT in mice. It is simple to implement and can be quickly used by skilled scientists. Furthermore, we specify some important factors that should be taken into account, including sex-, age-, and strain-related differences and include some practical considerations of the procedure design. We hope that our review will help to successfully establish these methods in other laboratories in order to obtain reliable and reproducible results. We also think that these protocols fully comply with the 3Rs principle of animal experimentation and support the basis of new European animal welfare rules.
Abbreviations
DM, Diabetes Mellitus; IR, Insulin Resistance; GTT, Glucose Tolerance Test; HFD, High fat diet; i.p., Intraperitoneal Injection; ITT, Insulin tolerance test; MTT, Metabolic tolerance test; OG, Oral gavage; SC, Stem cell; TT, Tolerance test; T2DM, Type 2 diabetes mellitus.
Ethical Statement
Animal experiments were carried out according to Spanish legal requirements and animal protection law and approved by the authority of environment conservation and consumer protection of the Regional Government of Madrid (PROEX210/18). The mice are housed under specific-pathogen-free conditions according to the guidelines of the Federation for Laboratory Animal Science Associations (FELASA).
Acknowledgments
This work is funded by the German Research Foundation (SFB/TRR57/P04, SFB 1382-403224013/A02 and DFG NE 2128/2-1) (to Y.A.N.), the MINECO Retos by MINECO Retos (SAF2017-87919R to Y.A.N.) and (SAF2016-78711 to F.J.C.), and the EXOHEP-CM S2017/BMD-3727, NanoLiver-CM Y2018/NMT-4949, ERAB Ref. EA 18/14, AMMF 2018/117, UCM-25-2019 and COST Action CA17112 (to Y.A.N. and F.J.C). Y.A.N. and F.J.C. are Ramón y Cajal Researchers RYC2015-17438 and RyC2014-15242, respectively. F.J.C. is a Gilead Liver Research Scholar. The research group belongs to the Research Group UCM Ref. 970935 ¨Liver Pathophysiology¨.
Disclosure
The authors declare that they have no competing interests in this work.
References
1. Goyal R, Jialal I. Diabetes Mellitus Type 2. [Updated 2019 Oct 6]. In: StatPearls [Internet]. Treasure Island (FL): StatPearls Publishing; 2019 Jan.
2. Zheng Y, Ley SH, Hu FB. Global aetiology and epidemiology of type 2 diabetes mellitus and its complications. Nat Rev Endocrinol. 2018;14(2):88–98. doi:10.1038/nrendo.2017.151
3. Kleinert M, Clemmensen C, Hofmann SM, et al. Animal models of obesity and diabetes mellitus. Nat Rev Endocrinol. 2018;14(3):140–162.
4. Bartoli E, Fra GP, Carnevale Schianca GP. The oral glucose tolerance test (OGTT) revisited. Eur J Intern Med. 2011;22(1):8–12. doi:10.1016/j.ejim.2010.07.008
5. Ayala JE, Samuel VT, Morton GJ, et al. Standard operating procedures for describing and performing metabolic tests of glucose homeostasis in mice. Dis Model Mech. 2010;3(9–10):525–534. doi:10.1242/dmm.006239
6. Andrikopoulos S, Blair AR, Deluca N, Fam BC, Proietto J. Evaluating the glucose tolerance test in mice. Am J Physiol Endocrinol Metab. 2008;295(6):E1323–E1332. doi:10.1152/ajpendo.90617.2008
7. Bowe JE, Franklin ZJ, Hauge-Evans AC, King AJ, Persaud SJ, Jones PM. Metabolic phenotyping guidelines: assessing glucose homeostasis in rodent models. J Endocrinol. 2014;222(3):G13–G25. doi:10.1530/JOE-14-0182
8. Nagy C, Einwallner E. Study of in vivo glucose metabolism in high-fat diet-fed mice using Oral Glucose Tolerance Test (OGTT) and Insulin Tolerance Test (ITT). J Vis Exp. 2018;131:e56672.
9. Nevzorova YA, Cubero FJ, Hu W, et al. Enhanced expression of c-myc in hepatocytes promotes initiation and progression of alcoholic liver disease. J Hepatol. 2016;64(3):628–640. doi:10.1016/j.jhep.2015.11.005
10. Hao F, Cubero FJ, Ramadori P, et al. Inhibition of Caspase-8 does not protect from alcohol-induced liver apoptosis but alleviates alcoholic hepatic steatosis in mice. Cell Death Dis. 2017;8(10):e3152. doi:10.1038/cddis.2017.532
11. Calo N, Ramadori P, Sobolewski C, et al. Stress-activated miR-21/miR-21* in hepatocytes promotes lipid and glucose metabolic disorders associated with high-fat diet consumption. Gut. 2016;65(11):1871–1881. doi:10.1136/gutjnl-2015-310822
12. Jensen TL, Kiersgaard MK, Sorensen DB, Mikkelsen LF. Fasting of mice: a review. Lab Anim. 2013;47(4):225–240. doi:10.1177/0023677213501659
13. Kappel S, Hawkins P, Mendl MT. To group or not to group? Good practice for housing male laboratory mice. Animals (Basel). 2017;7:12.
14. Tabata H, Kitamura T, Nagamatsu N. Comparison of effects of restraint, cage transportation, anaesthesia and repeated bleeding on plasma glucose levels between mice and rats. Lab Anim. 1998;32(2):143–148. doi:10.1258/002367798780599983
15. Balcombe JP, Barnard ND, Sandusky C. Laboratory routines cause animal stress. Contemp Top Lab Anim Sci. 2004;43(6):42–51.
16. Ghosal S, Nunley A, Mahbod P, et al. Mouse handling limits the impact of stress on metabolic endpoints. Physiol Behav. 2015;150:31–37. doi:10.1016/j.physbeh.2015.06.021
17. Wang CY, Liao JK. A mouse model of diet-induced obesity and insulin resistance. Methods Mol Biol. 2012;821:421–433.
18. Drucker DJ. Incretin action in the pancreas: potential promise, possible perils, and pathological pitfalls. Diabetes. 2013;62(10):3316–3323. doi:10.2337/db13-0822
19. Jones CP, Boyd KL, Wallace JM. Evaluation of mice undergoing serial oral gavage while awake or anesthetized. J Am Assoc Lab Anim Sci. 2016;55(6):805–810.
20. Zuurbier CJ, Koeman A, Houten SM, Hollmann MW, Florijn WJ. Optimizing anesthetic regimen for surgery in mice through minimization of hemodynamic, metabolic, and inflammatory perturbations. Exp Biol Med (Maywood). 2014;239(6):737–746. doi:10.1177/1535370214524877
21. Saha JK, Xia J, Grondin JM, Engle SK, Jakubowski JA. Acute hyperglycemia induced by ketamine/xylazine anesthesia in rats: mechanisms and implications for preclinical models. Exp Biol Med (Maywood). 2005;230(10):777–784. doi:10.1177/153537020523001012
22. Windelov JA, Pedersen J, Holst JJ. Use of anesthesia dramatically alters the oral glucose tolerance and insulin secretion in C57Bl/6 mice. Physiol Rep. 2016;4(11):e12824. doi:10.14814/phy2.12824
23. Turner PV, Brabb T, Pekow C, Vasbinder MA. Administration of substances to laboratory animals: routes of administration and factors to consider. J Am Assoc Lab Anim Sci. 2011;50(5):600–613.
24. Miner NA, Koehler J, Greenaway L. Intraperitoneal injection of mice. Appl Microbiol. 1969;17(2):250–251. doi:10.1128/AEM.17.2.250-251.1969
25. Montgomery MK, Hallahan NL, Brown SH, et al. Mouse strain-dependent variation in obesity and glucose homeostasis in response to high-fat feeding. Diabetologia. 2013;56(5):1129–1139. doi:10.1007/s00125-013-2846-8
26. Berglund ED, Li CY, Poffenberger G, et al. Glucose metabolism in vivo in four commonly used inbred mouse strains. Diabetes. 2008;57(7):1790–1799. doi:10.2337/db07-1615
27. Tonyushkina K, Nichols JH. Glucose meters: a review of technical challenges to obtaining accurate results. J Diabetes Sci Technol. 2009;3(4):971–980. doi:10.1177/193229680900300446
28. Fontaine DA, Davis DB. Attention to background strain is essential for metabolic research: C57BL/6 and the international knockout mouse consortium. Diabetes. 2016;65(1):25–33. doi:10.2337/db15-0982
29. Simon MM, Greenaway S, White JK, et al. A comparative phenotypic and genomic analysis of C57BL/6J and C57BL/6N mouse strains. Genome Biol. 2013;14(7):R82. doi:10.1186/gb-2013-14-7-r82
30. Pettitt SJ, Liang Q, Rairdan XY, et al. Agouti C57BL/6N embryonic stem cells for mouse genetic resources. Nat Methods. 2009;6(7):493–495. doi:10.1038/nmeth.1342
31. Goren HJ, Kulkarni RN, Kahn CR. Glucose homeostasis and tissue transcript content of insulin signaling intermediates in four inbred strains of mice: C57BL/6, C57BLKS/6, DBA/2, and 129X1. Endocrinology. 2004;145(7):3307–3323. doi:10.1210/en.2003-1400
32. Macotela Y, Boucher J, Tran TT, Kahn CR. Sex and depot differences in adipocyte insulin sensitivity and glucose metabolism. Diabetes. 2009;58(4):803–812. doi:10.2337/db08-1054
33. Pettersson US, Walden TB, Carlsson PO, Jansson L, Phillipson M. Female mice are protected against high-fat diet induced metabolic syndrome and increase the regulatory T cell population in adipose tissue. PLoS One. 2012;7(9):e46057. doi:10.1371/journal.pone.0046057
34. Shi H, Strader AD, Sorrell JE, Chambers JB, Woods SC, Seeley RJ. Sexually different actions of leptin in proopiomelanocortin neurons to regulate glucose homeostasis. Am J Physiol Endocrinol Metab. 2008;294(3):E630–E639. doi:10.1152/ajpendo.00704.2007
35. Stout RW. Glucose tolerance and ageing. J R Soc Med. 1994;87(10):608–609.
36. Carvalho CR, Brenelli SL, Silva AC, Nunes AL, Velloso LA, Saad MJ. Effect of aging on insulin receptor, insulin receptor substrate-1, and phosphatidylinositol 3-kinase in liver and muscle of rats. Endocrinology. 1996;137(1):151–159. doi:10.1210/endo.137.1.8536607
37. Muzumdar R, Ma X, Atzmon G, Vuguin P, Yang X, Barzilai N. Decrease in glucose-stimulated insulin secretion with aging is independent of insulin action. Diabetes. 2004;53(2):441–446. doi:10.2337/diabetes.53.2.441
38. Oh YS, Seo EH, Lee YS, et al. Increase of calcium sensing receptor expression is related to compensatory insulin secretion during aging in mice. PLoS One. 2016;11(7):e0159689. doi:10.1371/journal.pone.0159689
39. Fenwick N, Griffin G, Gauthier C. The welfare of animals used in science: how the “Three Rs” ethic guides improvements. Can Vet J. 2009;50(5):523–530.
40. Faul F, Erdfelder E, Lang AG, Buchner A. G*Power 3: a flexible statistical power analysis program for the social, behavioral, and biomedical sciences. Behav Res Methods. 2007;39(2):175–191. doi:10.3758/BF03193146
41. Baird JD, Duncan LJ. The glucose tolerance test. Postgrad Med J. 1959;35(403):308–314. doi:10.1136/pgmj.35.403.308
42. Organisation WH. Definition and Diagnosis of Diabetes Mellitus and Intermediate Hyperglycemia. Geneva: World Health Organizatio; 2006.
43. Barrett-Connor E, Ferrara A. Isolated postchallenge hyperglycemia and the risk of fatal cardiovascular disease in older women and men. The Rancho Bernardo Study. Diabetes Care. 1998;21(8):1236–1239. doi:10.2337/diacare.21.8.1236
44. Jorgensen MS, Tornqvist KS, Hvid H. Calculation of glucose dose for intraperitoneal glucose tolerance tests in lean and obese mice. J Am Assoc Lab Anim Sci. 2017;56(1):95–97.
45. McGuinness OP, Ayala JE, Laughlin MR, Wasserman DH. NIH experiment in centralized mouse phenotyping: the Vanderbilt experience and recommendations for evaluating glucose homeostasis in the mouse. Am J Physiol Endocrinol Metab. 2009;297(4):E849–E855. doi:10.1152/ajpendo.90996.2008
46. Gerich JE. Is reduced first-phase insulin release the earliest detectable abnormality in individuals destined to develop type 2 diabetes? Diabetes. 2002;51(Suppl 1):S117–S121. doi:10.2337/diabetes.51.2007.S117
47. Yang Y, Tarabra E, Yang GS, et al. Alteration of de novo glucose production contributes to fasting hypoglycaemia in Fyn deficient mice. PLoS One. 2013;8(11):e81866. doi:10.1371/journal.pone.0081866
48. Carneiro L, Asrih M, Repond C, et al. AMPK activation caused by reduced liver lactate metabolism protects against hepatic steatosis in MCT1 haploinsufficient mice. Mol Metab. 2017;6(12):1625–1633. doi:10.1016/j.molmet.2017.10.005
49. Schuler AM, Gower BA, Matern D, Rinaldo P, Wood PA. Influence of dietary fatty acid chain-length on metabolic tolerance in mouse models of inherited defects in mitochondrial fatty acid beta-oxidation. Mol Genet Metab. 2004;83(4):322–329. doi:10.1016/j.ymgme.2004.08.010
50. Karaca M, Martin-Levilain J, Grimaldi M, et al. Liver glutamate dehydrogenase controls whole-body energy partitioning through amino acid-derived gluconeogenesis and ammonia homeostasis. Diabetes. 2018;67(10):1949–1961. doi:10.2337/db17-1561
51. Mutel E, Gautier-Stein A, Abdul-Wahed A, et al. Control of blood glucose in the absence of hepatic glucose production during prolonged fasting in mice: induction of renal and intestinal gluconeogenesis by glucagon. Diabetes. 2011;60(12):3121–3131. doi:10.2337/db11-0571
52. Foretz M, Hebrard S, Leclerc J, et al. Metformin inhibits hepatic gluconeogenesis in mice independently of the LKB1/AMPK pathway via a decrease in hepatic energy state. J Clin Invest. 2010;120(7):2355–2369. doi:10.1172/JCI40671
53. Martin-Montalvo A, Mercken EM, Mitchell SJ, et al. Metformin improves healthspan and lifespan in mice. Nat Commun. 2013;4:2192. doi:10.1038/ncomms3192
54. Nasri H, Rafieian-Kopaei M. Metformin: current knowledge. J Res Med Sci. 2014;19(7):658–664.
55. Viollet B, Guigas B, Sanz Garcia N, Leclerc J, Foretz M, Andreelli F. Cellular and molecular mechanisms of metformin: an overview. Clin Sci (Lond). 2012;122(6):253–270. doi:10.1042/CS20110386
 © 2020 The Author(s). This work is published and licensed by Dove Medical Press Limited. The
full terms of this license are available at https://www.dovepress.com/terms
and incorporate the Creative Commons Attribution
- Non Commercial (unported, 3.0) License.
By accessing the work you hereby accept the Terms. Non-commercial uses of the work are permitted
without any further permission from Dove Medical Press Limited, provided the work is properly
attributed. For permission for commercial use of this work, please see paragraphs 4.2 and 5 of our Terms.
© 2020 The Author(s). This work is published and licensed by Dove Medical Press Limited. The
full terms of this license are available at https://www.dovepress.com/terms
and incorporate the Creative Commons Attribution
- Non Commercial (unported, 3.0) License.
By accessing the work you hereby accept the Terms. Non-commercial uses of the work are permitted
without any further permission from Dove Medical Press Limited, provided the work is properly
attributed. For permission for commercial use of this work, please see paragraphs 4.2 and 5 of our Terms.