")
Back to Journals » Patient Preference and Adherence » Volume 14
Group-Based Trajectory Modeling to Identify Patterns of Adherence and Its Predictors Among Older Adults on Angiotensin-Converting Enzyme Inhibitors (ACEIs)/Angiotensin Receptor Blockers (ARBs)
Authors Paranjpe R, Johnson ML, Essien EJ , Barner JC , Serna O, Gallardo E, Majd Z, Fleming ML , Ordonez N, Holstad MM , Abughosh SM
Received 6 July 2020
Accepted for publication 11 September 2020
Published 13 October 2020 Volume 2020:14 Pages 1935—1947
DOI https://doi.org/10.2147/PPA.S270809
Checked for plagiarism Yes
Review by Single anonymous peer review
Peer reviewer comments 2
Editor who approved publication: Dr Johnny Chen
Rutugandha Paranjpe,1 Michael L Johnson,1 Ekere J Essien,1 Jamie C Barner,2 Omar Serna,3 Esteban Gallardo,3 Zahra Majd,1 Marc L Fleming,4 Nancy Ordonez,1 Marcia M Holstad,5 Susan M Abughosh1
1Pharmaceutical Health Outcomes and Policy, University of Houston, Houston, TX, USA; 2Health Outcomes Division, The University of Texas at Austin, Austin, TX, USA; 3CareAllies, Houston, TX, USA; 4Department of Pharmacotherapy, University of North Texas Health Science Center, Fort Worth, TX, USA; 5Nell Hodgson Woodruff School of Nursing, Emory University, Atlanta, GA, USA
Correspondence: Susan M Abughosh
Department of Pharmaceutical Health Outcomes and Policy, University of Houston, College of Pharmacy, 4849 Calhoun Road, Houston, TX 77204-5047, USA
Tel +1 832-842-8395
Fax +1 832-842-8383
Email [email protected]
Purpose: Commonly prescribed medications among patients with comorbid diabetes mellitus and hypertension include ARBs and ACEIs. However, these medications are associated with suboptimal adherence leading to inadequately controlled blood pressure. Unlike traditional single estimates of proportion of days covered (PDC), group-based trajectory modeling (GBTM) can graphically display the dynamic nature of adherence. The objective of this study was to evaluate adherence using GBTMs among patients prescribed ACEI/ARBs and identify predictors associated with each adherence trajectory.
Patients and Methods: Patients with an ACEI/ARBs prescription were identified between July 2017 and December 2017 using a Medicare Advantage dataset. PDC was used to measure monthly patient adherence during the one-year follow-up period. The monthly PDC was added to a logistic group-based trajectory model to provide distinct patterns of adherence. Further, a multinomial logistic regression was conducted to determine predictors of each identified adherence trajectory. Predictors included various socio-demographic and clinical patient characteristics.
Results: A total of 22,774 patients were included in the analysis and categorized into 4 distinct adherence trajectories: rapid decline (12.6%); adherent (58.5%); gaps in adherence (12.2%), and gradual decline (16.6%). Significant predictors associated with all lower adherence trajectories included 90 days refill, > 2 number of other medications, ≥ 1 hospitalizations, and prevalent users. Significant predictors associated with the rapid decline trajectory included male sex, comorbidities, and increased CMS risk score. Further, significant predictors associated with the gaps in adherence trajectory included increasing age, and comorbidities. Lastly, significant predictors associated with the gradual decline trajectory included increasing age, no health plan subsidy, comorbidities, and increasing CMS risk score.
Conclusion: Identifying various patient characteristics associated with non-adherent trajectories can guide the development of tailored interventions to enhance adherence to ACEI/ARBs.
Keywords: adherence, trajectory modeling, angiotensin converting enzyme inhibitors, angiotensin receptor blockers, predictors
Introduction
Cardiovascular disease (CVD), the leading cause of mortality in the United States, accounts for 1 in every 3 deaths.1 About 121.5 million American adults have been diagnosed with at least one type of CVD from 2013 to 2016.1 CVD-related conditions impose a significant economic burden on the health-care system. From 2014 till 2015, the US spent 14% of the total national health expenditures on CVD and stroke.2
Diabetes mellitus (DM) and hypertension (HTN) have been listed among the five leading modifiable risk factors associated with half of the CVD-related deaths in US adults aged 45 to 79 years.3 Recent research has reported increasing trends in prevalence of DM and HTN in the US. Since these chronic conditions have common underlying risk factors, the co-occurrence of diabetes and hypertension is quite high, leading to a 70% elevated risk of CVD mortality.4
Controlling hypertension in patients with DM is essential to slow the progression of micro and macrovascular complications.5 According to a 2015 meta-analysis, pharmacotherapy for HTN significantly decreased all-cause mortality as well as CVD events in diabetic patients.6 Having a well-documented benefit in reducing diabetes complications,7–10 Angiotensin-converting enzyme inhibitors (ACEIs) and angiotensin receptor blockers (ARBs) are highly recommended classes of drugs for the treatment of HTN in patients with both DM and HTN.11
Adherence is defined as the extent to which a patient follows the prescriptions recommended by a healthcare provider.12 Medication adherence rates differ among patients ranging from 20% to more than 90% and it depends upon various factors, namely, age, condition-related factors including disease type, severity, and comorbidities, medication regimen, and duration of adherence measurement.13–16 Poor medication adherence may lead to suboptimal clinical outcomes as well as have a significant impact on the economic burden of the disease.17 Non-adherence is a common problem in the elderly population as they often have multiple chronic conditions with complex treatment regimens, physical and cognitive impairments, and higher vulnerability to adverse effects compared to other age groups.18,19 Uncontrolled HTN, when prevalent, may be due to lack of treatment adherence among patients with DM and HTN.20 One of the main consequences of poor adherence to HTN pharmacotherapy is failure to achieve optimal drug benefits and increased risk of CVD morbidity and mortality among patients.21,22 Adherence to ACEIs and ARBs are not only essential to achieve optimal treatment effects but also for measuring quality of care as they are the only class of antihypertensives with STAR measures for the Center of Medicare and Medicaid Services (CMS) in diabetic patients.23 Star rating system is a program developed by CMS to assess health plan performance with respect to patient outcomes, patient satisfaction and healthcare access.24 Proportion of days covered (PDC) is a preferred method for measuring medication adherence using administrative claims data.25 However, as a single estimate, PDC cannot distinguish patients with varied medication adherence patterns.13,26 For instance, a patient with initial perfect adherence but subsequent discontinuation could have a similar PDC value as compared to another patient having an intermittent adherence pattern. Group-based trajectory modeling (GBTM) has recently been proposed and increasingly applied as an alternative method which overcomes aforementioned limitations with PDC.26 By mapping development of an outcome over time, GBTM accounts for patients' variable behavioral patterns.27 This method explores different trajectories for patients’ medication adherence patterns longitudinally, and identifies groups of patients sharing common characteristics within each trajectory.13,28,29 Recent studies evaluated adherence trajectories among statin users using GBTM and developed a tailored intervention to improve statin adherence.13,30
Therefore, this study aimed to develop group-based trajectory models to first identify patients diagnosed with comorbid HTN and DM who have similar medication filling patterns for ACEI/ARBs and second, examine demographic and clinical factors associated with each distinct trajectory. The identified trajectories and predictors will be used to tailor a motivational interviewing intervention in future studies.
Patients and Methods
Study Design
The study was a retrospective analysis of patients enrolled in a Texas Medicare Advantage (Cigna Medicare) plan from July 2016 to December 2018. The Medicare Advantage plan also called as the Medicare Part C is offered by Cigna, a private insurer in contract with Medicare. The plan offers Part A, Part B, usually Part D, and may also offer some additional benefits including dental and eye care.31 The index period was between July 1, 2017, to December 31, 2017, and the date of the last prescription of ACEI/ARB was defined as the index date. The pre-index period was between July 1, 2016, to July 1, 2017, while the follow-up period was between December 31, 2017, and December 31, 2018, starting from the index date. The study design is illustrated in Figure 1.
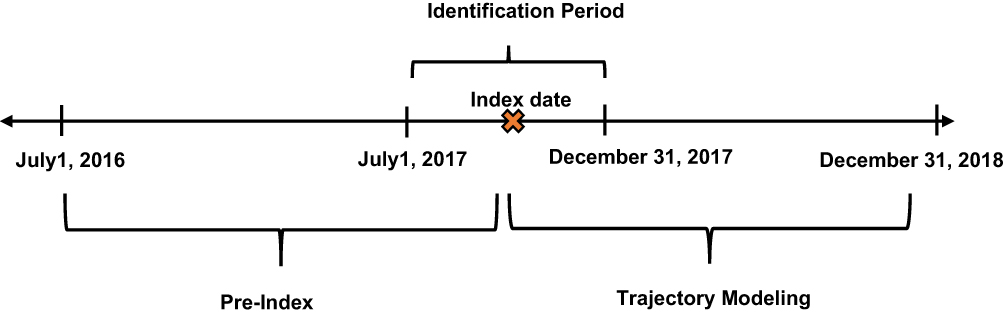 |
Figure 1 Study design. Index date was defined as the date of the last prescription of ACEI/ARB. |
The study was approved by the institutional review board at the University of Houston.
Study Data Files
The health plan contained several electronic data files available for analysis including membership, member summary, institutional claims, professional claims, medical claims and pharmacy files. Membership and member summary files include demographic, CMS risk scores and cost data for beneficiaries for each year. Institutional claims include information on all inpatient claims, which include diagnostic information in the form of International Classification of Diseases, Tenth Revision (ICD-10) codes, and procedure information in the form of Current Procedural Terminology (CPT) codes. Professional claims contain information on all outpatient encounters including diagnostic information in the form of ICD-10-CM codes and procedure information in the form of CPT codes. The medical file includes the hospitalization records, date of admission, date of discharge and length of stay. Pharmacy files contain Part D pharmacy data provided by the pharmacy benefit manager. The pharmacy records include patient and drug identifying information, fill dates, days of supply, quantity dispensed and dosing information for each prescription filled.
Study Population
Comorbid diabetes and hypertensive patients were identified using ICD-10 codes. Further, patients were included (1) if they had continuous enrollment over the study period July 2016 to December 2018 and (2) if a prescription of an ACEI/ARB was filled between July 1, 2017, to December 31, 2017. Patients were excluded (1) if they disenrolled from the plan (2) had a diagnosis of dementia in the one-year pre-index period (July 1, 2016, to July 1, 2017) identified through ICD-10 codes (3) had a ACEI/ARB contraindication such as angioedema, hyperkalemia, and renal artery stenosis in the one-year pre-index period identified through ICD-10 codes.
Adherence Measurement and Trajectory Modeling
Patient adherence was measured using PDC during the one-year follow-up period following the index date. PDC was calculated separately for each month during the follow-up period. While calculating PDC, any oversupply was accounted for by shifting the refill date forward after the prior refill had ended. A binary indicator for “full adherence”, defined as PDC≥ 0.8 (or ≥24 days covered, equivalently) vs non-adherence was created for each consecutive month.
The 12 binary indicators of full adherence were modeled as a longitudinal response in a logistic group-based trajectory model. In a trajectory model, several regression models are estimated simultaneously, including a multinomial logistic model that estimates probability of membership in each group, as well as logistic models that estimate the probability of being adherent over time as a smooth function of time.
A maximum likelihood estimation was used for the estimation of model parameters.26,27 The final trajectory model was estimated using 2–5 adherence groups further using the second-order polynomial function of time,32 assessing each through comparison of the Bayesian information criteria (BIC), clinical relevance, and a 5% minimum membership requirement.27 The model with the smallest BIC number was used to determine the best fit model. Further, the logged bayes factor (2ΔBIC) provided the strength of evidence against the simpler model (model with lesser groups).32
Statistical Analysis
Descriptive statistics were performed to summarize patient demographics and clinical characteristics. Further, patient characteristics were compared between trajectory groups from the final model. Group differences were assessed using chi-square for categorical variables and ANOVA for continuous variables.
A multinomial logistic regression was conducted to determine predictors of each identified adherence trajectory. The outcome variable was the trajectory groups with the “adherent” trajectory as reference. Predictors included in the model were sex, age (<65 years, 65–69 years, 70–74 years, ≥75 years), health plan (low-income subsidy versus no subsidy), prescriber specialty (general versus specialty), refill type (<90 days versus ≥90 days), comorbidities such as myocardial infarction, end-stage renal disease, depression, congestive heart failure, stroke, and coronary artery disease determined during the pre-index period, number of other medications on index date (≤2 versus >2), previous hospitalizations (no versus 1–2 versus <2) determined during the 6-month period before index date, prevalent users (prevalent versus new users) determined during the 6month period before index date, regimen complexity, and CMS risk score. The number of other medications was defined as the total number of other prescriptions (apart from ACEI/ARBs) that were filled on the index date. Regimen complexity was defined as the mean doses taken per day multiplied by total number of medications determined on the index date.33,34 The CMS risk score accounts for disease severity and medication burden. It is comprised of 189 disease classifications used in risk adjustment of clinical outcomes in Medicare populations.35,36 A correlation assessment was conducted among the independent variables.
All statistical analyses were performed using SAS version 9.4 (SAS Institute, Cary, NC) at a priori significance of 0.05. An add-on user-written procedure called “Proc Traj” was used for trajectory modeling.
Results
Study Cohort Demographics
There were 28,769 patients with a diagnosis of HTN and DM along with continuous enrollment for the study period. Of these, there were 24,139 patients with an ACEI/ARB prescription within the index period. After application of exclusion criteria, the final cohort comprised 22,774 patients (Figure 2). The patient demographics are presented in Table 1. The mean age of the patient cohort was 70.08 (±8.47), 54.93% patients were female, while 90.63% patients were prevalent users of ACEI/ARB therapy. The overall PDC was 0.78 (±0.25). Results of the correlation assessment showed no correlation among the major independent variables.
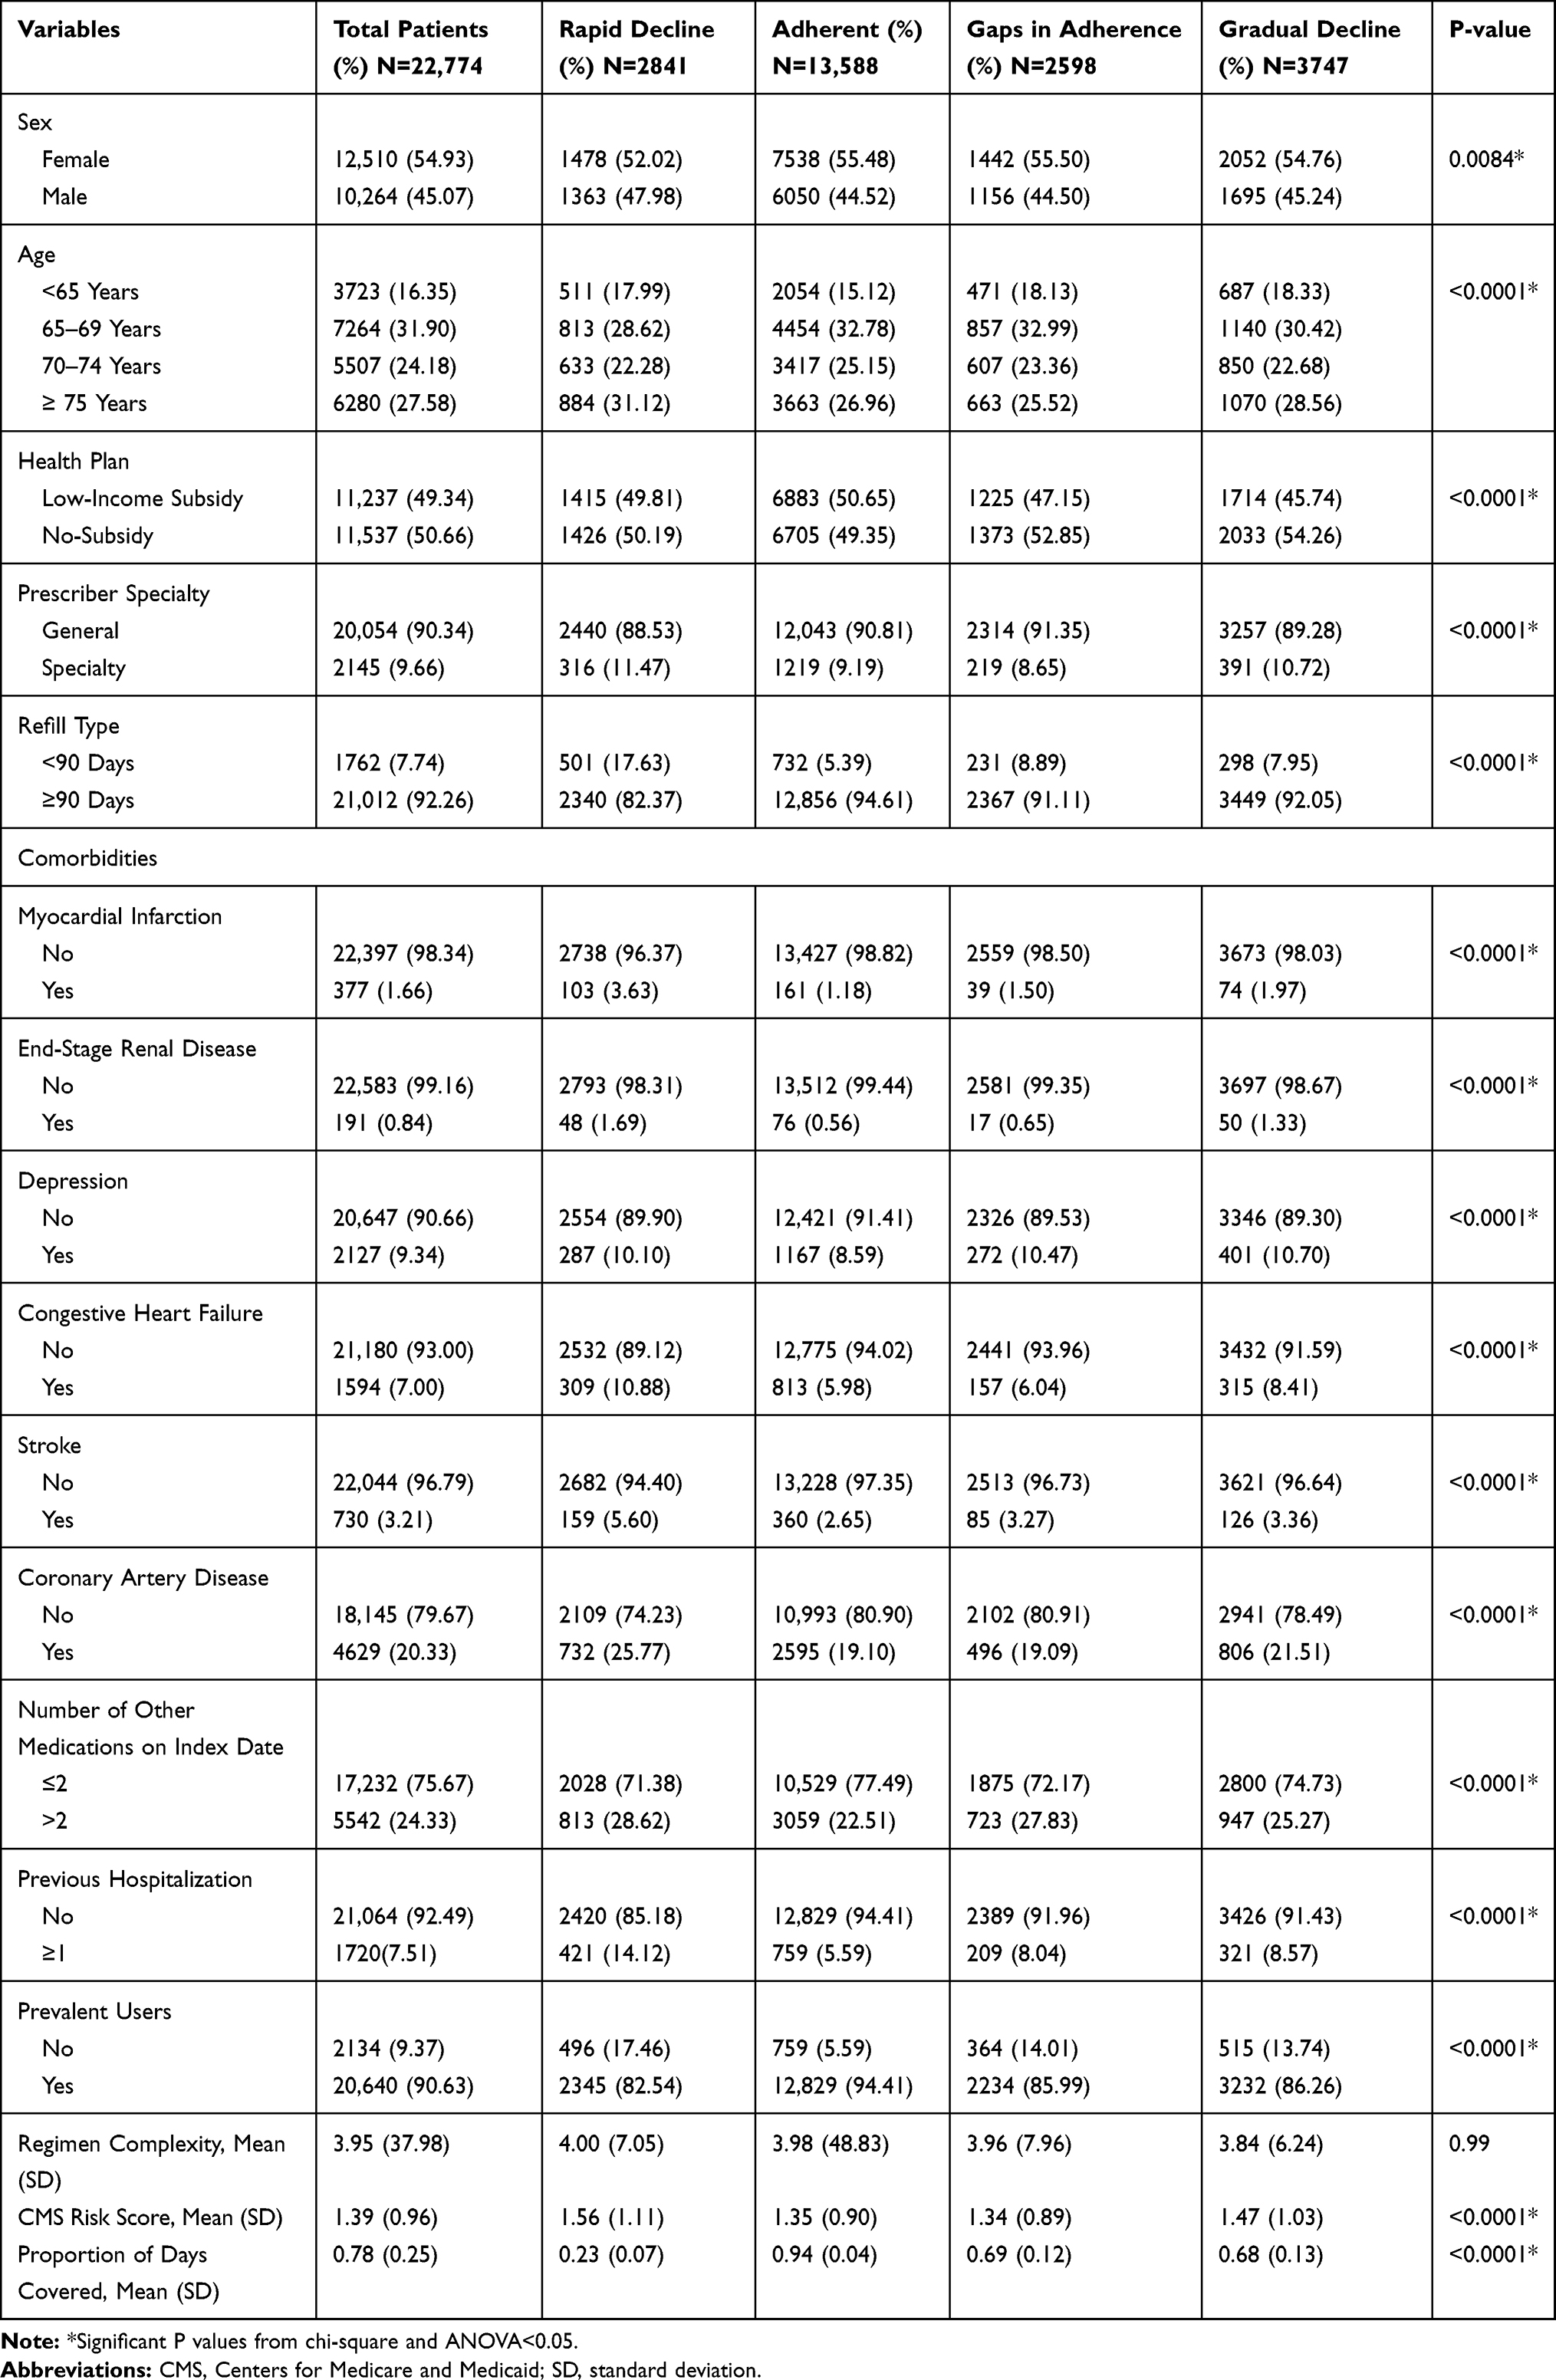 |
Table 1 Patient Demographics and Clinical Characteristics (N=22,774) |
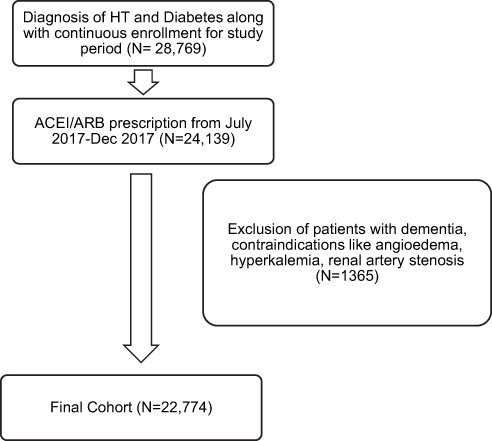 |
Figure 2 Cohort formation. |
Adherence Trajectories
Four trajectory models ranging between 2 to 5 trajectory patterns were identified as illustrated in Figure 3. Based on the Bayesian criteria, clinical relevance, and a 5% minimum membership requirement the 4-group trajectory model was selected. Details of the trajectory model with the Bayesian criteria are presented in Table 2.
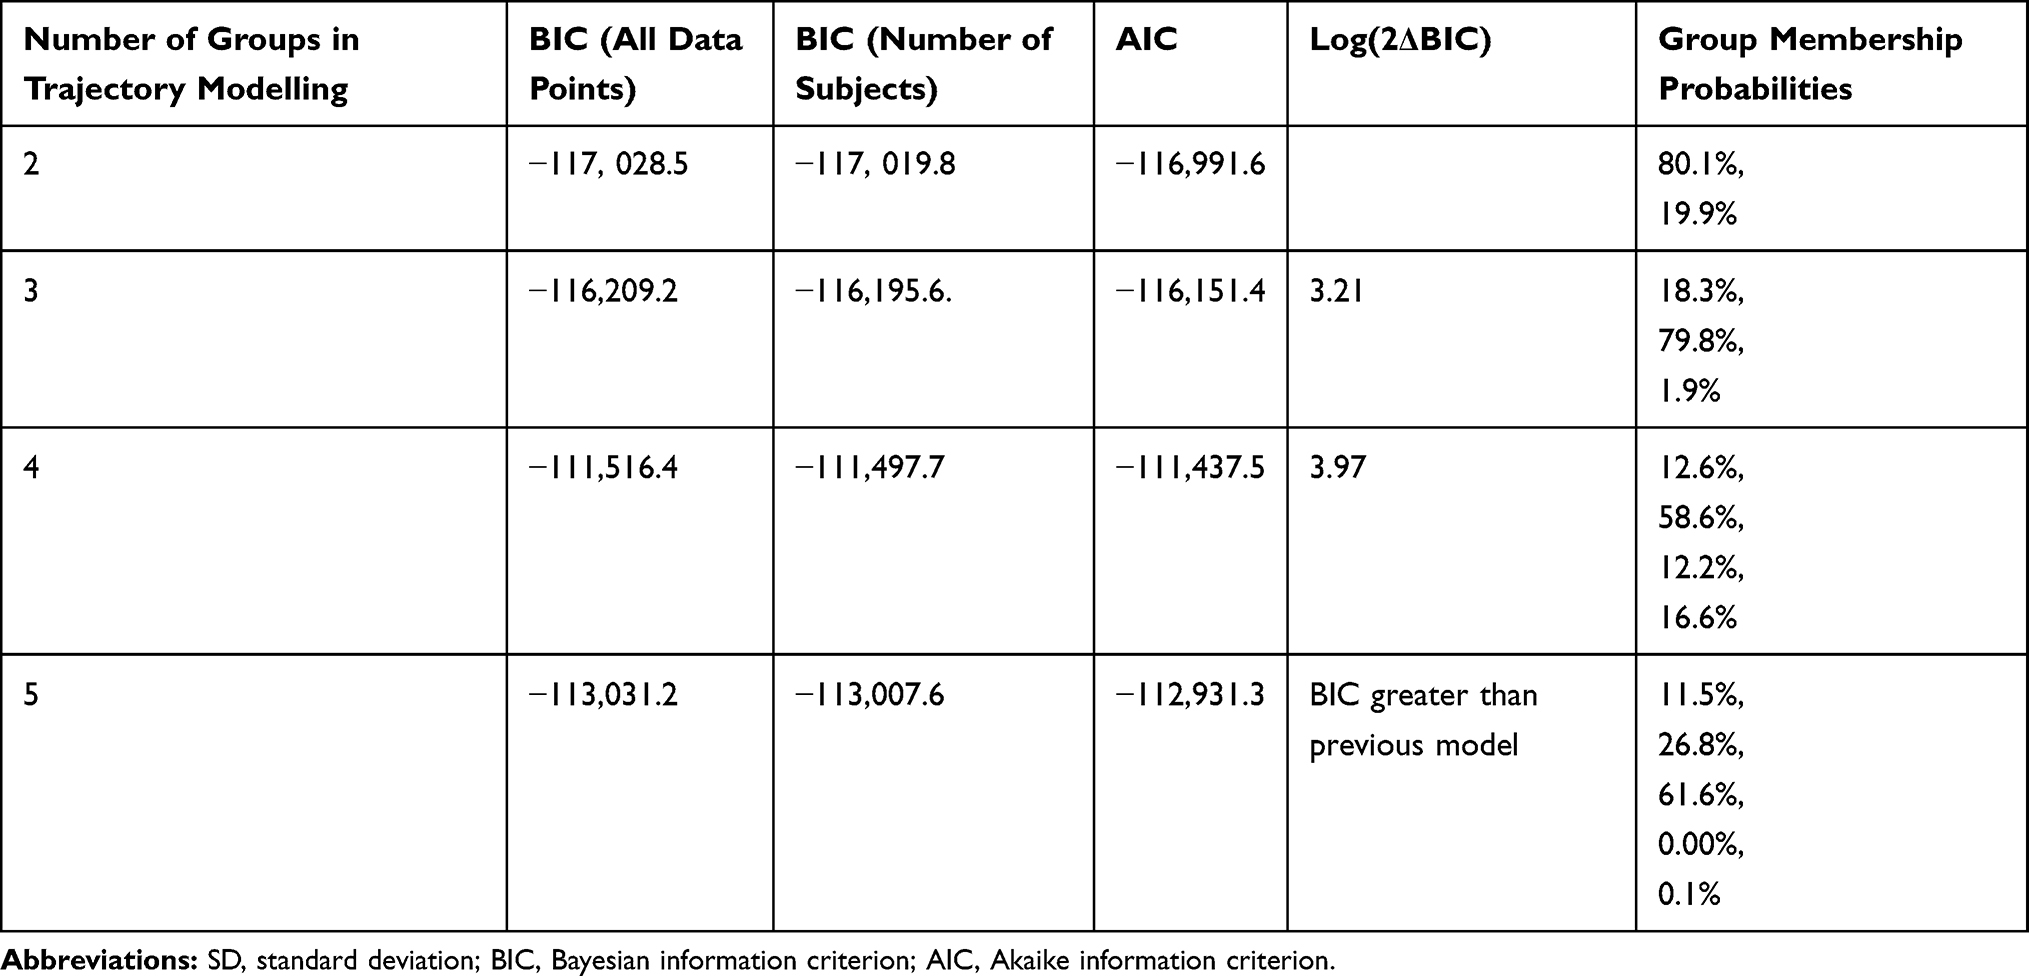 |
Table 2 Bayesian Criteria Calculations |
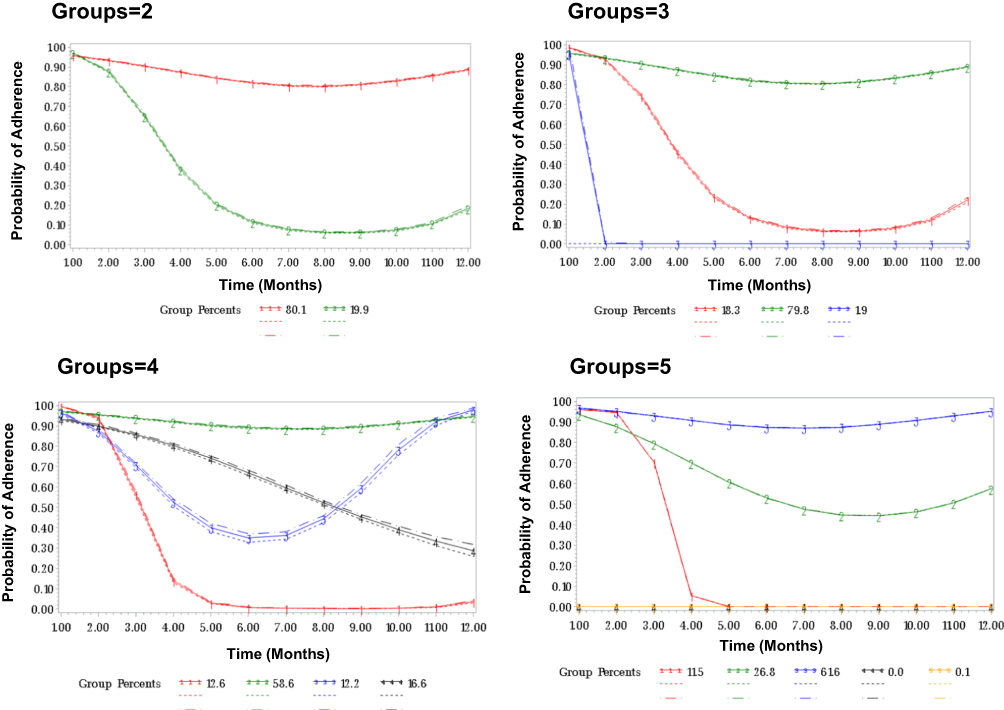 |
Figure 3 Results of trajectory modeling. Dotted lines represent confidence intervals. |
Four distinct adherence trajectories were identified in the selected model (Figure 4). These included (1) patients with rapid decline adherence (RD, 12.6%), (2) patients who were consistently adherent (58.5%), (3) patients with gaps in adherence (GA, 12.2%), and (4) patients with gradual decline (GD, 16.6%). The overall PDC of the adherent group, the RD group, the GA group, and the GD group were 0.94, 0.23, 0.69, and 0.68. There was a statistically significant difference among the mean PDCs within all 4 groups (P<0.0001) as exemplified in Table 1.
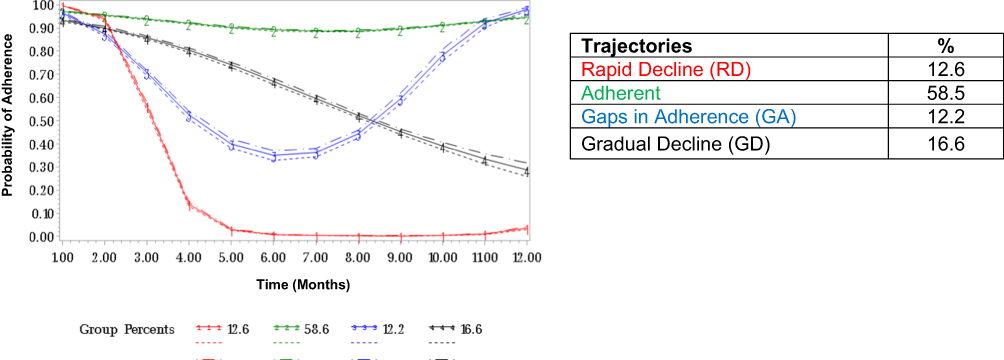 |
Figure 4 Final trajectory model. Dotted lines represent confidence intervals. |
Bivariate Analysis and Multinomial Regression
The demographic and clinical characteristics of patients in each trajectory are presented in Table 1. Except for regimen complexity, there was a significant difference in patient characteristics among the 4 trajectory groups. More patients in the adherent group had a refill equal to or more than 90 days as compared to patients in the RD, GD, and GA groups. Further, patients in the RD group had a higher CMS risk score and hospitalizations as compared to patients within the adherent, GD, and GA groups. Lastly, a larger proportion of patients in the adherent group were prevalent users as compared to patients within the lower adherent trajectories.
Results of the multinomial regression are presented in Table 3. Patients with a refill of more than/equal to 90 days had a lower likelihood of being in the lower adherent trajectories as compared to the adherent trajectory (RD, OR: 0.33, 95% CI: 0.29–0.38; GA, OR: 0.65, 95% CI: 0.55–0.77; GD, OR: 0.76, 95% CI: 0.66–0.88). Patients with more than 2 medications on the index date had a higher likelihood of being in the lower adherent trajectories as compared to the adherent trajectory (RD, OR: 1.27, 95% CI: 1.15–1.40; GA, OR: 1.24, 95% CI: 1.12–1.36; GD, OR: 1.10, 95% CI: 1.00–1.20). Further, patients with 1 or more hospitalizations as compared to patients with no hospitalizations were more likely to be in the lower adherent trajectories (RD, OR: 2.12, 95% CI: 1.84–2.45; GA, OR: 1.45, 95% CI: 1.22–1.72; GD, OR: 1.32, 95% CI: 1.14–1.53). Lastly, patients who were prevalent users of ACEI/ARB therapy had a lower likelihood of being in the lower adherent trajectories (RD, OR: 0.29, 95% CI: 0.25–0.33; GA, OR: 0.38, 95% CI: 0.33–0.44; GD, OR: 0.37, 95% CI: 0.33–0.42).
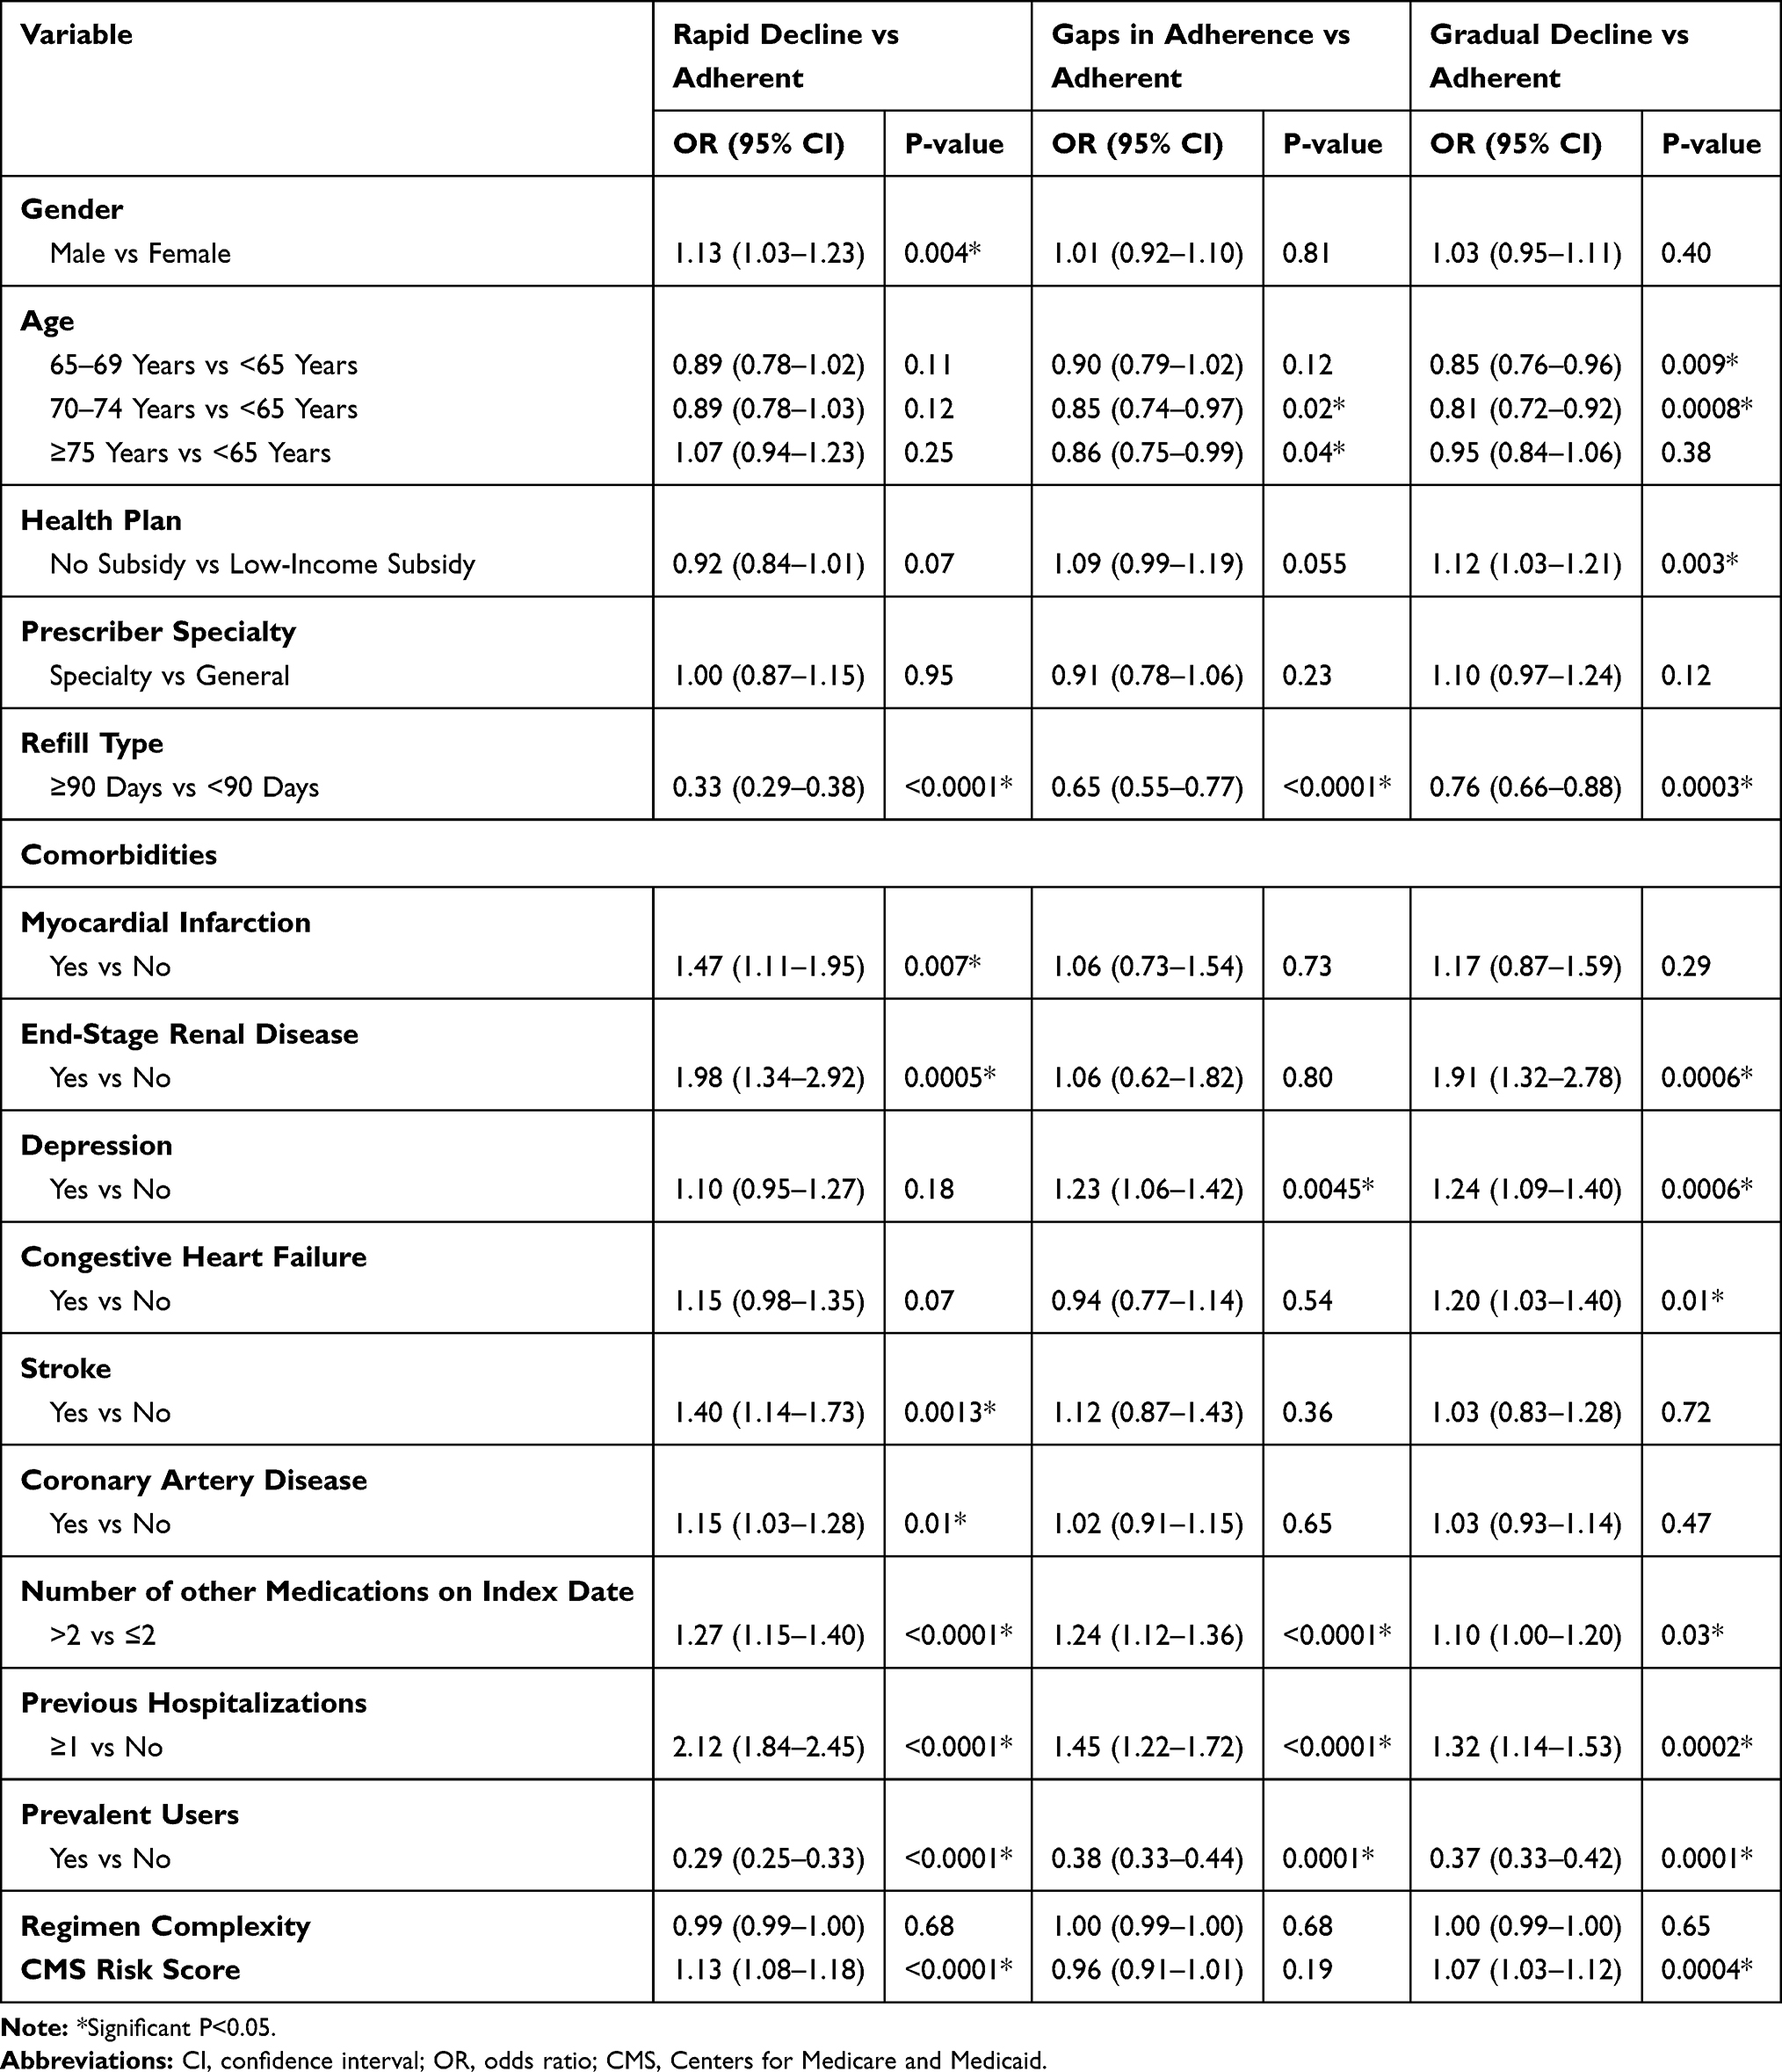 |
Table 3 Multinomial Logistic Regression to Assess Predictors Associated with Each Trajectory (N=22,774) |
Male patients had a higher likelihood of being in the RD trajectory as compared to the adherent trajectory (OR: 1.13, 95% CI: 1.03–1.23). Similarly, patients with myocardial infarction (OR: 1.47, 95% CI: 1.11–1.95), end-stage renal disease (OR: 1.98, 95% CI: 1.34–2.92), stroke (OR: 1.40, 95% CI: 1.14–1.73), and coronary artery disease (OR: 1.15, 95% CI: 1.03–1.28) had a higher likelihood of being in the RD trajectory. Lastly, patients with a higher CMS risk score were more likely to be in the RD trajectory as compared to the adherent trajectory (OR: 1.13, 95% CI: 1.08–1.18).
Adults older than 65 were less likely to be in the GA trajectory as compared to the adherent trajectory (70–74 years vs <65 years, OR: 0.85, 95% CI: 0.74–0.97; ≥75 years vs <65 years, OR: 0.86, 95% CI: 0.75–0.99). Further, patients with depression were more likely to be in the GA trajectory (OR: 1.23, 95% CI: 1.06–1.42).
Adults older than 65 were less likely to be in the GD trajectory as compared to the adherent trajectory (65–69 years vs <65 years, OR: 0.85, 95% CI: 0.76–0.96; 70–74 years vs <65 years, OR: 0.81, 95% CI: 0.72–0.92). Further, patients with no income subsidy were more likely to be in the GD trajectory (OR: 1.12, 95% CI: 1.03–1.21). Patients with end-stage renal disease (OR: 1.91, 95% CI: 1.32–2.78), depression (OR: 1.24, 95% CI: 1.09–1.40), and congestive heart failure (OR: 1.20, 95% CI: 1.03–1.40) were more likely to be in the GD trajectory. Lastly, patients with a higher CMS risk score were more likely to be in the GD trajectory (OR: 1.07, 95% CI: 1.03–1.12).
Discussion
The current study identified clinically distinct patterns of adherence to ACEI/ARBs among patients enrolled in a Texas Medicare Advantage plan. Four trajectory models ranging between 2 to 5 trajectory patterns were identified and the 4-group trajectory model (rapid decline, adherence, gaps in adherence, and gradual decline) best summated adherence trajectories and were eventually selected to identify predictors associated with each adherence trajectory. Moreover, several socio-demographic and clinical predictors associated with each distinct ACEI/ARB adherence trajectory were determined in this study.
Recent literature reveals a wide application of GBTM. It has been utilized to evaluate adherence to statins, anti-hypertensives, anti-diabetics, coronary artery disease, glaucoma, and heart failure medications.13,26,37–40 GBTM has demonstrated predictive validity with clinical outcomes among statin and oral hypoglycemic users.29,41 Further, GBTM has been utilized in designing adherence interventions customized to each distinct trajectory30 and to demonstrate effectiveness of a motivational-interviewing intervention by measuring pre- and post-intervention trajectories. Lastly, previous studies have identified modifiable factors associated with distinct trajectories among heart failure, glaucoma, coronary heart disease, and statin users.13,38–40
Prior research has demonstrated a three-group trajectory model to best describe adherence patterns among anti-hypertensive users. While the current study focused on ACEI/ARB users, prior studies included all anti-hypertensive medications.37,42 Evaluating adherence to ACEI/ARBs is a STAR measure used by the CMS to assess quality of care for healthcare plans and is associated with reimbursement.43 It is thus a priority for Medicare Advantage plans to improve adherence to ACEI/ARBs. Studies conducted by Librero et al and Juarez et al identified four distinct trajectories among ACEI/ARB users with prior CV events, namely patients consistently adherent, patients with gradual decline, patients with a gradual increase in adherence, and patients with persistently low/rapid decline in adherence. Further, proportion of patients that fell in each trajectory varied due to differences in patient populations.38,40
While the overall PDC of the patient cohort was 0.78, the overall PDC of the adherent trajectory, the GD, GA and RD trajectory were 0.94, 0.68, 0.69, and 0.23, respectively. In traditional studies, the intermediate trajectory patterns would have been rated similarly as a single estimate below 0.8. This illustrates the importance of measuring adherence over time rather than report a single estimate of PDC. The distinct patterns of adherence in the current study differentiate varied types of adherence behavior highlighting potential differences in adherence barriers among each group. Our results are similar to a prior study conducted among statin users which identified four distinct trajectories, namely perfect adherence, gaps in adherence, gradual decline, and rapid discontinuation. The average PDCs varied significantly among all four groups.13 Further, a qualitative assessment of patient-reported adherence barriers within each distinct trajectory among statin users conducted by our group revealed that the frequently reported barriers among each trajectory varied validating the need to capture the dynamic nature of medication adherence and to further customize interventions according to each trajectory group.
Prior studies evaluating various socio-demographic and clinical characteristics associated with each trajectory group have identified predictors such as sex, age, race, refill types, copayments, and the Charlson Comorbidity Index (CCI) to determine membership within each trajectory group.13,38–40 Modifiable predictors of adherence can be identified to further customize interventions to improve adherence. The current study identified several predictors significantly associated with each trajectory including sex, age, health plan, refill type, comorbidities, number of other medications on index date, previous hospitalizations, prevalent users, and CMS risk score.
The findings from the current study reveal that patients with more than 2 medications on the index date had a higher likelihood of being in all the lower adherent trajectories as compared to the adherent trajectory. The effect of medication burden on adherence is mixed with studies reporting varied findings.37 While patients on polypharmacy may have a higher need and better medication-taking habits, patients may also struggle to adhere to more medications.37 Patients with a refill of more than/equal to 90 days had a lower likelihood of being in all the lower adherent trajectories as compared to the adherent trajectory. These results were similar to a prior study where patients on statins with a 90-day refill had higher odds of being placed in the adherent trajectory as compared to the non-adherent trajectories.13 Increased day’s supply has been associated with improved medication adherence and persistence as well as improved cost-effectiveness due to reduced pharmacy costs.44 Patients who were prevalent users of ACEI/ARB therapy had a lower likelihood of being in all the lower adherent trajectories. Plausible explanations could include a lack of acceptance of the diagnosis during medication initiation, concerns of adverse effects and dependence on multiple medications, which might potentially impede adherence.45–47
Patients with one or more hospitalizations had a higher likelihood of being in all the lower adherent trajectories as compared to the adherent trajectory. While this finding is consistent with prior findings,48 it reflects the need to closely monitor adherence in elderly patients during hospitalizations to prevent further cardiovascular-related hospitalizations.
The association between patient comorbidities and adherence was in accordance with prior literature.42,46,49,50 Patients with comorbidities such as myocardial infarction, end-stage renal disease, stroke, coronary artery disease, depression, and congestive heart failure were associated with the lower adherent trajectories. Also, patients with a higher CMS risk score were associated with lower adherent trajectories. Patients with depression might experience cognitive decline which might negatively influence patient adherence.16,42,51 Plausible reasons for reduced adherence among patients with coexisting conditions include polypharmacy, complicated regimens, increased likelihood of adverse events, and prioritization of managing symptomatic diseases then asymptomatic ones.14,42,46,49,52,53
Adults over age 65 years were less likely to be in the GA and GD trajectory as compared to the adherent trajectory. The study findings indicate that patients below 65 had lower adherence. Although the association between age and adherence is mixed with some studies reporting an inverted U-shaped association,54 our results are consistent with studies that report that medication adherence is positively associated with increasing age.55–58 Potential reasons could include an increased disease burden with older adults as compared to younger adults which could lead to increased awareness of their overall health status, an increased perceived risk of hypertension, and a quicker acceptance of their diagnosis.54,55,59 Further, male patients had a higher likelihood of being in the RD trajectory as compared to the adherent trajectory. Prior research has demonstrated a higher adherence among females as compared to males on anti-hypertensive treatment60–62 which illustrates the need to explore sex-specific barriers to medication adherence among older adults on ACEI/ARBs. Lastly, patients with no income subsidy were more likely to be in the GD trajectory. Patients with no income subsidy may have higher copayments which might potentially hinder them from refilling leading to decreased adherence.
The current study findings are similar to a prior study conducted among statin users which identified predictors associated with its four distinct trajectories, namely perfect adherence, gaps in adherence, gradual decline, and rapid discontinuation. While sex and statin user type (prevalent versus new) were significantly associated with all trajectories, age, and refill type were significantly associated with the rapid decline trajectory. Similarly, income subsidy and language were significantly associated with the gradual decline trajectory while sex, age, language, and CCI were significantly associated with the GA trajectory.13 While most of the predictors identified in the current study were similar to the prior study, the current study also identified several other sociodemographic and clinical characteristics.
Limitations
The study did not have data on some socio-demographic variables like race or education which could potentially bias the results. While adherence calculated from pharmacy claims does not reflect if the patient actually took the medication, several studies have validated the use of claims data to measure medication adherence.16,63 Since diabetic and hypertensive patients were identified using ICD-10 codes only, there might be potential misclassification. However, all patients were prescribed with ACEI/ARBs minimizing the bias. Further, we did not have data to account for patients' adherence during hospitalization which might bias the results. There might be an overestimation of adherence among patients with a 90-day refill as they were assumed to have a continuous medication use. Lastly, the study was conducted among adults enrolled in a Medicare Advantage plan based in Texas thereby limiting the generalizability to similar demographic populations.
Conclusion
The study demonstrated the use of GBTM to identify patterns of adherence and selected the four-group trajectory model as the final model. The study findings revealed that just half of the patients were consistently adherent indicating a need for an adherence intervention among the non-adherent groups. Several patient characteristics were associated with each trajectory providing valuable information on how to identify patients likely to become non-adherent. Lastly, identifying barriers associated with each trajectory can guide the development of tailored interventions to enhance adherence to ACEI/ARBs.
Ethics
The data accessed comply with relevant data protection and privacy regulations.
Funding
This study was funded by the National Heart, Lung, and Blood Institute (NHBLI), 1R15HL135700-01A1.
Disclosure
Dr. Abughosh reports grants from NIH related to the work under consideration for publication and grants from NIH/NHLBI, during the conduct of the study. Dr. Abughosh also reports grants from Regeneron-Sanofi, BMS-Pfizer, Valeant Pharmaceuticals, Regeneron-Sanofi, and BMS-Pfizer, outside the submitted work. Dr. Barner reports grants from NIH and personal fees from University of Houston, during the conduct of the study. Dr. Fleming reports grants from National Heart, Lung, and Blood Institute and Regeneron during the conduct of the study. Dr. Fleming also reports grants from Sanofi, Regeneron-Sanofi, Texas Health and Human Services Commission, outside the submitted work. Dr. Gallardo is an employee of CareAllies, a subsidiary of Cigna, outside of the submitted work. The authors report no other potential conflicts of interest for this work.
References
1. Benjamin EJ, Muntner P, Bittencourt MS. Heart disease and stroke statistics-2019 update: a report from the American Heart Association. Circulation. 2019;139(10):e56–e528.
2. Fox S, Duggan M. Health Online 2013. Pew Internet and American Life Project. 2013. Available from: https://www.pewinternet.org/2013/01/15/health-online-2013/.
3. Patel SA, Winkel M, Ali MK, Narayan KV, Mehta NK. Cardiovascular mortality associated with 5 leading risk factors: national and state preventable fractions estimated from survey data. Ann Intern Med. 2015;163(4):245–253. doi:10.7326/M14-1753
4. Oh J-Y, Allison MA, Barrett-Connor E. Different impacts of hypertension and diabetes mellitus on all-cause and cardiovascular mortality in community-dwelling older adults: the Rancho Bernardo Study. J Hypertens. 2017;35(1):55–62. doi:10.1097/HJH.0000000000001145
5. Khangura DS, Salam MW, Brietzke SA, Sowers JR. Hypertension in diabetes. In: Endotext [Internet]. MDText. com, Inc.; 2018.
6. Emdin CA, Rahimi K, Neal B, Callender T, Perkovic V, Patel A. Blood pressure lowering in type 2 diabetes: a systematic review and meta-analysis. JAMA. 2015;313(6):603–615. doi:10.1001/jama.2014.18574
7. Deedwania PC. Diabetes and hypertension, the deadly duet: importance, therapeutic strategy, and selection of drug therapy. Cardiol Clin. 2005;23(2):139–152. doi:10.1016/j.ccl.2004.06.006
8. Lopez-Jaramillo P, Lopez-Lopez J, Lopez-Lopez C, Rodriguez-Alvarez MI. The goal of blood pressure in the hypertensive patient with diabetes is defined: now the challenge is go from recommendations to practice. Diabetol Metab Syndr. 2014;6(1):31. doi:10.1186/1758-5996-6-31
9. Investigators HOPES. Effects of ramipril on cardiovascular and microvascular outcomes in people with diabetes mellitus: results of the HOPE study and MICRO-HOPE substudy. The Lancet. 2000;355(9200):253–259.
10. Yusuf S, Sleight P, Pogue J, Bosch J, Davies R, Dagenais G. Effects of an angiotensin-converting-enzyme inhibitor, ramipril, on cardiovascular events in high-risk patients. N Engl J Med. 2000;342(3):145–153.
11. American Diabetes A. 10. Cardiovascular disease and risk management: standards of medical care in diabetes-2020. Diabetes Care. 2020;43(Suppl 1):S111–S134.
12. Sabaté E, Sabaté E. Adherence to Long-Term Therapies: Evidence for Action. World Health Organization; 2003.
13. Vadhariya A, Fleming ML, Johnson ML, et al. Group-based trajectory models to identify sociodemographic and clinical predictors of adherence patterns to statin therapy among older adults. Am Health Drug Benefits. 2019;12(4):202–211.
14. van der Wal MH, Jaarsma T. Adherence in heart failure in the elderly: problem and possible solutions. Int J Cardiol. 2008;125(2):203–208. doi:10.1016/j.ijcard.2007.10.011
15. Butler RJ, Davis TK, Johnson WG, Gardner HH. Effects of nonadherence with prescription drugs among older adults. Am J Manag Care. 2011;17(2):153–160.
16. MacLaughlin EJ, Raehl CL, Treadway AK, Sterling TL, Zoller DP, Bond CA. Assessing medication adherence in the elderly: which tools to use in clinical practice? Drugs Aging. 2005;22(3):231–255. doi:10.2165/00002512-200522030-00005
17. Hughes CM. Medication non-adherence in the elderly. Drugs Aging. 2004;21(12):793–811. doi:10.2165/00002512-200421120-00004
18. Yap AF, Thirumoorthy T, Kwan YH. Systematic review of the barriers affecting medication adherence in older adults. Geriatr Gerontol Int. 2016;16(10):1093–1101. doi:10.1111/ggi.12616
19. van Eijken M, Tsang S, Wensing M, de Smet PA, Grol RP. Interventions to improve medication compliance in older patients living in the community. Drugs Aging. 2003;20(3):229–240. doi:10.2165/00002512-200320030-00006
20. McLean DL, Simpson SH, McAlister FA, Tsuyuki RT. Treatment and blood pressure control in 47,964 people with diabetes and hypertension: a systematic review of observational studies. Can J Cardiol. 2006;22(10):855–860. doi:10.1016/S0828-282X(06)70304-X
21. Kettani F-Z, Dragomir A, Côté R, et al. Impact of a better adherence to antihypertensive agents on cerebrovascular disease for primary prevention. Stroke. 2009;40(1):213–220. doi:10.1161/STROKEAHA.108.522193
22. Degli Esposti L, Saragoni S, Benemei S, et al. Adherence to antihypertensive medications and health outcomes among newly treated hypertensive patients. Clin Econ Outcomes Res. 2011;3:47. doi:10.2147/CEOR.S15619
23. Nason GJ, Baker JF, Byrne DP, Noel J, Moore D, Kiely PJ. Scoliosis-specific information on the internet: has the “information highway” led to better information provision? Spine (Phila Pa 1976). 2012;37(21):E1364–1369.
24. Academy of Managed Care P, American Pharmacists A. Medicare star ratings: stakeholder proceedings on community pharmacy and managed care partnerships in quality. J Am Pharm Assoc (2003). 2014;54(3):228–240. doi:10.1331/JAPhA.2014.13180
25. Nau DP. Proportion of Days Covered (PDC) as a Preferred Method of Measuring Medication Adherence. Springfield, VA: Pharmacy Quality Alliance; 2012.
26. Franklin JM, Shrank WH, Pakes J, et al. Group-based trajectory models: a new approach to classifying and predicting long-term medication adherence. Med Care. 2013;51(9):789–796. doi:10.1097/MLR.0b013e3182984c1f
27. Nagin DS, Odgers CL. Group-based trajectory modeling in clinical research. Annu Rev Clin Psychol. 2010;6:109–138. doi:10.1146/annurev.clinpsy.121208.131413
28. Franklin JM, Krumme AA, Shrank WH, Matlin OS, Brennan TA, Choudhry NK. Predicting adherence trajectory using initial patterns of medication filling. Am J Manag Care. 2015;21(9):e537–544.
29. Lo-Ciganic WH, Donohue JM, Jones BL, et al. Trajectories of diabetes medication adherence and hospitalization risk: a retrospective cohort study in a large state medicaid program. J Gen Intern Med. 2016;31(9):1052–1060. doi:10.1007/s11606-016-3747-6
30. Abughosh SM, Vadhariya A, Johnson ML, et al. Enhancing statin adherence using a motivational interviewing intervention and past adherence trajectories in patients with suboptimal adherence. J Manage Care Spec Pharm. 2019;25(10):1053–1062. doi:10.18553/jmcp.2019.25.10.1053
31. Available from: https://wwwcignacom/medicare/medicare-advantage/medicare-advantage-plans-faq.
32. Victoria Arrandale MK, MacNab Y, Kennedy SM. How to use SAS® Proc Traj and SAS® Proc Glimmix in Respiratory Epidemiology.
33. Odegard PS, Carpinito G, Christensen DB. Medication adherence program: adherence challenges and interventions in type 2 diabetes. J Am Pharm Assoc. 2013;53(3):267–272. doi:10.1331/JAPhA.2013.12065
34. Odegard PS, Christensen DB. MAP study: RCT of a medication adherence program for patients with type 2 diabetes. J Am Pharm Assoc (2003). 2012;52(6):753–762. doi:10.1331/JAPhA.2012.11001
35. Parikh NM, Morgan RO, Kunik ME, et al. Risk factors for dementia in patients over 65 with diabetes. Int J Geriatr Psychiatry. 2011;26(7):749–757. doi:10.1002/gps.2604
36. Johnson ML, Parikh N, Kunik ME, et al. Antihypertensive drug use and the risk of dementia in patients with diabetes mellitus. Alzheimers Dement. 2012;8(5):437–444. doi:10.1016/j.jalz.2011.05.2414
37. Dillon P, Stewart D, Smith SM, Gallagher P, Cousins G. Group-based trajectory models: assessing adherence to antihypertensive medication in older adults in a community pharmacy setting. Clin Pharmacol Ther. 2018;103(6):1052–1060. doi:10.1002/cpt.865
38. Librero J, Sanfelix-Gimeno G, Peiro S. Medication adherence patterns after hospitalization for coronary heart disease. A population-based study using electronic records and group-based trajectory models. PLoS One. 2016;11(8):e0161381. doi:10.1371/journal.pone.0161381
39. Newman-Casey PA, Blachley T, Lee PP, Heisler M, Farris KB, Stein JD. Patterns of glaucoma medication adherence over four years of follow-up. Ophthalmology. 2015;122(10):2010–2021. doi:10.1016/j.ophtha.2015.06.039
40. Juarez DT, Williams AE, Chen C, et al. Factors affecting medication adherence trajectories for patients with heart failure. Am J Manag Care. 2015;21(3):e197–205.
41. Franklin JM, Krumme AA, Tong AY, et al. Association between trajectories of statin adherence and subsequent cardiovascular events. Pharmacoepidemiol Drug Saf. 2015;24(10):1105–1113. doi:10.1002/pds.3787
42. Wang X, Chen H, Essien E, et al. Medication adherence to antihypertensive triple-combination therapy among patients enrolled in a medicare advantage plan. J Manag Care Spec Pharm. 2019;25(6):678–686.
43. Medicare Cf, Services M. Medicare 2018 Part C & D Star Ratings Technical Notes. 2017:2017
44. Taitel M, Fensterheim L, Kirkham H, Sekula R, Duncan I. Medication days’ supply, adherence, wastage, and cost among chronic patients in Medicaid. Medicare Medicaid Res Rev. 2012;2:3. doi:10.5600/mmrr.002.03.A04
45. Burnier M, Egan BM. Adherence in hypertension. Circ Res. 2019;124(7):1124–1140. doi:10.1161/CIRCRESAHA.118.313220
46. Hedna K, Hakkarainen KM, Gyllensten H, et al. Adherence to antihypertensive therapy and elevated blood pressure: should we consider the use of multiple medications? PLoS One. 2015;10(9):e0137451. doi:10.1371/journal.pone.0137451
47. Marshall IJ, Wolfe CD, McKevitt C. Lay perspectives on hypertension and drug adherence: systematic review of qualitative research. BMJ. 2012;345:e3953. doi:10.1136/bmj.e3953
48. Marcum ZA, Zheng Y, Perera S, et al. Prevalence and correlates of self-reported medication non-adherence among older adults with coronary heart disease, diabetes mellitus, and/or hypertension. Res Social Adm Pharm. 2013;9(6):817–827. doi:10.1016/j.sapharm.2012.12.002
49. Asgedom SW, Atey TM, Desse TA. Antihypertensive medication adherence and associated factors among adult hypertensive patients at Jimma University Specialized Hospital, southwest Ethiopia. BMC Res Notes. 2018;11(1):27. doi:10.1186/s13104-018-3139-6
50. Saadat Z, Nikdoust F, Aerab-Sheibani H, et al. Adherence to antihypertensives in patients with comorbid condition. Nephrourol Mon. 2015;7(4):e29863. doi:10.5812/numonthly.29863
51. Cukor D, Rosenthal DS, Jindal RM, Brown CD, Kimmel PL. Depression is an important contributor to low medication adherence in hemodialyzed patients and transplant recipients. Kidney Int. 2009;75(11):1223–1229. doi:10.1038/ki.2009.51
52. Marcum ZA, Gellad WF. Medication adherence to multidrug regimens. Clin Geriatr Med. 2012;28(2):287–300. doi:10.1016/j.cger.2012.01.008
53. Lagu T, Weiner MG, Eachus S, Tang SS, Schwartz JS, Turner BJ. Effect of patient comorbidities on filling of antihypertensive prescriptions. Am J Manag Care. 2009;15(1):24–30.
54. Kim SJ, Kwon OD, Han EB, et al. Impact of number of medications and age on adherence to antihypertensive medications: a nationwide population-based study. Medicine (Baltimore). 2019;98(49):e17825. doi:10.1097/MD.0000000000017825
55. Cho SJ, Kim J. Factors associated with nonadherence to antihypertensive medication. Nurs Health Sci. 2014;16(4):461–467.
56. Hashmi SK, Afridi MB, Abbas K, et al. Factors associated with adherence to anti-hypertensive treatment in Pakistan. PLoS One. 2007;2(3):e280. doi:10.1371/journal.pone.0000280
57. Marentette MA, Gerth WC, Billings DK, Zarnke KB. Antihypertensive persistence and drug class. Can J Cardiol. 2002;18(6):649–656.
58. Shaya FT, Du D, Gbarayor CM, Frech-Tamas F, Lau H, Weir MR. Predictors of compliance with antihypertensive therapy in a high-risk medicaid population. J Natl Med Assoc. 2009;101(1):34–39. doi:10.1016/S0027-9684(15)30808-7
59. Lo SH, Chau JP, Woo J, Thompson DR, Choi KC. Adherence to antihypertensive medication in older adults with hypertension. J Cardiovasc Nurs. 2016;31(4):296–303. doi:10.1097/JCN.0000000000000251
60. Pan J, Wu L, Wang H, et al. Determinants of hypertension treatment adherence among a Chinese population using the therapeutic adherence scale for hypertensive patients. Medicine (Baltimore). 2019;98(27):e16116. doi:10.1097/MD.0000000000016116
61. Pan J, Lei T, Hu B, Li Q. Post-discharge evaluation of medication adherence and knowledge of hypertension among hypertensive stroke patients in northwestern China. Patient Prefer Adherence. 2017;11:1915–1922.
62. Yassine M, Al-Hajje A, Awada S, et al. Evaluation of medication adherence in Lebanese hypertensive patients. J Epidemiol Glob Health. 2016;6(3):157–167. doi:10.1016/j.jegh.2015.07.002
63. Osterberg L, Blaschke T. Adherence to medication. N Engl J Med. 2005;353(5):487–497. doi:10.1056/NEJMra050100
 © 2020 The Author(s). This work is published and licensed by Dove Medical Press Limited. The full terms of this license are available at https://www.dovepress.com/terms.php and incorporate the Creative Commons Attribution - Non Commercial (unported, v3.0) License.
By accessing the work you hereby accept the Terms. Non-commercial uses of the work are permitted without any further permission from Dove Medical Press Limited, provided the work is properly attributed. For permission for commercial use of this work, please see paragraphs 4.2 and 5 of our Terms.
© 2020 The Author(s). This work is published and licensed by Dove Medical Press Limited. The full terms of this license are available at https://www.dovepress.com/terms.php and incorporate the Creative Commons Attribution - Non Commercial (unported, v3.0) License.
By accessing the work you hereby accept the Terms. Non-commercial uses of the work are permitted without any further permission from Dove Medical Press Limited, provided the work is properly attributed. For permission for commercial use of this work, please see paragraphs 4.2 and 5 of our Terms.