Back to Journals » ClinicoEconomics and Outcomes Research » Volume 6
Group-based trajectory modeling to assess adherence to biologics among patients with psoriasis
Authors Li Y, Zhou H, Cai B, Kahler KH, Tian H, Gabriel S, Arcona S
Received 17 December 2013
Accepted for publication 29 January 2014
Published 10 April 2014 Volume 2014:6 Pages 197—208
DOI https://doi.org/10.2147/CEOR.S59339
Checked for plagiarism Yes
Review by Single anonymous peer review
Peer reviewer comments 4
Yunfeng Li,1 Huanxue Zhou,2 Beilei Cai,1 Kristijan H Kahler,1 Haijun Tian,1 Susan Gabriel,1 Steve Arcona1
1Novartis Pharmaceuticals Corporation, East Hanover, NJ, USA; 2KMK Consulting Inc., Florham Park, NJ, USA
Background: Proportion of days covered (PDC), a commonly used adherence metric, does not provide information about the longitudinal course of adherence to treatment over time. Group-based trajectory model (GBTM) is an alternative method that overcomes this limitation.
Methods: The statistical principles of GBTM and PDC were applied to assess adherence during a 12-month follow-up in psoriasis patients starting treatment with a biologic. The optimal GBTM model was determined on the basis of the balance between each model's Bayesian information criterion and the percentage of patients in the smallest group in each model. Variables potentially predictive of adherence were evaluated.
Results: In all, 3,249 patients were included in the analysis. Four GBTM adherence groups were suggested by the optimal model, and patients were categorized as demonstrating continuously high adherence, high-then-low adherence, moderate-then-low adherence, or consistently moderate adherence during follow-up. For comparison, four PDC groups were constructed: PDC Group 4 (PDC ≥75%), PDC Group 3 (25%≤ PDC <50%), PDC Group 2 (PDC <25%), and PDC Group 1 (50%≤ PDC <75%). Our findings suggest that the majority of patients (97.9%) from PDC Group 2 demonstrated moderate-then-low adherence, whereas 96.4% of patients from PDC Group 4 showed continuously high adherence. The remaining PDC-based categorizations did not capture patients with uniform adherence behavior based on GBTM. In PDC Group 3, 25.3%, 17.2%, and 57.5% of patients exhibited GBTM-defined consistently moderate adherence, moderate-then-low adherence, or high-then-low adherence, respectively. In PDC Group 1, 70.8%, 23.6%, and 5.7% of patients had consistently moderate adherence, high-then-low adherence, and continuously high adherence, respectively. Additional analyses suggested GBTM-based categorization was best predicted by patient age, sex, certain comorbidities, and particular drug use.
Conclusion: GBTM is a more appropriate way to model dynamic behaviors and offers researchers an alternative to more traditional drug adherence measurements.
Keywords: classification, proportion days of covered (PDC), patterns, dynamic, behavior, grouping
Introduction
Management of chronic disease often involves long-term and potentially life-long pharmacologic interventions. In a variety of disease states, adherence to treatment, defined as taking medication at the prescribed dose and schedule, is important because poor adherence results in suboptimal outcomes including disease progression, the development of resistance, greater disability, acute and more intense relapses, and premature death.1–4 No standard methodology for assessing adherence to prescribed medication exists, and measuring adherence can be challenging.5,6 Direct methods, which include blood and urine drug assays, drug markers, and direct observation of the patient taking the medication, are laborious, costly, and time intensive, and are generally reserved for clinical trials.5,6 In real-world settings, the most common measures of adherence include patient self-report, prescription claims databases, electronic monitoring, and pill counts, each with their own advantages and limitations.5 The use of administrative claims databases offers the advantage of utilizing large sample sizes to assess adherence.7
One common measure of adherence, particularly when working with data from large administrative claims databases, is the proportion of days covered (PDC). PDC is defined as the number of days covered by medication in the follow-up period divided by the total number of days during follow-up, multiplied by 100 to yield a percentage from 0%–100%.8–10 Although useful in drawing simple conclusions, PDC is limited in that it does not distinguish between different patterns of adherence. For instance, some patients may initially be adherent, but then become less adherent as time progresses. Some patients may be adherent in an “off-and-on” pattern, while others may start off with poor adherence and then become more adherent. Thus, it is likely that a similar PDC could be calculated for patients who demonstrate very different adherence patterns. For example, a PDC of 50% could be calculated for a patient who takes their medication for 10 days on and 10 days off continuously during a given year; however, this same PDC would be generated for a patient who takes their medication for 6 months straight, and then not at all for the remainder of the year.
Group-based trajectory model (GBTM) has been proposed as a way to overcome this limitation.11,12 GBTM is used to describe different developmental trajectories of an outcome over time, and it identifies clusters of individuals who, on the basis of some prespecified biological, behavioral, or physical outcome measure, follow similar longitudinal patterns.11 This methodology has been extensively applied in psychology, medicine, and criminology,11,12 but few studies have investigated adherence using GBTM.13,14 In one study, adherence to airway clearance therapy in patients with cystic fibrosis was analyzed by GBTM.13 This secondary data analysis of a randomized clinical trial identified three adherence trajectories in relation to airway clearance therapy, with those patients demonstrating initial “high” or “low” adherence remaining consistent across the follow-up, and those demonstrating “medium” adherence showing the most variability in adherence to therapy. In a second study, GBTM was used to assess adherence to statin therapy from a prescription claims database over a 15-month time period.14 A four-group trajectory model was found to forecast long-term adherence more effectively than PDC, although the accuracy of identifying predictors of adherence was similar for both methods.
In all disease states, it is important to understand adherence and the factors that influence it, as the effectiveness of any drug is dependent on patient adherence, and poor adherence may result in poor clinical and economic outcomes.4,15,16 For example, in an analysis of adherence to statin therapy in newly treated patients tracked in an administrative database, compared with a PDC >80%, a PDC of 21%–40% was associated with a greater risk of all-cause death, acute myocardial infarction, and stroke.16 Given the importance of adherence, the current study applies GBTM to assess biologic use in patients with psoriasis. Specifically, the primary objective of this study compares GBTM and PDC by grouping patients on the basis of drug utilization for 12 months after starting treatment with a biologic and presents researchers with a more accurate method to examine drug adherence. A second objective was to identify the clinical and demographic factors associated with different GBTM-based adherence groups.
Materials and methods
Data sources
This retrospective cohort study used data from the Truven Health MarketScan® Commercial Claims and Encounter and the Medicare Supplemental and Coordination of Benefits databases. These databases track information from several million people who are enrolled in commercial health insurance plans sponsored by more than 300 employers in the United States. Available data include monthly enrollment figures, hospitalization and outpatient medical claims, outpatient prescription drug claims, and eligibility information.17 These databases allow medical claims to be linked to outpatient prescription drug claims and person-level enrollment data through the use of unique patient identifiers, and they provide detailed cost (payment) and health care utilization information for health care services performed in both inpatient and outpatient settings, in addition to standard demographic variables (ie, age, sex, employment status, geographic location). All study data were accessed using techniques compliant with the Health Insurance Portability and Accountability Act of 1996, and no identifiable protected health information was used in the conduct of this study; therefore, informed consent or institutional review board approval was not required.17
Patient cohort
Patients from the selected databases were included in these analyses if they had at least one confirmed diagnosis of psoriasis, identified by the International Classification of Diseases, Ninth Revision, Clinical Modification code of 696.1x,18 and had been prescribed at least one biologic between January 1, 2007 and June 30, 2011. Eligible biologics included etanercept (Immunex Corporation, Thousand Oaks, CA, USA), adalimumab (AbbVie Inc., North Chicago, IL, USA), ustekinumab (Janssen Biotech, Inc., Horsham, PA, USA), and infliximab (Janssen Biotech, Inc.). Patients were excluded if they had a diagnosis of psoriatic arthritis, rheumatoid arthritis, ankylosing spondylitis, or Crohn’s disease, because the presence of these diseases might influence medication adherence patterns. For each patient, the index date was the date of the first use of the biologic agent between January 1, 2008 and June 30, 2010. At baseline, eligible patients were required to have had at least 12 months of database-documented continuous medical and pharmacy claims coverage prior to the index date to help ensure there was no biological use in the preceding 12 months (ie, that selected patients were “new to treatment”). In addition, eligible subjects had to have had at least 12 months of continuous medical and pharmacy coverage after the index date (ie, during follow-up), in order to allow complete observation of adherence during the follow-up period. Patients were excluded from these analyses if they were younger than 18 years old, received any biologic billed with a J-code (these biologics did not have day of supply information in the database), used any biologic (etanercept, adalimumab, ustekinumab, infliximab) in the previous 12 months prior to the index date, or had missing data related to age, sex, region, or health plan type.
Measuring biologic use
Prescribing information (PI) for the use of biologics for psoriasis mandates different treatment intervals (ie, a different length of time between each injection) for each brand of biologic: for example, patients who use etanercept are prescribed an injection once a week, whereas patients treated with ustekinumab are prescribed one injection every 3 months during the maintenance period. Because of prescribing differences like this, patients in these analyses were administered different biologics on different treatment schedules, requiring standardization of these divergently timed injections. Thus, on the basis of recommended timing for each drug’s injections in their PIs, each injection of a particular biologic was coded as either a 1-week or a multiple-week event, and each single injection was considered to “cover” a period of time determined by when the next injection was recommended. Specifically, if the PI required weekly treatment for a given biologic, a patient was considered to be “on” the treatment for one week following each given injection of that biologic; if the PI required one injection every 3 months, the patient was considered to be “on” that biologic for the next 13 weeks (91 days) for each given injection of that biologic.
The 12-month follow-up period for each patient was converted into 52 weekly observation intervals starting from the index date, and the status of biologic use in each interval was determined on the basis of observed biologic use and the strategy noted above. Because the actual injection of a biologic might be provided on any given day in each observation interval, the patient was considered to be “on” the treatment in each interval if 4 days of the 7 days in that interval were covered by the patient’s biologic. Using this schema, all 52 treatment intervals were assessed and coded, with 1 indicating the use of the prescribed biologic during that interval, and 0 denoting no use during that interval.
Adherence group classification based on GBTM
In GBTM, individuals who experience or follow a similar longitudinal progression of some outcome or behavior are identified and “clustered” together.19 The complete methodology has been described previously.11,12,19,20 Briefly, GBTM assumes that there are unobserved subpopulations or distinct groups based on their developmental trajectory over time. The probability of belonging to one of these groups can be estimated for each individual, and the unknown distribution of trajectories across subpopulations can be approximated. Statistically, GBTM involves the simultaneous estimation of several regression models, combining the information from all models to determine the maximum likelihood of belonging to a potential trajectory group for the same person.11 In our current model, a binary trajectory model was repeated with group options from 2 through 6 using the built-in function of the “Proc Traj” add-on package (http://www.andrew.cmu.edu/user/bjones/index.htm) for SAS-based analyses (version 9.3; SAS Institute Inc., Cary, NC, USA). Group options represented the different potential trajectory paths. The optimal group model was selected by the balance between the Bayesian information criterion (BIC) value,21–23 and the proportion of estimated trajectory groups (ie, at least 0.05, meaning that the smallest group includes at least 5% of patients).11 In this study, adherence to biologic treatment over a 12-month period was evaluated using GBTM. Each patient was assessed and assigned to one and only one trajectory group.
Comparison of PDC measures with GBTM measures in patient grouping
In most adherence studies, PDC is a static measure of patient adherence during follow-up.8,9,24 In application, researchers divide a cohort of patients into groups on the basis of their PDC. For example, patients may be categorized on the basis of quartile divisions of PDC. In order to understand the similarities or differences in patient classification based upon these two methods, a number of groups comparable to the number of groups generated by GBTM were generated from the same patient data based on the PDC method. These groupings were used to 1) compare patient distributions across the two different methodologies (GBTM and PDC) and 2) assess “within group” variance for each PDC-based or GBTM-based group. This “within group” variance was a gauge of homogeneity within each group, with smaller variance scores indicating a more homogeneous patient group (refer to Figure S1 for the detailed formula). The “within-group” variance for corresponding groups from the PDC-based and GBTM-based analyses was directly compared.
Variables associated with likelihood of different trajectory groups
Using trajectory classifications from the optimal GBTM model, patient demographics, clinical characteristics, and treatment characteristics were summarized for the patients in each GBTM group and subjected to further analyses in order to profile patients in each GBTM group. In addition, a multinomial logistic regression model was used to understand the relationship between these characteristics and the likelihood of being a member of different trajectory groups. The dependent variable was defined as each patient’s treatment group as revealed by GBTM, while independent variables included patient age; sex; insurance plan type; region; initial biologic used in index date; oral, topical, or phototherapy use; and nonpsoriasis-related and psoriasis-related comorbidities during the 12-month follow-up period (as listed in Table S1).
Results
Final patient sample
A total of 21,168 patients with psoriasis and prescribed at least one biologic were identified in the selected databases during the defined study period. After applying the exclusion criteria, a total of 3,366 patients remained eligible for the study. However, relatively few of these patients were prescribed either infliximab or ustekinumab, and ultimately, patients initiating biologic treatment with either of these two therapies were excluded from the analyses. As a result, final analyses include 3,249 patients; all of whom received either etanercept or adalimumab.
Group-based trajectory modeling of adherence
The GBTM was performed with models ranging from two to six groups, with time as the only covariate, in order to determine an optimal model (Table 1). Although lower BIC values, which are an indicator of a better model fit, were obtained with increasing number of groups, the size of the smallest group in all models of five or more trajectory groups was deemed insufficient for further analysis. For example, compared with Model 4 (a five-group model), Model 3 (a four-group model) demonstrated a relatively negligible BIC difference of 2%, but 15.7% of patients were uniquely classified in the smallest subgroup in the four-group model, whereas in Model 4 (the five-group model) only 5.8% of patients were classified into the smallest subgroup. On the basis of the pattern of results and the balancing of BIC values and subgroup sizes, the four-group model suggested by Model 3 was selected as optimal.
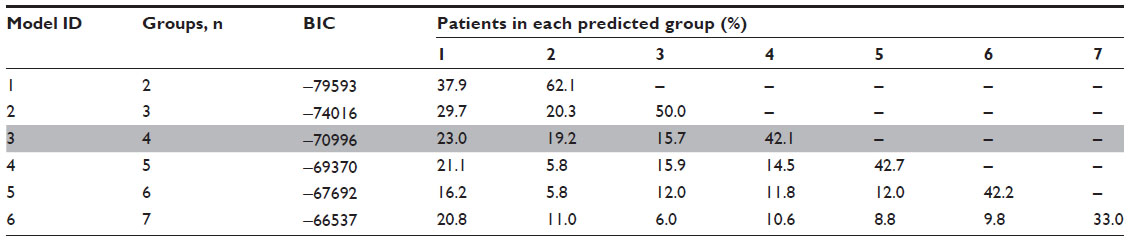 | Table 1 BIC values and predicted group proportions from GBTM |
Adherence patterns by trajectory group
Based on the adherence curves, adherence in each GBTM-defined subgroup was classified as reflecting continuously high adherence, high-then-low adherence, moderate-then-low adherence, or consistently moderate adherence (Figure 1).
 | Figure 1 Adherence curves from GBTM: trend by trajectory group. |
Adherence patterns by PDC
Because the optimal GBTM suggested four trajectory groups, four adherence groups were derived from PDC measures for comparison purposes; patients were classified into one of four groups based upon PDC rates of <25%, 25%–49%, 50%–74%, or ≥75%. Adherence curves, reflecting the mean PDC of each PDC-defined group during each week, were also constructed (Figure 2).
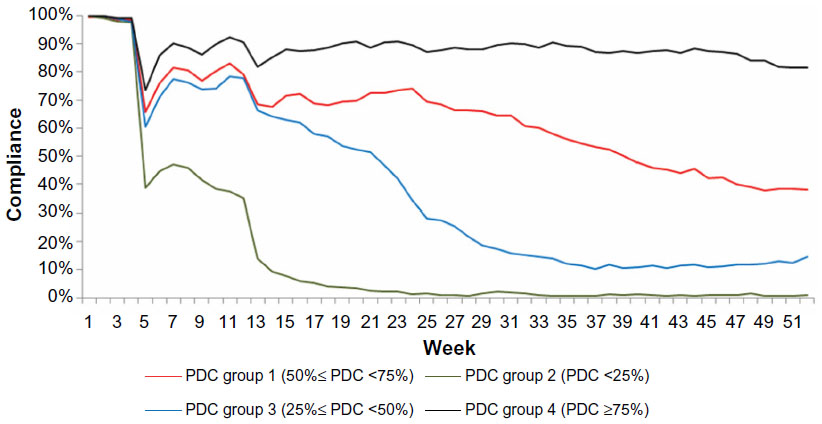 | Figure 2 Adherence curves and trend from PDC group. |
Comparison of adherence patterns on the basis of methodology
Based upon Figures 1 and 2, when comparing GBTM-defined and PDC-defined classification of patients into groups defined by adherence level, no meaningful differences are evident in terms of longitudinal adherence patterns for patients with either very good or very poor adherence to their biological therapy. However, for patients categorized as exhibiting medium levels of adherence, different longitudinal patterns are evident depending on the classification model used (PDC versus GBTM).
The majority of patients (97.9%) from PDC Group 2 (PDC <25%) were patients with moderate-then-low adherence, and the majority (96.4%) of those from PDC Group 4 (PDC ≥75%) were patients who had continuously high adherence (Table 2). The other two PDC-defined adherence groups showed more variable patterns of adherence based upon GBTM trajectories: 25.3%, 17.2%, and 57.5% patients from PDC Group 3 (25%≤ PDC <50%) were patients with consistently moderate adherence, moderate-then-low adherence, and high-then-low adherence, respectively, and 70.8%, 23.6%, and 5.7% from PDC Group 1 (50%≤ PDC <75%) were patients with consistently moderate adherence, high-then-low adherence, and continuously high adherence, respectively.
 | Table 2 Patient distribution from GBTM relative to patient distribution from PDC group |
Demographic, clinical, and treatment profiles for patients in different trajectory groups
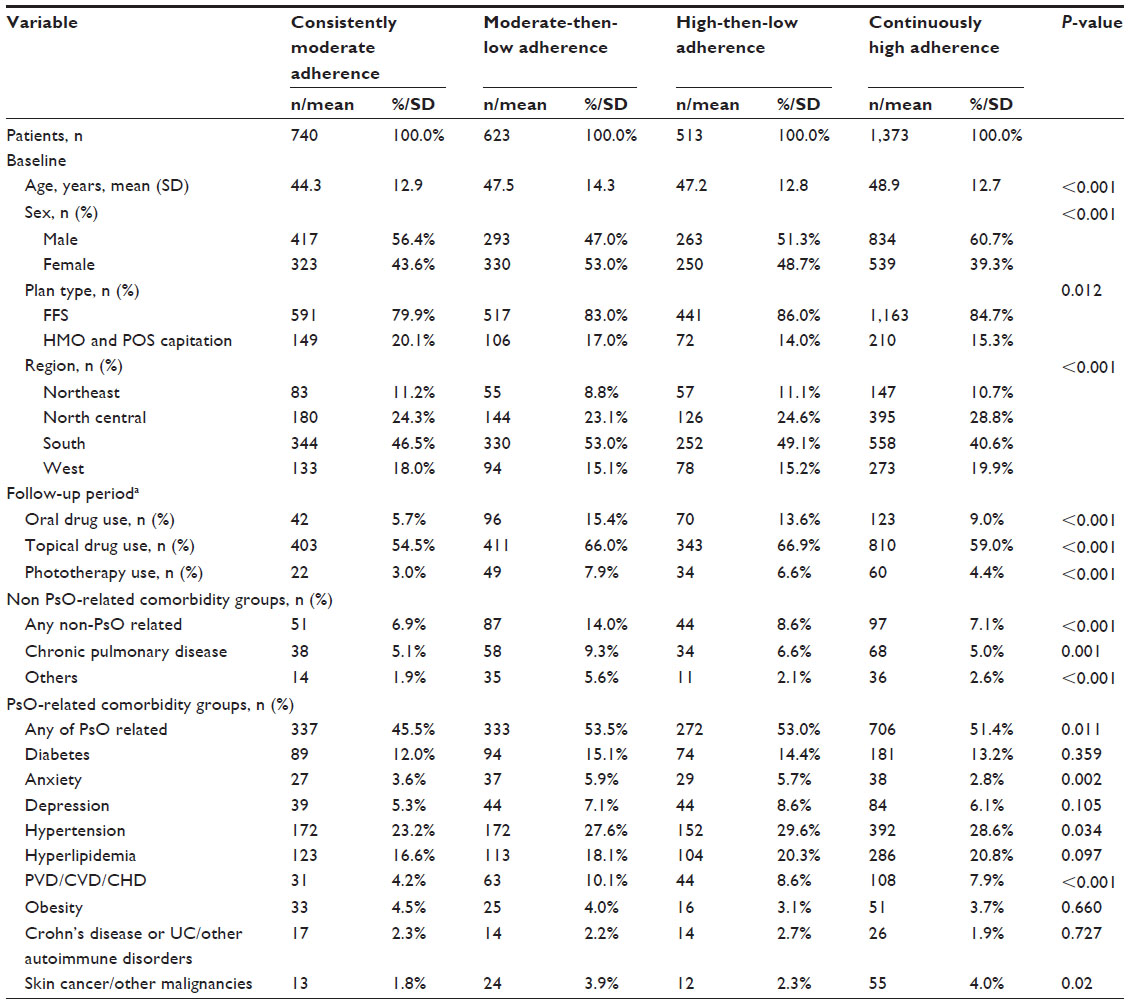
Patients with consistently moderate adherence had a lower mean age than the other groups (Table 3). Significantly more patients with continuously high adherence were male, and significantly more patients with consistently moderate adherence were female. Fewer patients who had continuously high adherence lived in the south and more of these patients lived in the north central region. The use of concomitant topical, oral, or photo therapy was different across the various trajectory-defined groups. Overall, the use of any concomitant therapy was greatest for patients who had moderate-then-low adherence and those with high-then-low adherence. Patients with moderate-then-low adherence were significantly more likely to have a nonpsoriasis-related comorbidity than were the other adherence groups. Patients with moderate-then-low adherence were also more likely to have the psoriasis-related comorbidity of peripheral vascular disease/cerebrovascular disease/coronary heart disease.
 | Table 3 Demographic, clinical, and treatment profiles for patients in different trajectory groups |
Prediction of GBTM-based adherence group from other variables
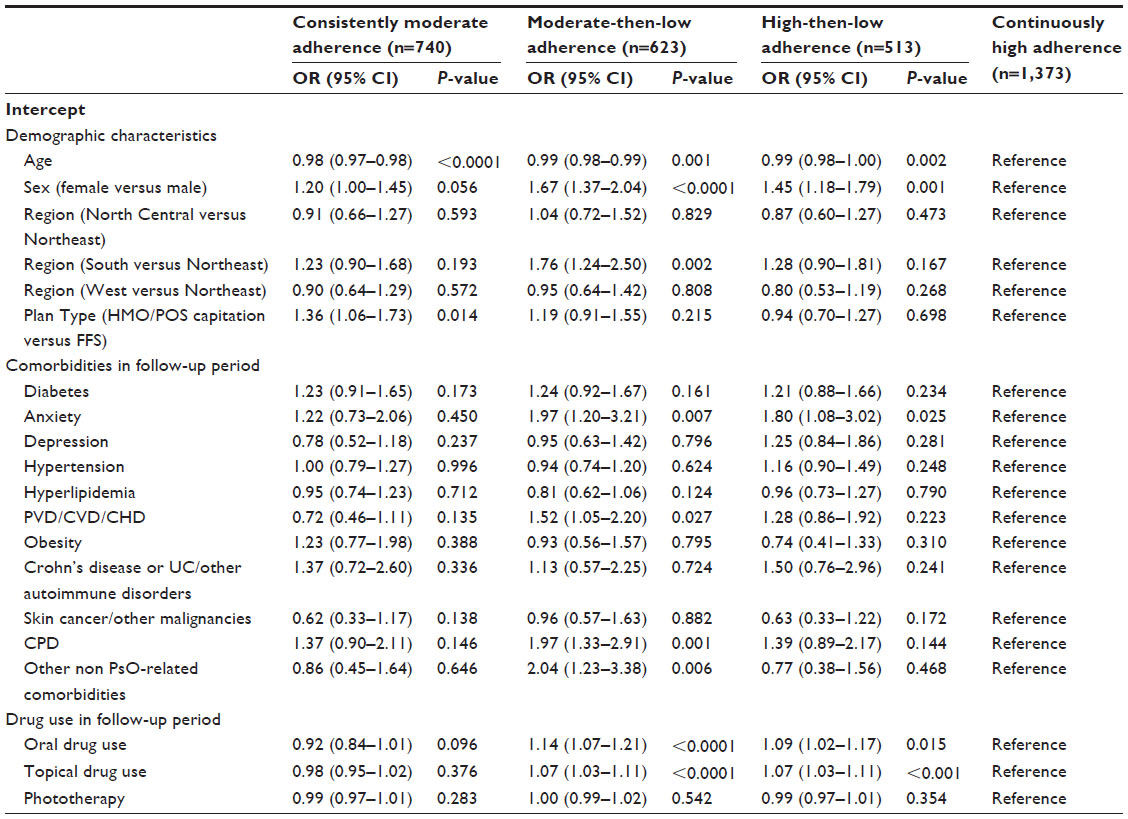
Mean age had the greatest influence on adherence, with younger patients significantly more likely to exhibit any adherence pattern other than continuously high adherence (Table 4). Males were significantly more likely than females to show either moderate-then-low adherence or high-then-low adherence, but were not more likely to exhibit consistently moderate adherence compared with those with continuously high adherence. Oral or topical psoriasis drug use during the 12-month follow-up was associated with less adherence to biologic therapy, with such concomitant therapy significantly associated with both moderate-then-low adherence and high-then-low adherence. Finally, compared to those without comorbid anxiety, those with comorbid anxiety during follow-up had significantly greater odds of exhibiting either moderate-then-low or high-then-low patterns of adherence.
 | Table 4 The association of independent variables between the different GBTM groups: results from multinomial logistic regression |
Within-group variance in each adherence group: GBTM-defined versus PDC-defined
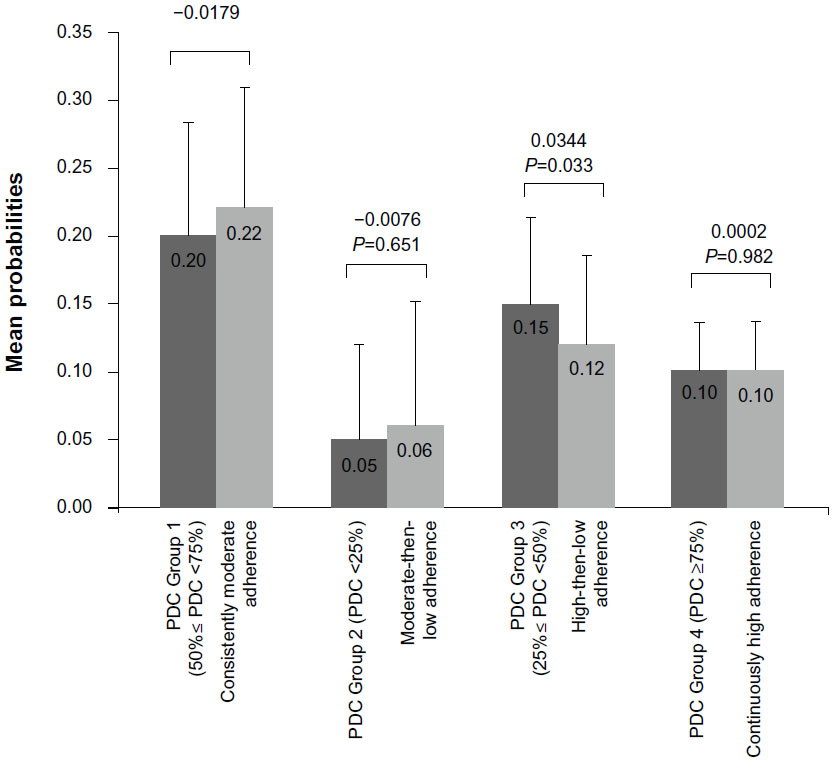
Finally, the within-group variance in each GBTM-defined and PDC-defined adherence subgroup was calculated; corresponding groups from each analytic method were compared (Figure S2). In general, the within-group variance rate did not statistically differ when comparing each GBTM-based subgroup with its corresponding PDC-defined group. However, for the pair of adherence subgroups defined by GBTM as high-then-low adherence and defined by PDC as 25%≤ PDC <50%, a significant difference emerged: the within-group variance in the GBTM-defined group was much smaller than that from the PDC-defined subgroup, implying that patients in the GBTM-defined high-then-low adherence group showed less variability in longitudinal adherence patterns than did the patients in the group defined as 25%≤ PDC <50%.
Discussion
The current study applied GBTM to detect and define group-level adherence patterns in a cohort of patients during the 12 months following initiation of a biologic treatment for their psoriasis. Each patient, who had been identified from the large medical and pharmacy claim database, was uniquely classified into one adherence-defined trajectory group, as well as one of four quartile-defined groups determined by PDC. The classifications suggested by GBTM and by PDC were compared with each other by examining the distribution of patients derived from both methods, as well as by directly comparing the within-group variance seen in each pair of defined groups, one based on GBTM and the other from PDC. In addition, the patient profiles in each GBTM-defined trajectory group were described, and baseline demographic and clinical characteristics, as well as the presence of comorbid conditions or concomitant psoriasis treatment during follow-up, were statistically compared across each GBTM-defined group. Finally, the ability of patient demographic, clinical, and treatment characteristics to predict GBTM-defined adherence patterns were established using a multinomial logistic regression model.
In these large, cohort-based analyses, the potential utility of GBTM in understanding the adherence of psoriasis patients initiating biological therapy was suggested by the adherence patterns produced by GBTM-based analyses contrasted with those based on PDC. The use of GBTM modeling allows the classification of unknown longitudinal patterns of adherence across population members and, compared to a more static adherence measure such as PDC, leads to the creation of adherence group classifications with increased homogeneity. GBTM-based models may be especially important for groups that display more variation in adherence over time, such as those in this study who had consistently moderate adherence or high-then-low adherence. The true pattern of adherence seen in these groups was not readily visible with a traditional adherence measure, such as PDC. Of course, for patients who displayed the most consistent adherence patterns over time, both GBTM-based and PDC-based analyses seemed to enable equally informative and similar classifications. As would be expected, the consistency between the GBTM and PDC models was greater for the two groups that were the most consistent over time: those with continuously high adherence and PDC Group 4 (PDC ≥75%) or those with moderate-then-low adherence and PDC Group 2 (PDC <25%).
One of the goals of health economics and outcomes research is to classify patients into groups with similar treatment patterns, such as those determined by adherence rates, enabling meaningful comparisons on important outcome variables to be made.25 Greater homogeneity among similarly classified patients on the metric that defines their classification, such as adherence, should enable more precise evaluation of the relationship between that metric and outcomes, and minimize noise. In this study, we compared “within-group” variance between roughly equivalent GBTM-based and PDC-defined adherence groups, as a measure of relative homogeneity of adherence within each group. The use of GBTM led to adherence-defined classifications that were more homogeneous than similar classifications suggested by PDC.
One important rationale for using GBTM in the context of population-based adherence studies is to better identify patient and disease characteristics that may predict greater or lesser adherence. Although adherence with biological therapy is generally better than adherence to topical therapy in psoriasis,26 it is far from complete, and little is known about what influences adherence to biologic therapy in psoriasis.15,27 Ultimately, in this study, certain demographic and disease characteristics such as age were more or less associated with adherence in the patients receiving biologic therapy for psoriasis. For example, younger patients and male patients were less likely to be in the “consistently adherent” trajectory group. Interestingly, younger age and being male, among other factors, were also associated with less adherence to topical therapy in a recent systematic review.28 It should be noted that, given the size of the sample in our study, some statistically significant associations reported may have limited clinical significance. Given that and the secondary nature of our post-hoc analyses between groups, the clinical relevance of these predictive relationships remains to be defined in future studies, and our results should best be considered as hypotheses for further testing. A better understanding of those identifiable factors that put patients at heightened risk for poorer adherence, across topical, biological, and other therapies, should help identify those patients most at need for greater education, support, or incentives in order to remain adherent.
A limitation of the current study was that only patients who had 12 months of continued enrollment were included, which may have biased the population towards patients who were more adherent or who shared certain unmeasured characteristics, such as overall concern for their health, that impacted adherence. In addition, while claims data identifies patients who fill their prescriptions, it cannot be used to determine whether the patients actually took the medication. This may be especially pertinent early in the follow-up period, since motivation to fill an initial prescription is greater than for subsequent prescriptions.29 The results reported here also do not take into account outcomes when assessing adherence. Patients whose adherence was initially good but then dropped off could represent a group of patients whose symptoms improved to the point of not needing ongoing therapy. Conversely, if symptoms significantly worsened, patients may have stopped taking their medication because of perceived ineffectiveness and not as the result of any baseline or disease characteristic, complicating the analysis of predictors of adherence. Finally, this study assessed the use of biologics, all requiring injections. Patients who are treated with injectable drugs may likely have different disease characteristics and may be prone to different patterns of adherence, compared with patients who use oral or inhaled medications. Caution must be applied before conclusions from this study are more widely generalized to the population of psoriatic patients as a whole.
Conclusion
This study helps to illustrate that patient adherence is not always a simple phenomenon, nor is it necessarily consistent over time. Thus, identifying longitudinal and potentially dynamic patterns of adherence using GBTM may result in more useful classifications than would using a more traditional measure such as PDC. Through the application of GBTM in a large population of patients initiating biologic therapy for their psoriasis, four adherence trajectories were identified: continuously high adherence, high-then-low adherence, moderate-then-low adherence, and consistently moderate adherence. Recognizing these patterns of adherence may enable more nuanced, more sophisticated, and less error-prone study within this population, compared with categorizing patients by levels of a static, predetermined, threshold measure such as PDC. GBTM offers researchers an alternative method of determining adherence to treatment, one that better captures dynamic changes in adherence over time. By more accurately modeling adherence patterns, the factors that influence adherence may be more clearly elucidated.
Disclosure
This study was financially supported by Novartis Pharmaceuticals Corporation. Yunfeng Li, Kristijan H Kahler, Haijun Tian, Susan Gabriel, and Steve Arcona are employees of Novartis Pharmaceuticals Corporation. Huanxue Zhou is a senior analyst at KMK Consulting, Inc., and works as a consultant for Novartis Pharmaceuticals Corporation. Beilei Cai was a Health Economics and Outcome Research (HEOR) Fellow from University of Utah and participated in this research as a part of her HEOR Fellowship at Novartis Pharmaceuticals Corporation. Written and editorial support for the preparation of this manuscript was provided by Write All, Inc., who received funding for services from Novartis Pharmaceuticals Corporation. All of the authors have read and approved the content of the entire manuscript, and meet the authorship criteria provided by ICMJE.
References
Sokol MC, McGuigan KA, Verbrugge RR, Epstein RS. Impact of medication adherence on hospitalization risk and healthcare cost. Med Care. 2005;43(6):521–530. | |
DiMatteo MR, Giordani PJ, Lepper HS, Croghan TW. Patient adherence and medical treatment outcomes: a meta-analysis. Med Care. 2002;40(9):794–811. | |
Kripalani S, Yao X, Haynes RB. Interventions to enhance medication adherence in chronic medical conditions: a systematic review. Arch Intern Med. 2007;167(6):540–550. | |
World Health Organization. Adherence to Long-Term Therapies: Evidence for Action. Geneva, Switzerland: World Health Organization; 2003. Available from: http://whqlibdoc.who.int/publications/2003/9241545992.pdf. Accessed August 2013. | |
Woltmann EM, Valenstein M, Welsh DE, et al. Using pharmacy data on partial adherence to inform clinical care of patients with serious mental illness. Psychiatr Serv. 2007;58(6):864–867. | |
Farmer KC. Methods for measuring and monitoring medication regimen adherence in clinical trials and clinical practice. Clin Ther. 1999;21(6):1074–1090. | |
Peterson AM, Nau DP, Cramer JA, Benner J, Gwadry-Sridhar F, Nichol M. A checklist for medication compliance and persistence studies using retrospective databases. Value Health. 2007;10(1):3–12. | |
Steiner JF, Koepsell TD, Fihn SD, Inui TS. A general method of compliance assessment using centralized pharmacy records. Description and validation. Med Care. 1988;26(8):814–823. | |
Steiner JF, Prochazka AV. The assessment of refill compliance using pharmacy records: methods, validity, and applications. J Clin Epidemiol. 1997;50(1):105–116. | |
Hess LM, Raebel MA, Conner DA, Malone DC. Measurement of adherence in pharmacy administrative databases: a proposal for standard definitions and preferred measures. Ann Pharmacother. 2006;40(7–8):1280–1288. | |
Nagin DS, Odgers CL. Group-based trajectory modeling in clinical research. Annu Rev Clin Psychol. 2010;6:109–138. | |
Nagin DS, Odgers CL. Group-based trajectory modeling (nearly) two decades later. J Quant Criminol. 2010;26(4):445–453. | |
Modi AC, Cassedy AE, Quittner AL, et al. Trajectories of adherence to airway clearance therapy for patients with cystic fibrosis. J Pediatr Psychol. 2010;35(9):1028–1037. | |
Franklin JM, Shrank WH, Pakes J, et al. Group-based trajectory models: a new approach to classifying and predicting long-term medication adherence. Med Care. 2013;51(9):789–796. | |
Sandoval LF, Feldman SR. Biologics in practice: adherence to biologic therapy in psoriasis. The Dermatologist. 2013;21(2):30–34. | |
Degli Esposti L, Saragoni S, Batacchi P, et al. Adherence to statin treatment and health outcomes in an Italian cohort of newly treated patients: results from an administrative database analysis. Clin Ther. 2012;34(1):190–199. | |
MarketScan® Research [database on the Internet]. Ann Arbor, MI: Truven Health Analytics; 2012. Available from: http://marketscan.truvenhealth.com/marketscanportal/. Accessed January 31, 2014. | |
Centers for Disease Control and Prevention [homepage on the Internet]. International Classification of Diseases, Ninth Revision, Clinical Modification (ICD-9-CM). Atlanta, GA: Centers for Disease Control and Prevention; 2014. Available from: http://www.cdc.gov/nchs/icd/icd9cm.htm. Accessed November 26, 2013. | |
Jones BL, Nagin DS, Roeder K. A SAS procedure based on mixture models for estimating developmental trajectories. Sociol Methods Res. 2001;29(3):374–393. | |
Nagin DS. Group-Based Modeling of Development. 1st ed. Cambridge, MA: Harvard University Press; 2005. | |
Schwarz G. Estimating the dimension of a model. Ann Stat. 1978;6(2):461–464. | |
Kass RE, Raftery AE. Bayes Factors. J Am Stat Assoc. 1995;90(430):773–795. | |
Neath AA, Cavanaugh JE. The Bayesian information criterion: background, derivation, and applications. Wiley Interdiscp Rev Comput Stat. 2012;4(2):199–203. | |
Ho PM, Bryson CL, Rumsfeld JS. Medication adherence: its importance in cardiovascular outcomes. Circulation. 2009;119(23):3028–3035. | |
Pittman DG, Tao Z, Eisenberg ES, Pendergrass M. Adherence to antihypertensive medications is associated with fewer cardiovascular related hospitalizations and ED visits in patients 65 and older. In: Program and abstracts of the Quality of Care and Outcomes Research in Cardiovascular Disease and Stroke 2012 Scientific Sessions, May 9–11, 2012; Atlanta, GA. Circ Cardiovasc Qual Outcomes. 2012; 5(Suppl 3):Abstract A47. | |
Chan SA, Hussain F, Lawson LG, Ormerod AD. Factors affecting adherence to treatment of psoriasis: comparing biologic therapy to other modalities. J Dermatolog Treat. 2013;24(1):64–69. | |
Sandoval LF, Huang KE, Feldman SR. Adherence to ustekinumab in psoriasis patients. J Drugs Dermatol. 2013;12(10):1090–1092. | |
Devaux S, Castela A, Archier E, et al. Adherence to topical treatment in psoriasis: a systematic literature review. J Eur Acad Dermatol Venereol. 2012;26 Suppl 3:61–67. | |
Barber N, Parsons J, Clifford S, Darracott R, Horne R. Patients’ problems with new medication for chronic conditions. Qual Saf Health Care. 2004;13(3):172–175. |
Supplementary material
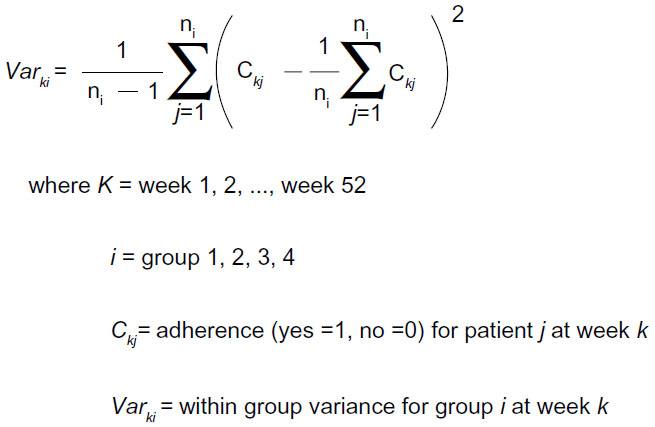 | Figure S1 Calculation of within-group variance. |
 | Figure S2 Comparison of “within group” variance from GBTM and from PDC measure. |
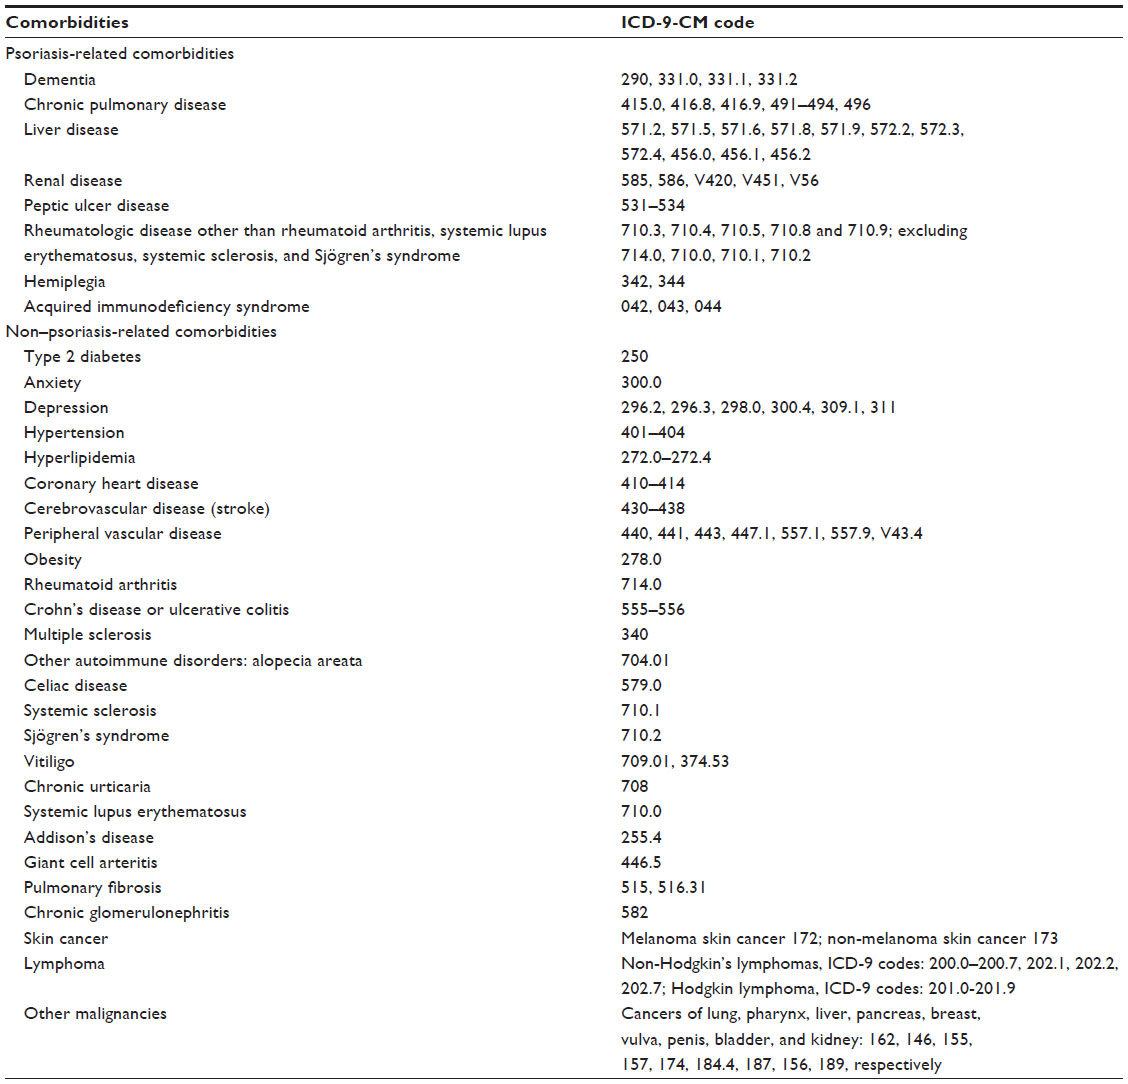 | Table S1 Patient comorbidities |
 © 2014 The Author(s). This work is published and licensed by Dove Medical Press Limited. The
full terms of this license are available at https://www.dovepress.com/terms
and incorporate the Creative Commons Attribution
- Non Commercial (unported, 3.0) License.
By accessing the work you hereby accept the Terms. Non-commercial uses of the work are permitted
without any further permission from Dove Medical Press Limited, provided the work is properly
attributed. For permission for commercial use of this work, please see paragraphs 4.2 and 5 of our Terms.
© 2014 The Author(s). This work is published and licensed by Dove Medical Press Limited. The
full terms of this license are available at https://www.dovepress.com/terms
and incorporate the Creative Commons Attribution
- Non Commercial (unported, 3.0) License.
By accessing the work you hereby accept the Terms. Non-commercial uses of the work are permitted
without any further permission from Dove Medical Press Limited, provided the work is properly
attributed. For permission for commercial use of this work, please see paragraphs 4.2 and 5 of our Terms.