Back to Archived Journals » Reports in Electrochemistry » Volume 6
Graphene quantum dot-based on-chip electrochemical DNA hybridization sensor for pancreatic cancer
Authors Nigam Joshi P, Waghmode S
Received 8 January 2016
Accepted for publication 29 February 2016
Published 14 November 2016 Volume 2016:6 Pages 31—40
DOI https://doi.org/10.2147/RIE.S83253
Checked for plagiarism Yes
Review by Single anonymous peer review
Peer reviewer comments 2
Editor who approved publication: Professor A.M Kannan
Preeti Nigam Joshi,1 Shobha Waghmode2
1Combichem Bioresource Center, National Chemical Laboratory, Pune; 2Department of Chemistry, Abasaheb Garware College, Pune, India
Abstract: A new sensitive sensor based on graphene quantum dots was constructed and used to detect gene mutations in pancreatic cancer (PC). PC is a leading cause of death worldwide and is considered a hard-to-treat malignancy due to its late diagnosis and lowest 5-year survival rate of 2%–7%. Despite significant advances in detection techniques, PC is often diagnosed at advanced stage, with limited treatment options available, which leads to death in the majority of cases. In this regard, it is extremely important to develop methods for early detection of this lethal disease. In this study, we explored the advantages of electrochemical biosensing and designed a simple screen-printed DNA sensor for the detection of gene mutation in PC. p16 is a tumor-suppressor gene, and alterations in the gene sequence are related to PC onset. Therefore, we explored the p16 gene as a cancer marker and designed an electrochemical on-chip sensor system for the early diagnosis of PC. Different electrochemical techniques, such as differential pulse voltammetry and electrochemical impedance spectroscopy, were applied along with other characterization techniques (eg, ultraviolet–visible spectroscopy, scanning and transmission electron microscopy) for designing a simple DNA hybridization sensor for PC. The biosensor showed a detection capability of 0.10 pM. This study establishes the utilization of graphene quantum dots as a sensor matrix and a new approach for detecting gene mutation on a chip, which can be further developed as an integrated portable detection system.
Keywords: electrochemical biosensor, DNA hybridization, p16 gene, pancreatic cancer, screen-printed electrodes, cancer biomarkers
Introduction
Pancreatic cancer (PC) is a lethal malignancy and is a major cause of cancer-related deaths in the US. An estimated 44,000 new cases and 40,000 deaths have been reported by the National Cancer Institute.1 Despite significant advances in imaging techniques such as computed tomography (CT), magnetic resonance imaging (MRI), endoscopic ultrasound (EUS), and endoscopic retrograde cholangipancreatography (ERCP), in most cases PC is detected in advanced stage where very few treatment options are available. According to one study, resection is applicable only in 5%–25% of cases, and chemotherapy is the widely accepted option for the treatment of PC.2,3 PC has the highest mortality rate and is the only malignancy for which the mortality rate has not improved substantially in the past 25 years due to lack of efficient treatment options. This is strong reason to identify more biomarkers and detection methodologies for the early detection of this deadly disease. Cancer antigen 19-9 (CA 19-9), a carbohydrate antigen present in the serum, is a widely used marker for PC detection. However, owing to its low selectivity and false-positive results, CA 19-9 cannot be used as a confirmatory diagnostic test for PC.4,5 This limitation was the major reason for researchers to explore and identify other biomarkers such as plectin-1, macrophage inhibitory cytokine-1, IGFBP-1, haptoglobin, SAA, TIMP-1, HE4, NGAL, and particularly human UL16-binding protein 2 (ULBP2) for PC screening.6–9 However, apart from these serum biomarkers, researchers have also focused on genetic alterations in PC to detect the early onset of PC. The major cause of all cancers is related to genetic mutations as well as the alteration in the regulatory pathways due to mutations. In this regard, emphasizing on the gene analysis and identification of possible mutations can be an efficient tool to predict cancers, and the altered genes can be potential candidates for prognostic cancer markers. For PC also, the development from precancerous lesions to invasive metastasizing cancer is accompanied by a stepwise acquisition of sequential mutations in genes. In the past decade, significant progress has been made in interpreting the genetic basis of the tumorigenesis of PC. As reported by Bartsch et al,10 alterations in genes controlling the G1/S phase cell cycle transition were found to be one of the dominant mechanisms for the development of PC. Further, it was shown by Berthhold et al that the genes p16IN4Ka, p53, and Rb, the prime components of this complex G1/S phase network, are mutated or deleted in PC. The tumor suppressor p16 gene is altered in 27%–95% of PCs, p53 in 40%–70%, and Rb in ~5%–12%.11–15
This interesting finding is the major reason for considering the p16 gene as a potential biomarker for PC in this study. We have developed an electrochemical biosensor for mutation detection in the gene sequence related to p16, which in turn can be helpful for the early diagnosis of this fatal disease.
Although research is going on to explore new biomarkers associated with PC onset, mere identification of new biomarkers is not adequate in the diagnosis of PC, as the procedures involved in these analyses are quite tedious and inconvenient. This vigor to develop newer, simpler methods for detection led us to biosensing platforms. Biosensors are devices having three main components; the analytes of interest, the recognition element, and a transducer. Based on the transducer, different biosensing devices have been developed for various analytes, and many reviews on biosensors are available.16–18 Among the various techniques of biosensing such as surface plasmon resonance and UV–Vis spectroscopy and optical and electrochemical sensing, the last one has received immense attention due to its specific characteristics of high specificity, ease of fabrication, short response time, portability, and cost effectiveness.19
This study is the first report of an electrochemical, on-chip DNA hybridization sensor for the early detection of PC. DNA sensors are widely explored, and significant progress has been made to design efficient gene sensors. Hybridization of gene sequences at the working electrode and the corresponding changes in electrochemical signals form the basis of DNA sensors. Based on the electrode modifier, sensors with precise and lower detection capability can be fabricated. Many researchers have suggested biosensing devices for disease-associated gene identification for clinical and medical research, gene therapy, forensics, and the design of point-of-care therapeutic procedures.20–22 The field of analytical sciences has witnessed a fast pace of development in recent years, and the arrival of new technologies with simpler operating protocols have highly benefited the field of biosensors also. With the emergence of advanced miniaturization techniques, a new gateway for on-chip and disposable sensors has been opened, which is being widely explored by researchers worldwide.23–25 The key advantages associated with miniaturized sensors are the ease of automation, reduction in reagent consumption, and the analysis of multiple analytical operations and biological samples on a single platform.
Here, we report a simple, sensitive, and efficient electrochemical biosensor for the p16 gene. We explored a graphene quantum dot (QD)-modified on-chip sensor system for the detection of p16 gene mutation as an early biomarker for PC. Graphene QDs are nano-sized, single-layered graphene sheets made up of reduced graphene oxide (rGO) and exhibit unique and very useful electrooptic properties. The functional groups (hydroxy [OH], carboxyl [COOH], and amino [NH2]) on graphene QDs (GQDs) also make them an attractive material as an electrode matrix.
We have achieved a good detection capability of 0.1 pM. Mutation in the gene sequence was also detected using this setup. This is a key advantage, as the p16 gene is mutated in >70% of cases of PC. Detection at an early stage of mutation can be beneficial not only for the prediction of PC onset but also for more successful planned treatment strategies to treat this fatal malignancy.
Materials and methods
Materials
Tris–HCl buffer, 1-ethyl-3(3-dimethylaminopropyl) carbodiimide (EDC) (98%), N-hydroxysuccinimide (NHS) (98%), Lawsone (97%), and graphite powder (≥99.99%) were obtained from Sigma-Aldrich (St Louis, MO, USA). Amino-modified p16 gene related sequence (DNA probe GenBank accession no. AH005371) and complementary and noncomplementary (one base mismatch) sequences were synthesized by Eurofins, Luxembourg. The optical density for each sequence was provided by the manufacturer. Each freeze-dried sample of the oligonucleotide was dissolved in an appropriate amount of distilled water to prepare stock solutions of 10 μL/mL. The sequences were as follows:
Probe DNA: 5′-NH2-GCC GCC CGC TAC CTA-3′
Complementary sequence (target DNA): 3′-GAT CGG CGG GCG ATG GAT TTA-5′
One-base mismatch: 3′-GAC CGG CGG GCG ATG GAT TTA-5′
Noncomplementary: 3′-ATG GCG GTA CCG TTA GGT GGC-5′
Fabrication of on-chip electrodes
A three-electrode on-chip system (25.4 mm×7 mm×0.635 mm) was fabricated with carbon as the working electrode (WE), Pt as the counterelectrode (CE), and Ag as the reference electrode (RE), by BST Biosensor Technology, Germany. The diameter of the carbon WE was 3 mm.
Synthesis of graphene quantum dots and modification of the electrode surface
GQDs were synthesized by the modified Hummer’s method, as described earlier.26 In brief, GO was synthesized by the modified Hummers process,27 and, subsequently, chemical reduction of the GO solution was achieved using Lawsone (2-hydroxy-1,4-naphthoquinone) as the reducing agent under a hydrothermal environment. Typically, 100 mL GO solution was sonicated for half an hour, and then 2.87 mM of Lawsone was added with magnetic stirring for 15 minutes. The solution was then heated at 200°C for 4 hours in an oil bath. The reduced graphene was collected by centrifugation followed by washing with deionized water several times and then purified using a dialysis membrane for 24 hours to reduce the size into quantum dots. GQDs were further freeze dried to prepare solutions of the desired quantity for further use.
For modification of WE, 25 μL of GQD solution (25 mg/mL) was drop-casted on the electrode surface and left overnight for drying. After that, the electrode was washed thoroughly with distilled water to remove unabsorbed GQDs. To attach DNA on GQDs, the electrode was dipped in an EDC–NHS solution (coupling agent for amide formation) for 1.5 hours. The EDC–NHS solution was prepared in 3:1 molar ratio in Tris–HCl buffer (4 mL, 20 mM), pH 6.5, and allowed to stir for 3 hours in a sealed tube. Fifteen microliters of single-stranded DNA (ssDNA) solution was dropped on the EDC–NHS-treated electrode surface and kept for 4 hours at room temperature followed by overnight incubation <10°C to couple the DNA with GQDs. The electrodes were kept in a refrigerator (4°C) when not in use.
Characterization of nanomaterials
Fourier transform infrared spectroscopy (FT-IR, Nicolet iS5; Thermo Fisher Scientific, Waltham, MA, USA), UV–visible spectroscopy (UV–vis, Cary50 Bio; Varian, the Netherlands), transmission electron microscopy (TEM, Tecnai, T-20; FEI, the Netherlands), and X-ray diffraction (XRD) were performed to characterize GQDs and DNA-GQD functionalization.
Electrochemical analysis
The efficacy of the sensor was determined by differential pulse voltammetry (DPV) and electrochemical impedance spectroscopy (EIS) (Palm-Sens Potentiostat, the Netherlands). For DPV analysis, a potential range between −0.5 and 1.1 V with a pulse of 50 mV and scan rate of 25 mV/s was applied, while EIS was performed at 0.25 V in the frequency range 0.10–10,000 Hz and modulation amplitude of 10 mV by using 2.5 mM K3[Fe(CN)6]/K4[Fe(CN)6] (1:1) as the redox probe (prepared in 0.10 M KCl).
DNA hybridization
Hybridization with the complementary probe was carried out by immersing the modified electrode into Tris–HCl (20 mM) solution containing the target DNA for 30 minutes at 45°C. After hybridization, the double-stranded DNA (dsDNA) electrodes were washed with Tris–HCl buffer to wash out any nonhybridized DNA. The steps for the electrode preparation are shown in Figure 1.
 | Figure 1 Schematic of the GQD-based electrochemical DNA hybridization sensor. |
Selectivity analysis
To determine the selectivity of the sensor, impedance analysis was performed. A DNA sequence related to the p16 gene, which was hybridized with 10−10 M complementary DNA sequence, was immobilized on the GQD-modified working electrode, and the signals were measured, while the noncomplementary sequence of same concentration was used to check the selectivity by DPV. All experiments were performed thrice to avoid experimental errors as much as possible.
Regeneration of electrode surface
Stability of the GQD-modified carbon electrode was judged by regenerating the electrode surface. For surface regeneration, the electrode was washed with hot Tris–HCl buffer (20 mM, pH 6.5, 92°C) for 5 minutes followed by rapid cooling in an ice bath. All electrodes were kept in the refrigerator (4°C) when not in use.
All the experiments were performed in triplicate to avoid experimental errors as much as possible.
Results and discussion
This study is a new application of electrochemical biosensing for gene mutation detection, specifically for PC. Early diagnosis of this fatal cancer is the key to working out a successful treatment regimen. We have designed an on-chip electrochemical sensor for the detection of PC and evaluated its performance for the p16 gene. GQDs were utilized as the electrode surface modifier, and EIS and DPV were the preferred electrochemical techniques to obtain the sensor response, owing to the better sensitivity of these methods.
As described previously, the p16 gene belongs to tumor-suppressor class of genes, and deletions and mutations in the gene sequences lead to cancer onset in the pancreas, kidney, lungs, breast, and liver. The underexpression or loss of the the p16 protein product may be a cause of failure in regulatory pathways related to cyclin-D-dependent kinases, which in turn leads to abrupt cell proliferation.28
An elevated frequency of p16 gene alterations with ~41% deletions and 38% mutations has been observed in pancreatic adenocarcinoma. In this regard, p16 gene regulation and alterations can be explored as biomarkers in cancer diagnosis. We have designed a simple and cost-effective on-chip biosensor system for the identification of possible mutations in the p16 gene. In our opinion, findings of this study can be taken to the next level to make a complete on-chip sensor system.
Characterization of nanomaterials and electrode preparation
GQDs were synthesized via a modified Hummer’s method and Lawsone was used as reducing agent to reduce GO. Lawsone (also known as hennotannic acid), is a red-orange dye present in the leaves of Lawsonia inermis plant as well as in the flower of water hyacinth (Eichhornia crassipes). Chemically, Lawsone is the hydroxy analog of 1,4-nepthaquinone. In our analysis, it was used as a reducing agent to prepare rGO under hydrothermal conditions at elevated temperatures. Later, QDs of reduced size were collected via dialysis and freeze-dried for further use. The as-synthesized GQDs were characterized using XRD, TEM, and UV–vis analyses. TEM images revealed that the size of the particles was between 2 nm and 6 nm, and two characteristic peaks at 235 and 334 nm were shown in UV–vis spectrum, corresponding to the π–π* transitions of C=C and uniform sp2 clusters in GQDs (Figures S1 and S2).29
For electrode preparation, the WE was modified with QDs by drop-casting an aqueous solution of GQDs on the electrode surface. After thoroughly washing the electrode with distilled water, cyclic voltammetry was performed to characterize the electrode in Tris–HCl buffer (pH 6.5) at room temperature, and no peak was obtained in the GQD-modified electrode. For further analysis, K3[Fe(CN)6]/K4[Fe(CN)6] was used as a redox probe to study the sensor response in the presence of the p16 gene sequence, and a well-defined voltammogram of the electroactive moiety [Fe(CN)6]−3/−4 was obtained (data not shown).
GQDs are rich in various functional groups, including – COOH, and to attach the DNA probe on the electrode, we explored the EDC–NHS-mediated coupling reaction to functionalize GQD-modified electrode surface with 3′-NH2-modified gene sequence. FT-IR was performed as a confirmatory analysis for GQD-DNA probe linking (Figure 2). A peak at ~1,670 nm in the spectra corresponds to CO–NH (carbodiimide) bond formation.
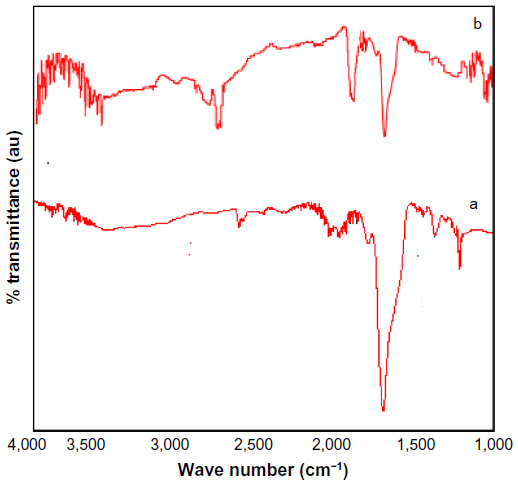 | Figure 2 FT-IR spectra of (a) GQDs, and (b) GQDs with DNA after functionalization. |
Optimization of parameters
To receive optimum response from the biosensor, pH, hybridization temperature, and other electrochemical parameters were optimized by DPV. Because of the better sensitivity of DPV than cyclic voltammetrry, it was the preferred electrochemical technique in this analysis. Figure 3A and B represent the optimized pH and hybridization temperature. Although different pH compositions were tried, the best response was obtained at pH 6.5 with Tris–HCl buffer, and so this pH was used in the rest of the analysis. Reaction time, temperature, length, and composition (%G+C) of oligonucleotide sequence are critical parameters that affect the hybridization. For optimization of the hybridization temperature, the current values at different temperatures and time were measured as shown in Figure 3A and B. To optimize the time of hybridization, DPV response of electrode was measured at 42°C based on earlier literature, and after 30 minutes of hybridization time, the best response was obtained at 45°C for our sensor system.
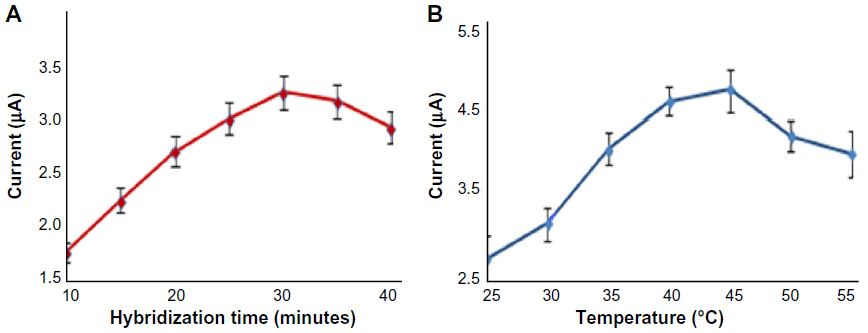 | Figure 3 (A) Optimization of hybridization time. (B) Optimization of hybridization temperature. |
Electrochemical analysis
As shown in Figure 1, the WE on screen-printed electrode was modified by GQDs and the probe DNA sequence was immobilized on GQDs via carbodiimide coupling. DPV was performed to check the immobilization of DNA on the GQD-modified electrode surface using [Fe(CN)]−3/−4 as electrochemical indicator of the current response. Figure 4 presents the voltammogram of the DPV analysis. As expected, immobilization of the DNA sequence on electrode surface increased the resistance to the charge transfer between [Fe(CN)]−3/−4 and the electrode. DNA is a negatively charged chemical entity, and due to electrostatic repulsion, there is an evident current decrease as compared to the unfunctionalized electrode in the buffer solution containing [Fe(CN)]−3/−4, while after hybridization with the complementary sequence, the current response is increased. Hybridization can be defined as double-helix formation after the mixing of two single-stranded complementary DNA sequences. This process alters the secondary confirmation of the probe DNA on the electrode surface as well as resistance to electron transfer on the electrode surface. Oligonucleotides are nonconductive, and hybridization at the electrode surface reduces the net negative charge on dsDNA as well as the repulsive forces between the two strands. This results in an increase in the current values corresponding to electroactive compound, as shown in Figure 4C. These findings also confirmed the successful immobilization of the p16 gene sequence on the GQD-modified electrode.
 | Figure 4 Effect of DNA immobilization on GQD-modified electrode. |
After optimizing the experimental conditions, we further characterized the biosensor’s performance with different concentrations of complementary DNA sequences by DPV with a pulse width of 50 mV at 25 mV/s scan rate, as shown in Figure 5, which illustrates the current response at different concentrations of DNA after hybridization. An increase in the current response with increase in concentration of the target DNA was observed. We obtained a steady response up to the concentration of 10−12 M with a detection capability of 0.10 pM. Below this concentration, no stable response with respect to the current values of [Fe(CN)]−3/−4 was noticed, as seen in the calibration curve (Figure 6). The inset of Figure 6 is the calibration curve for a DNA concentration of 0.5×10⁻⁹ M to 7.5×10⁻⁹ M, and these values were in accordance with the linear range of calibration curve obtained in Figure 6. This analysis concluded that the current increased after the hybridization reaction on the GQD-modified electrode surface due to the reduction in electrostatic repulsive forces for the negatively charged electroactive [Fe(CN6)]−3/−4 molecules after the hybridization event at the electrode surface.
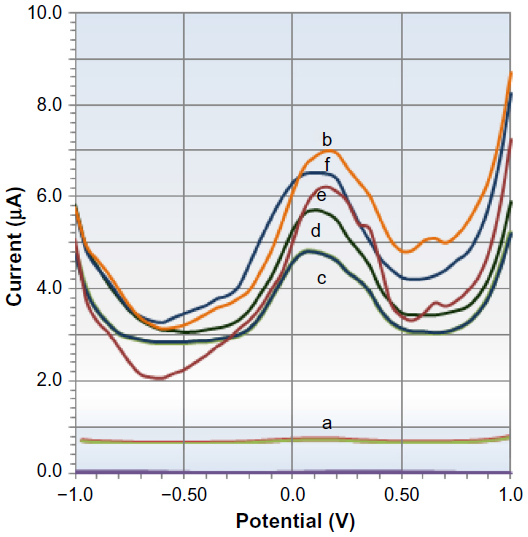 | Figure 5 DPV for 10 mM Tris–HCl buffer solution of pH 6.5 at (a) GQD-modified electrode, (b) buffer solution containing 5 mM [Fe(CN)6]−3/−4, (c) after ssDNA probe immobilization, and (d–f) after hybridization with complementary DNA of concentrations of 10−12 M, 10−10 M, and 10−8 M. |
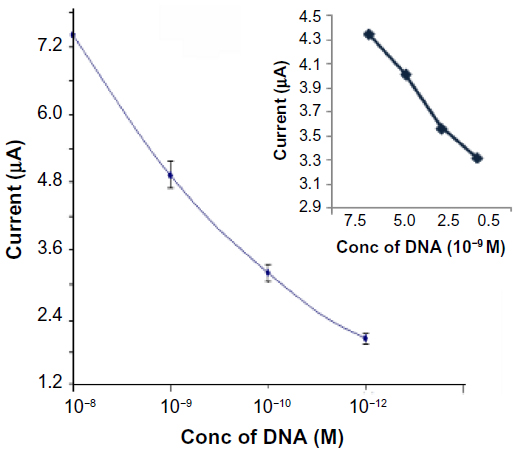 | Figure 6 Calibration curve (current vs concentration) for the target ssDNA on GQD-modified on-chip carbon electrode in Tris buffer (pH 6.5 in presence of [Fe(CN)6]–3/–4). |
EIS was also performed as supporting analysis to investigate the electrode’s response at different concentrations of DNA. EIS is a helpful technique that provides detailed information on the impedance changes at electrode interface. Typically, in a Nyquist plot of the impedance spectrum, the semicircular part at higher frequencies and a straight line at lower frequencies correspond to an electron-transfer-limited process and a diffusion-limit process, respectively. The charge-transfer resistance (RCT) can be estimated by the semicircle’s diameter of the impedance spectrum at a high frequency. EIS was explored to determine the selectivity and reproducibility of the biosensor.
Selectivity of the biosensor
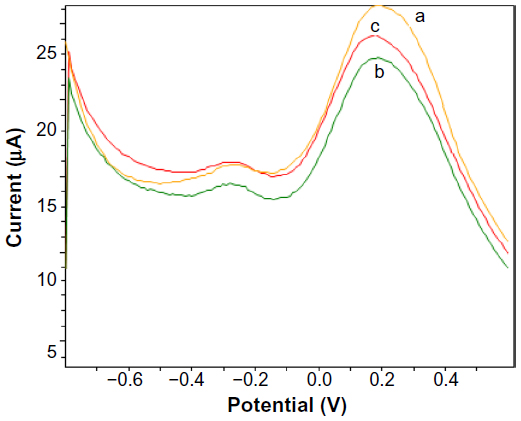
The selectivity of the biosensor was monitored via DPV and EIS to check the efficacy of the system for the detection of a single base mismatch in the presence of complementary and noncomplementary oligonucleotide sequences. As illustrated in Figure 7, a significant change in the current was observed after hybridization with the complementary sequence (Figure 7B) and DNA with one base mismatch. The current value for [Fe(CN)6]−3/−4 with ssDNA was 5.62 μA, which increased to 7.44 μA on complementary DNA binding, but for the single-base-mismatched sequence, the current further decreased to 6.67 μA due to improper hybridization and enhanced repulsive forces compared to perfectly paired-up DNA sequences of the p16 gene. In the presence of noncomplementary targets, no visible current changes were observed due to the lack of any hybridization event. These findings clearly indicate the selectivity of our biosensor and its ability to diagnose point mutations in gene sequences, which can be further explored for the identification of mutated genes and their impact on the early diagnosis of PC.
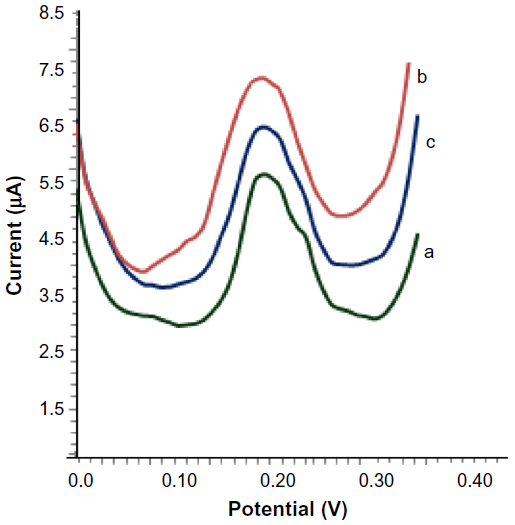 | Figure 7 Selectivity of the biosensor. DPV response in 10 mM Tris–HCl buffer solution of pH 6.5 containing 5 mM [Fe(CN)6]−3/−4 after (a) GQDs-ssDNA, (b) hybridization with 10−10 M target DNA sequence, and (c) hybridization with one-base-mismatched DNA sequence.Abbreviations: DPV, differential pulse voltammetry; GQD, graphene quantum dot; ss, single strand. |
Impedance spectra also supported the above findings. As shown in Figure 8, a significant variation in RCT values was obtained after hybridization with single-base-mismatch and noncomplementary DNA sequences. As clearly indicated, after hybridization with the complementary target DNA, the semicircular region got skewed, while with single-base-mismatched sequence, there was an increase in the resistance values and a further enhancement was observed in the semicircular regions of the Nyquist plot. It can be explained by the fact that hybridization with the target DNA diminished the electrostatic repulsion and better charge transfer occurred at the electrode surface, which reduced the resistance. In the presence of mutated sequences (single base or noncomplementary), improper hybridization takes place, which influences the resistance values.
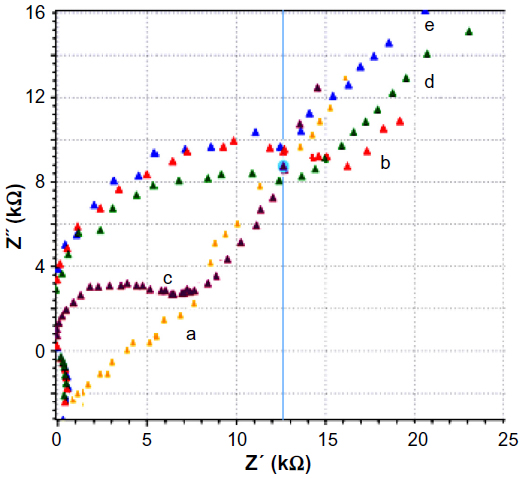 | Figure 8 EIS of electrode response for (a) GQD-modified electrode, (b) after ssDNA immobilization, (c) hybridization with complementary DNA, (d) hybridization with one base mismatch, and (e) with noncomplementary DNA. |
The response time of sensor was between 2 and 3 minutes based on the scan rate and pulse width, which is also an added advantage of the on-chip sensor system for fast and robust diagnosis.
Stability and reproducibility of electrodes
To check the reproducibility and stability of the sensor system, after hybridization, the electrode surface was regenerated by washing it in Tris buffer at 92°C for 5 minutes followed by rapid cooling in an ice bath. The impedance spectrum was again measured and, as shown in Figure 9, a small change in the RCT value was noted with normal and regenerated electrodes after hybridization with 10−10 M complementary DNA sequence. The other experimental conditions were the same as previously mentioned. These findings confirm the robustness of the sensor system and its potential to be further developed as an efficient DNA sensor for PC diagnosis.
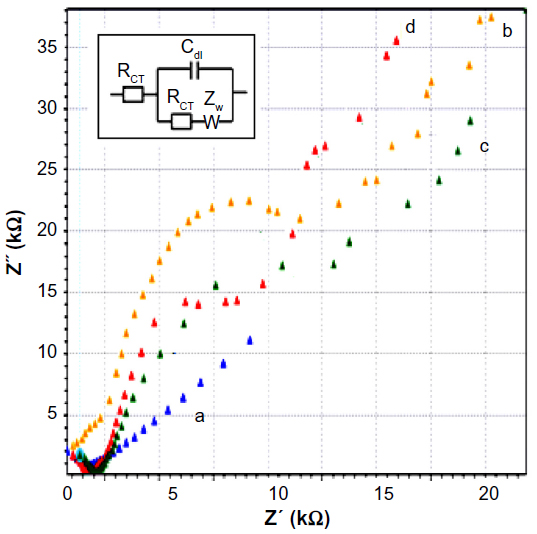 | Figure 9 Reproducibility analysis of electrode surface. |
Conclusion
Pancreatic adenocarcinoma is considered the most fatal malignancy with the lowest survival rate. Early detection is the key in enhancing the survival time for this deadly cancer. Compared to the traditional detection systems, such as CT scan, MRI, and endoscopy, biosensors are nonconventional yet efficient and robust alternatives. Though very little work has been reported to date on PC biosensors, there is a lot of scope in developing sensor systems for early diagnosis of this deadly cancer. This study was an effort to demonstrate our concept of exploring the p16 gene as potential biomarker for PC, as mutation in this gene is indicative of possible cancer onset. We designed a sensing platform that not only detected the gene concentration but also predicted the mutation in the gene sequence. In a nutshell, it can be concluded that this simple, on-chip, GQD-modified platform for p16 gene sensing has the potential to be further developed as a complete on-chip diagnostic kit.
Acknowledgment
PNJ thanks the Department of Science and Technology, Government of India, for an INSPIRE Award grant to carry out this work.
Disclosure
The authors report no conflicts of interest in this work.
References
Chang Y, Yu JS, Chang YT, et al. The utility of a high-throughput scanning biosensor in the detection of the pancreatic cancer marker ULBP2. Biosens Bioelectron. 2013;41:232–237. | |
Katz MH, Savides TJ, Moossa AR, Bouvet M. An evidence-based approach to the diagnosis and staging of pancreatic cancer. Pancreatology. 2005;5(6):576–590. | |
Oto A, Eltorky MA, Dave A, et al. Mimicks of pancreatic malignancy in patients with chronic pancreatitis: correlation of computed tomography imaging features with histopathologic findings. Curr Probl Diagn Radiol. 2006;35(5):199–205. | |
Bezabeh T, Ijare OB, Albiin N, Arnelo U, Lindberg B, Smith ICP. Detection and quantification of d-glucuronic acid in human bile using 1H NMR spectroscopy: relevance to the diagnosis of pancreatic cancer. MAGMA. 2009;22(5):267–275. | |
Chang YT, Wu CC, Shyr YM, et al. Secretome-based identification of ULBP2 as a novel serum marker for pancreatic cancer detection. PLoS One. 2011;6(5):e20029. | |
Chang YF, Wang SF, Huang JC, et al. Detection of swine-origin influenza A (H1N1) viruses using a localized surface plasmon coupled fluorescence fiber-optic biosensor. Biosens. Bioelect. 2010;26:1068–1073. | |
Bausch D, Thomas S, Mino-Kenudson M, et al. Plectin-1 as a novel biomarker for pancreatic cancer. Clin. Cancer. Res. 2011;17(2):302–309. | |
Brand RE, Nolen BM, Zeh HJ, et al. Serum biomarker panels for the detection of pancreatic cancer. Clin. Cancer. Res. 2011;17(4):805–816. | |
Goggins M. Markers of pancreatic cancer: working toward early detection. Clin Cancer Res. 2011;17(4):635–637. | |
Bartsch DK, Sina-Frey M, Lang S, et al. CDKN2A germline mutations in familial pancreatic cancer. Ann Surg. 2002;236(6):730–736. | |
Gerdes B, Ramaswamy A, Ziegler A, et al. p6INK4a is a prognostic marker in resected ductal pancreatic cancer an analysis of p16INK4a, p53, MDM2, an Rb. Ann Surg. 2001;235(1):51–59. | |
Huang L, Goodrow TL, Zhang SY, Klein-Szanto AJ, Chang H, Ruggeri BA. Deletion and mutation analyses of the P16/MTS-1 tumor suppressor gene in human ductal pancreatic cancer reveals a higher frequency of abnormalities in tumor-derived cell lines than in primary ductal adenocarcinomas. Cancer Res. 1996;56(5):1137–1141. | |
Simon B, Weinel R, Hohne M. Frequent alterations of the tumor suppressor genes p53 and DCC in human pancreatic carcinoma. Gastroenterology. 1994;106(6):1645–1651. | |
Ruggeri BA, Huang L, Berger D, et al. Molecular pathology of primary and metastatic ductal pancreatic lesions: analyses of mutations and expression of the p53, mdm-2, and p21/WAF-1 genes in sporadic and familial lesions. Cancer 1997:79(4):700–716. | |
Turner APF. Biosensors: sense and sensibility. Chem Soc Rev. 2013;42:3184–3196. | |
Goode JA, Rushworth JVH, Millner PA. Biosensor regeneration: a review of common techniques and outcomes. Langmuir. 2015; 31(23):6267–6276. | |
Sagadevan S, Periasamy M. Recent trends in nanobiosensors and their applications – a review. Rev Adv Mater Sci. 2014;36:62–69. | |
Pohanka M, Skládal P. Electrochemical biosensors – principles and applications. J Appl Biomed. 2008;6(2):57–64. | |
Romeika JM, Yan F. Recent advances in forensic DNA analysis. J Forensic Res. 2013;S12:001. | |
Lemos H, Huang L, McGaha TL, Mellor AL. Cytosolic DNA sensing via the stimulator of interferon genes adaptor: Yin and Yang of immune responses to DNA. Eur J Immunol. 2014;44(10):2847–2853. | |
Mathur N, Aneja A, Bhatnagar PK, Mathur PC. A new FRET-based sensitive DNA sensor for medical diagnostics using PNA probe and water-soluble blue light emitting polymer. J Sens. 2008;2008:1–6. | |
Baca JT, Severns V, Lovato D, Branch DW, Larson RS. Rapid detection of ebola virus with a reagent-free, point-of-care biosensor. Sensors (Basel). 2015;15(4):8605–8614. | |
Nigam P, Joshi H. On-chip electrochemical detection of Cefepime. Instrum Sci Technol. 2010;38:376–383. | |
Zhang Y. Progress of biodegradable metals. Prog Nat Sci. 2013; 23(5):481–486. | |
Taleat Z, Khoshroo A, Mazloum-Ardakani M. Screen-printed electrodes for biosensing: a review (2008–2013). Microchim Acta. 2014;181(9–10):865–891. | |
Hummers W, Offeman S, Richard E. Preparation of graphitic oxide. JACS. 1958;80(6):1339. | |
Nigam P, Waghmode S, Louis M, Wangnoo S, Chavan P, Sarkar D. Graphene quantum dots conjugated albumin nanoparticles for targeted drug delivery and imaging of pancreatic cancer. J Mater Chem B. 2014;2:3190–3195. | |
Serrano M, Hannon GJ, Beach D. A new regulatory motif in cell-cycle control causing specific inhibition of cyclin D/CDK4. Nature. 1993;366:704–707. | |
Pan D, Zhang Z, Li Z, Wu M. Hydrothermal route for cutting graphene sheets into blue-luminescent graphene quantum dots. Adv Mater. 2010;22(6):734–738. |
Supplementary materials
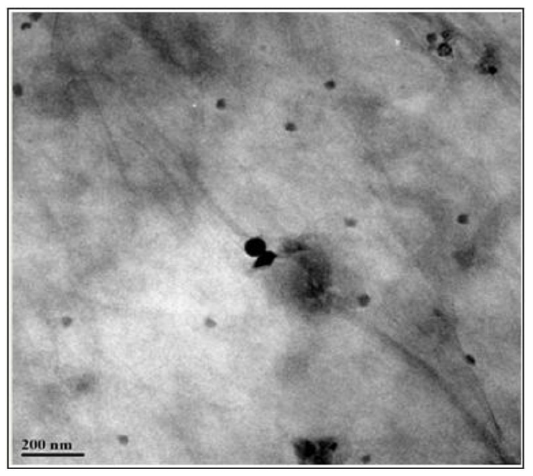 | Figure S1 TEM of GQDs (average size 2–5 nm). |
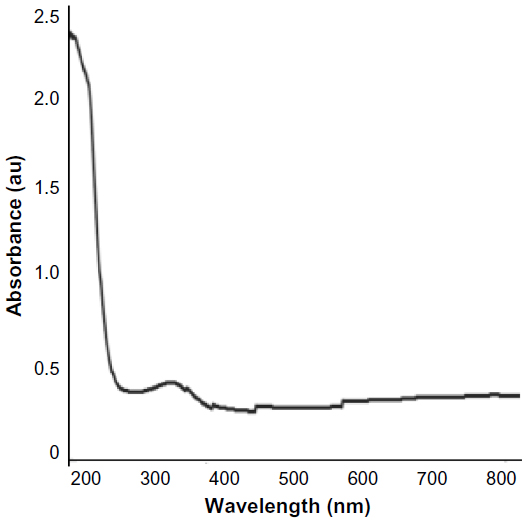 | Figure S2 UV–vis spectra of GQDs solution. Characteristic peaks of GQDs at ~230 nm and 340 nm. |
 © 2016 The Author(s). This work is published and licensed by Dove Medical Press Limited. The
full terms of this license are available at https://www.dovepress.com/terms
and incorporate the Creative Commons Attribution
- Non Commercial (unported, 3.0) License.
By accessing the work you hereby accept the Terms. Non-commercial uses of the work are permitted
without any further permission from Dove Medical Press Limited, provided the work is properly
attributed. For permission for commercial use of this work, please see paragraphs 4.2 and 5 of our Terms.
© 2016 The Author(s). This work is published and licensed by Dove Medical Press Limited. The
full terms of this license are available at https://www.dovepress.com/terms
and incorporate the Creative Commons Attribution
- Non Commercial (unported, 3.0) License.
By accessing the work you hereby accept the Terms. Non-commercial uses of the work are permitted
without any further permission from Dove Medical Press Limited, provided the work is properly
attributed. For permission for commercial use of this work, please see paragraphs 4.2 and 5 of our Terms.