Back to Journals » Nanotechnology, Science and Applications » Volume 14
Graphene Oxide as a Collagen Modifier of Amniotic Membrane and Burnt Skin
Authors Pielesz A, Ślusarczyk C, Sieradzka M, Kukulski T ![]() , Biniaś D
, Biniaś D ![]() , Fryczkowski R
, Fryczkowski R ![]() , Bobiński R
, Bobiński R ![]() , Waksmańska W
, Waksmańska W ![]()
Received 13 October 2021
Accepted for publication 17 November 2021
Published 7 December 2021 Volume 2021:14 Pages 221—235
DOI https://doi.org/10.2147/NSA.S343540
Checked for plagiarism Yes
Review by Single anonymous peer review
Peer reviewer comments 2
Editor who approved publication: Professor Israel Rubinstein
Anna Pielesz,1 Czesław Ślusarczyk,1 Marta Sieradzka,1 Tomasz Kukulski,1 Dorota Biniaś,1 Ryszard Fryczkowski,1 Rafał Bobiński,2 Wioletta Waksmańska2
1University of Bielsko-Biała, Faculty of Materials, Civil and Environmental Engineering, Bielsko-Biała, 43-300, Poland; 2University of Bielsko-Biała, Faculty of Health Sciences, Bielsko-Biała, 43-300, Poland
Correspondence: Anna Pielesz
University of Bielsko-Biała, 2 Ulica Willowa, Bielsko-Biała 43-300, Poland
, Tel +48 33 827-9114
Fax +48 33 8279355
Email [email protected]
Introduction: The aim of this interdisciplinary study was to answer the question of whether active antioxidants as graphene oxide (GO), sodium ascorbate, and L-ascorbic acid modify at a molecular and supramolecular level the tissue of pathological amnion and the necrotic eschar degraded in thermal burn. We propose new solutions of modifiers based on GO that will become innovative ingredients to be used in transplants (amnion) and enhance regeneration of epidermis degraded in thermal burn.
Methods: A Nicolet 6700 spectrophotometer with Omnic software and the EasiDiff diffusion accessory were used in FTIR spectroscopic analysis. A Nicolet Magna-IR 860 spectrometer with an FT Raman accessory was used to record the Raman spectra of the samples. The surface of the samples was examined using a Phenom ProX scanning electron microscope with an energy-dispersive X-ray spectroscopy detector to diagnose and illustrate morphological effects on skin and amnion samples. SAXS measurements were carried out with a compact Kratky camera equipped with the SWAXS optical system.
Results: Characterisation of amide I–III regions, important for molecular structure, on both FTIR and FTR spectra revealed distinct shifts, testifying to organization of protein structure after GO modification. A wide lipid band associated with ester-group vibrations in phospholipids of cell membranes and vibrations of the carbonyl group of GO in the 1,790– 1,720 cm− 1 band were observed in the spectra of thermally degraded and GO-modified epidermis and pathological amnion. SAXS studies revealed that GO caused a significant change in the structure of the burnt skin, but its influence on the structure of the amnion was weak.
Conclusion: Modification of burn-damaged epidermis and pathological amnion by means of GO results in stabilization and regeneration of tissue at the level of molecular (FTIR, FTR) and supramolecular (SAXS) interactions.
Keywords: amnion, burned skin, graphene oxide, FTIR and FTR, SAXS, SEM
Introduction
Extensive research into the use of carbon materials in biological and biomedical studies has been carried out for several years. These materials include carbon nanotubes,1,2 fullerene,3 graphene, graphene derivatives, particularly graphene oxide (GO) and reduced GO.4–7 GO is currently being tested in engineered tissue,8–10 implants,11 diagnostic tools and chips, enhancing biological images,12 drug-delivery carriers,13 bone regeneration,14 and antibacterial materials.15,16 GO is formed by oxidation of graphite in accordance with a variety of procedures. The most popular methods are those described by Brodie et al.17,18 They consist in placing graphite in acid or a mixture of acids (HNO3, H2SO4, H3PO4), which is then treated with a strong oxidant (KClO4, KMnO4). Oxidation results in numerous oxygen-containing functional groups that are located in the plane (hydroxyl, epoxide groups) and at the edges of graphene layers (carbonyl and carboxylic groups).19–21 In fact, the presence of oxygen-containing functional groups significantly affects some properties of GO. Unlike the starting material, ie graphite, GO is hydrophilic, which allows the formation of permanent dispersions in various solvents, including water.22,23 The oxygen-containing functional groups present on the surfaces and edges also affect the chemical reactivity of GO, enabling its functionalization, which increases the range of potential applications in biomedicine also.6,24,25
This interdisciplinary study sought to find structural markers of chemical changes caused by the influence of modifiers (GO and antioxidants) on pathological tissue. While the Fourier-transform infrared (FTIR) and FT Raman (FTR) spectroscopy studies are the primary source of information on the molecular structure of the biopolymer, changes in collagen structure at the supramolecular level are assessed on the basis of results of small-angle X-ray scattering (SAXS), and changes in the topography of the surface of the tested samples are assessed with the use of scanning electron microscopy (SEM). The aim of this interdisciplinary study, which is a continuation of prior work,26 was to answer the question of whether the active antioxidants GO, sodium ascorbate (SA), and L-ascorbic acid (AA) modify at a molecular and supramolecular level the tissue of pathological amnion and the necrotic eschar degraded in thermal burn. We study propose new solutions of modifiers based on GO that will become innovative ingredients to be used in transplants (amnion) and enhance regeneration of epidermis degraded in thermal burn.
Methods
Chemicals and Materials
Materials and reagents used in the examination included solutions with a content of 0.001 g GO. GO was obtained according to the procedure described in an earlier publication.27
Sampling Procedure
Two types of tissue were analyzed in this study: hypotrophic (BS and IW) amnion and samples of epidermis after thermal injury (OH1 and 21S). The parameters of the epidermis degraded in thermal burn were 3% total body-surface area, including 2% III/IV (heat-source burn), and demarcation of necrosis of a 26-year-old woman’s forearm (sample 21S), and the parameters of amniotic samples (BS, IW, OH1) were preterm and/or small-for-gestational-age neonates, first pregnancy and first childbirth, and childbirth by cesarean section. In the case of the BS sample, the patient was diagnosed with pregnancy-induced hypertension, which can lead to structural variability at the molecular level. In the case of the IW sample — second pregnancy, second birth, childbirth by cesarean section — the indication for cesarean section was risk of asphyxia. All amnion samples concerned hypotrophy, ie, pregnancy complication leading to giving birth to a low-birth-weight neonate.
Biopsy material was obtained as a result of necrosis resection. It was placed in 0.9% saline and stored in a freezer for further studies. The samples (fragments of skin or amniotic samples) had been incubated at 20°C for 20 days in modifier solutions. Clean amnion without amniotic fluid or adherent tissue was placed in a sterile container. The sample was frozen (−20°C) and transported to the laboratory in a portable freezer. The material was placed in 0.9% saline and stored in the freezer for further examination. The measurements were performed integrally from the samples (fragments of skin or amniotic samples).
Spectroscopic Analysis
A Nicolet 6700 spectrophotometer (Thermo Fisher Scientific) with Omnic 7.3 software and an EasiDiff diffusion accessory (Thermo Nicolet Industries) were used in FTIR spectroscopic analysis. The subjects of spectral analysis were dry solid samples (skin samples and amnion samples). These had been prepared by drying in a laboratory dryer at 35°C for 3 days. The spectral region was 4,000–500 cm−1 (for samples OH1, AH1 SA GO, and BH1 AA GO), while for the remaining samples the spectral region was 1,800–500 cm−1, resolution 4 cm−1, and the number of scans involved 128 of the solid samples.
A Nicolet Magna-IR 860 spectrometer with an FTR accessory was used to record the Raman spectra of the samples. The solid samples were then irradiated with a 1,064 nm line YAG laser and scattered radiation collected with 4 cm−1 resolution. During the examination, spectra of three repacked samples of each individual sample were averaged to one spectrum. All spectra were obtained using a linear baseline and preprocessed with Fourier smoothing (Grams 32 AI software, Galactic Industries; smoothing degree 50%).
SEM and EDS Analysis
The surface of the samples was examined using SEM (Phenom ProX) with an energy-dispersive X-ray spectroscopy (EDS) detector (Phenom World, Netherlands) to diagnose and illustrate morphological effects on the skin and amnion samples. The samples were placed on an aluminum holder. SEM samples were also coated with a 5 nm layer of gold using an EM ACE200 (Leica Microsystems). Observations were carried out at an accelerating voltage of 5 or 10 kV.
SAXS
SAXS measurements were carried out with a compact Kratky camera equipped with an SWAXS optical system (Hecus-MBraun). A Cu-target X-ray tube operated at U=40 kV and I=25 mA was used as a radiation source (λ=0.154 nm). The primary beam was monochromatized by an Ni filter and pulse-height discrimination. Scattered radiation was recorded in an acquisition time of 900 seconds by means of an MBraun linear position–sensitive detector — PSD 50. The detector had 1,024 channels, with a channel-to-channel distance of 52 μm. SAXS data were collected as a function of the scattering vector s=2sinθ/λ, where 2θ was the scattering angle and λ=0.154nm the X-ray wavelength.
Ethics
In general, analyses involved samples of burnt skin or amniotic membrane collected directly from patients after obtaining approval from the Bioethics Committee of the Beskid Medical Chamber in Bielsko-Biała (2015/12/03/1 for burnt skin and 2016/02/11/4 for amniotic membranes and placenta). For each procedures, the committee analyzed documentation of the researchers’ conclusion, list of centers participating in the study, study protocol, scientific achievements of the research coordinator and principal researchers, researchers’ biographies, informed consent to participate, information for the patient, and management of approvals to conduct the research. All participants gave informed consent to take part in the research, which was in accordance with the Declaration of Helsinki. The exact procedure has been described in an earlier work.26
Results
IR and Raman Analysis
The tissue analyzed in this study comprised fragments of skin (21S and 21S GO) and amniotic samples (BS, IW, OH1 and BS GO, IW GO), as well as amniotic samples rich in spectral striations modified by antioxidants and GO (AH1 SA GO, BH1 AA GO), and are shown in the aggregate spectra of FTIR and FTR (Figure S1). There were clear differences in the intensity and shifts of FTR bands within the hydrogen-bonding region for samples of burn-damaged epidermis: 3,327 cm−1 (21S GO) and 3,336 cm−1 (21S) and shifts toward lower frequencies in the region of amide A and C–H bending (BS GO 3,341 cm−1, IW GO 3,338 cm−1) in relation to starting samples of amnion (BS 3,325 cm−1, IW 3,333 cm−1; Figure S1d). In the case of amnion additionally modified with amniotic antioxidants, wide, intense FTR bands were observed within the entire region of the 3,500–2,700 cm−1 hydrogen bonds, but no clear shift of amide bands A and C–H bending among the OH1 and BH1 AA GO 3,313 cm−1 samples was found. Incubation of amniotic samples in SA (AH1 SA GO) resulted in a substantial increase in the number of FTR spectra fringes within the hydrogen-bonding region. The hydrogen-bonding region in FTIR spectra of these samples was also active: a significant shift to upper frequencies was observed after incubation in antioxidants (OH1 3,297 cm−1, AH1 SA GO 3,313 cm−1, BH1 AA GO 3,334 cm−1; Figure S1a). Widening of the 2,856 cm−1 band and the presence of clear 1,755 and 1,660 cm−1 bands were typical of the 21S GO epidermis samples (Figures 1, S1c and d). For 21S GO samples on FTIR and FTR spectra (Figure 1) of degraded and modified GO epidermis, the presence of a wide lipid band was observed in the 1,790–1,730 cm−1 region and a lack of this band for integral, undamaged dermis (SP). Incubation of samples of damaged epidermis in GO solutions also resulted in separation of the 1,743 cm−1 (21S GO) lipid band in the FTR spectrum (Figure 1B).
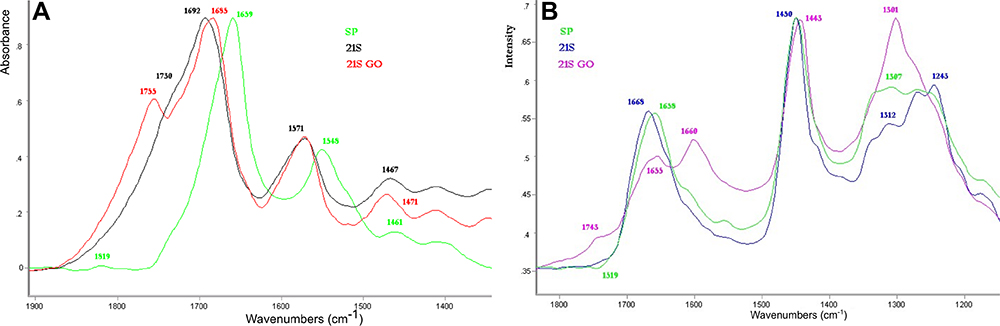 |
Figure 1 (A) FTIR and (B) FTR spectra: fragments of skin (SP, 21S, and 21S GO). |
Analysis of the amniotic FTIR spectra (IW GO, BS GO) revealed a wide lipid band in the 1,791–1,726 cm−1 area with a clear maximum of 1,738 cm−1 for IW GO samples after incubation in GO solutions, while for FTR spectra the maximum occurred for both amniotic samples (IW GO, BS GO) at a frequency of 1,729 cm−1 (Figures 2 and 3). Incubation of amniotic samples in both SA (AH1 SA GO) and AA (BH1 AA GO) resulted in a substantial increase in the number of FTR and FTIR spectra striations Figure 4. The observed modifications caused by exposure to antioxidants (AH1 SA GO, BH1 AA GO) overlapped with the incubating impact of GO, probably associated with GO surface adsorption on the amniotic membrane. The exact location of the bands, visible when decomposed (Figure S2), indicated the presence of additional, characteristic bands: 1,789, 1,734, and 1,704 cm−1 for AH1 SA samples and 1,794, 1,757, and 1,691 cm−1 for BH1 AA samples.
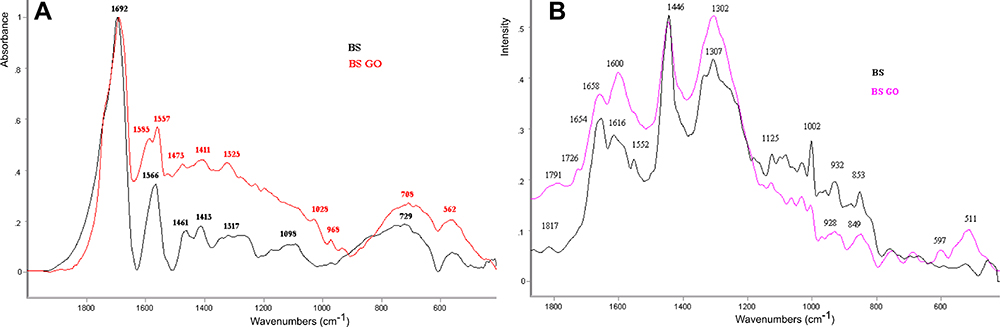 |
Figure 2 (A) FTIR and (B) FTR spectra: amniotic samples BS, BS GO. |
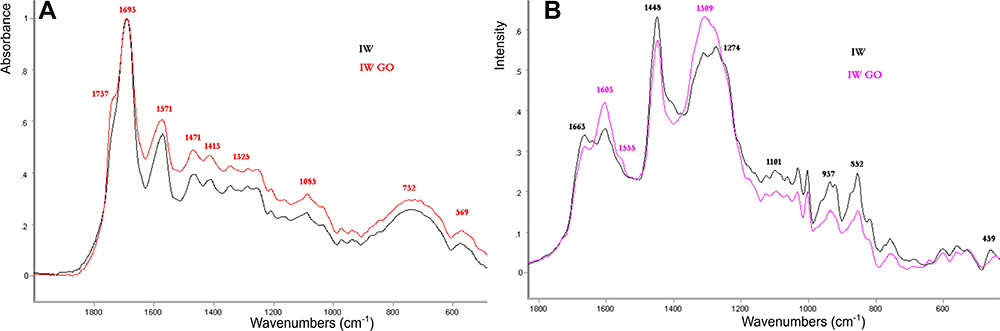 |
Figure 3 (A) FTIR and (B) FTR spectra: amniotic samples IW, IW GO. |
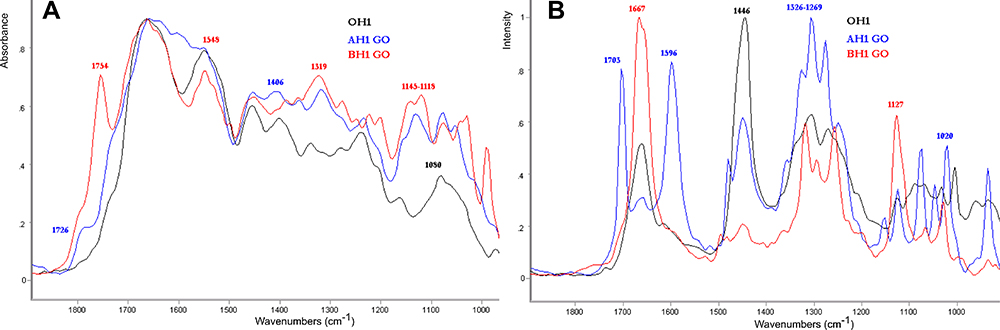 |
Figure 4 (A) FTIR and (B) FTR spectra: amniotic samples OH1, AH1 SA GO, BH1 AA GO. |
Characterization of the amide I–III region, important for molecular structure, in the case of integral, undamaged dermis (SP) on both FTIR and FTR spectra revealed a clear maximum of 1,658 cm−1, characteristic of the ordered α-helix structure (Figure 1). After incubation of damaged epidermis in GO, the amide I region (21S 1,692 cm−1 and 21S GO 1,685 cm−1 in the FTIR spectrum, Figure 1A) was converted to the β-sheet 674–1,695 cm−1 structure (Figure 1A). On FTR tests, the amide I region (21S 1,668 cm−1 and 21S GO 1,666 and 1,655 cm−1 in the FTR spectrum, Figure 1B) was broken down into two bands, 1,666 and 1,655 cm−1, and subjected to clear β-sheet → α-helix conversion. An additional band of approximately 1,600 cm−1 was also separated (Figure 1B). For the FTR spectra of BS, IW, and OH1 amniotic samples, there were clear changes in the amide I/α-helix 1,658–1,663–1,660 cm−1 region, whereas for 21S epidermal samples, the intensity of scattering after treatment with GO increased at a frequency of approximately 1,600 cm−1 (Figures 2–4). Within this range, the change was particularly pronounced for the series of AH1 SA and BH1 AA samples, among which, independently of GO, the samples were additionally incubated in AA and SA antioxidant solutions (AH1 SA GO 1,666 and 1,602 cm−1, BH1 AA GO 1,658 and 1,597cm−1).
For the amide III region, α-helix 1,300–1,340 cm−1, disordered 1,260 cm−1, and β-sheet 1,235–1,259 cm−1 was active on both types of spectroscopy. After incubation of damaged epidermis and amniotic samples in GO, the bands corresponding to the amide III/β-sheet region were converted to α-helix conformations with single band separation. In FTR spectra, postincubation changes were also observed in the 1,315–532 cm−1 fingerprint area. The changes concerned skeletal stretch/α-helix 930–960 cm−1, C–O 1,002–1,100 cm−1, and C–C stretch vibration mode. Changes also occurred in the 508–545 cm−1 region and concerned S–S stretch trans and gauche conformers: C–S stretch gauche conformer approximately 655 cm−1 and C–S stretch trans conformers approximately 704–760 cm−1.
Accurate interpretation of IR spectra for GO is difficult, due to the variety of functional groups that can be formed during oxidation. In FTIR spectra, however, some characteristic band ranges can be distinguished for selected oxygen functional groups. A characteristic area was the wide band at wave numbers of 3,700–2,200 cm−1, which corresponded to the stretching vibrations in the O–H bonds in the hydroxyl groups. Another band at maximum at the wave number ~1,740 cm−1 resulted from stretching vibrations in the C=O bond, which occurs, among others, in such functional groups as aldehyde, ketone, carboxyl, and ester. A clear 1,680–1,510 cm−1 band testified to the presence of skeletal vibrations, which result in stretching of two double C=C bonds in aromatic structures. For wave numbers <1,500 cm−1, the fingerprint region was observed. In the case of GO, precisely due to the possibility of formation of numerous diverse oxygen groups, the overlap of many strands was observed in this range. Among them, there were bands corresponding to C–O stretching vibrations in carboxyl groups (~1,420 cm−1), O–H scissor vibrations in the CO–H plane (~1,410 cm−1) C–O stretching vibrations in epoxy groups (1,250 cm−1), C–O stretching vibrations in the C–OH plane (~1,070 cm−1), C–C skeletal stretching vibrations (~1,070 cm−1), and C–O–C deformation vibrations in epoxy groups (~850 cm−1).28,29 The changes observed in the so-called fingerprint region are partially visible and depend on the individual molecular structure of the analyzed tissue (an exemplary aggregate chart: 21S GO, IW GO, 0.001 g GO serum and GO serum, Figure S3).
The band seeing its maximum at the wave number of 1733 cm−1, for the GO sample, resulted from the stretching vibrations in the C=O bond. The position of this band can be associated with the presence of the 1,753 cm−1 band for the 21S GO sample of the epidermis degraded in thermal burn, which is precisely interpreted on the FTIR spectra (Figure 1A) and FTR spectra (Figure 1B). Analysis of FTIR spectra of the degraded skin and amnion samples after incubation in GO solutions and antioxidants (Figure S3) in comparison with the GO sample revealed a wide lipid band in the area of 1,787–1,726 cm−1 with clear exposure of the band previously assigned to stretching vibrations in the C=O bond, with a maximum at a wave number of 1,733 cm−1 for the GO sample. For FTR spectra of the IW GO and BS GO samples, the maximum occurred for both amniotic samples at frequency of 1,725–1,729 cm−1 (Figures 2 and 3). Comparison of the FTIR spectra of amnion (AH1 SA GO, BH1 AA GO) and 21S GO scalded skin with GO (Figure S3) revealed a clear maximum at 1,755 cm−1 for BH1 and 21S GO samples, derived primarily from incubation in AA, and an extension of the entire band of approximately 1,750 cm−1 for AH1 samples. The SAXS curves, in turn, illustrated the disappearance of the 4.3 nm reflection for the AH1 and BH1 samples, with a new 11 nm reflection observed for the AH1 sample. The main changes caused by the impact of AA and SA antioxidants observed on FTIR spectra overlapped with the incubation effect of GO, which might be connected with the surface adsorption of GO on the amniotic membrane, which can be observed in the presented SEM figures.
SAXS
SAXS is conditioned by the existence of electron-density heterogeneities in the tested sample, which may be caused by a different degree of ordering of macromolecules in this sample. If the ordering is periodic, the interference peaks associated with this periodicity are observed on SAXS curves. In the case of skin and amniotic samples tested in this study, these maxima are related to the structure of collagen and the arrangement of lipid layers. Figure 5 shows a comparison of SAXS curves for skin samples.
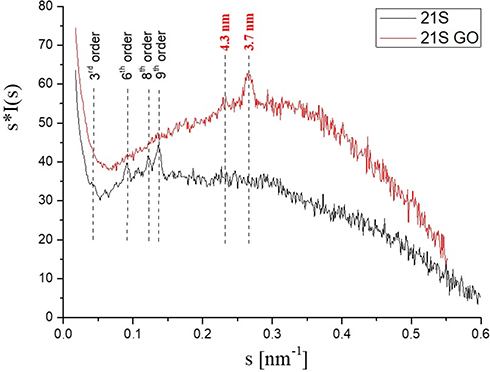 |
Figure 5 Comparison of SAXS curves (s [scattering vector] = 2sinθ/λ) of burnedburnt human skin (21S) and burnedburnt human skin incubated in the presence of graphene oxide (21S GO). |
For burnt human skin (21S), higher-order maxima of the basic characteristic structure of collagen (67 nm) was observed. After incubation of the sample in the presence of GO (21S GO), the peaks of the collagen structure disappeared and two discrete maxima arose, indicating the existence of ordered structures with periodicities of 4.3 nm and 3.7 nm. This effect was associated with the lamellar structure of the stratum corneum (SC), which is the uppermost layer of the epidermis. The SC is composed of protein-enriched corneocytes embedded in lipid-rich extracellular matrix. SC lipids consist mainly of ceramides, free fatty acids, and cholesterol. In accordance with previous SAXS studies, lamellar phases with periodicities of 4.3 nm and 3.7 nm formed in SC lipids containing the short free fatty-acid chains.30 SAXS studies revealed that GO caused a significant change in the structure of the burnt skin.
For two amniotic samples (IW and BS), the effect of incubation in the presence of GO on their structure was small. In the SAXS curves of these samples (Figure 6), two weak interference maxima were observed, indicating the arrangement of the amniotic lipid layers. For incubated samples (IW GO and BS GO), the intensity of these peaks varied slightly. The greatest changes in the structure of the amnion were observed in the case of the combined action of GO with AA or SA. Figure 7 shows a comparison of the SAXS curves for the amnion sample OW1 before and after treatment with these modifiers. The structure of all samples included the order of lipid layers with a period of 6.3 nm. Moreover, in the crude hypotrophic amniotic sample (OW1), there were layers with a period of 4.3 nm. The ordering of the layers disappeared due to the combined action of GO and AA (BH1), wherein no other arrangement of lipids was formed. In contrast, in the case of GO and SA (AH1), the order of the 4.3 nm period also disappeared, but was replaced by the appearance of a new order of lipid layers with periodicity of 11 nm. SAXS investigations showed that the influence of GO itself on the structure of the amniotic membrane was weak. This effect can be greatly enhanced by joint action of GO and other modifiers.
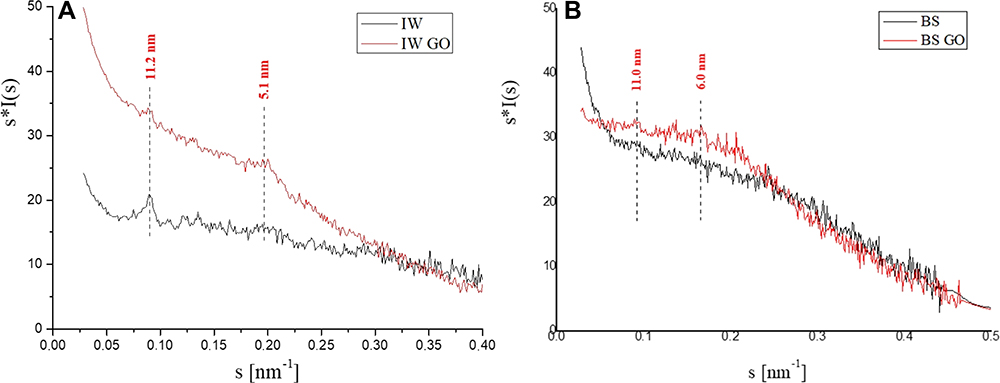 |
Figure 6 Comparison of SAXS curves (s [scattering vector] = 2sinθ/λ): (A) IW with IW GO; (B) BS with BS GO. |
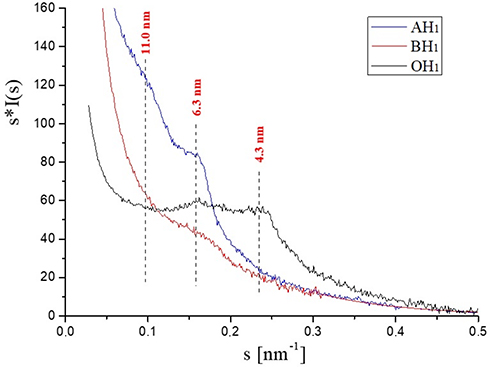 |
Figure 7 Comparison of SAXS curves (s [scattering vector] = 2sinθ/λ) of the amniotic sample OH1 before and after incubation in the presence of the SA, AA, and GO modifiers AH1 SA GO and BH1 AA GO. |
SEM
An SEM study presented in the literature31 depicted the amniotic membrane as a flexible, transparent, nerveless basal membrane without blood vessels. Microscopic details revealed microcosms consisting mainly of collagen fibers on the apical surface of the amniotic epithelium, flattened and concentrated as a result of the drying process. The cross-sectional image revealed the laminar structure of the extracellular matrix, consisting mainly of collagen fibers.31 In turn, another paper32 presented the morphology of the aortic valve membrane in SEM images, in particular accumulation of hydroxyapatite minerals on collagen and elastin fibers, and fragments of damaged proteins.
Microscopic observations were made of the surfaces of amniotic membrane (Figures 8–11) and the burn-degraded epidermis (Figure 12). Example images of amniotic samples (OH1) and samples in the presence of the SA, AA, GO modifiers are characterized by a variety of tissue structure. In Figure 8C, individual BH1 AA GO cells are presented. In the case of samples incubated in antioxidants — SA (AH1 SA) and AA (BH1 AA) — sites with crystallized compounds were visible (Figure 9). IW amnions (Figure 10) are characterized by a greater number of fragments of damaged tissue. The surface of the amniotic membrane was heterogeneous. There are also places of possible adsorption of GO marked in the image. Unambiguous demonstration of the presence of GO was not possible due to fragments of damaged tissue on samples resembling GO, but similar flakes of pure graphene and single-layer flakes of GO have previously been observed after in vitro incubation with neuronal membrane.33,34 There were brighter spots on the BS GO sample, which showed microscopic cracks when seen at greater magnification, and fine-grained structures weare visible around these cracks (Figure 11).
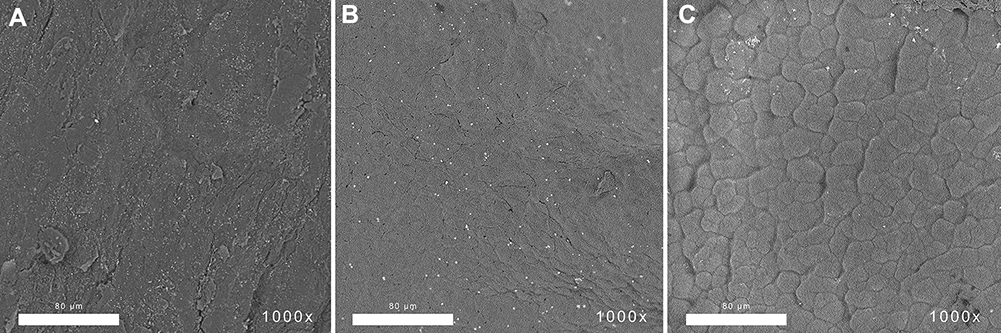 |
Figure 8 SEM images of surfaces of amniotic samples. OH1 in the presence of the SA, AA, and GO modifiers: (A) OH1; (B) AH1 SA GO (C); BH1 AA GO. |
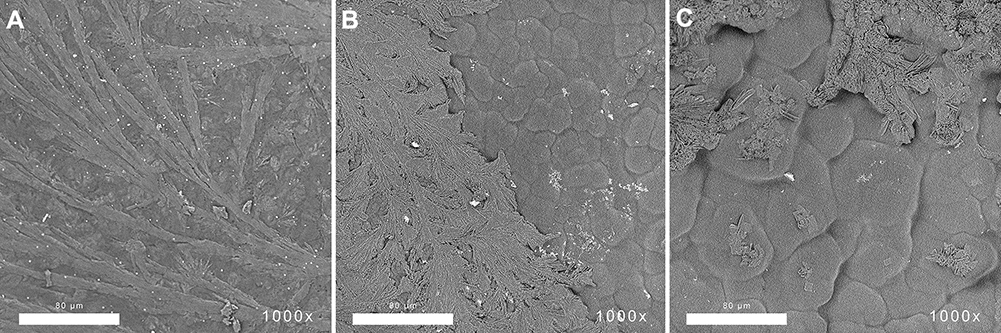 |
Figure 9 SEM images of surfaces of amniotic samples. OH1 in the presence of the SA, AA, and GO modifiers: (A) AH1 SA GO; (B and C) BH1 AA GO. |
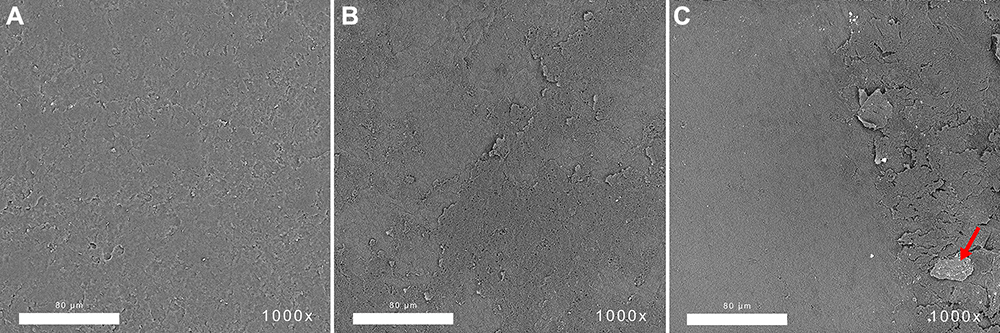 |
Figure 10 SEM images of surfaces of amniotic samples: (A) IW1; (B and C) IW GO. The arrow points to GO. |
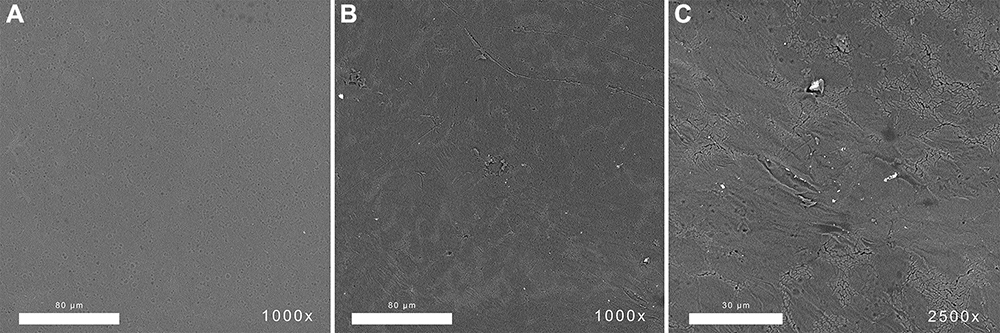 |
Figure 11 SEM images of surfaces of amniotic samples: (A) BS; (B and C) BS GO. |
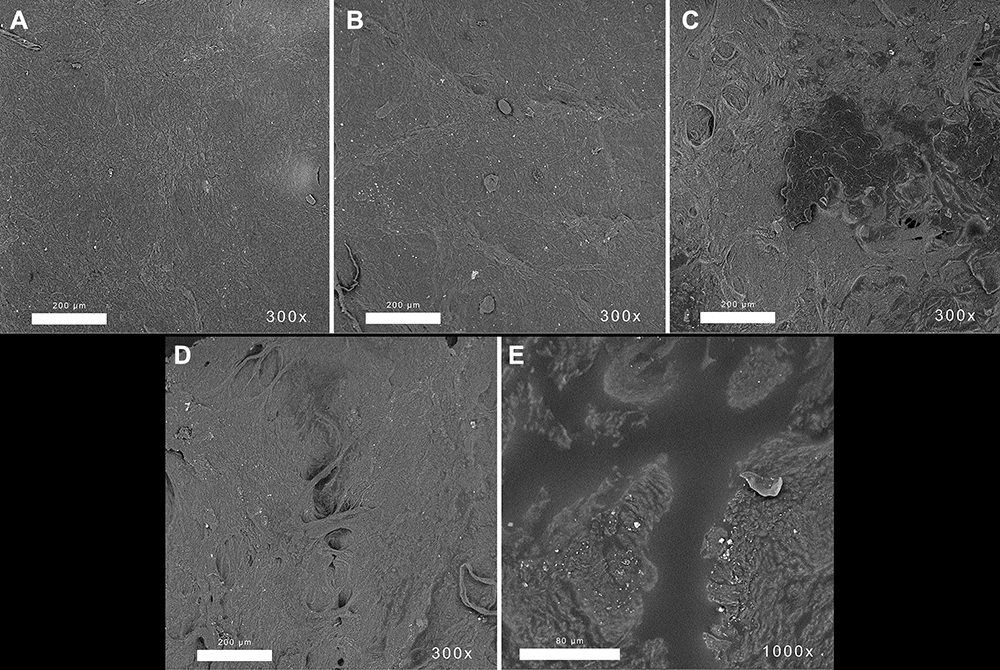 |
Figure 12 SEM images of surfaces of (A and B) burnedburnt human skin (21S) and (C–E) burnedburnt human skin incubated in the presence of graphene oxide. |
Figure 12 present the corrugated surface of the degraded epidermis, with numerous thickenings and fragments of collagen fibers (Figure 12B). Due to the occurrence of skin fragments resembling GO flakes, it was not possible to clearly determine places of GO occurrence. Fragments of significant (third- or fourth-degree burn) thermal damage to the skin embedded in its surface were visible in all skin samples (Figure 12E). Bright spots in the pictures were formed by crystallized saline. Compared to 21S samples, 21S GO samples included more areas that had cicatrized (Figure 12D) or been covered with a GO-adsorption layer. Areas of epidermis exposed by the burn (Figure 12C and E) and likely GO-adsorption spots (Figure 12E) were of particular interest. There were regions with visible connections of injured places (Figure 12D). Figure 13A shows the SEM image of the 21S GO sample at the burn site. EDS examination showed a higher concentration of carbon in the central area of the image (Figure 13B). At the same time, the concentration of oxygen and nitrogen decreased in this area (Figure 13C). The increase in carbon concentration in the darker area indicates tissue carbonization.
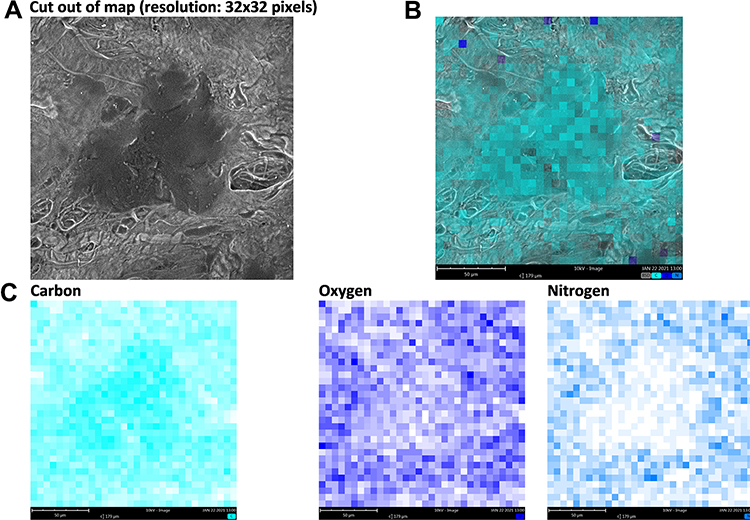 |
Figure 13 (A) SEM image 21S GO and EDS maps; (B) combination; (C) elemental C, O, and N. |
Discussion
In response to the question of whether active antioxidant solutions, and GO solutions in particular, modify at the molecular and supramolecular levels pathological amniotic tissue and necrotic epidermal crust degraded in thermal burn, and the complementarity of the FTIR and FTR35 methods (Figures 1–4), the sensitivity of Raman spectroscopy to the specificity of tissue pathology should be emphasized.36 At the supramolecular level, in the SAXS analysis, information on the structure of collagen and arrangement of lipid layers (Figures 5–7) needs to be accentuated.30 This research is illustrated by SEM images of the surface topography of the studied tissue (Figures 8–12) being changed under the influence of the applied modifiers.
As far as the solution-incubation studies are concerned, observations of the hydrogen-bond area are also worth noting. The spectral susceptibility of the studied tissue to the GO modifier is illustrated in the FTR spectra by the increase in intensity of dispersion of samples exposed to GO solutions (Figure S1d). In particular, incubation of amniotic samples, as well as in SA (AH1 SA GO) and AA, resulted in a shift of bands within the hydrogen-bond region in the FTR spectrum (Figure S1b) and changes in the structure of lipid layers observed on SAXS curves (Figure 7), ie, the order of the 4.3 nm period disappeared, but was replaced by the appearance of a new order of lipid layers with periodicity of 11 nm. This fact indicates the specificity of the formation of hydrogen bonds in the amniotic membrane containing fibrous and nonfibrous collagens, glycoproteins, and proteoglycans. Such a structure promotes processes of exchanging macromolecules and bioactive factors regenerating protein at the molecular level. In this study, for the composite samples of AH1 SA GO (3,080–2,720 cm−1 (Figure S1a) and BH1 AA GO, both types of spectroscopy (FTIR and FTR) constitute a source of information on the nature of molecular interactions with lipids of the amniotic membrane (Figure S1a and b).
Characterization of the amide I–III region, important for molecular structure, in both FTIR and FTR spectra, revealed distinct shifts, testifying to organization of protein structure after GO modification. According to the literature,37,38 FTIR-band positions of the protein secondary structure are assigned thus: β–sheet 1,633 cm−1, 1,532 cm−1, random coil 1,640 cm−1, α-helix 1,655 cm−1, 1,548 cm−1 (α-helix and unordered structure), β-turns 1,672 cm−1 and 1,680 cm−1. A satisfactory prediction within the α-helix, β-sheet, turns, and disorder is achieved by decomposition at only three wave numbers (1,545, 1,611, and 1,655 cm−1),39–43 which allows molecular-level testing of processes of α-helix folding, development, and aggregation. The bands observed near 1,614 cm−1 in IR spectra were due to denatured collagen.44,45 Generally, the amide I band arises from C=O stretching vibration (80%) of the amide C=O group and C–N stretching vibration (20%) at 1,653 cm−1 (amide I C=O of α-helix) and 1,635 cm−1 (amide I C=O of β-sheet).36,46
This aspect of the C=O bonds was confirmed in this study using GO, ie, after incubation of burn-damaged epidermis and samples of pathological amnion in solutions of GO, the amide I and amide III regions were subject to conversion within the β-sheet band in the FTIR spectrum (Figures 1A, 3A, 4A, S2 and S3, Table 1) and to division into two bands, 1,600 and 1,655 cm−1, for 21S GO samples in the FTR spectrum (Figure 1B), as well as to a clear conversion of β-sheet → α-helix to conformation α-helix 1,658 cm−1, characteristic of the structure of undamaged skin (SP). In the case of the FTR spectrum of BS, IW, and OH1 amniotic samples, there were clear changes in the amide I/α-helix 1,658–1,663–1,660 cm−1 area, whereas for 21S epidermal samples the intensity of scattering after treatment with GO increased at a frequency of approximately 1,600 cm−1 (Figure S1). In this respect, the change was particularly pronounced for the series of AH1 SA and BH1 AA tests, where independently of GO, samples were additionally incubated in antioxidant solutions, which confirms the regenerative aspect of these compounds.47,48 SAXS investigations showed that the influence of GO itself on the structure of the amniotic membrane was weak. This effect was greatly enhanced by the joint action of GO and other modifiers (Figure 7). For burnt human skin, higher-order maxima of the basic characteristic structure of collagen (67 nm) were observed. After incubation of the sample in the presence of GO (21S GO), the peaks of the collagen structure disappearrf and two discrete maxima arose, indicating the existence of ordered structures with periodicity of 4.3 nm and 3.7 nm (Figure 5).
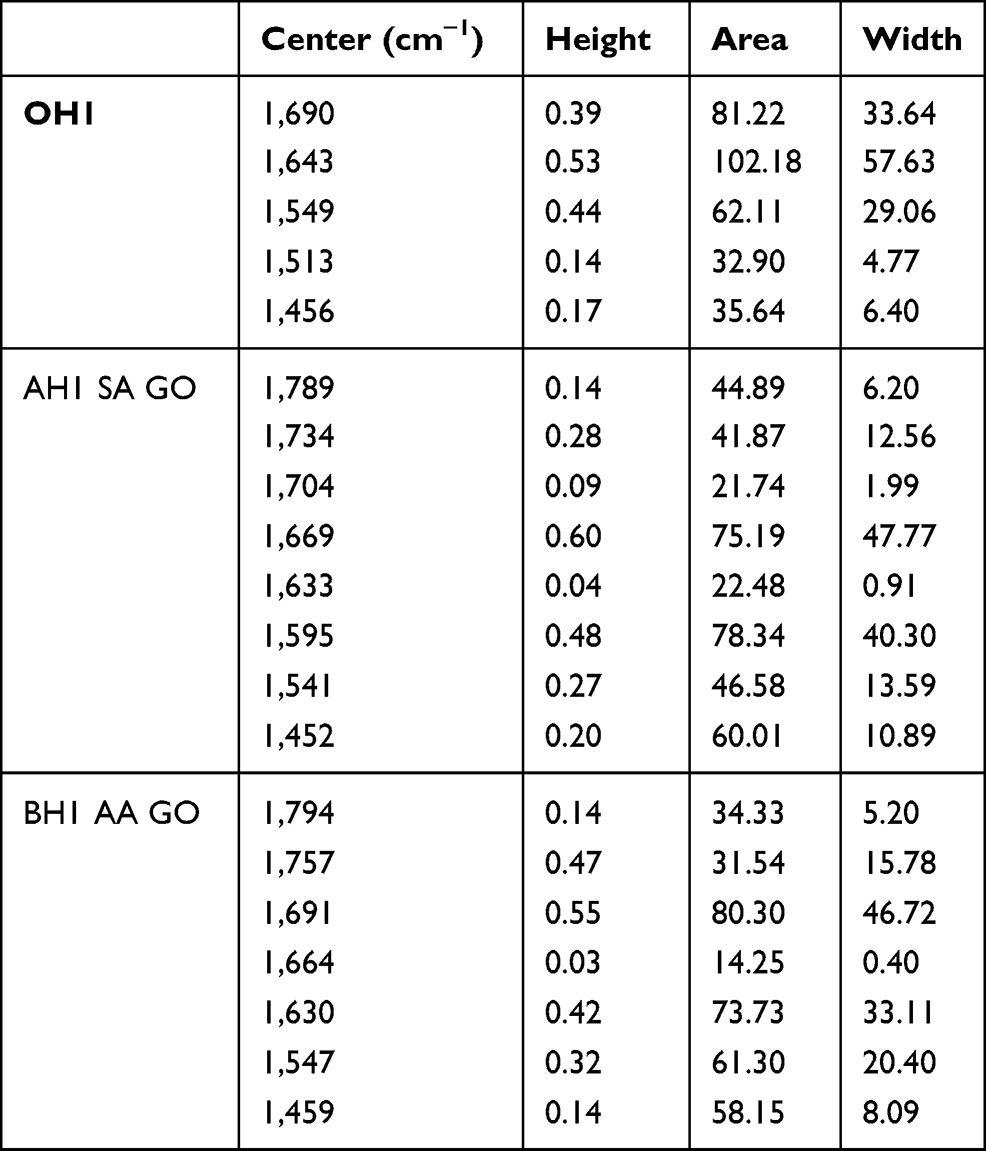 |
Table 1 Analysis of resolved into Gaussian-shaped lipid and amide I–III bands |
Key areas of the FTR spectrum listed in the literature36 include specific bioindicators differentiating healthy tissue from pathological tissue and the composition of lipids in the region of OH stretching symmetric and asymmetric modes of water at around 2,700–3,410 cm−1. The Raman peaks at 1,660, 1,750, 2,854, 2,888–3,000 cm−1 have been assigned to carbonyl ester C=O stretching mode of lipids and the CH stretching vibrations of hydrocarbon chains in lipids.36,38 Moreover, the peaks located between 1,210–1,300 cm−1 and around 1,100 cm−1 have been assigned to nucleic acids and phospholipid collagen in amniotic membrane.49,50 The Raman peaks at 830–890 cm−1 have been attributed to vibrations of CH2 rocking of fatty acid–chain length, 1,660 to C=C stretching of unsaturated lipid bonds, 1,750 and 2,854 to C–H stretching of acyl chains of lipids, 2,888 and 2,926 to CH2 asymmetric stretching of saturated lipid bonds, and 3,009 cm−1 to H–C=C stretching of unsaturated lipid bond to lipids.36,38,46
Particular attention should be paid to the bands near 1,725–1,737, 1,743, and 1,750 cm−1, which are associated with vibrations of ester groups in cell-membrane phospholipids and hydrogen bonds around the carbonyl group of lipids.51,52 It should be emphasized that the frequency of changes observed in these ranges is often an indicator of the lipid-peroxidation process, which is in turn usually the result of so-called oxidative stress caused by the excess of free radicals or thermal or pathological changes in tissue. Changes in intensity within the main lipid band, 1,745 cm−1, analyzed in IR and FTR spectra of modified epidermis degraded in thermal burn (Figures 3 and 4)47,53,54 or electric burn55 are predominantly caused by the presence of AA as the main modifier of the molecular structure of collagen. However, in the case of hypotrophic amniotic samples, changes — as characteristic as for AA — in the broadly understood lipid area occur during the interaction of amniotic membranes with SA.26 What is more, this paper has demonstrated that when using higher concentrations of antioxidants (7%, ie, 3.5 g AA for samples of BH1 AA; Figure 4A) for incubation of amniotic samples, strengthening of the lipid band 1,754 cm−1 was observed, which indicates a surface effect. For lower concentrations of antioxidants (0.001 g for BS SA and BS AA samples), an aspect characteristic of SA, the so-called intermolecular exchange within the membrane, was revealed.26 Analysis of the FTIR and FTR amniotic spectra revealed a wide lipid band in the area of 1,791–1,703 cm−1 with a clear maximum of 1,738 cm−1 for IW GO samples (Figure S1c and d) and 1,754 cm−1 for BH1 AA GO samples (Figure S1a and b) after incubation in GO solutions. On the amniotic FTIR spectrum (IW GO, BS GO), a wide lipid band was observed in the area of 1,791–1,726 cm−1 (Figures 2A and 3A, Table 1), previously attributed in GO studies56 to the vibrations of the carbonyl group around 1,720 cm−1 (Figure S3).
A detailed comparative analysis of thermally degraded human and animal epidermis samples57,58 also informs us that progressive thermal denaturation of samples results in flattening of the 1,750 cm−1 band, which may indicate complete elimination of the natural lipid barrier of the epidermis. In FTIR and FTR studies of the molecular structure of the epidermis, distinct lipid bands (1,730–1,755 cm−1) have been repeatedly noted59,60 for denaturated burnt epidermis and an absence of these bands for undamaged allogenic dermis (Figure 1). For the 21S GO samples in the FTIR and FTR spectra (Figure 1) of degraded and modified GO epidermis, the presence of a wide lipid band was observed in the area of 1,790–1,730 cm−1 and a lack of this band for integral, undamaged dermis (SP). We also found that incubation of samples of the epidermis degraded in thermal burn in GO solutions resulted in the separation of lipid bands: 1,755 cm−1 (FTIR spectrum, Figure 1A) and 1,743 cm−1 (FTR spectrum, Figure 1B). As observed previously,26 during additional heating of a sample (DTG thermogravimetric tests), this band is shifted to lower frequencies during GO processing, which indicates the high thermal stability of the 21S GO sample. Confirmation of these observations was the appearance of 4.3 nm and 3.7 nm peaks on SAXS curves for the 21S GO sample, indicating a reconstruction of the structure of lipid layers (Figure 5).
This paper has offered an analysis of the changes in molecular structure for three series of amniotic samples (IW, BS, OH1). The analysis was guided by the principle that spectral changes for individual samples should always be referred to a blank sample in the series, ie, a sample without modifiers. On individual amniotic samples, the classical lipid band for the OH1 samples was clearly distinguished, while for the IW and BS samples there was no clear inflection, with one wider band overlapping the amide band being formed. Differences in the structure of lipid layers of these samples were also confirmed on SAXS tests (Figures 6 and 7). In the case of skin and amniotic samples tested in the SAXS studies, these maxima were related to the structure of collagen and arrangement of lipid layers (Figures 5–7). Earlier SAXS measurements,47,61 revealed great impact of both AA and orthosilicic acid on the behavior of lamellar phases in SC lipids. These observations testify to the structural diversity of tissue observed repeatedly at the molecular and supramolecular levels, both for samples of epidermis degraded in burns47,48,53,59 and placental60 or amniotic tissue.26 Positions of the amide I–III bands for the OH1 amniotic sample, clearly different from other amniotic samples, constitute the evidence of structural diversity within a homogeneous pathology, ie, hypotrophy. The very process of hypotrophy is known to be structurally coupled with disruption of the collagen-synthesis process and with the conversion within amide I: α-helix ↔ β-sheet ↔ turns ↔ disordered. An additional challenge in the analysis is the fact that the area characteristic of biological protein–lipid membranes was also involved in interactions with GO, though the interactions are difficult to interpret. This area is structurally diverse, both within the hypotrophic amnion tissue: IW, BS, OH1, and for the 21S skin degraded in burns. An important element of this range is the location of the bands that are subject to structural variability, which applies to different series of amnion (IW GO and BS GO), and the modifiers SA and AA (AH1 SA GO, BH1 AA GO), which contributed to their differentiation (Figure S2). The changes observed in this case within the AH1 SA and BH1 AA bands overlapped with the incubation effect of GO, depicted by C–O vibrations stemming from the “oxygen groups” GO 1,050 cm−1 and the ether groups C–O–C 1,026 cm−1, as well as PO2–, approximately 1,085 cm−1.38,62 Nevertheless, the changes in the molecular structure observed in FTR spectra constitute a spectroscopic image of the function of the amnion in the course of various pathologies and at the same time a spectral biomarker that allows for distinguishing between normal and pathological amnion.
For Raman spectra, the entire region (900–500 cm−1) for hydroxyproline, proline, and disulfide bonds may be relevant for observing interactions with GO. Proteins and peptides occurring in nature and containing a disulfide bond have a stretching vibration near 510 cm−1, with other observed bands at 525 and 540 cm−1.63 The 510 cm−1 value for the S–S stretching vibration wave is most commonly found with natural proteins, reflecting the fact that the gauche–gauche–gauche conformation of C–C–S–S–C–C is the most stable form and indicating that naturally occurring proteins and peptides prefer to take the lowest energy conformation of disulfide bonds. This FTR study found that the incubation of amniotic samples in the GO solution clearly exposed the 514 cm−1 (S–S gauche–gauche–gauche) and 525 cm−1 bands (S–S gauche–gauche–trans) for BS GO samples (Figure 2) and 527 cm−1 (S–S gauche–gauche–trans) and 560 cm−1 bands (S–S trans–gauche–trans) for IW GO samples (Figure 3). Analysis of the AH1 SA and BH1 AA series revealed that the presence of SA causes flattening of the disulfide-bond area, whereas the incubation in AA resulted in a slight exposure of the 510 cm−1 (S–S gauche–gauche–gauche) and 528 cm−1 bands (S–S gauche–gauche–trans), as well as formation of the 564 cm−1 band (S–S trans–gauche–trans) (Figure 4). In thermogravimetric studies,26 an increase in the stability of BS GO samples after incubation in GO solutions has been observed, which is confirmed by the presence of bands near 510 cm−1 for the gauche–gauche–gauche conformation of C–C–S–S-C–C, which are considered the most stable form of disulfide bonds. Incubation of samples of burn-damaged epidermis in GO solutions also results in changes in the FTR spectrum in the area of 520–562 cm−1: S–S stretch trans and gauche conformers,63 ie, separation of the S–S gauche–gauche–trans and 561 cm−1 (S–S trans–gauche–trans). It is worth noting that the increase in intensity within disulfide bridges of approximately 515 cm−1 has also been observed for amniotic samples incubated in orthosilicic acid applied in nanoconcentrations to membrane samples.48 It may be associated with replacing sulfur atoms with silicon. However, this mechanism seems not to be dominant, as the intensity of the bands within 500–540 cm−1 decreases significantly. To sum up, it should be added that the presented results on the molecular and supramolecular structure of tissue (hypotrophic amnion and burn-damaged necrotic epidermal eschar) remain in line with the authors’ previous microbiological analyses, which sought new active modifiers supporting the repair process, which involved microbiological assessment of resistance to growth of selected pathogenic microorganisms applied to burn tissue to foresee interactions between AA, iodine solution, orthosilicic acid (7%, and monomeric stabilized orthosilicic acid, stable in highly diluted aqueous solutions) and the so-called active antioxidants, which modified tissue and inhibited the action of selected pathogens. Microbiological studies48 aimed at anticipating anti-inflammatory and antibacterial bioactivity revealed that skin samples and amniotic samples were characterized by good resistance to Enterococcus faecalis, Staphylococcus aureus, and Escherichia coli. Other work26,48 has concluded that pathogenic bacteria commonly causing amniotic infections and growing in burn wounds have particularly good resistance to stabilized orthosilicic acid, lactoferrin and GO.
Conclusion
Analysis of the FTIR and FTR spectra for spectroscopic markers of chemical changes revealed that modification of burn-damaged epidermis and pathological amnion by means of GO resulted in stabilization and regeneration of tissue at the level of molecular interactions. These beneficial changes were visible in the full region of the FTIR and FTR spectra: from hydrogen bonds (about 3,300 cm–1, Figure S1a, b and d), through amides I–III (Figures 1–4), lipid interactions (the 1,753 cm–1 band for the 21S GO sample, Figures 1, 2–4), to changes in the region of disulfide bonds (eg, the most stable form of disulfide bonds, the 510 cm–1 gauche–gauche–gauche conformation band Figure 2B). These observations at the level of supramolecular interactions were confirmed by the appearance of 4.3 nm and 3.7 nm peaks on the SAXS curves for the 21S GO sample, indicating the remodeling of the lipid-layer structure after modification with GO, in line with previous observations in thermogravimetric studies26 and increasing the stability of samples modified with amniotic GO.
Abbreviations
SP, allogenic unburnt full-thickness skin = human skin samples; 21S, burnt human skin; 21S GO, burnt human skin incubated in the presence of graphene oxide; BS, IW, OH1, amniotic samples; BS GO, IW GO, amniotic samples in the presence of graphene oxide; AH1, graphene oxide and sodium ascorbate; BH1, graphene oxide and L-ascorbic acid.
Disclosure
The authors report no conflicts of interest in this work.
References
1. Lamberti M, Pedata P, Sannolo N, Porto S, De Rosa A, Caraglia M. Carbon nanotubes: properties, biomedical applications, advantages and risks in patients and occupationally-exposed workers. Int J Immunopathol Pharmacol. 2015;28:4–13. doi:10.1177/0394632015572559
2. Simon J, Flahaut E, Golzio M. Overview of carbon nanotubes for biomedical applications. Materials. 2019;12(4):624. doi:10.3390/ma12040624
3. Keykhosravi S, Rietveld IB, Couto D, et al. [60] Fullerene for medicinal purposes, a purity criterion towards regulatory considerations. Materials. 2019;12(16):2571. doi:10.3390/ma12162571
4. Santhosh KK, Modak MD, Paik P. Graphene oxide for biomedical applications. J Nanomed Res. 2017;5(6):00136.
5. Yi J, Choe G, Park J, Lee JY. Graphene oxide-incorporated hydrogels for biomedical applications. Polym J. 2020;52:823–837. doi:10.1038/s41428-020-0350-9
6. Tadyszak K, Wychowaniec JK, Litowczenko J. Biomedical applications of graphene-based structures. Nanomaterials. 2018;8(11):944. doi:10.3390/nano8110944
7. Chung C, Kim YK, Shin D, Ryoo SR, Hong BH, Min DH. Biomedical applications of graphene and graphene oxide. Acc Chem Res. 2013;46(10):2211–2224. doi:10.1021/ar300159f
8. Lee SK, Kim H, Shim BS. Graphene: an emerging material for biological tissue engineering. Carbon Lett. 2013;14(2):63–75. doi:10.5714/CL.2013.14.2.063
9. Soliman M, Sadek AA, Abdelhamid HN, Hussein K. Graphene oxide-cellulose nanocomposite accelerates skin wound healing. Res Vet Sci. 2021;137:262–273. doi:10.1016/j.rvsc.2021.05.013
10. Li J, Liu X, Crook JM, Wallace GG. 3D graphene-containing structures for tissue engineering. Mater Today Chem. 2019;14:100199. doi:10.1016/j.mtchem.2019.100199
11. Dong HS, Qi SJ. Realising the potential of graphene-based materials for biosurfaces – a future perspective. Biosurf Biotribol. 2015;1(4):229–248. doi:10.1016/j.bsbt.2015.10.004
12. Garg B, Sung CH, Ling YC. Graphene-based nanomaterials as molecular imaging agents. WIREs Nanomed Nanobiotechnol. 2015;7:737–758. doi:10.1002/wnan.1342
13. Ye Y, Mao X, Xu J, Kong J, Hu X. Functional graphene oxide nanocarriers for drug delivery. Int J Polym Sci. 2019;2019:8453493. doi:10.1155/2019/8453493
14. Ricci R, Leite NCS, da-Silva NS. Graphene oxide nanoribbons as nanomaterial for bone regeneration: effects on cytotoxicity, gene expression and bactericidal effect. Mater Sci Eng C. 2017;78:341–348. doi:10.1016/j.msec.2017.03.278
15. Kumar P, Huo P, Zhang R, Liu B. Antibacterial properties of graphene-based nanomaterials. Nanomaterials. 2019;9(5):737. doi:10.3390/nano9050737
16. Hussein KH, Abdelhamid HN, Zou X, Woo HM. Ultrasonicated graphene oxide enhances bone and skin wound regeneration. Mater Sci Eng C. 2019;94:484–492. doi:10.1016/j.msec.2018.09.051
17. Singh RK, Kumar R, Singh DP. Graphene oxide: strategies for synthesis, reduction and frontier applications. RSC Adv. 2016;6:64993–65011. doi:10.1039/C6RA07626B
18. Park WK, Kim H, Kim T, et al. Facile synthesis of graphene oxide in a Couette-Taylor flow reactor. Carbon N Y. 2015;83:217–223. doi:10.1016/j.carbon.2014.11.024
19. Chua CK, Pumera M. The reduction of graphene oxide with hydrazine: elucidating its reductive capability based on a reaction-model approach. Chem Commun. 2016;52:72–75. doi:10.1039/C5CC08170J
20. Gupta B, Kumar N, Panda K, Kanan V, Joshi S, Visoly-Fisher I. Role of oxygen functional groups in reduced graphene oxide for lubrication. Sci Rep. 2017;7:45030. doi:10.1038/srep45030
21. Shahnawaz Khan M, Abdelhamid HN, Wu HF. Near infrared (NIR) laser mediated surface activation of graphene oxide nanoflakes for efficient antibacterial, antifungal and wound healing treatment. Colloids Surf B Biointerfaces. 2015;127:281–291. doi:10.1016/j.colsurfb.2014.12.049
22. Toda K, Furue R, Hayami S. Recent progress in applications of graphene oxide for gas sensing: a review. Anal Chim Acta. 2015;878:43–53. doi:10.1016/j.aca.2015.02.002
23. Paredes JI, Villar-Rodil S, Martínez-Alonso A, Tascón JMD. Graphene oxide dispersions in organic solvents. Langmuir. 2008;24:10560–10564. doi:10.1021/la801744a
24. Dasari Shareena TP, McShan D, Dasmahapatra AK, Tchounwou PB. A review on graphene-based nanomaterials in biomedical applications and risks in environment and health. Nano-Micro Lett. 2018;10:53.
25. Abdelhamid HN, Wu HF. Multifunctional graphene magnetic nanosheet decorated with chitosan for highly sensitive detection of pathogenic bacteria. J Mater Chem B. 2013;1:3950–3961. doi:10.1039/c3tb20413h
26. Pielesz A, Fabia J, Biniaś W, et al. Graphene oxide and stabilized ortho-silicic acid as modifiers of amnion and burn affected skin – a comparative study. Nanotechnol Sci Appl. 2021;14:49–67. doi:10.2147/NSA.S294412
27. Sieradzka M, Ślusarczyk C, Fryczkowski R, Janicki J. Insight into the effect of graphite grain sizes on the morphology, structure and electrical properties of reduced graphene oxide. J Mater Res Technol. 2020;9:7059–7067. doi:10.1016/j.jmrt.2020.05.026
28. Frogley MD, Wang C, Cinque G, Barber AH. Polarised infrared microspectroscopy of edge-oriented graphene oxide papers. Vib Spectrosc. 2014;75:178–183. doi:10.1016/j.vibspec.2014.07.005
29. Szabó T, Berkesi O, Dékány I. DRIFT study of deuterium-exchanged graphite oxide. Carbon N Y. 2005;43:3186–3189. doi:10.1016/j.carbon.2005.07.013
30. van Smeden J, Janssens M, Gooris GS, Bouwstra JA. The important role of stratum corneum lipids for the cutaneous barrier function. Biochim Biophys Acta. 2014;1841:295–313. doi:10.1016/j.bbalip.2013.11.006
31. Roiu G, Cavalu S, Teusdea A, Petricas-Heredea D, Fratila O. Assessment of antibiotic influence on structural modifications of amniotic membrane by FTIR spectroscopy. Mater Plast. 2020;57(2):191–198. doi:10.37358/MP.20.2.5365
32. Dritsa V, Pissaridi K, Koutoulakis E, Mamarelis I, Kotoulas C, Anastassopoulou J. An infrared spectroscopic study of aortic valve. A possible mechanism of calcification and the role of magnesium salts. In Vivo. 2014;28:91–98.
33. Bramini M, Sacchetti S, Armirotti A, et al. Graphene oxide nanosheets disrupt lipid composition, Ca2+ homeostasis, and synaptic transmission in primary cortical neurons. ACS Nano. 2016;10:7154–7171. doi:10.1021/acsnano.6b03438
34. Wang K, Ruan J, Song H, et al. Biocompatibility of graphene oxide. Nanoscale Res Lett. 2011;6:1–8.
35. Ellis DI, Goodacre R. Metabolic fingerprinting in disease diagnosis: biomedical applications of infrared and Raman spectroscopy. Analyst. 2006;131:875–885. doi:10.1039/b602376m
36. Abramczyk H, Brozek-Pluska B, Surmacki J, Jablonska J, Kordek R. The label-free Raman imaging of human breast cancer. J Mol Liq. 2011;164(1–2):123–131. doi:10.1016/j.molliq.2011.04.021
37. Steiner G, Tunc S, Maitz M, Salzer R. Conformational changes during protein adsorption. FT-IR spectroscopic imaging of adsorbed fibrinogen layers. Anal Chem. 2007;79(4):1311–1316. doi:10.1021/ac061341j
38. Rodriguez-Casado A, Alvarez I, Toledano A, de Miguel E, Carmona P. Amphetamine effects on brain protein structure and oxidative stress as revealed by FTIR microspectroscopy. Biopolymers. 2007;86(5–6):437–445. doi:10.1002/bip.20753
39. Barth A, Zscherp C. What vibrations tell us about proteins. Quart Rev Biophys. 2002;35:369–430. doi:10.1017/S0033583502003815
40. Fabian H, Mäntele W. Infrared spectroscopy of proteins. In: Chalmers JM, Griffiths PR, editors. Handbook of Vibrational Spectroscopy. Chichester: John Wiley & Sons; 2002:3399–3426.
41. Kalnin NN, Baikalov IA, Venyaminov SY. Quantitative IR spectrophotometry of peptide compounds in water (H2O) solutions. III. Estimation of the protein secondary structure. Biopolymers. 1990;30:1273–1280. doi:10.1002/bip.360301311
42. Dousseau F, Pezolet M. Determination of the secondary structure content of proteins in aqueous solutions from their amide I and amide II infrared bands. Comparison between classical and partial least-squares methods. Biochemistry. 1990;29:8771–8779. doi:10.1021/bi00489a038
43. Goormaghtigh E, Ruysschaert JM, Raussens V. Evaluation of the information content in infrared spectra for protein secondary structure determination. Biophys J. 2006;90:2946–2957.
44. Magyari K, Vanea E, Baia L, Simon V. Attachment and conformational changes of collagen on bioactive glass surface. Bio-Med Mater Eng. 2016;27:63–74. doi:10.3233/BME-161567
45. Habermehl J, Skopinska J, Boccafoschi F, et al. Preparation of ready-to-use, stockable and reconstituted collagen. Macromol Biosci. 2005;5:821–828. doi:10.1002/mabi.200500102
46. Ellis DI, Cowcher DP, Ashton L, O’Hagan S, Goodacre R. Illuminating disease and enlightening biomedicine: Raman spectroscopy as a diagnostic tool. Analyst. 2013;138:3871–3884. doi:10.1039/c3an00698k
47. Pielesz A, Ślusarczyk C, Biniaś D, Bobiński R. Sodium ascorbate (SA) and L-ascorbic acid (AA) as modifiers of burn affected skin – a comparative analysis. Spectrochim Acta A. 2019;209:55–61. doi:10.1016/j.saa.2018.10.021
48. Pielesz A, Biniaś D, Machnicka A, et al. Stabilized ortho-silicic acid as a modifier of tissue – preliminary comparative biomaterial studies. J Biomed Nanotechnol. 2020;16:1–10. doi:10.1166/jbn.2020.2912
49. Sripriya R, Kumar R. Denudation of human amniotic membrane by a novel process and its characterizations for biomedical applications. Prog Biomater. 2016;5:161–172. doi:10.1007/s40204-016-0053-7
50. Cinta-Pinzaru S, Cavalu S, Leopold N, Petry R, Kiefer W. Raman and surface enhanced Raman spectroscopy of tempyo spin labelled ovalbumin. J Mol Structure. 2001;565:225–229. doi:10.1016/S0022-2860(00)00930-3
51. Jamin N, Miller L, Moncuit J, Fridman WH, Dumas P, Teillaud JL. Chemical heterogeneity in cell death: combined synchrotron IR and fluorescence microscopy studies of single apoptotic and necrotic cells. Biopolymers. 2003;72:366–373. doi:10.1002/bip.10435
52. Holman HYN, Martin MC, Blakely EA, Bjornstad K, McKinney WR. IR spectroscopic characteristics of cell cycle and cell death probed by synchrotron radiation based Fourier Transform IR spectromicroscopy. Biopolymers. 2000;57:329–335. doi:10.1002/1097-0282(2000)57:6<329::AID-BIP20>3.0.CO;2-2
53. Pielesz A, Biniaś D, Sarna E, et al. Active antioxidants in ex-vivo examination of burn wound healing by means of IR and Raman spectroscopies—preliminary comparative research. Spectrochim Acta A. 2017;173:924–930. doi:10.1016/j.saa.2016.10.046
54. Pielesz A, Biniaś D, Bobiński R, Sarna E, Paluch J, Waksmańska W. The role of topically applied L-ascorbic acid in ex-vivo examination of burn-injured human skin. Spectrochim Acta A. 2017;185:279–285. doi:10.1016/j.saa.2017.05.055
55. Pielesz A, Gawłowski A, Biniaś D, et al. A histologic perspective on electrical and thermal burn-injured human skin. Adv Skin Wound Care. 2019;32(5):1–7. doi:10.1097/01.ASW.0000554446.59743.9f
56. Baskoro F, Wong CB, Kumar SR, et al. Graphene oxide-cation interaction: inter-layer spacing and zeta potential changes in response to various salt solutions. J Memb Sci. 2018;554:253–263. doi:10.1016/j.memsci.2018.03.006
57. Pielesz A. Temperature-dependent FTIR spectra of collagen and protective effect of partially hydrolysed fucoidan. Spectrochim Acta A. 2014;118:287–293. doi:10.1016/j.saa.2013.08.056
58. Pielesz A, Paluch J. Fucoidan as an inhibitor of thermally induced collagen glycation examined by acetate electrophoresis. Electrophoresis. 2014;35:2237–2244. doi:10.1002/elps.201400178
59. Pielesz A, Machnicka A, Gawłowski A, Fabia J, Sarna E, Biniaś W. Inhibitors of thermally induced burn incidents – characterization by microbiological procedure, electrophoresis, SEM, DSC and IR spectroscopy. Analyst. 2015;140:4599–4607. doi:10.1039/C5AN00329F
60. Pielesz A, Bobiński R, Biniaś D, et al. FT Raman spectroscopy in the evaluation of biomarkers of normal and pathological placenta tissue. Mol Cell Biochem. 2019;458:125–132. doi:10.1007/s11010-019-03536-5
61. Pielesz A, Gawłowski A, Fabia J, Ślusarczyk C, Sarna E. Inhibitors of thermally induced burn incidents – the examinations of the flammability, TGA, SAXS and SEM methods. Polimery. 2017;62(11–12):806–811. doi:10.14314/polimery.2017.806
62. Boydston-White S, Gopen T, Houser S, Bargonetti J, Diem M. Infrared spectroscopy of human tissue. V. Infrared spectroscopic studies of myeloid leukemia (ML‐1) cells at different phases of the cell cycle. Biospectroscopy. 1999;5:219–227. doi:10.1002/(SICI)1520-6343(1999)5:4<219::AID-BSPY2>3.0.CO;2-O
63. Akhtar W, Edwards HGM, Farwell DW, Nutbrown M. Fourier-transform Raman spectroscopic study of human hair. Spectrochim Acta A. 1997;53:1021–1031. doi:10.1016/S1386-1425(97)00055-3
 © 2021 The Author(s). This work is published and licensed by Dove Medical Press Limited. The
full terms of this license are available at https://www.dovepress.com/terms
and incorporate the Creative Commons Attribution
- Non Commercial (unported, 3.0) License.
By accessing the work you hereby accept the Terms. Non-commercial uses of the work are permitted
without any further permission from Dove Medical Press Limited, provided the work is properly
attributed. For permission for commercial use of this work, please see paragraphs 4.2 and 5 of our Terms.
© 2021 The Author(s). This work is published and licensed by Dove Medical Press Limited. The
full terms of this license are available at https://www.dovepress.com/terms
and incorporate the Creative Commons Attribution
- Non Commercial (unported, 3.0) License.
By accessing the work you hereby accept the Terms. Non-commercial uses of the work are permitted
without any further permission from Dove Medical Press Limited, provided the work is properly
attributed. For permission for commercial use of this work, please see paragraphs 4.2 and 5 of our Terms.