Back to Journals » Diabetes, Metabolic Syndrome and Obesity » Volume 13
Glycosylated Hemoglobin A1c Improves the Performance of the Nomogram for Predicting the 5-Year Incidence of Type 2 Diabetes
Received 7 March 2020
Accepted for publication 30 April 2020
Published 21 May 2020 Volume 2020:13 Pages 1753—1762
DOI https://doi.org/10.2147/DMSO.S252867
Checked for plagiarism Yes
Review by Single anonymous peer review
Peer reviewer comments 2
Editor who approved publication: Prof. Dr. Juei-Tang Cheng
Chun-Ming Ma, Fu-Zai Yin
Department of Endocrinology, The First Hospital of Qinhuangdao, Qinhuangdao 066000, Hebei Province, People’s Republic of China
Correspondence: Fu-Zai Yin
Department of Endocrinology, The First Hospital of Qinhuangdao, No. 258 Wenhua Road, Qinhuangdao 066000, Hebei Province, People’s Republic of China
Tel +86-335-5908368
Fax +86-335-3032042
Email [email protected]
Aim: To develop and validate a model, which combines traditional risk factors and glycosylated hemoglobin A1c (HbA1c) for predicting the risk of type 2 diabetes (T2DM).
Materials and Methods: This is a historical cohort study from a collected database, which included 8419 males and 7034 females without diabetes at baseline with a median follow-up of 5.8-years and 5.1-years, respectively. Multivariate cox regression analysis was used to select significant prognostic factors of T2DM. Two nomograms were constructed to predict the 5-year incidence of T2DM based on traditional risk factors (Model 1) and traditional risk factors plus HbA1c (Model 2). C-index, calibration curve, and time-dependent receiver-operating characteristic (ROC) curve were conducted in the training sets and validation sets.
Results: In males, the C-index was 0.824 (95% CI: 0.795– 0.853) in Model 1 and 0.867 (95% CI: 0.840– 0.894) in Model 2; in females, the C-index was 0.830 (95% CI: 0.770– 0.890) in Model 1 and 0.856 (95% CI: 0.795– 0.917) in Model 2. The areas under curve (AUC) in Model 2 for prediction of T2DM development were higher than in Model 1 at each time point. The calibration curves showed excellent agreement between the predicted possibility and the actual observation in both models. The results of validation sets were similar to the results of training sets.
Conclusion: The proposed nomogram can be used to accurately predict the risk of T2DM. Compared with the traditional nomogram, HbA1c can improve the performance of nomograms for predicting the 5-year incidence of T2DM.
Keywords: type 2 diabetes, nomogram, risk factor, glycosylated hemoglobin A1c
Introduction
Diabetes mellitus is one of the major public health problems worldwide. According to the International Diabetes Federation statistics, there were approximately 463 million adults (20–79 years) with diabetes in 2019.1
Type 2 diabetes (T2DM) is the most common type of diabetes that accounts for approx. 90% of all diabetes cases. The risk factors of T2DM include age, obesity, family history of diabetes, unhealthy lifestyle, and hypertension. Nomogram is a graphic calculating device that can be used to predict the prognosis of diseases. Nomogram integrates clinical risk factors and provides individualized risk predictions for each subject. So far, several nomograms have been developed, which may identify high-risk individuals, thus promoting timely intervention and reducing the incidence of T2DM.2–4
The glycosylated hemoglobin A1c (HbA1c) reflects the average level of blood sugar over the past 2 to 3 months. It is an important indicator for evaluating diabetes control. HbA1c is a good risk predictor for T2DM.5 In the present study, we developed and validated a nomogram combined with traditional risk factors and HbA1c to predict the risk of T2DM.
Materials and Methods
Data Source
In the current study, we obtained data from Dryad (http://www.datadryad.org/). The raw data were shared by Okamura et al.6 The details of the study were described in a previous paper.7 Briefly, all data were extracted from a population-based longitudinal study, which was performed in the Murakami Memorial Hospital in Japan. The study included 15,464 participants (8430 males and 7034 females) without diabetes at baseline, who were recruited between 2004 and 2015. The median follow-up durations were 5.8-year for males and 5.1-year for females.
Data Description
Variables from the raw data included baseline information, follow up duration, and incident T2DM. The baseline information regarding age, gender, smoking and alcohol habits, physical activity, body mass index (BMI), systolic blood pressure (SBP), diastolic blood pressure (DBP), HbA1c, fasting plasma glucose (FPG), triglyceride (TG) and high-density lipoprotein cholesterol (HDL-C) were extracted.
Definitions
The appropriate cutoff value for age was determined by X-tile software version 3.6.1. Obesity was defined as a BMI of ≥25 kg/m.2,7 Elevated blood pressure was defined as SBP≥130mmHg and/or DBP≥85mmHg. Dyslipidemia was defined as TG ≥150 mg/dL and/or HDL ≤40 mg/dL. Elevated FPG was defined as FPG≥100 mg/dL. Elevated HbA1c was defined as HbA1c ≥5.6%.8 Incident T2DM was defined as HbA1c ≥6.5%, FPG ≥126 mg/dL or self-reported.7
Statistical Analyses
The statistical analyses were performed using SPSS 24.0 software (SPSS Inc, Chicago, IL) and R software version 3.6.1 (R Development Core Team; http://www.r-project.org). P<0.05 was considered statistically significant.
For nomogram development and validation, 70% of the participants were randomly assigned to the training set and 30% to the validation set. The characteristics of the two sets were described and compared using the chi-square test or t-test. Variables for the development of the nomogram were selected by using multivariate Cox regression analysis. To evaluate the effect of HbA1c on incident T2DM, we developed two models: Model 1 was developed based on traditional risk factors at baseline; while in Model 2, HbA1c was added.
Nomogram validation consisted of two parts, discrimination, and calibration. Discrimination was evaluated using a concordance index (C-index). The time-dependent receiver-operating characteristic (ROC) curve analysis was carried out to assess the predictive performance at different times. Calibration was evaluated using the calibration plot.
Results
Characteristics of the Development and Validation Sets
In males, 11 participants without HDL-C were excluded, and 8419 males were entered in this study. The participants were divided into males and females because proportional hazards could not be assumed. The participants were randomly divided into training sets and validation sets (males: training set n=5893, validation set n=2526; females: training set n=4914, validation set n=2120). No statistically significant differences in baseline characteristics, follow-up time, and T2DM incidence were observed between the two sets (Tables 1 and 2).
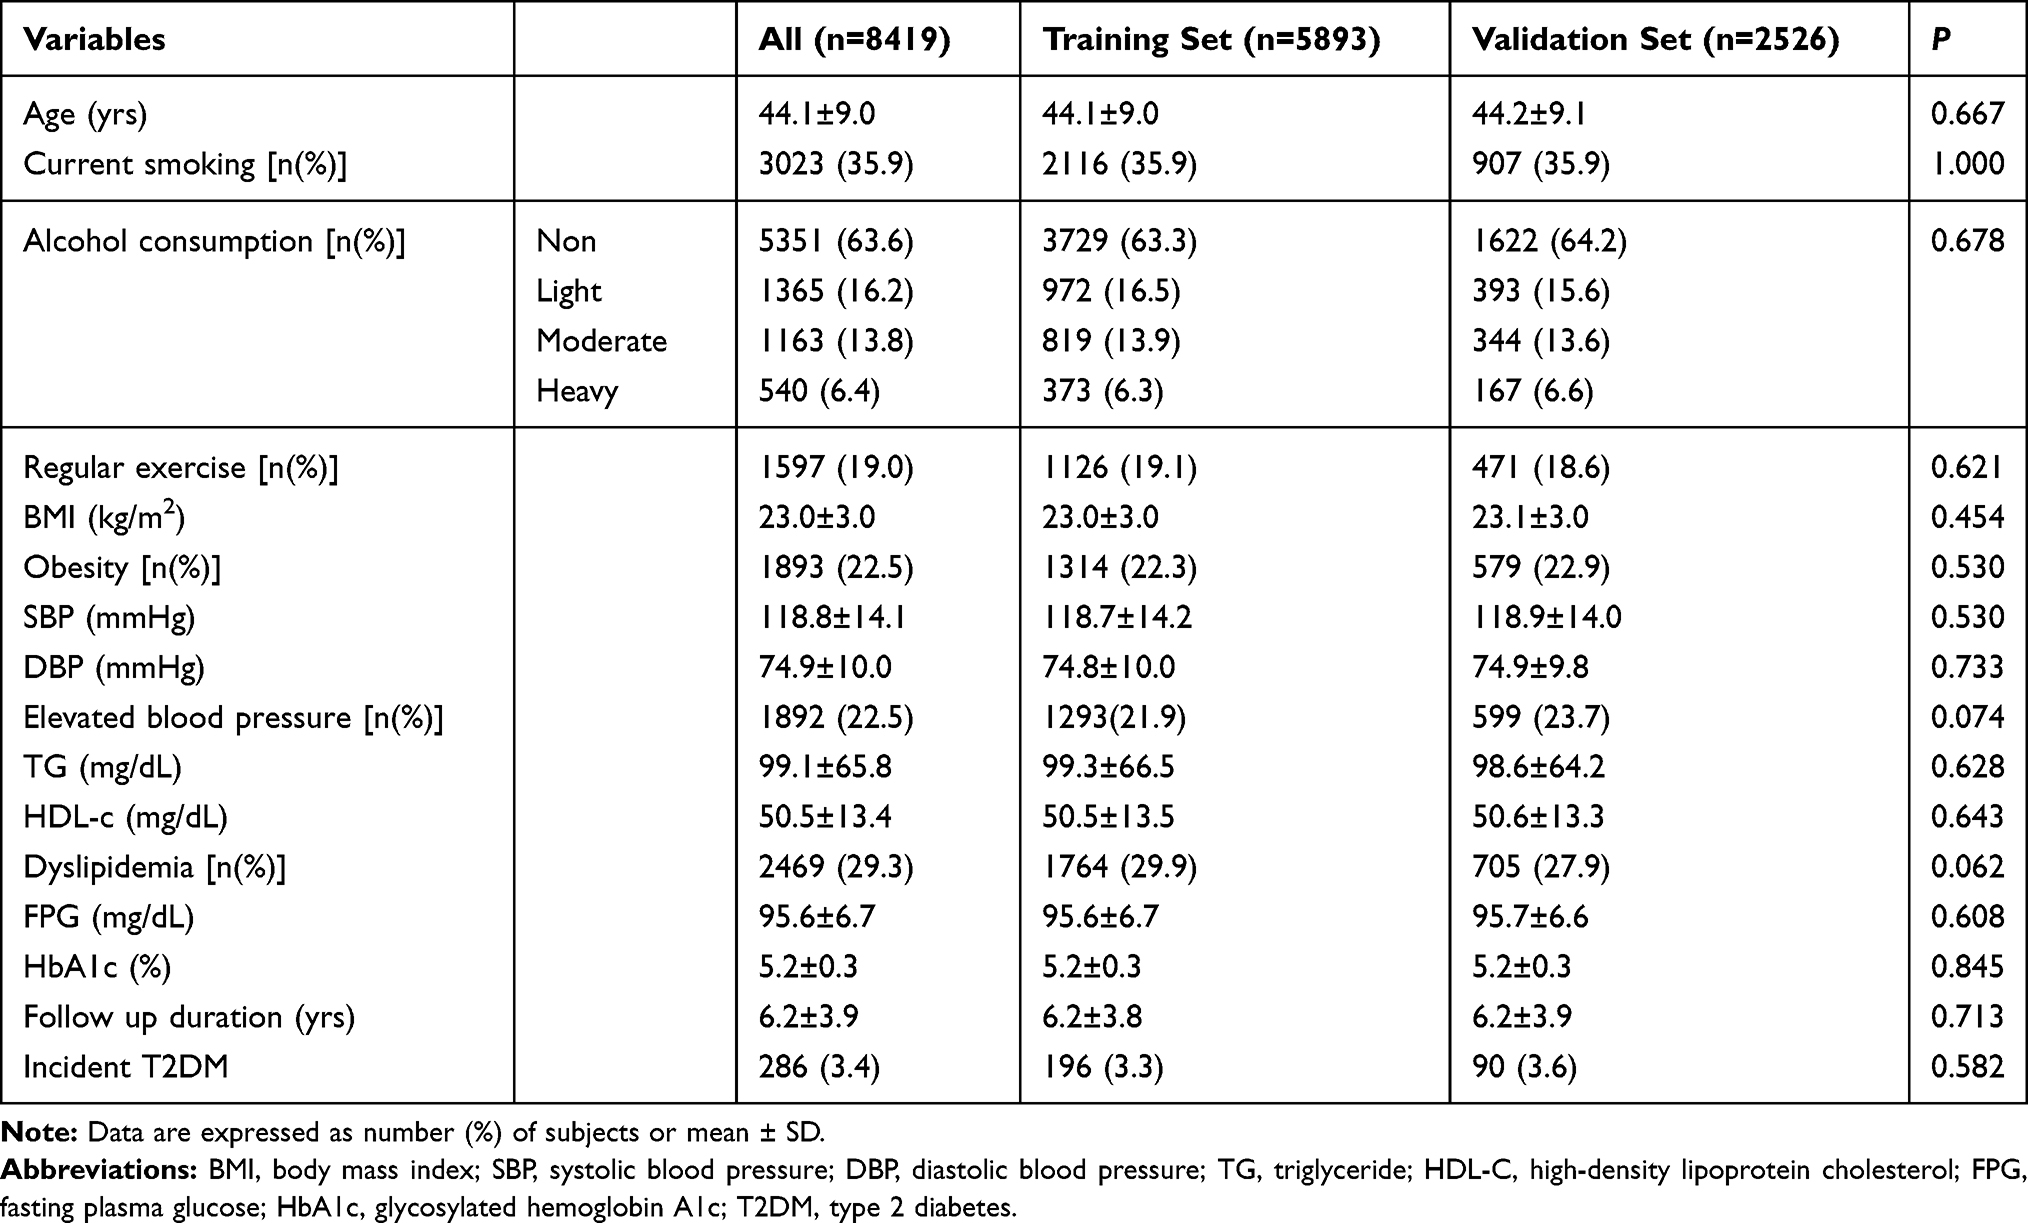 |
Table 1 Characteristics of the Training and Validation Set in Males |
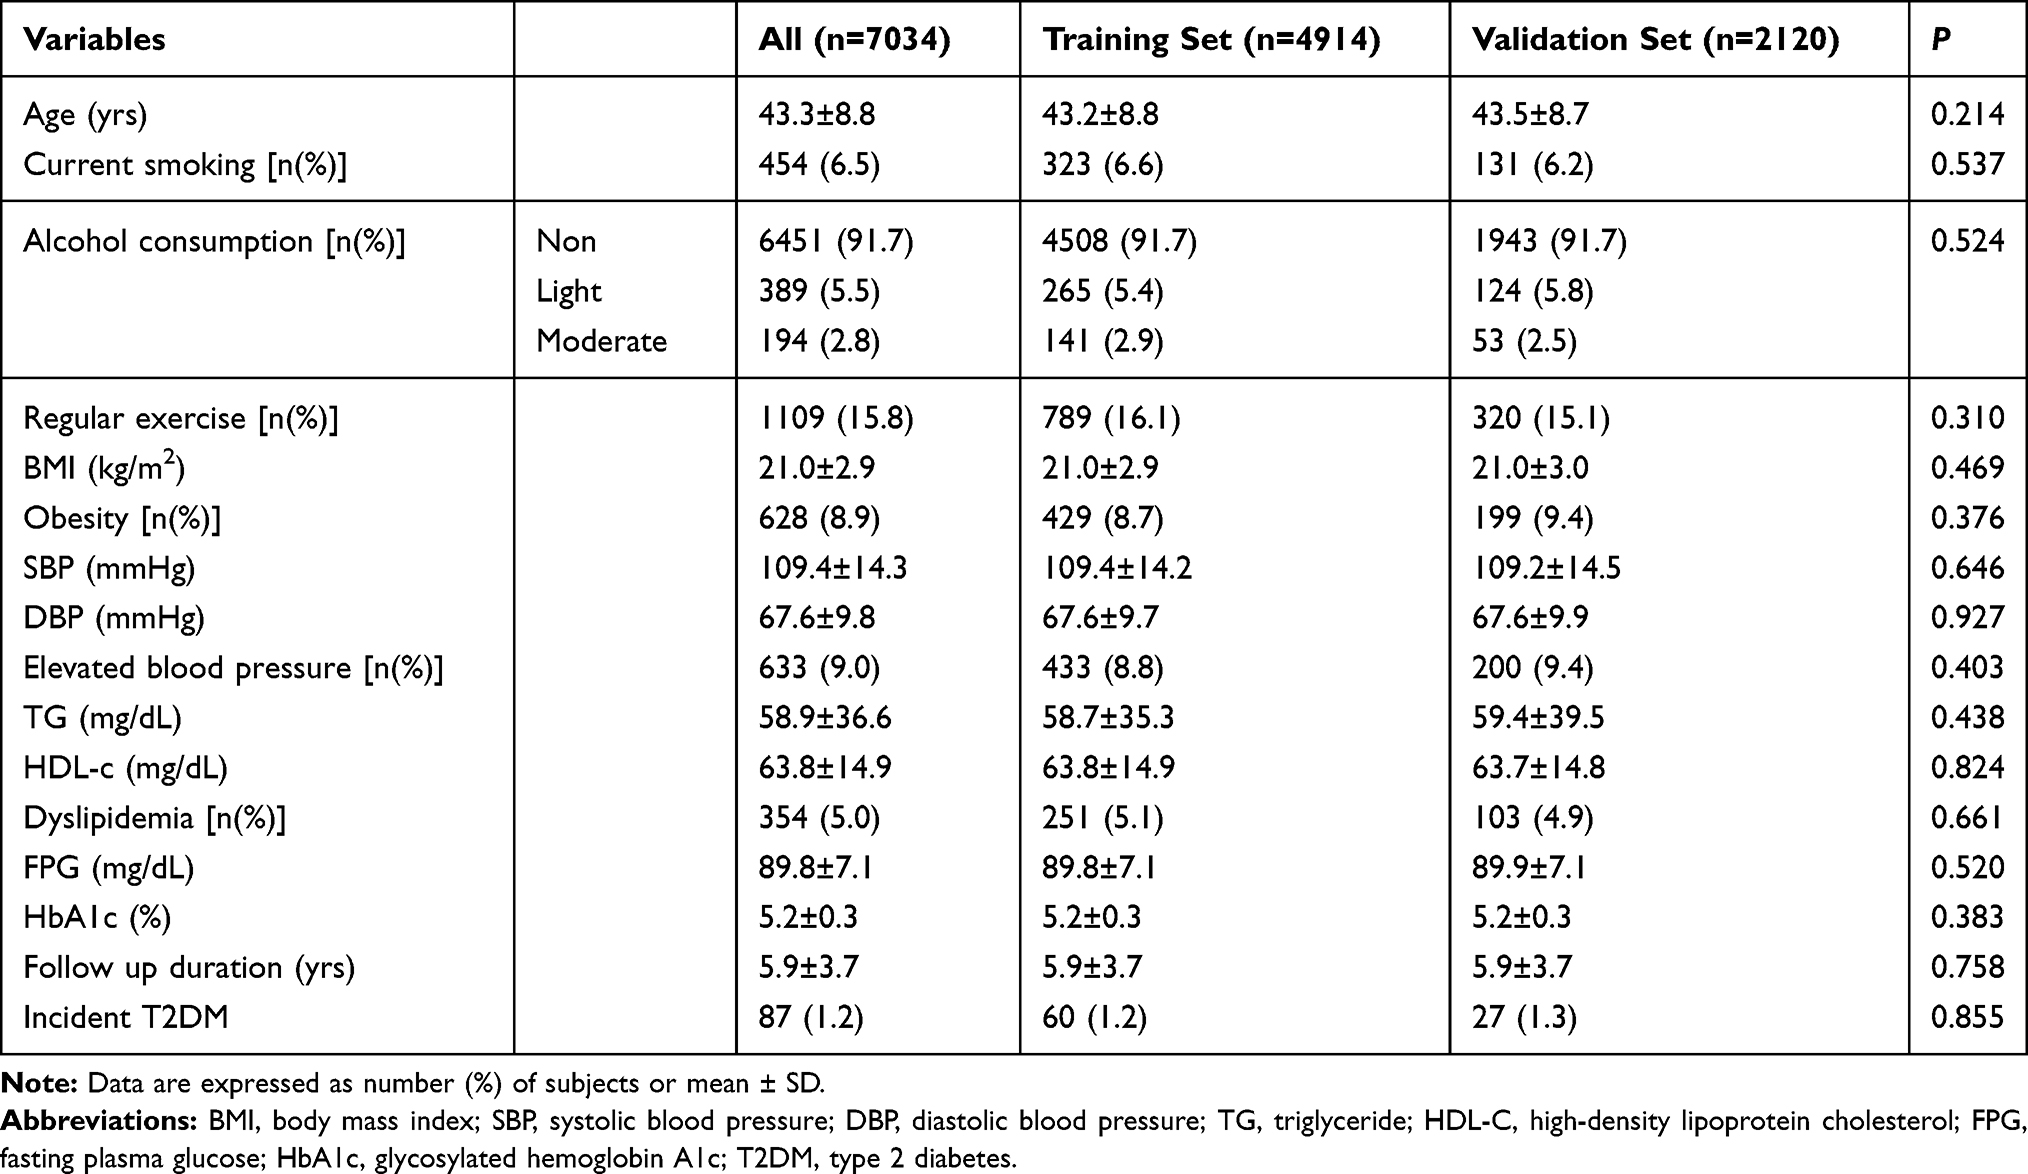 |
Table 2 Characteristics of the Training and Validation Set in Females |
Independent Predictors in the Training Set
The predictors were determined according to two steps. During the first step, the univariate analyses were performed. Multivariate analyses were performed using the significant risk factors determined in the univariate analysis (Tables 3 and 4). Multivariate Cox regression analysis (Model 1) showed that age, current smoking, obesity, elevated blood pressure, dyslipidemia, and elevated FPG were independent risk predictors in males, while age, current smoking, obesity, and elevated FPG were independent risk predictors in females. In Model 2, elevated HbA1c were added both in males and females.
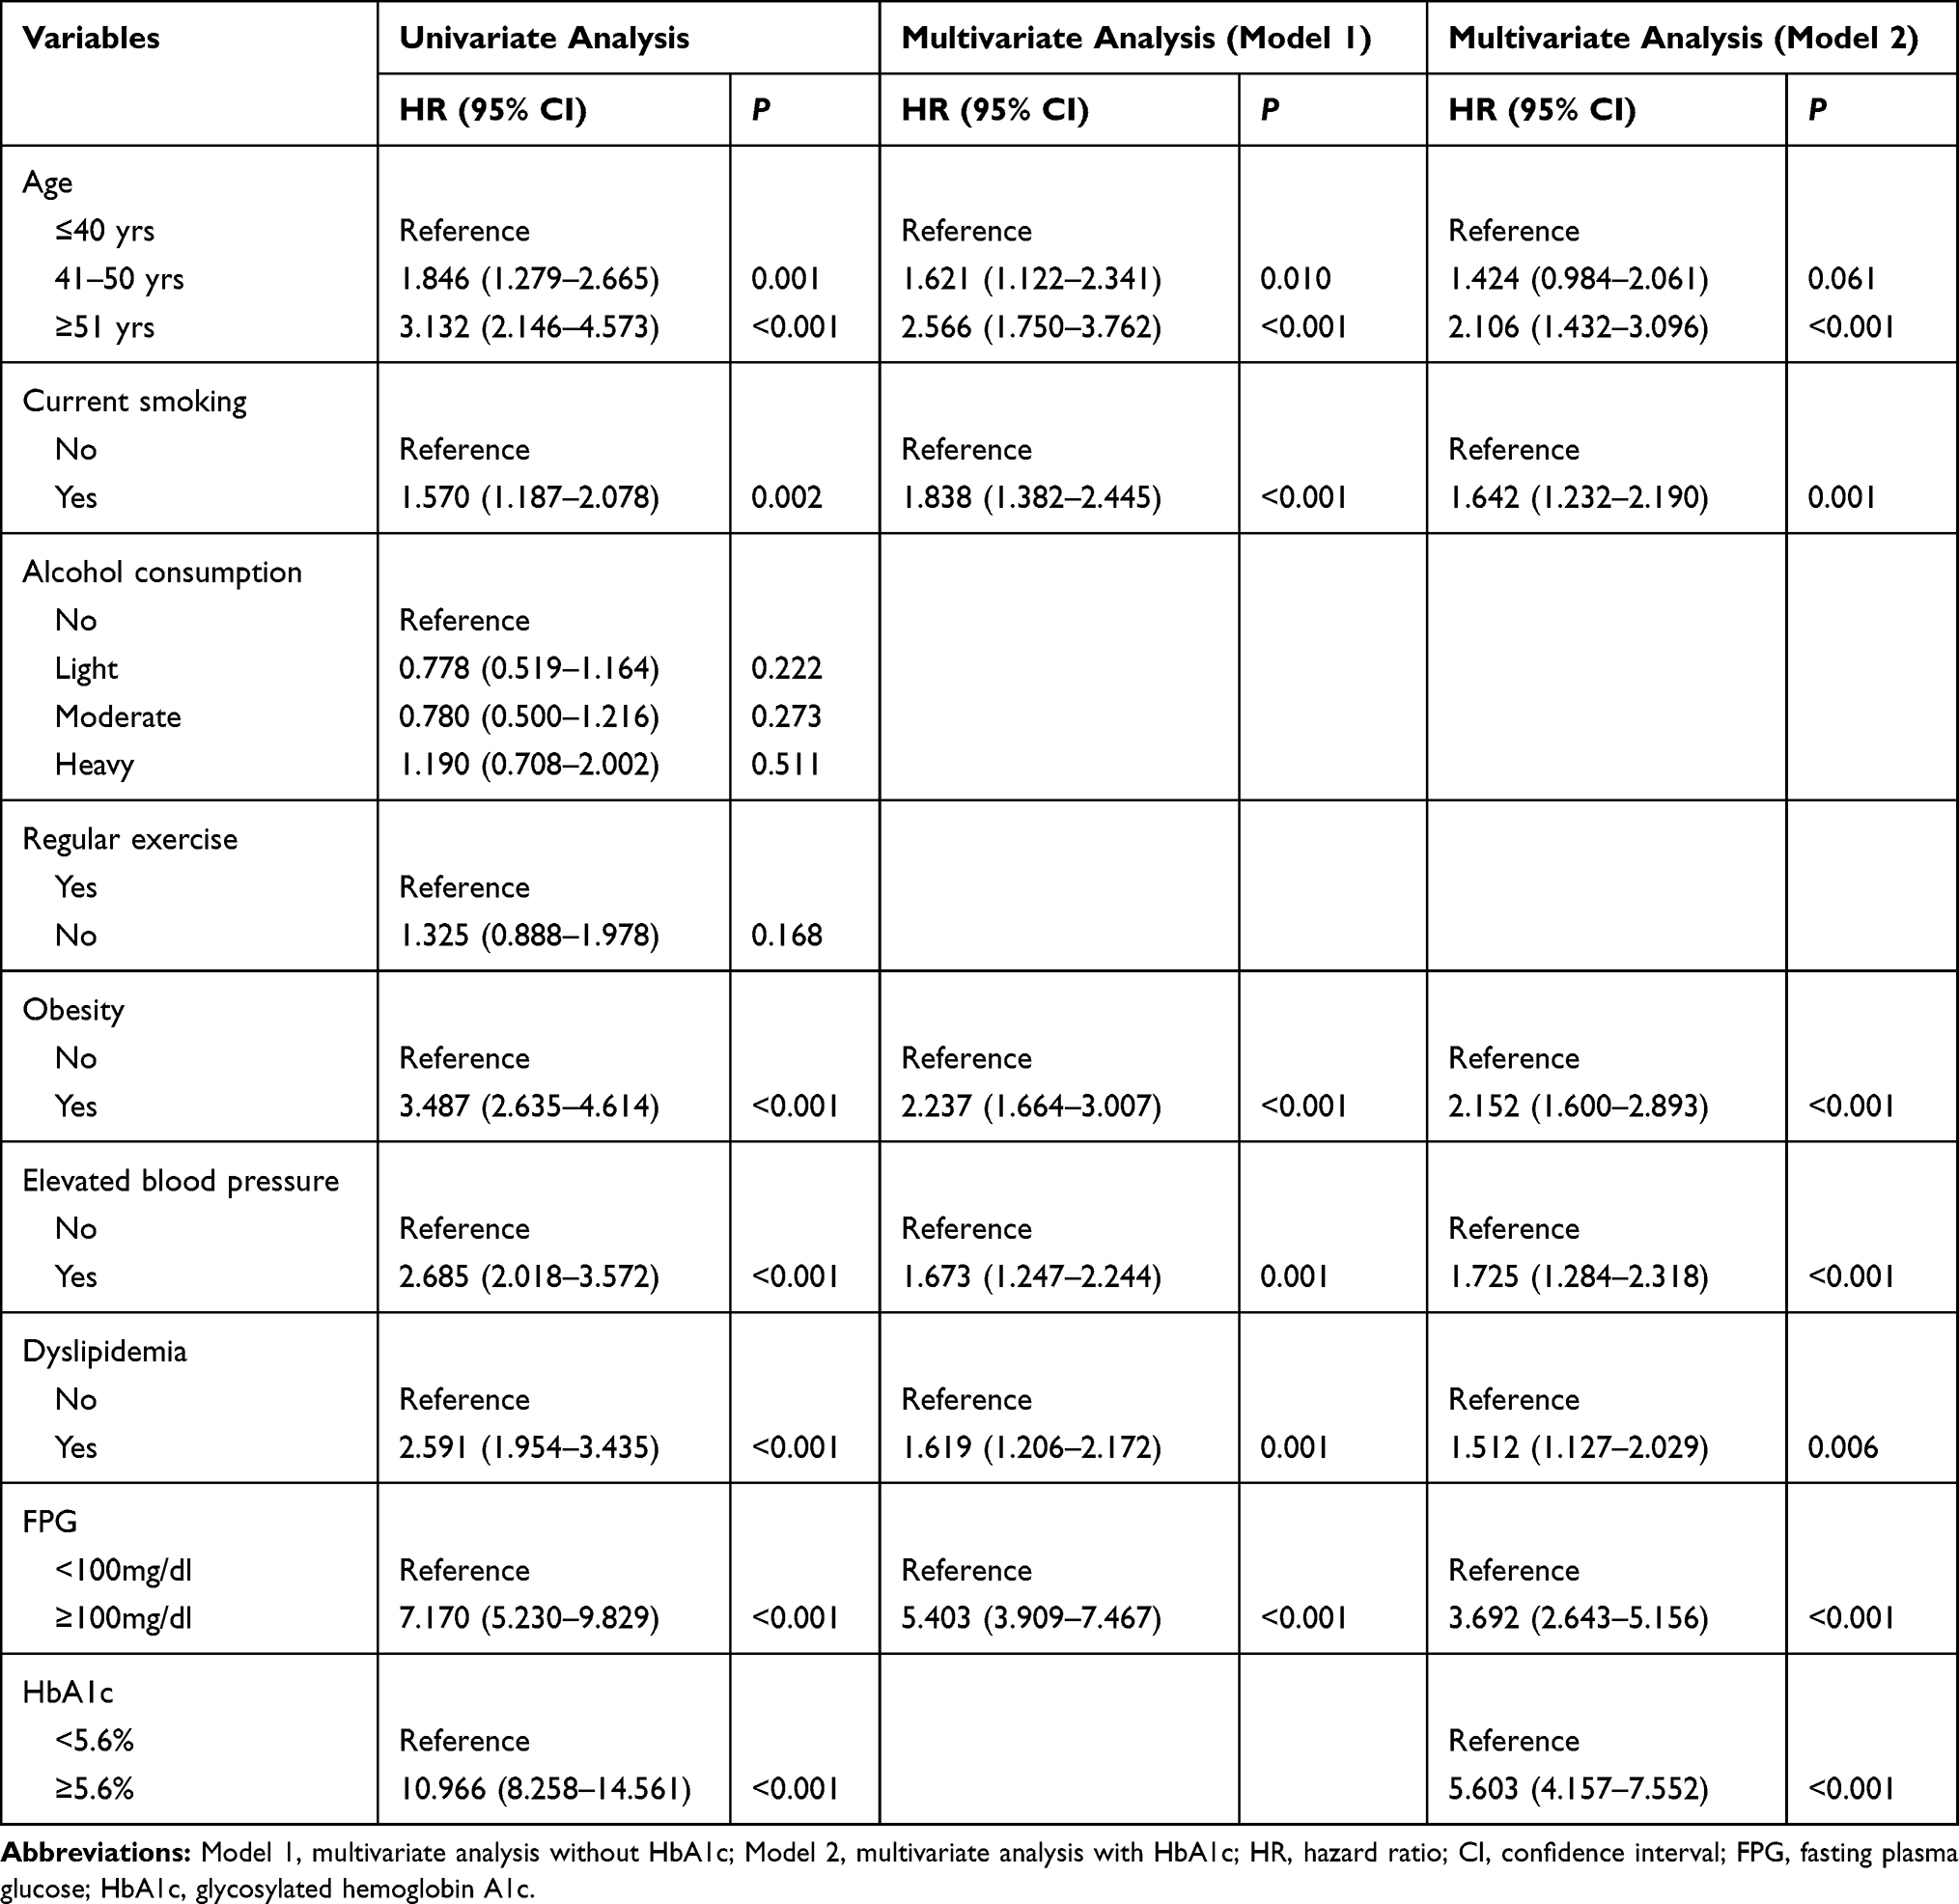 |
Table 3 Risk Factors of Type 2 Diabetes According to the Cox Proportional Hazards Regression Model in Males |
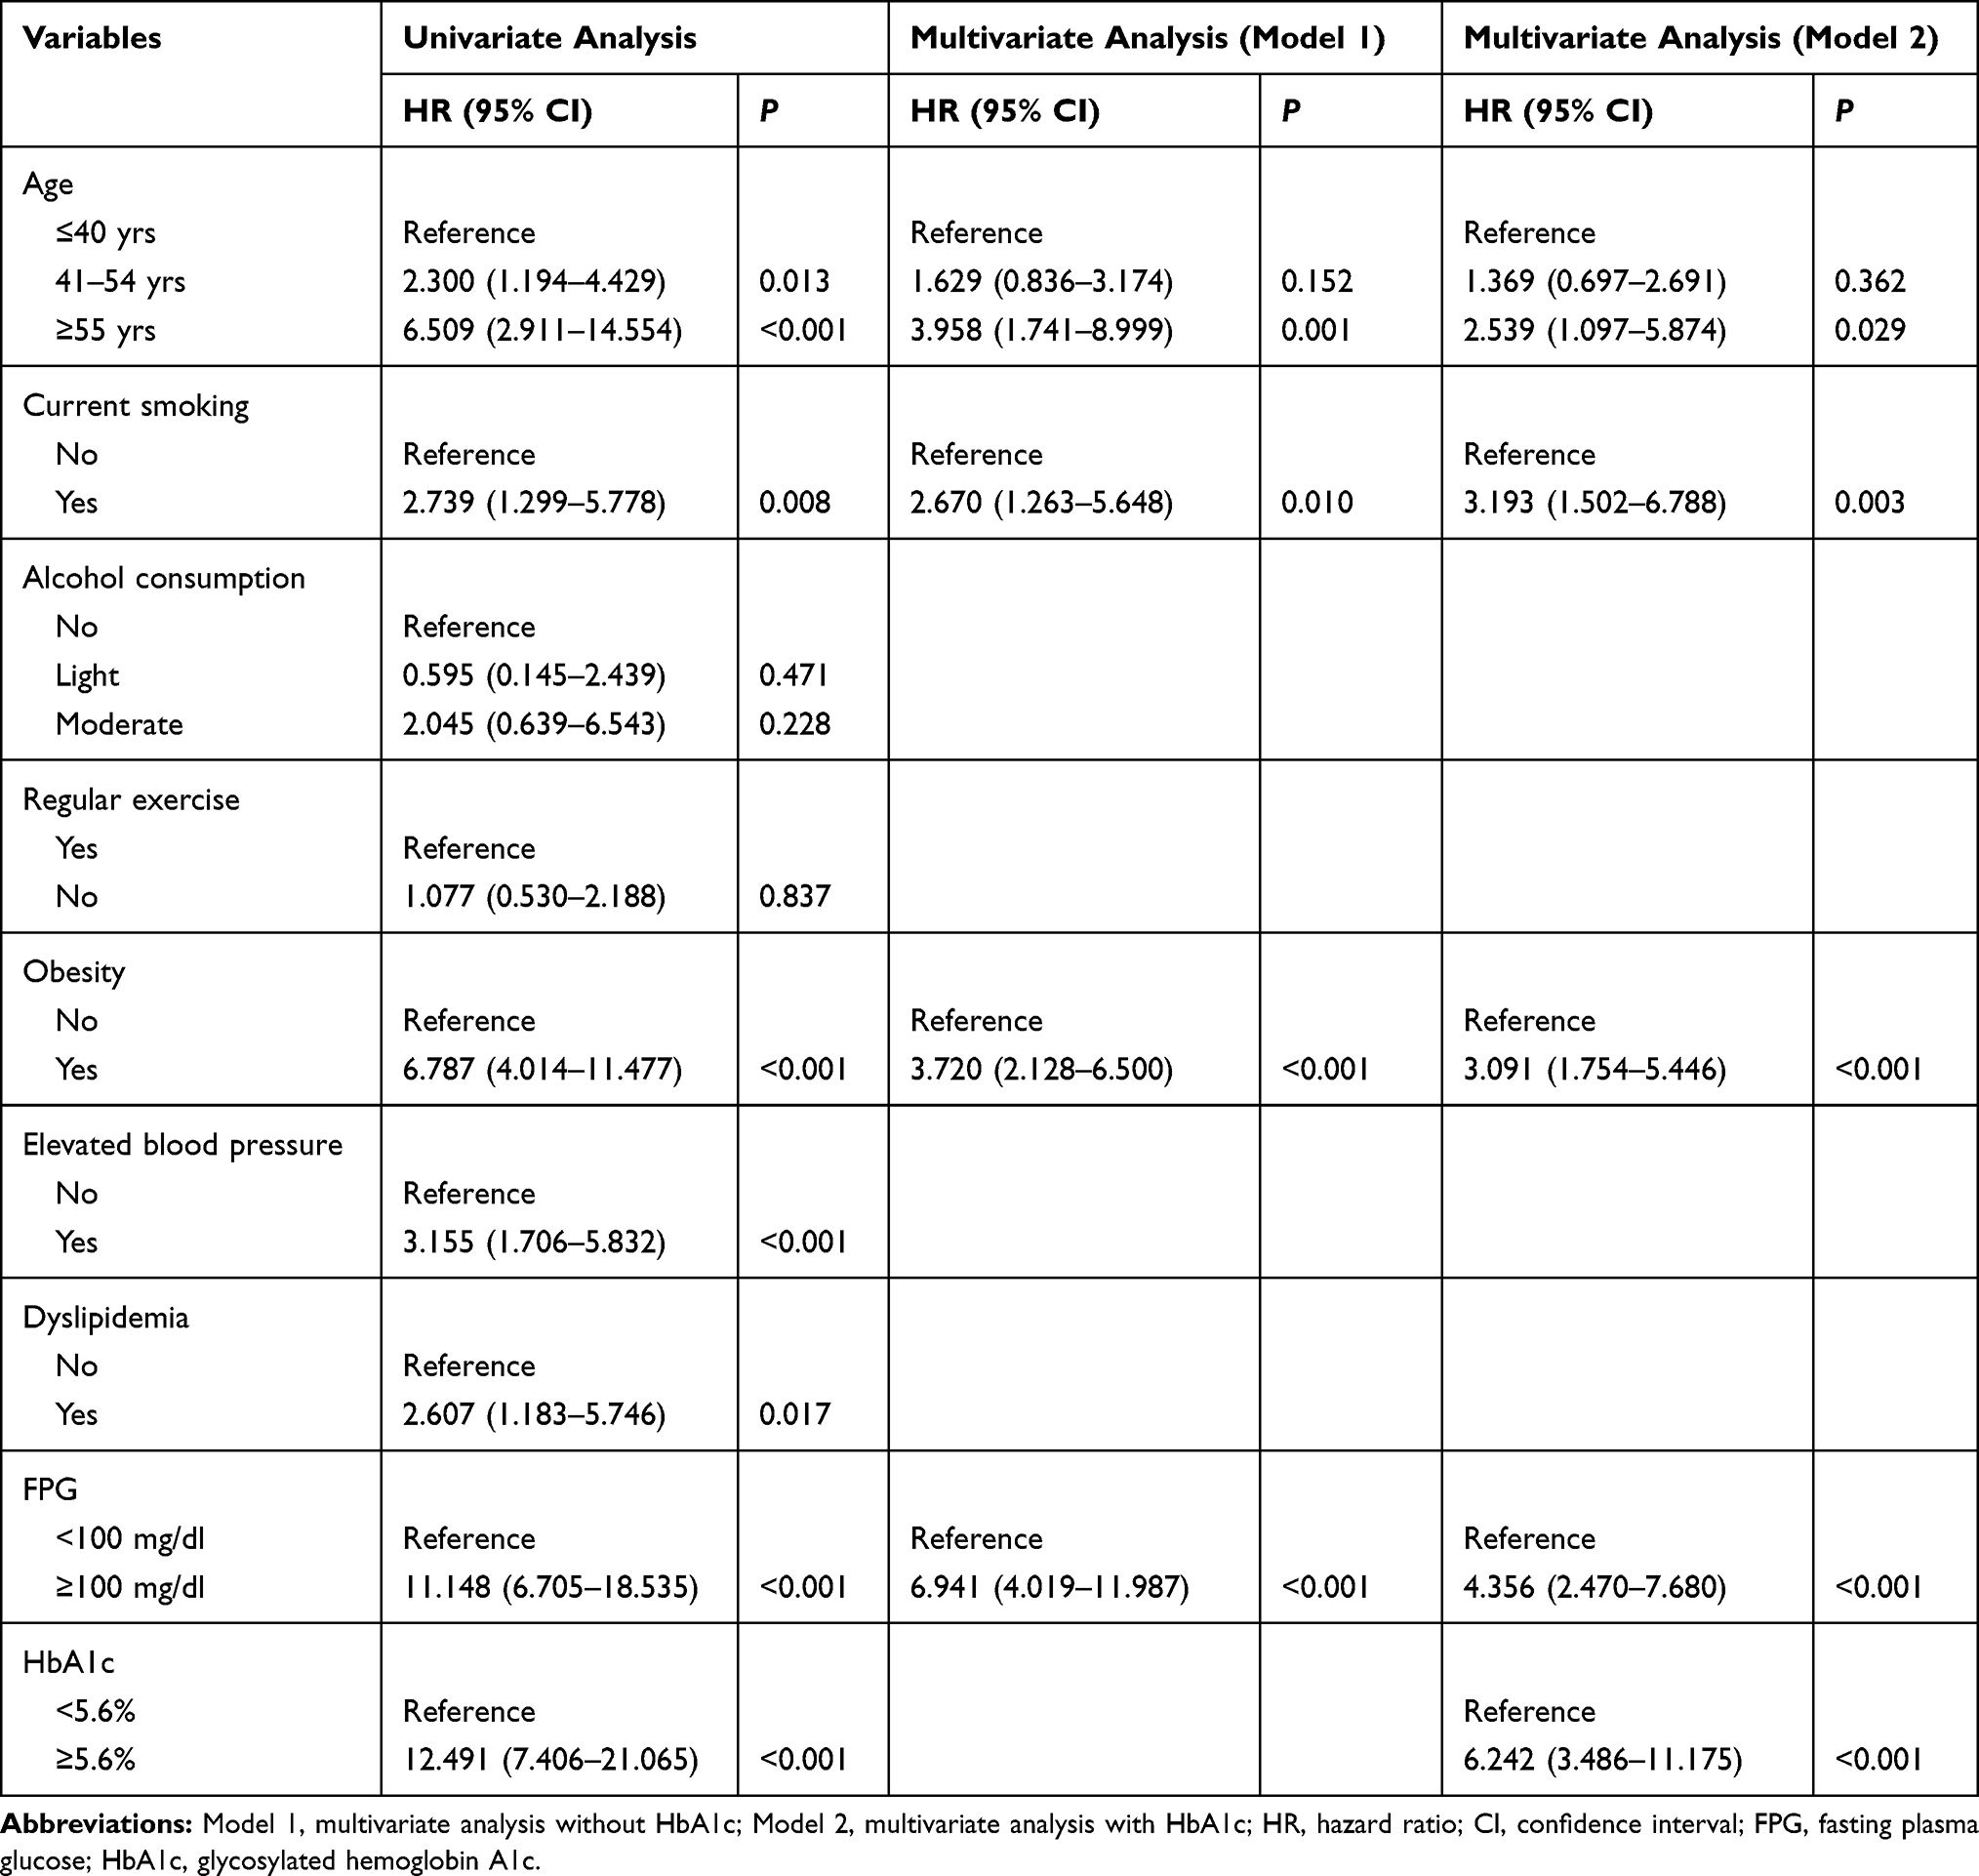 |
Table 4 Risk Factors of Type 2 Diabetes According to the Cox Proportional Hazards Regression Model in Females |
Nomogram Construction and Internal Validation
Based on these results, we developed a nomogram for predicting 5-year incidence risk of T2DM. The nomogram showed that FPG had the largest contribution to prognosis in Model 1 (Figures 1 and 2). In Model 2, HbA1c had the largest contribution to prognosis, followed by FPG (Figures 3 and 4). In males, the C-index was 0.824 (95% CI: 0.795–0.853) in Model 1 and 0.867 (95% CI: 0.840–0.894) in Model 2. In females, the C-index was 0.830 (95% CI: 0.770–0.890) in Model 1 and 0.856 (95% CI: 0.795–0.917) in Model 2. The calibration curves for 5-year T2DM-free probability showed excellent agreement between the predicted possibility and the actual observation in both Model 1 and Model 2 (Figures S1 and S2). The results of time-dependent ROC analyses are shown in Figures 5 and 6. The area under curve (AUC) values of Model 2 to predict T2DM development was higher than those of the Model 1, at every time point, and the differences between two models were significant from 2 years to 5 years follow-up durations in males (P<0.05).
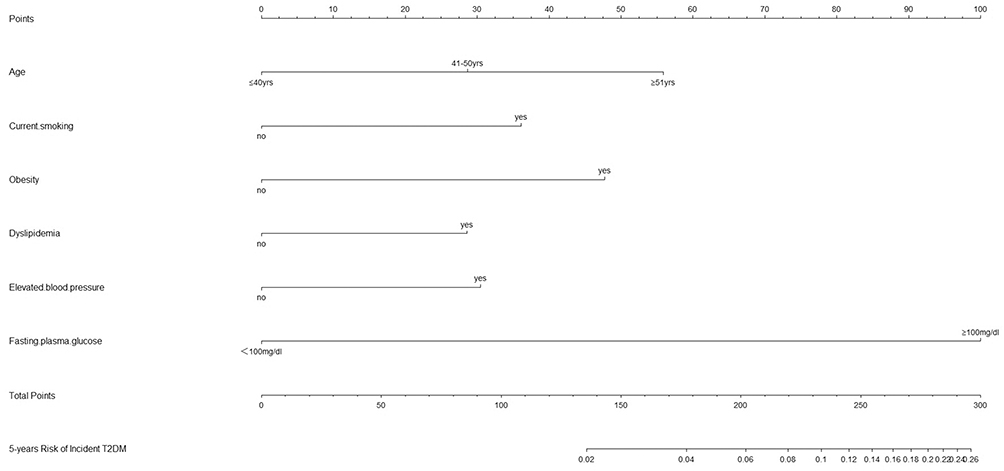 |
Figure 1 Nomogram for predicting 5-year incidence rate of T2DM in males (Model 1 without HbA1c). |
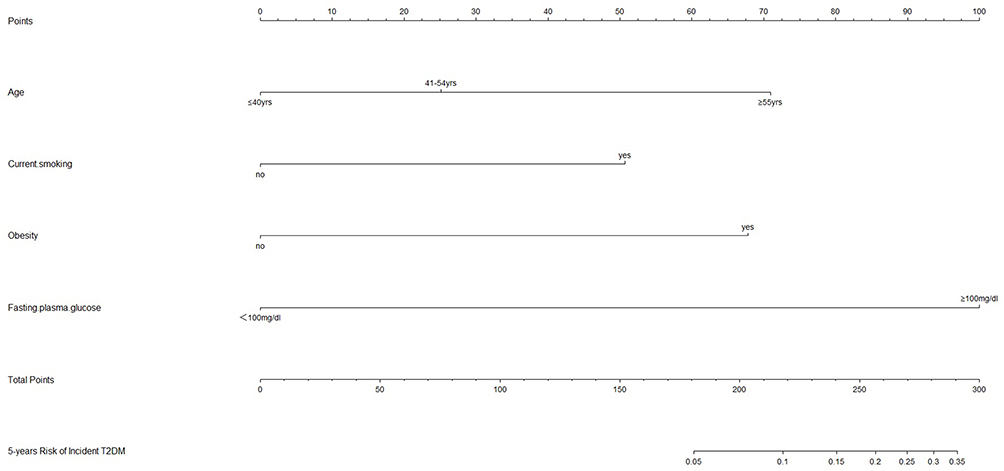 |
Figure 2 Nomogram for predicting 5-year incidence rate of T2DM in females (Model 1 without HbA1c). |
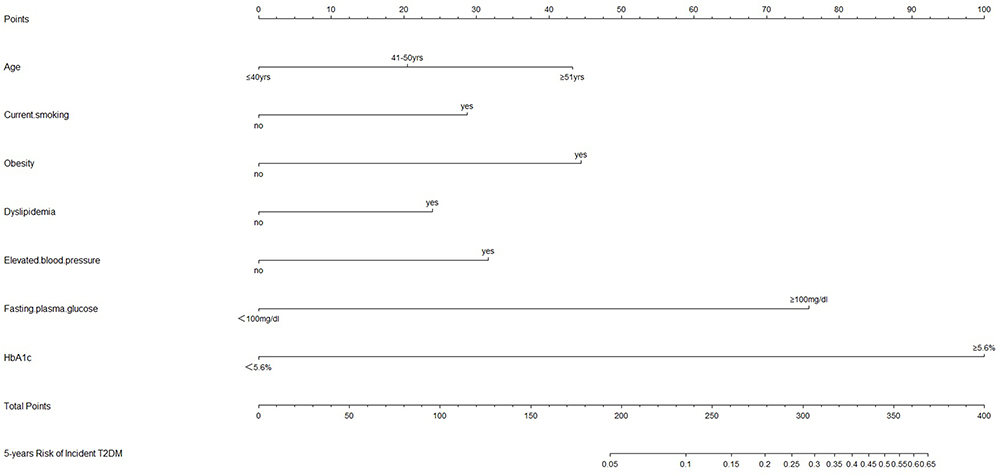 |
Figure 3 Nomogram for predicting 5-year incidence rate of T2DM in males (Model 2 with HbA1c). |
 |
Figure 4 Nomogram for predicting 5-year incidence rate of T2DM in females (Model 2 with HbA1c). |
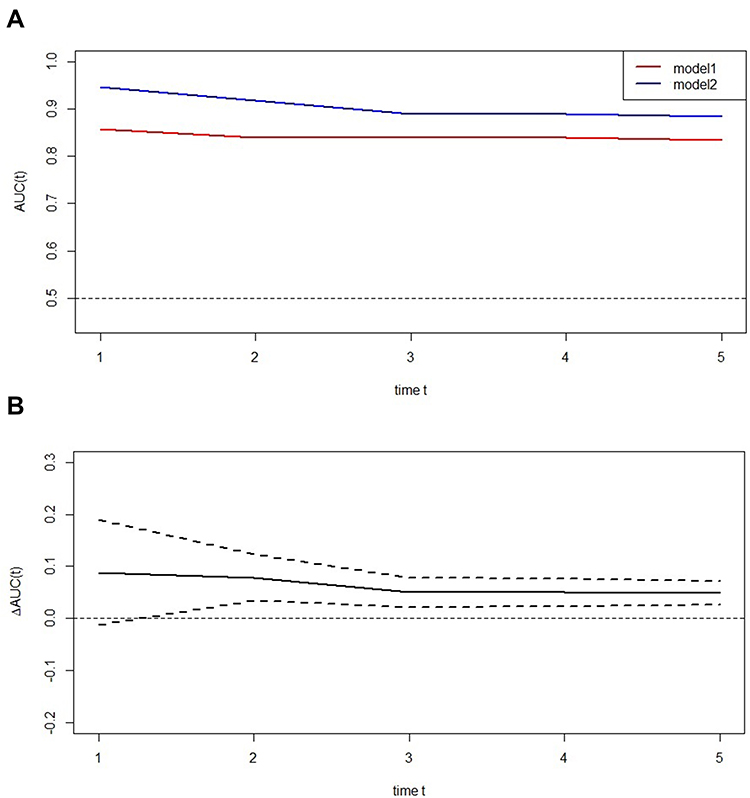 |
Figure 5 Time-dependent receiver-operating characteristic (ROC) curves of two models in males. (A) ROC curves of two models. (B) The difference of area under curve (AUC) values between the two models. |
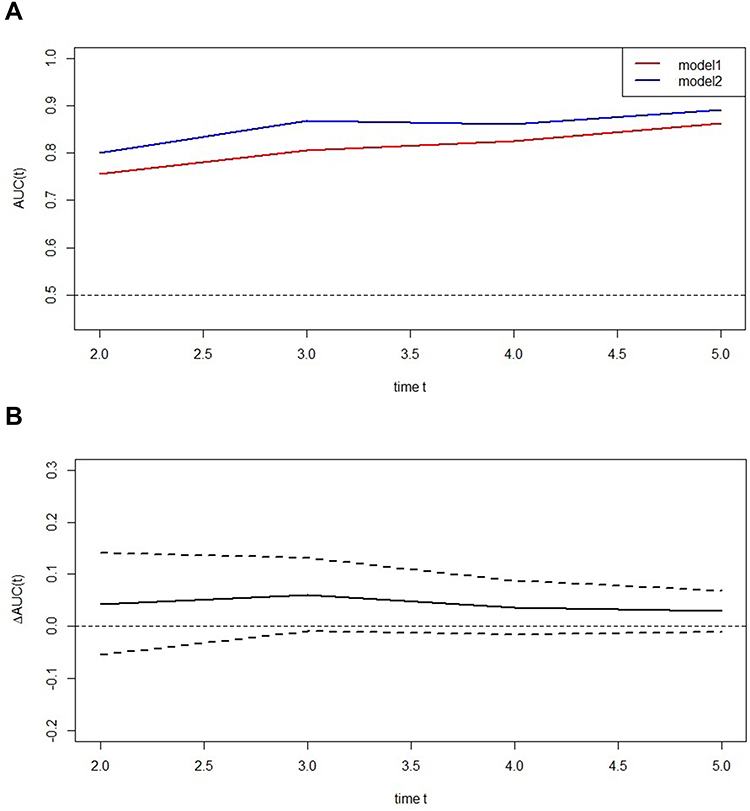 |
Figure 6 Time-dependent receiver-operating characteristic (ROC) curves of two models in females. (A) ROC curves of two models. (B) The difference of area under curve (AUC) values between the two models. |
In the validation set, the C-index was 0.800 (95% CI: 0.747–0.854) in Model 1 and 0.862 (95% CI: 0.821–0.903) in Model 2 in males. The C-index was 0.838 (95% CI: 0.738–0.938) in Model 1 and 0.874 (95% CI: 0.775–0.972) in Model 2 in females. The results of time-dependent ROC and calibration curves were similar to the results of the training set.
Discussion
Nomogram is a useful tool for screening the risk of developing T2DM. Similar to previous nomograms,2–4 traditional risk factors can accurately predict the risk of T2DM. In this study, we found that HbA1c can further improve the accuracy of the existing nomogram (which includes traditional risk factors) when assessing the risk of T2DM.
HbA1c can be used as a predictor of T2DM, gestational diabetes, diabetic complication and response to diabetes medication.9–12 Krabbe et al found that the power of risk scores and HbA1c for predicting the risk of incident T2DM were similar.5 A more extensive prospective open cohort study conducted in England found that either FPG or HbA1c could elevate the discrimination of a predictive model for 10-year risk of T2DM. However, in the present study, FPG and HbA1c were not used in one model.13 In a Japanese study, the risk score for predicting the 3-year incidence of T2DM was markedly improved by incorporating FPG and HbA1c.14 Kowall et al suggested that HbA1c could enhance the prediction of T2DM.15 Nevertheless, the effects of HbA1c on the prediction model, including FPG, were inconsistent. In Atherosclerosis Risk in Communities study, HbA1c improved the predictive performance of the model, including FPG. Opposite results were found in the Framingham Heart Study.9 In our study, we developed a nomogram by combining traditional risk factors, FPG, and HbA1c. Increased C-index and higher AUC values were found in nomogram that included HbA1c. The use of HbA1c has the advantage of not requiring a fasting status and possibility to be performed throughout a routine blood examination.16
HbA1c is correlated with both fasting and postprandial hyperglycemia. Postprandial plasma glucose is more strongly related to HbA1c than FPG in well-controlled T2DM patients. In contrast, FPG was the main contributor to the HbA1c in poorly controlled T2DM patients.17,18 Postprandial plasma glucose accounts for approximately 80% of HbA1c when HbA1c is <6.2%.18 In our study, the levels of HbA1c were about 5.2%. FPG was related to HbA1c, but FPG only accounted for approximately 10% of HbA1c (see Supplementary Materials). That means HbA1c may more accurately reflect postprandial plasma glucose. Postprandial plasma glucose was a significant prognostic indicator of an increased risk of incident diabetes.19 That might be why HbA1c can significantly improve the predictive ability of the model, including FPG. Compared with postprandial plasma glucose, HbA1c can be tested with FPG at the same time.
This study has a few limitations. Firstly, some risk factors, such as a family history of T2DM, were not included in the nomogram; however, the validation of the nomogram based on the current risk factors has demonstrated a good performance. Secondly, we performed an internal validation in our study. There were racial differences in the performance of prediction models for incident T2DM,20 thus, the proposed nomogram should be validated in other populations.
In conclusion, the proposed nomogram can accurately predict the risk of T2DM. Compared with the traditional nomogram, HbA1c can improve the performance of nomograms for predicting the 5-year incidence of T2DM.
Disclosure
The authors report no conflicts of interest in this work.
References
1. International Diabetes Federation. IDF Diabetes Atlas.
2. Chung SM, Park JC, Moon JS, Lee JY. Novel nomogram for screening the risk of developing diabetes in a Korean population. Diabetes Res Clin Pract. 2018;142:286–293. doi:10.1016/j.diabres.2018.05.036
3. Wang K, Gong M, Xie S, et al. Nomogram prediction for the 3-year risk of type 2 diabetes in healthy mainland China residents. EPMA J. 2019;10:227–237. doi:10.1007/s13167-019-00181-2
4. Lin Z, Guo D, Chen J, Zheng B. A nomogram for predicting 5-year incidence of type 2 diabetes in a Chinese population. Endocrine. 2019;67.
5. Krabbe CEM, Schipf S, Ittermann T, Dorr M, Nauck M, Chenot JF, Markus MRP, Volzke H. Comparison of traditional diabetes risk scores and HbA1c to predict type 2 diabetes mellitus in a population based cohort study. J Diabetes Complications. 2017;31:1602–1607.
6. Okamura T, Hashimoto Y, Hamaguchi M, Obora A, Kojima T, Fukui M. Data from: ectopic fat obesity presents the greatest risk for incident type 2 diabetes: a population-based longitudinal study, Dryad, Dataset. Int J Obes. 2019;43(1):139–148. doi:10.5061/dryad.8q0p192
7. Okamura T, Hashimoto Y, Hamaguchi M, Obora A, Kojima T, Fukui M. Ectopic fat obesity presents the greatest risk for incident type 2 diabetes: a population-based longitudinal study. Int J Obes (Lond). 2019;43:139–148. doi:10.1038/s41366-018-0076-3
8. Yamagishi K, Iso H. The criteria for metabolic syndrome and the national health screening and education system in Japan. Epidemiol Health. 2017;39:e2017003. doi:10.4178/epih.e2017003
9. Leong A, Daya N, Porneala B, et al. Prediction of type 2 diabetes by hemoglobin a in two community-based cohorts. Diabetes Care. 2018;41:60–68. doi:10.2337/dc17-0607
10. Arbib N, Shmueli A, Salman L, Krispin E, Toledano Y, Hadar E. First trimester glycosylated hemoglobin as a predictor of gestational diabetes mellitus. Int J Gynaecol Obstet. 2019;145:158–163. doi:10.1002/ijgo.12794
11. Kang EY, Lo FS, Wang JP, et al. Nomogram for prediction of non-proliferative diabetic retinopathy in juvenile-onset type 1 diabetes: a cohort study in an Asian population. Sci Rep. 2018;8:12164. doi:10.1038/s41598-018-30521-7
12. Esposito K, Chiodini P, Maiorino MI, et al. A nomogram to estimate the HbA1c response to different DPP-4 inhibitors in type 2 diabetes: a systematic review and meta-analysis of 98 trials with 24 163 patients. BMJ Open. 2015;5:e005892. doi:10.1136/bmjopen-2014-005892
13. Hippisley-Cox J, Coupland C. Development and validation of QDiabetes-2018 risk prediction algorithm to estimate future risk of type 2 diabetes: cohort study. BMJ. 2017;359:j5019. doi:10.1136/bmj.j5019
14. Nanri A, Nakagawa T, Kuwahara K, et al. Development of risk score for predicting 3-year incidence of type 2 diabetes: Japan epidemiology collaboration on occupational health study. PLoS One. 2015;10:e0142779. doi:10.1371/journal.pone.0142779
15. Kowall B, Rathmann W, Giani G, et al. Random glucose is useful for individual prediction of type 2 diabetes: results of the Study of Health in Pomerania (SHIP). Prim Care Diabetes. 2013;7(1):25–31. doi:10.1016/j.pcd.2012.12.001
16. Kodama S, Horikawa C, Fujihara K, et al. Comparisons of the strength of associations with future type 2 diabetes risk among anthropometric obesity indicators, including waist-to-height ratio: a meta-analysis. Am J Epidemiol. 2012;176:959–969. doi:10.1093/aje/kws172
17. Monnier L, Lapinski H, Colette C. Contributions of fasting and postprandial plasma glucose increments to the overall diurnal hyperglycemia of type 2 diabetic patients: variations with increasing levels of HbA(1c). Diabetes Care. 2003;26:881–885. doi:10.2337/diacare.26.3.881
18. Woerle HJ, Neumann C, Zschau S, et al. Impact of fasting and postprandial glycemia on overall glycemic control in type 2 diabetes Importance of postprandial glycemia to achieve target HbA1c levels. Diabetes Res Clin Pract. 2007;77:280–285. doi:10.1016/j.diabres.2006.11.011
19. Shahim B, De Bacquer D, De Backer G, et al. The prognostic value of fasting plasma glucose, two-hour postload glucose, and HbA in patients with coronary artery disease: a report from EUROASPIRE IV: a survey from the European Society of Cardiology. Diabetes Care. 2017;40:1233–1240). doi:10.2337/dc17-0245.
20. Lacy ME, Wellenius GA, Carnethon MR, et al. Racial differences in the performance of existing risk prediction models for incident type 2 diabetes: the CARDIA study. Diabetes Care. 2016;39:285–291. doi:10.2337/dc15-0509
 © 2020 The Author(s). This work is published and licensed by Dove Medical Press Limited. The
full terms of this license are available at https://www.dovepress.com/terms
and incorporate the Creative Commons Attribution
- Non Commercial (unported, 3.0) License.
By accessing the work you hereby accept the Terms. Non-commercial uses of the work are permitted
without any further permission from Dove Medical Press Limited, provided the work is properly
attributed. For permission for commercial use of this work, please see paragraphs 4.2 and 5 of our Terms.
© 2020 The Author(s). This work is published and licensed by Dove Medical Press Limited. The
full terms of this license are available at https://www.dovepress.com/terms
and incorporate the Creative Commons Attribution
- Non Commercial (unported, 3.0) License.
By accessing the work you hereby accept the Terms. Non-commercial uses of the work are permitted
without any further permission from Dove Medical Press Limited, provided the work is properly
attributed. For permission for commercial use of this work, please see paragraphs 4.2 and 5 of our Terms.