Back to Journals » International Journal of Chronic Obstructive Pulmonary Disease » Volume 17
Glucose Homeostasis in Relation to Neutrophil Mobilization in Smokers with COPD
Authors Pournaras N ![]() , Andersson A
, Andersson A ![]() , Kovach MA, Padra M, Che KF, Brundin B, Yoshihara S, Bozinovski S, Lindén SK, Jansson PA, Sköld MC, Qvarfordt I, Lindén A
, Kovach MA, Padra M, Che KF, Brundin B, Yoshihara S, Bozinovski S, Lindén SK, Jansson PA, Sköld MC, Qvarfordt I, Lindén A ![]()
Received 24 December 2021
Accepted for publication 3 April 2022
Published 20 May 2022 Volume 2022:17 Pages 1179—1194
DOI https://doi.org/10.2147/COPD.S353753
Checked for plagiarism Yes
Review by Single anonymous peer review
Peer reviewer comments 4
Editor who approved publication: Prof. Dr. Richard Russell
Nikolaos Pournaras,1,2 Anders Andersson,3,4 Melissa A Kovach,1 Médea Padra,5 Karlhans F Che,1,2 Bettina Brundin,1 Shigemi Yoshihara,6 Steven Bozinovski,7 Sara K Lindén,5 Per-Anders Jansson,8 Magnus C Sköld,2,9 Ingemar Qvarfordt,3,8 Anders Lindén1,2
1Division for Lung and Airway Research, Institute of Environmental Medicine, Karolinska Institutet, Stockholm, Sweden; 2Karolinska Severe COPD Center, Department of Respiratory Medicine and Allergy, Karolinska University Hospital, Stockholm, Sweden; 3COPD Center, Department of Respiratory Medicine and Allergology, Sahlgrenska University Hospital, Gothenburg, Sweden; 4COPD Center, Department of Internal Medicine and Clinical Nutrition, Institute of Medicine, Sahlgrenska Academy, University of Gothenburg, Gothenburg, Sweden; 5Institute of Biomedicine, Sahlgrenska Academy, University of Gothenburg, Gothenburg, Sweden; 6Pediatric Allergology and Respiratory Medicine, Department of Pediatrics, Dokkyo Medical University, Mibu, Tochigi, Japan; 7School of Health and Biomedical Sciences, RMIT University, Bundoora, Victoria, Australia; 8Institute of Medicine, Sahlgrenska Academy, University of Gothenburg, Gothenburg, Sweden; 9Division for Respiratory Medicine, Department of Medicine Solna, Karolinska Institutet, Stockholm, Sweden
Correspondence: Nikolaos Pournaras, Division for Lung and Airway Research, Institute of Environmental Medicine, Karolinska Institutet, Stockholm, Sweden and Karolinska Severe COPD Center, Department of Respiratory Medicine and Allergy, Karolinska University Hospital, Stockholm, Sweden, Email [email protected]
Purpose: Type 2 diabetes mellitus (T2DM) and metabolic syndrome (MetS) are common comorbidities in chronic obstructive pulmonary disease (COPD), but the underlying pathogenic mechanisms are poorly understood. Given that these morbidities all display increased neutrophil mobilization, the current study aimed to address whether glucose homeostasis relates to signs of neutrophil mobilization in COPD.
Methods: The study population included healthy non-smokers (HNS) and long-term smokers without (LTS) and with COPD (LTS+COPD). No subject had T2DM or MetS. Serum cotinine was quantified to evaluate current smoking. Capillary blood glucose was measured after overnight fasting and during an oral glucose tolerance test (OGTT). Neutrophils were quantified in blood and bronchoalveolar lavage samples (BAL). The neutrophil-related cytokines IL-36α, -β and -γ were quantified (ELISA) along with IL-6, IL-8, INF-γ and CXCL10 (U-Plex®) in plasma and cell-free BAL fluid (BALF). In addition, we quantified neutrophil elastase (ELISA) and net proteinase activity (substrate assay) in BALF.
Results: The LTS+COPD group had lower fasting glucose, greater change in glucose during OGTT and higher neutrophil concentrations in BAL and blood compared with HNS. Fasting glucose correlated in a positive manner with blood neutrophil concentration, forced expiratory volume in 1 second/forced vital capacity ratio (FEV1/FVC) and FEV1 (% of predicted) in LTS+COPD. In this group, the concentration of IL-36α in BALF correlated in a negative manner with fasting glucose, blood neutrophil concentration and FEV1, while the CXCL10 concentration in BALF correlated in a negative manner with glucose at the end of OGTT (120 min). We observed no corresponding correlations for neutrophil elastase, net proteinase or gelatinase activity.
Conclusion: In smokers with COPD, altered glucose homeostasis is associated with local and systemic signs of increased neutrophil mobilization, but not with local proteinases. This suggests that other specific aspects of neutrophil mobilization constitute pathogenic factors that affect glucose homeostasis in COPD.
Keywords: granulocyte, elastase, IL-36, IP-10, BAL
Introduction
Chronic obstructive pulmonary disease (COPD) claimed more than 3 million lives in 2019 and is now the third leading disease-related cause of death globally, according to the World Health Organization.1 Long-term exposure to tobacco smoke is the most common cause of the disease in the industrialized world, and results in persistent airflow limitation, due to chronic inflammation and remodeling of the airways.2 However, this inflammation is not confined to the airways. Signs of systemic inflammation are also present and are associated with comorbidities of COPD, such as type 2 diabetes mellitus (T2DM).3 Notably, the pathologic glucose homeostasis in T2DM is related to signs of systemic inflammation and this is also true for metabolic syndrome (MetS), another common metabolic comorbidity in COPD.4–7 Furthermore, the prevalence of COPD is increased in patients with T2DM, even after adjustment for risk factors that predispose to both these diagnoses.8,9 In a similar manner, there is evidence that COPD is more prevalent among patients with MetS.10 Despite an expanding body of evidence that clinically relates COPD with T2DM and MetS, there is poor understanding of the underlying pathogenic mechanisms linking these diseases. We reasoned that a more comprehensive characterization of these mechanisms may reveal novel targets for diagnosis or therapy in COPD and metabolic comorbidities.
Excessive mobilization of neutrophils, including both recruitment and activation, is a common and prominent sign of systemic inflammation in COPD.11–13 Interestingly, this type of inflammation is observed in T2DM and MetS as well, and may therefore constitute a unifying pathogenic mechanism in COPD patients with either of these comorbidities.14,15 Specifically, neutrophils comprise the most abundant subset of leukocytes in blood, and are important players in antibacterial host defense and in repair of tissue injury.16,17 Under normal conditions, their mobilization is carefully regulated by numerous mediators, including interleukin-6 (IL-6), IL-8 and interferon-γ (INF-γ).18–21 Moreover, neutrophil products, such as serine proteinases and gelatinases, exert important anti-bacterial functions and regulate inflammation, through proteolytic modification of several cytokines, including IL-6, IL-8 and members of the IL-36 family.16,22,23 Systemic IL-6 is increased and correlates in a positive manner with insulin resistance in patients with COPD,24 which is compatible with excessive neutrophil mobilization constituting a contributing factor. Along the same lines, systemic IL-8 is enhanced in patients with COPD, T2DM and MetS combined with heart failure.25–27 Notably, it was recently demonstrated that certain members of the IL-36 family are involved in local and systemic inflammation in COPD and that these cytokines exert pro-inflammatory effects on neutrophils.28–33 Intriguingly, systemic IL-36γ correlates in a negative manner with glycated hemoglobin (HbA1c) and fasting glucose in obese patients with T2DM.28,34
In parallel with its central role in innate immunity, neutrophil mobilization facilitates the production of cytokines that modulate adaptive immunity, such as C-X-C motif chemokine ligand 10 (CXCL10, also known as interferon-γ-inducible protein 10 or IP-10).16,35,36 It therefore seems rational that the concentration of CXCL10 is increased in the airways of patients with COPD, in particular during exacerbations.37 At the same time, there is evidence that elevated systemic CXCL10 may predispose to development of T2DM.38
The fact that several signs of increased neutrophil mobilization are evident in COPD, T2DM and MetS led us to hypothesize that there is an altered glucose homeostasis in COPD, associated with an increased mobilization of neutrophils. We addressed this hypothesis in a pilot study on current long-term smokers with and without COPD plus a control group of healthy non-smokers. In these subjects, we assessed alterations in glucose homeostasis by quantifying blood glucose after overnight fasting and during an oral glucose tolerance test (OGTT). Furthermore, we characterized neutrophil mobilization in the airways and in blood by determining concentrations of neutrophils, functionally related cytokines and proteinases. Finally, we quantified the concentration of C-reactive protein in blood as a reference for systemic inflammation.
Materials and Methods
Human Study Population and Ethics
We utilized the human study population “KOL-KB 2011”, including healthy non-smokers (HNS), long-term smokers without COPD (LTS) and long-term smokers with COPD (LTS+COPD). The study population was recruited in accordance with the ethical principles of the World Medical Association (the Helsinki Declaration). The study protocol was approved by the Regional Ethical Review Board in Gothenburg, Sweden (Diary No. 968–11). All subjects provided oral and written informed consent prior to study participation. Some data from this study population have previously been published, although in a different scientific context.28,39,40
Recruitment
Screening Visit
The subjects were identified through an advertisement in the regional press or through their contact with the outpatient clinic at the Department of Respiratory Medicine and Allergy, Sahlgrenska University Hospital in Gothenburg, and were then invited to a screening visit. During that visit, the clinical history and the smoking habits of the subjects were recorded, and a physical examination was performed. Height and weight of each subject were measured, and body mass index (BMI) was calculated. In parallel, percutaneous oxygen saturation was determined with a pulse oximeter. Blood tests included hemoglobin (Hb), coagulation parameters, a standard panel of specific Immunoglobulins E (IgE) against common inhaled allergens (Phadiatop®, PhadiaTM, Uppsala, Sweden) and viral serology (hepatitis B and C, HIV). In addition, premenopausal female subjects underwent a testing to exclude ongoing pregnancy.
Ventilatory lung function was assessed using dynamic spirometry with reversibility test and gas exchange was assessed with diffusion capacity for carbon monoxide (DLCO).41,42 The screening visit also included an electrocardiogram (ECG) and a standard chest X-ray, performed, respectively, at the Department of Clinical Physiology and the Department of Radiology at Sahlgrenska University Hospital.
Inclusion Criteria
A negative history of asthma and atopy (with the exception of contact allergy to nickel) was required for all subjects, as well as negative Phadiatop test, negative viral serology and negative pregnancy test, when applicable. Subjects with BMI ≥ 35 kg/m2 or body weight >100 kg were excluded, to ensure medical safety during the bronchoscopy investigation, which was performed for research purposes only. Furthermore, we did not accept more than three respiratory tract infections during the last year. We also required absence of any signs of infection during the screening visit and an infection-free period of at least four weeks prior to the bronchoscopy visit; otherwise, the corresponding visit had to be re-scheduled. We accepted patients with previously diagnosed, compensated cardiac failure, osteoporosis and cured cancer disease (>5 years prior to the inclusion), along with well-treated hypothyroidism, epilepsy, depression and hypertension. No other established diagnoses were accepted, including T2DM, MetS and obstructive sleep apnea (OSA). Subjects on regular treatment with statins, inhaled corticosteroids and/or long-acting inhaled bronchodilators, including both beta-2-agonists and anticholinergics, were excluded. In a similar manner, a regular treatment with immunosuppressive or anti-inflammatory medication was not accepted. Exceptions to this criterion were NSAID and oral steroids when a mandatory wash-out period of four weeks prior to bronchoscopy could be ensured. However, paracetamol treatment was allowed with no restrictions.
Subjects in the HNS group were required to have a negative history of smoking and of lung disease, in addition to a normal chest X-ray and dynamic spirometry indicating normal lung function after bronchodilation (three doses of inhaled terbutaline; 0.5 mg/dose; Bricanyl TurbuhalerTM, AstraZeneca Ltd, Södertälje, Sweden), in terms of forced expiratory volume in 1 second/forced vital capacity (FEV1/FVC) ratio ≥0.70 and FEV1 > 80% of predicted (reference values: European Community for Steel and Coal).41 One included subject in this group had an FEV1/FVC ratio of 0.68, but this subject displayed large lung volumes (FEV1: 106% of predicted, FVC: 127% of predicted) and lacked both clinical and historical signs of lung disease, thus was classified as not having COPD.
Subjects classified as long-term smokers had to meet the requirements of active tobacco smoking of ≥5 cigarettes per day, during the last 5 years, and of a historic tobacco load of ≥20 pack-years. For all long-term smokers, we accepted the presence of chronic bronchitis, defined according to standard criteria.43
The spirometry criteria for inclusion in the group of LTS were a post-bronchodilatory FEV1/FVC ratio ≥0.70.
Subjects in the LTS+COPD group were required to have an FEV1/FVC ratio <0.70 after bronchodilation, corresponding to the criteria for GOLD stage I–III as of 2011.44 For safety reasons related to the bronchoscopy investigation, it was required that all subjects had FEV1 ≥1.0 liter (L), DLCO ≥50% of predicted and percutaneous oxygen saturation >93%. Notably, history and radiological signs of chronic bronchitis and emphysema were accepted in LTS+COPD. This was the only study group also allowed to have an “as needed” treatment with short-acting inhaled beta-2-agonists and/or short-acting inhaled anticholinergics, with a prerequisite of a three-day wash-out prior to bronchoscopy.
Among the included study subjects, one subject in the LTS group attended but did not complete the bronchoscopy, due to poor compliance during this investigation. Consequently, only blood samples were harvested from this subject on the bronchoscopy visit. Moreover, one subject in the LTS+COPD group withdrew from the study prior to the bronchoscopy visit, for personal reasons. Thus, the absence of the certain samples for these two subjects is reflected by the varying n for the different outcomes of the relevant study groups.
Glucose Measurements
The concentration of glucose was assessed during the screening visit, in capillary whole blood harvested from a fingertip with a glucose meter (Freestyle Freedom Lite®, Abbott Diabetes Care Inc., Alameda, CA, USA). Each concentration was measured in doublets and the corresponding average value was used in further analysis. An initial sampling was performed after overnight fasting for 10 hours (hrs) and was followed by an oral glucose tolerance test (OGTT) with 75 grams (g) (200 milliliter (mL)) of a commercial glucose solution (Gluco® 75, TruLaboratories Corporation®, Cubao, Quezon City, Philippines) in accordance with standard clinical routines. The OGTT was finalized after 120 minutes (min), when a second sampling was performed to determine the concentration of capillary blood glucose at the end of OGTT. Accordingly, the change in glucose concentration during OGTT was estimated by the difference in glucose concentration between the end of OGTT and fasting.
Bronchoscopy Visit
Blood Samples
Peripheral venous blood (60 mL) was collected after overnight fasting, prior to bronchoscopy as whole blood (1x4 mL), plasma (4x4 mL) and serum (4x10 mL). A more detailed protocol for the sample collection, process and analysis has been described elsewhere.39
Briefly, the whole blood sample was used to determine the concentration of hemoglobin (Hb), total leukocyte concentration (LPC) and blood cell differential counts, in accordance with accredited standard procedures (Department of Clinical Chemistry, Sahlgrenska University Hospital, Gothenburg, Sweden). The samples intended for the harvesting of plasma and serum were centrifuged (1500 revolutions per min (rpm); 443 gravitational acceleration (g); 10 min at room temperature (RT)), and the acquired plasma and serum samples were frozen (−80 degrees Celsius (°C)) for future analyses.
Quantification of C-Reactive Protein
C-reactive protein (CRP) in serum was quantified in an accredited laboratory (Department of Clinical Chemistry at Sahlgrenska University Hospital). In brief, we utilized a high sensitivity method (CRPHS; Roche/Cobas, No. 04628918190; Roche Diagnostics Scandinavia AB, Solna, Sweden) based upon the agglutination of CRP to latex particles exposed to anti-CRP antibodies and the detection of the formed compounds by a turbidimetric analysis instrument (Cobas® 8000 Roche Diagnostics Scandinavia AB, Solna, Sweden).
Quantification of Cotinine
The nicotine metabolite cotinine was quantified in serum with a competitive immunochemical method (Immulite 2000 XPi Nicotine metabolite; No. L2KNM2 (200 test); Siemens Medical DiagnosticTM, Siemens Healthcare, Upplands-Väsby, Sweden), utilizing a chemiluminescence detector (Immulite 2000 XPi®; Siemens Medical DiagnosticTM, Siemens Healthcare, Upplands-Väsby, Sweden) in an accredited laboratory (Department of Clinical Chemistry at Sahlgrenska University Hospital).39
Bronchoscopy
An experienced specialist in respiratory medicine performed the bronchoscopy during stable clinical conditions and according to the clinical routines at Sahlgrenska University Hospital, as described in detail elsewhere.39 In brief, the study subject was premedicated with ketobemidone hydrochloride (KetoganTM; <7.5 mg intramuscularly or <5 mg intravenously; Apoteket, Solna, Sweden) and local anesthesia with lignocaine (nebulized XylocaineTM 10 mg/dose; oropharyngeal administration of 2 doses, up to 3 times; Apoteket, Solna, Sweden). A flexible bronchoscope was then inserted through the oral cavity into the lower airways and wedged in a segmental bronchus (lingula or middle lobe), while administrating additional local anesthesia through the instrument as needed. Subsequently, a lower airway sample was harvested (either a protected bronchial brush or a BAL sample) and transferred to a sterile tube, which was stored at 4°C, until being transported to an accredited laboratory for further analysis (Department of Microbiology at Sahlgrenska University Hospital). The bronchoscope was then wedged in another segmental bronchus and three portions of 50 mL (a total of 150 mL) phosphate-buffered saline (PBS) at 37°C were instilled into the airways. Bronchoalveolar lavage (BAL) samples were aspirated after each instillation, pooled in a plastic container (SERRES® Polypropylene measuring cup 250 mL, No. 6057257; Mediplast AB, Malmö, Sweden) and kept on ice until further processing at the laboratory.
BAL Samples
The BAL samples were processed as previously described in detail.39 In brief, cells and extracellular fluid were separated from debris by filtration (Woven mesh spacers, Dacron® 124 mm diameter, No. AP3212450; Merck Chemicals and Life ScienceTM AB, Solna, Sweden). Cells were then pelleted by centrifugation (1400 rpm; 378 g; 10 min at 4°C). A second centrifugation (2000 rpm; 771 g; 10 min at 4°C) of the cell-free BAL fluid (BALF) was performed to eliminate any carry over debris before storage at −80°C. After been re-suspended in PBS, the cell pellet was transferred to a Bürker counting chamber to determine the total cell concentration. Türk´s solution (Cat. No. 93770, Sigma-Aldrich Sweden AB, Stockholm, Sweden) was utilized to assess cell viability. Differential cell counts were performed accordingly. Two cell suspensions (100 microliters (µL) of 600 cells/µL each) were loaded on cytospin slides and centrifuged (1000 rpm; 246 g; for 5 min at RT in Cytospin™ 4, Thermo Fisher Scientific™, Shandon, MA, USA). The slides were then air-dried (overnight) and stored frozen (−20°C) prior to May-Grünwald-Giemsa staining and cell counting (200 cells per sample) under a light microscope.
Laboratory Investigations
Quantification of Cytokines
The protein concentrations of IL-6, IL-8, INF-γ and CXCL10 were determined in BALF and plasma from peripheral blood, utilizing the U-Plex assay® (Meso Scale DiscoveryTM platform, cat no K15067-L1, Meso Scale Diagnostics, Rockville, Maryland, USA) in accordance with the manufacturer’s recommendations, as previously described.40
The protein concentrations of the IL-36 family of cytokines, including IL-36α, -β and -γ, were quantified in both BALF and plasma samples, utilizing commercial DuoSet ELISA kits (R&D Systems, Minneapolis, MN, USA) as previously described.45,46
Quantification of Neutrophil Elastase
The protein concentration of neutrophil elastase in BALF was determined using a commercial sandwich ELISA (Human PMN Elastase ELISA; No. 191021100; BioVendor® Laboratorni Medicina A.S., Brno, Check Republic) according to the manufacturer’s instructions, as described elsewhere.39 Data on neutrophil elastase has been previously published for a subgroup of the utilized study population, although in a different scientific context.39
Quantification of Net Gelatinase and Net Serine Proteinase Activity
The net proteolytic activity of gelatinase and serine proteinases was determined in BALF utilizing a fluorometric method, as described elsewhere.47 Briefly, fluorescein labeled dye-quenched (DQ) gelatin and elastin EnzChek® molecular probes were incubated with the BALF (at 37°C for 16 hrs). The fluorescence intensity was then assessed with a multimode microplate reader (CLARIOStar®; BMG Labtech Pty. LtdTM, Ortenberg, Germany), set at 495 nm as absorption maximum and 515 nm as emission maximum. Increasing values of fluorescence intensity corresponded to increasing net activity of gelatinase and serine proteinases. A subset of this data has been previously published in a different scientific context.39
Bacteria in the Airways
The growth of aerobic bacteria was determined in the lower airways of each subject by performing a qualitative and quantitative analysis of samples from this compartment, following standard laboratory procedures as previously described.39 Briefly, a morphological analysis was performed to assess the percentage of squamous epithelial cells in the samples, and a percentage less than 1% was required to judge a sample as representative for the lower airways. Mass spectrometry (MALDI-TOF) was used to identify and quantify (if >100 colony-forming units (CFU)/mL) the 10 most common bacterial species in each of the samples that were judged representative for the lower airways. However, in the samples that were judged as non-representative for the lower airways, MALDI-TOF was utilized to identify and quantify (if >1000 CFU/mL) the potential pathogenic bacteria only.
Statistics
We applied non-parametric statistical analyses using GraphPad Prism 9.0.1 (GraphPad Software, San Diego, CA, USA). Given the limited statistical power of the material, the statistical analysis of group differences was restricted to the groups of LTS+COPD and HNS. In this sense, here, we utilized Mann–Whitney U-test for group comparisons of continuous variables. Correlation analysis was conducted with Spearman’s rank correlation test and was initially performed in the LTS+COPD group. The statistically significant correlations in this group were then expanded to the groups of LTS and HNS, given the limited statistical power in our study material. A p-value <0.05 was regarded statistically significant.
Results
Human Study Population
The principal clinical characteristics of the included subjects are summarized in Table 1. More specifically, we detected no pronounced differences for age, gender or BMI among the three study groups. The LTS and LTS+COPD groups had very similar exposure to tobacco smoke, in terms of current (cigarettes/day) and historic (pack-years) tobacco smoking, as well as of cotinine concentration in serum. The LTS+COPD group displayed clearly lower FEV1 (% of predicted) and FEV1/FVC ratio compared to the HNS and LTS groups, which is consistent with the study´s inclusion criteria. The concentrations of CRP and Hb in blood were not markedly different among the three study groups. As expected, regular pharmacological treatment was more frequently observed at screening visit in the groups of long-term smokers (LTS and LTS+COPD) compared to HNS. Antidepressants and hypnotic drugs were the most common medications in the two groups of long-term smokers but were not used in the HNS group.
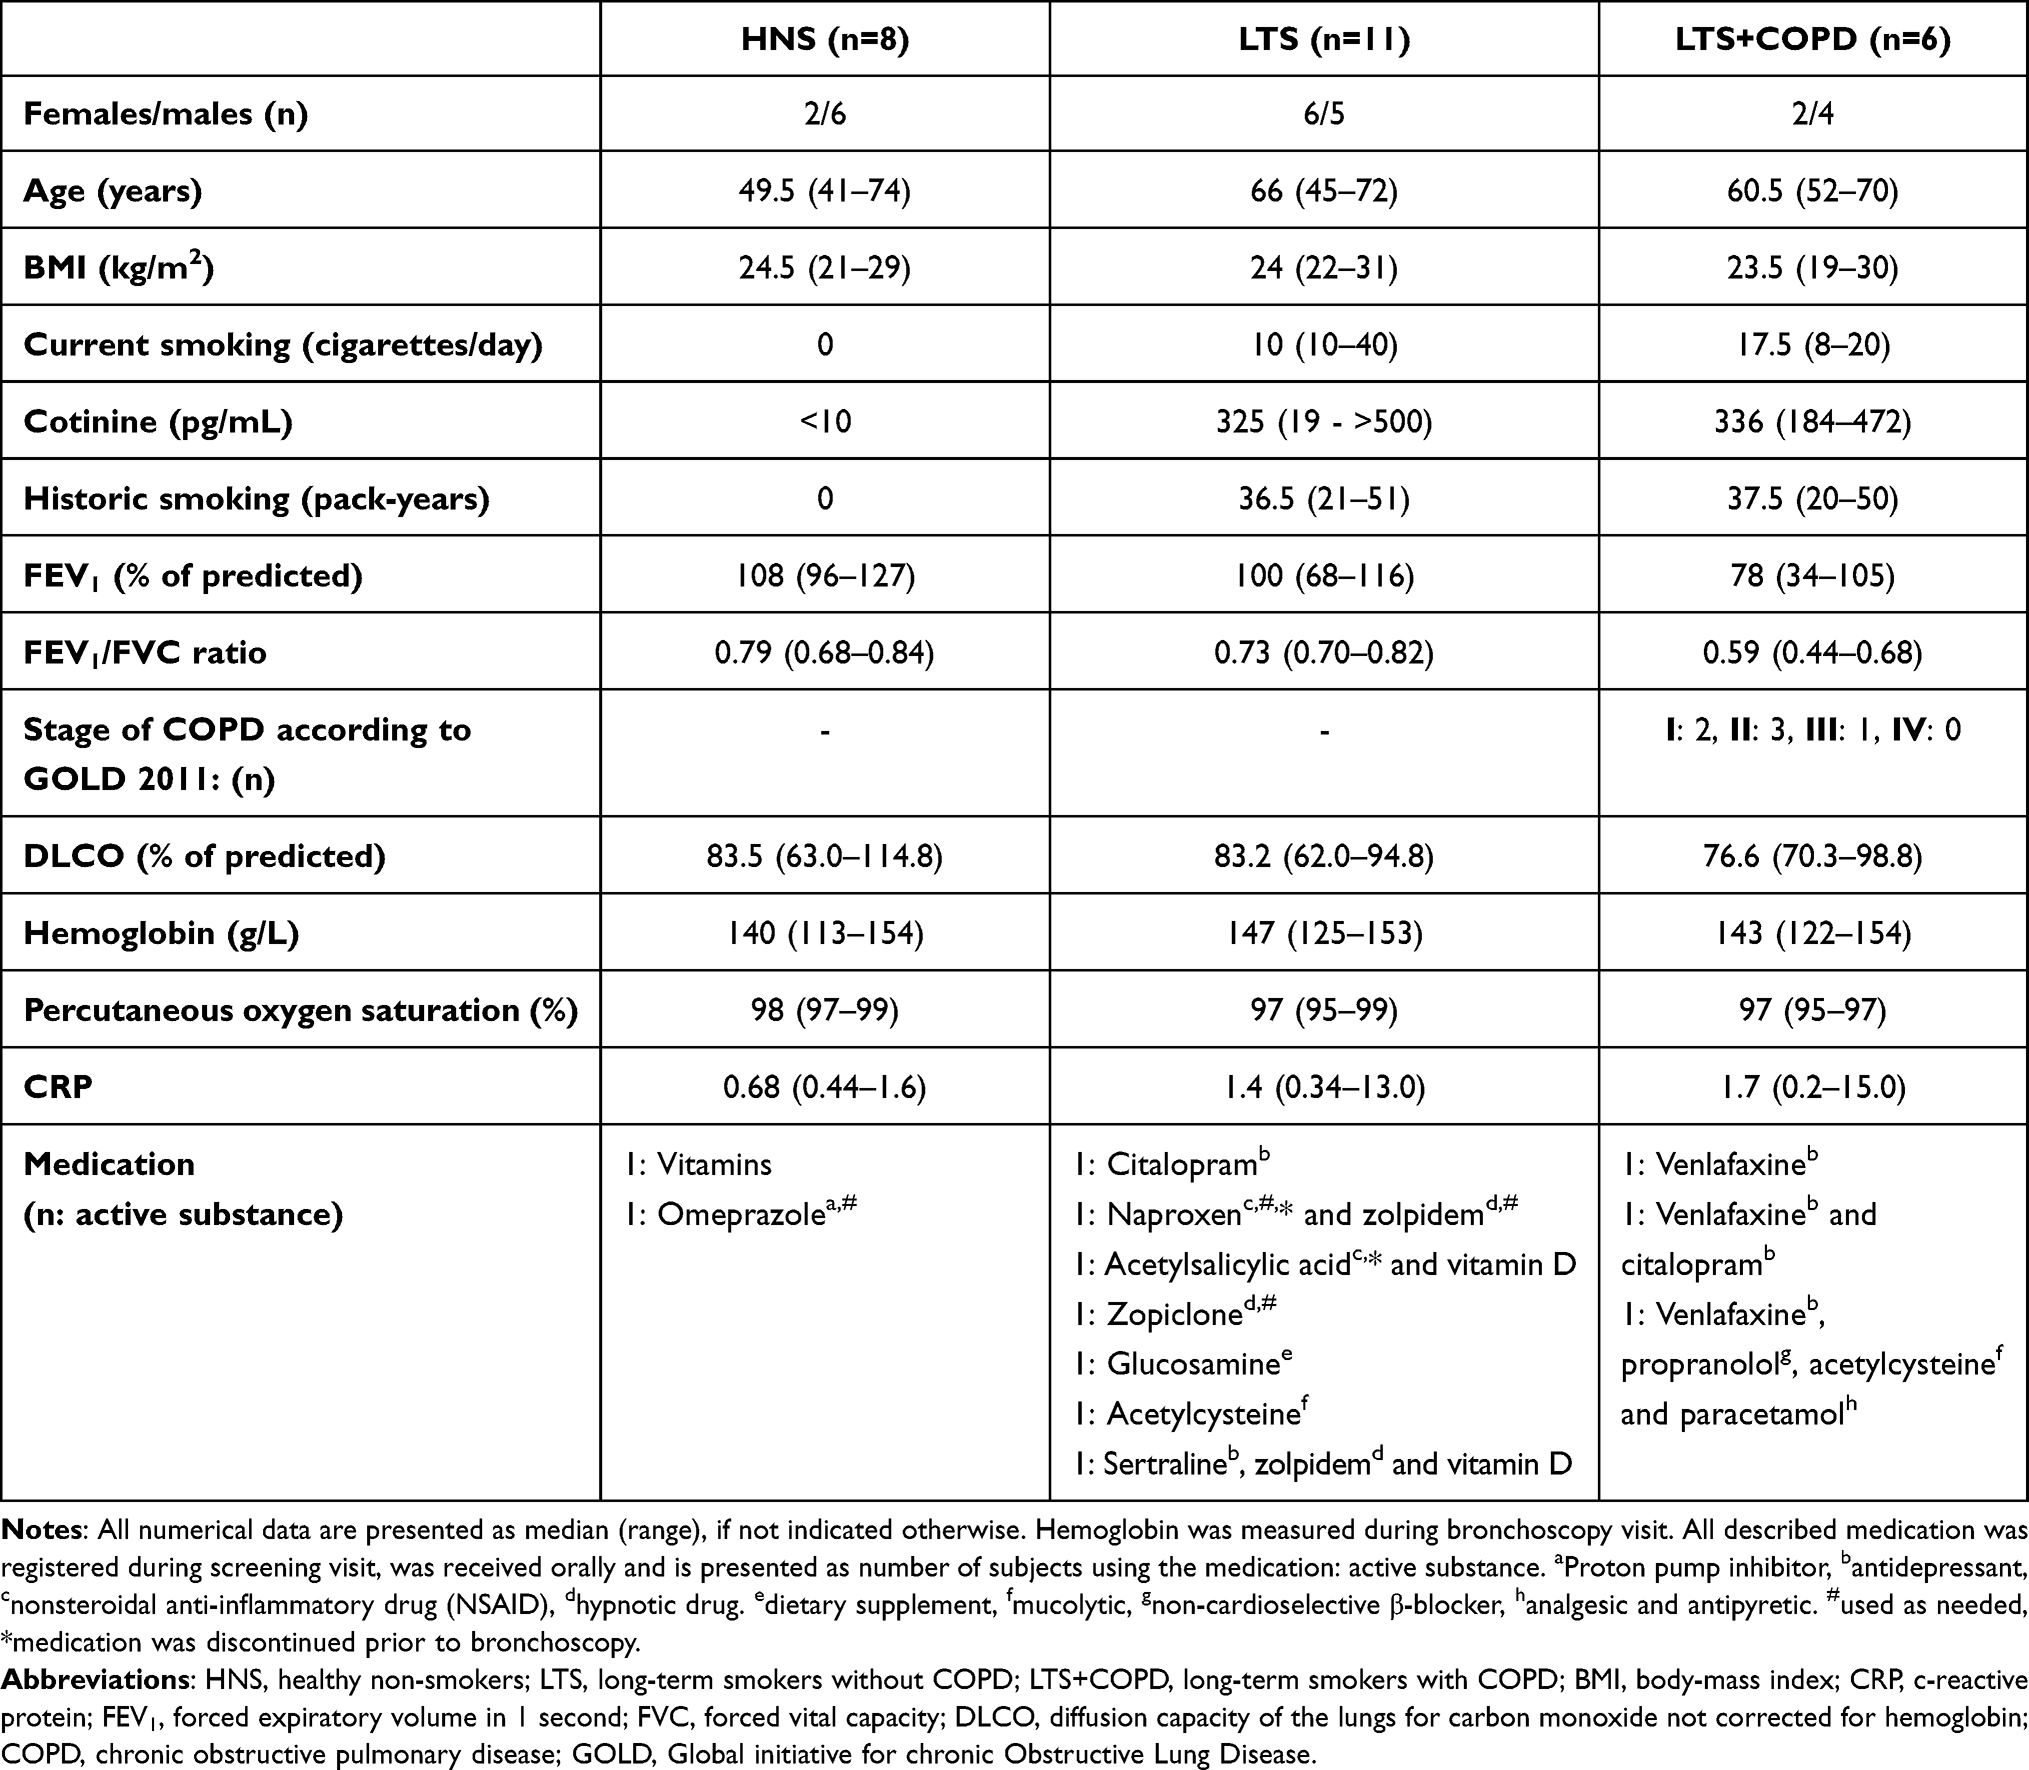 |
Table 1 Clinical Characteristics of the Human Study Population |
Table 2 presents the baseline characteristics of BAL and blood samples. Data on neutrophil concentrations are presented more in-depth below, in the section “Neutrophil concentrations in long-term smokers with COPD”.
 |
Table 2 Characteristics of Blood and BAL Samples |
Notably, the bacteriological analysis in samples from the lower airways revealed growth of airway pathogens in HNS mainly and less in LTS, while no such pathogens were detected in LTS+COPD (Table 3).
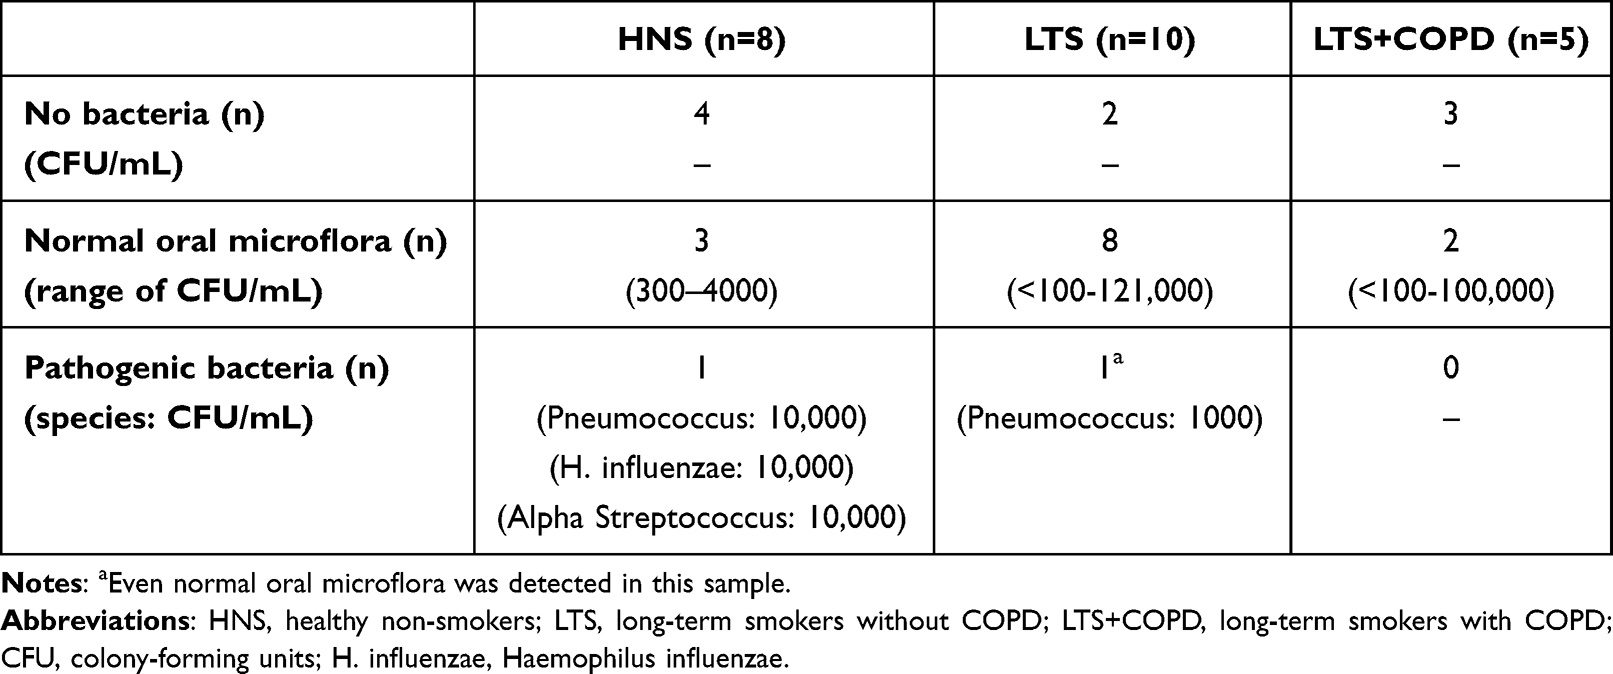 |
Table 3 Bacteriological Findings in the Lower Airways |
Glucose Homeostasis in Long-Term Smokers with COPD
The LTS+COPD group displayed a lower concentration of fasting blood glucose and a more pronounced change in blood glucose during OGTT compared with the HNS, and these differences were statistically significant (Figure 1A and B). The concentration of blood glucose at the end of OGTT tended to be elevated in the LTS+COPD compared to the HNS group, though this difference did not reach statistical significance (Figure 1C).
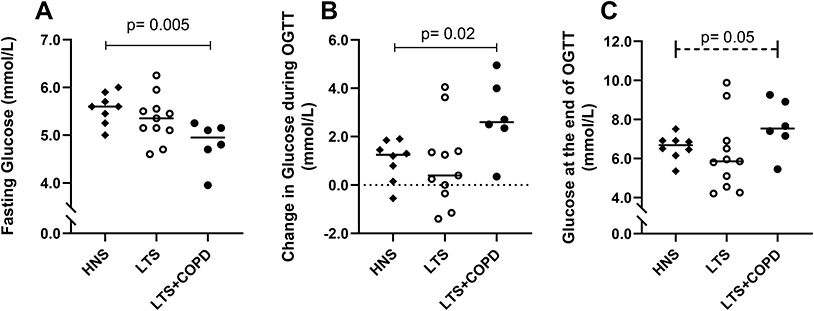 |
Figure 1 (A) Concentration of fasting blood glucose (n= 6–11), (B) change in blood glucose concentration during OGTT (n= 6–11) and (C) concentration of blood glucose at the end of OGTT (120 min) (n= 6–11) measured with a glucose meter in capillary blood of HNS, LTS and LTS+COPD. Abbreviations: OGTT, oral glucose tolerance test; HNS, healthy non-smokers; LTS, long-term smokers without COPD; LTS+COPD, long-term smokers with COPD. Notes: Data are presented as observed and as median values. See “Material and methods” regarding the utilized assays. In all three graphs, group comparisons were restricted between the groups of LTS+COPD and HNS, and were performed using the Mann–Whitney U-test. In graph (C), the performed group comparison is presented with a dotted line, due to a difference close to statistical significance. p < 0.05 was regarded as statistically significant. |
The concentration of fasting blood glucose in the LTS+COPD group displayed a strong positive correlation with the neutrophil concentration in blood, FEV1 (% of predicted) and FEV1/FVC ratio, (Figure 2A-C respectively). In contrast, the concentration of fasting glucose displayed a strong negative correlation with the IL-36α concentration in BALF (Figure 2D). In a similar manner, the blood glucose concentration at the end of OGTT in the LTS+COPD group correlated in a negative manner with the concentration of CXCL10 in BALF (Figure 2E). Notably, none of the above correlations were observed in LTS or HNS (Figure S1 in the data supplement). Finally, there were no evident correlations between any of the glucose-related outcomes with BMI, the neutrophil concentration in BAL or with the concentrations of IL-36γ, IL-6, IL-8 and INF-γ in BALF or plasma of LTS+COPD, as applicable (data not shown).
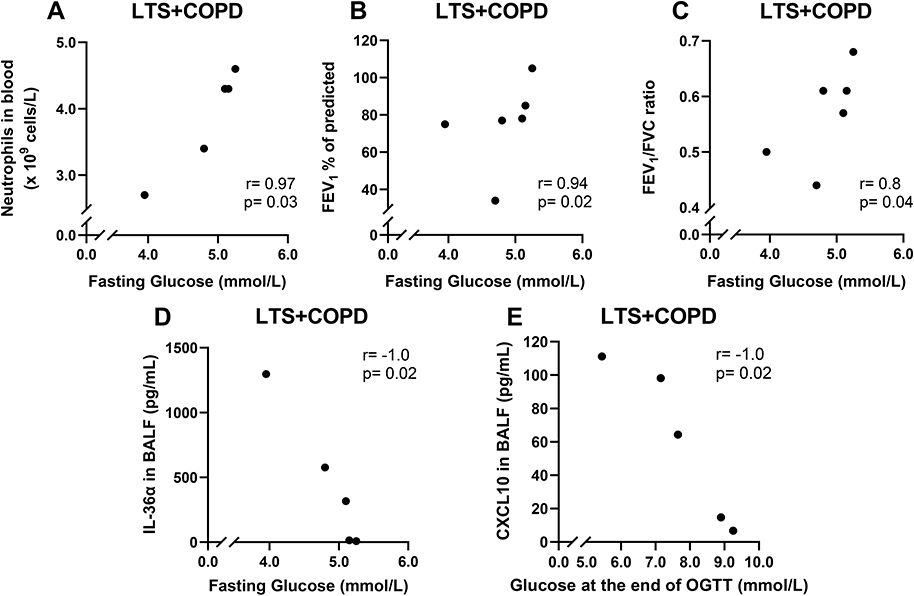 |
Figure 2 Correlation of fasting blood glucose with (A) neutrophil concentration in blood (n= 5), (B) FEV1 (% of predicted) (n= 6) and (C) FEV1/FVC ratio of LTS+COPD (n= 6). Correlation (D) of fasting glucose with IL-36a in BALF (n= 5) and (E) of blood glucose concentration at the end of OGTT (120 min) with CXCL10 in BALF of LTS+COPD (n= 5). Abbreviations: FEV1, forced expiratory volume in 1 second; FVC, forced vital capacity; LTS+COPD, long-term smokers with COPD; IL-36α, interleukin-36α; BALF, cell-free bronchoalveolar lavage fluid; OGTT, oral glucose tolerance test; CXCL10, C-X-C motif chemokine ligand 10. Notes: See “Material and methods” regarding the utilized assays. Correlation analyses were performed using Spearman’s rank correlation test. p < 0.05 was regarded as statistically significant. |
Neutrophil Concentrations in Long-Term Smokers with COPD
The BAL and blood neutrophil concentrations were higher in LTS+COPD than in HNS (Figure 3A and B). Furthermore, the neutrophil concentration in blood samples, but not in BAL, correlated in a strong and positive manner with FEV1 (% of predicted) (Figure 3C) and in a strong and negative manner with IL-36α concentration in BALF of LTS+COPD (Figure 3D), whereas similar correlations were not observed in either the LTS or the HNS group (Figure S2 in the data supplement). We observed no correlations in the LTS+COPD group for BAL or blood neutrophil concentration, with the concentrations of IL-36γ, IL-6, IL-8, INF-γ or CXCL10 either in BALF or plasma, respectively (data not shown).
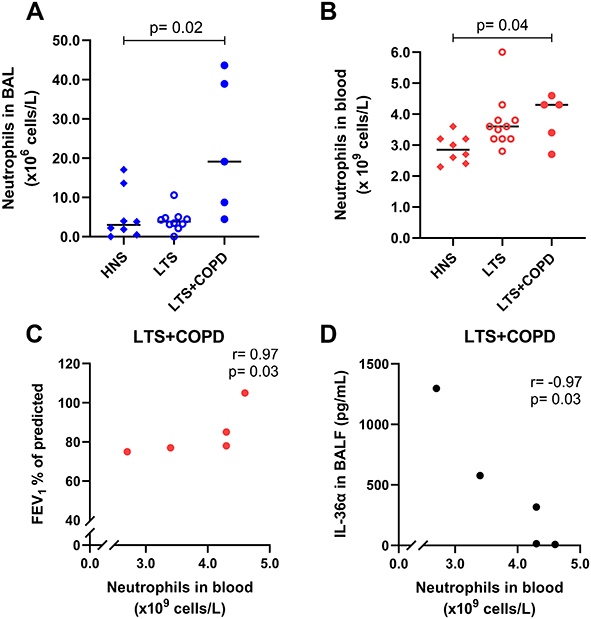 |
Figure 3 Neutrophil concentrations (A) in BAL (n= 5–10) and (B) in blood samples of HNS, LTS and LTS+COPD (n= 5–10). Neutrophil concentration in blood correlated (C) positively with FEV1 (% of predicted) (n= 5) and (D) negatively with IL-36α in BALF of LTS+COPD (n= 5). Abbreviations: BAL, bronchoalveolar lavage; HNS, healthy non-smokers; LTS, long-term smokers without COPD; LTS+COPD, long-term smokers with COPD; FEV1, forced expiratory volume in 1 second; IL-36α, interleukin-36α; BALF, cell-free bronchoalveolar lavage fluid. Notes: Data in graphs (A) and (B) are presented as observed and median values. See “Material and methods” regarding the utilized assays for all graphs. In graphs (A) and (B), group comparisons were restricted between the groups of LTS+COPD and HNS, and were performed using the Mann–Whitney U-test. In graphs (C) and (D), the correlation analyses were performed using Spearman’s rank correlation test. p < 0.05 was regarded as statistically significant. |
Cytokine Concentrations in Long-Term Smokers with COPD
In a previous publication based on the current study material, we showed that the BALF concentrations of IL-36α and IL-36γ were increased in LTS+COPD compared with HNS.28 In the current study, we found that the BALF IL-36α concentration correlated in a strong and negative manner with FEV1 (% of predicted) in the LTS+COPD group (Figure 4), but not in the LTS or the HNS group (Figure S3 in the data supplement). We did not observe any correlation between IL-36γ and ventilatory lung function. Here, neither IL-36α nor IL-36γ correlated with either of the cytokines IL-6, IL-8 or CXCL10 (data not shown). The LTS+COPD group displayed an increased concentration of IL-8 in BALF compared with the HNS group and this difference was statistically significant (Figure 5A). However, the concentration of CXCL10 in the LTS+COPD group did not differ substantially from the HNS group (Figure 6A). Similarly, we observed no pronounced difference in the concentration of IL-6 in BALF between these groups (Figure S4 in the data supplement). Finally, IL-36β and INF-γ were not detectable in BALF.
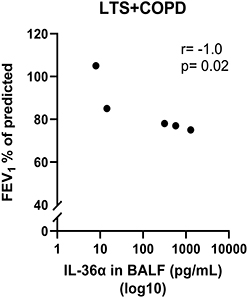 |
Figure 4 Correlation of IL-36α in BALF with FEV1 (% of predicted) in LTS+COPD (n= 5). Abbreviations: IL-36α, interleukin-36α; BALF, cell-free bronchoalveolar lavage fluid; FEV1, forced expiratory volume in 1 second; LTS+COPD, long-term smokers with COPD. Notes: See “Material and methods” regarding the utilized assays. Correlation analysis was performed using Spearman’s rank correlation test. p < 0.05 was regarded as statistically significant. |
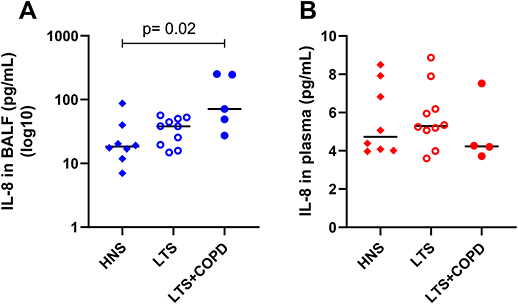 |
Figure 5 Concentration of IL-8 (A) in cell-free BALF (n= 5–10) and (B) in plasma of HNS, LTS and LTS+COPD (n= 4–10). Abbreviations: IL-8, interleukin-8; BALF, cell-free bronchoalveolar lavage fluid; HNS, healthy non-smokers; LTS, long-term smokers without COPD; LTS+COPD, long-term smokers with COPD. Notes: Data are presented as observed and median values. See “Material and methods” regarding the utilized assays. In both graphs, group comparisons were restricted between the groups of LTS+COPD and HNS, and were performed using the Mann–Whitney U-test. p < 0.05 was regarded as statistically significant. |
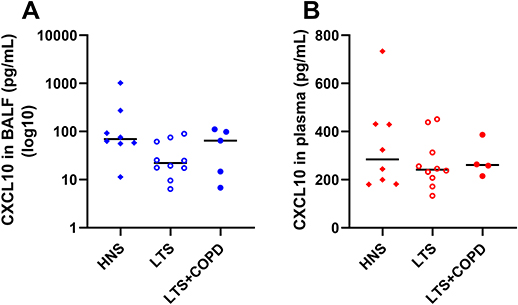 |
Figure 6 Concentration of CXCL10 (A) in cell-free BALF (n= 5–10) and (B) in plasma of HNS, LTS and LTS+COPD (n= 4–10). Abbreviations: CXCL10, C-X-C motif chemokine ligand 10; BALF, cell-free bronchoalveolar lavage fluid; HNS, healthy non-smokers; LTS, long-term smokers without COPD; LTS+COPD, long-term smokers with COPD. Notes: Data are presented as observed and as median values. See “Material and methods” regarding the utilized assays. |
The plasma concentration of IL-36α was increased in LTS+COPD compared with HNS, but this was not the case for IL-36γ, as previously demonstrated.28 Neither the concentration of IL-36α nor IL-36γ correlated with the concentrations of IL-6, IL-8 and CXCL10 or with FEV1 (% of predicted) (data not shown). We observed no pronounced group differences in the plasma concentrations of IL-8 (Figure 5B), CXCL10 (Figure 6B), IL-6 and INF-γ (Figure S4 - Data supplement). Just like the case for BALF, IL-36β was not detectable in plasma.
Proteinases in Long-Term Smokers with COPD
The protein concentration of neutrophil elastase in BALF did not differ in a statistically significant manner between the LTS+COPD and the HNS group (Figure 7). This was true as well for net serine proteinase and net gelatinase activity (Figure S5 - Data supplement). Finally, we did not observe any hint of correlations for these proteinases with glucose homeostasis in the group of LTS+COPD (data not shown).
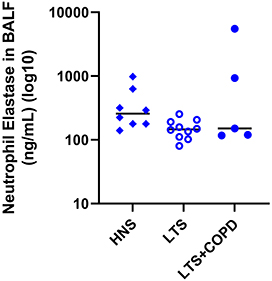 |
Figure 7 Protein concentration of neutrophil elastase in BALF of HNS, LTS and LTS+COPD (n= 4–10). Abbreviations: BALF, cell-free bronchoalveolar lavage fluid; HNS, healthy non-smokers; LTS, long-term smokers without COPD; LTS+COPD, long-term smokers with COPD; vs, versus. Notes: Data are presented as observed and median values. See “Material and methods” regarding the utilized assays. The group comparison between LTS+COPD and HNS was performed using the Mann–Whitney U-test. p < 0.05 was regarded as statistically significant. |
Discussion
The results of this pilot study demonstrate that assessments of glucose homeostasis, in terms of fasting blood glucose concentration, change in blood glucose concentration during OGTT and blood glucose concentration at the end of OGTT, differ substantially in long-term smokers with COPD compared to healthy non-smokers. Moreover, these glucose-related outcomes are associated with local and systemic signs of increased neutrophil mobilization in the LTS+COPD group. Collectively, these findings are suggestive of neutrophil mobilization as a unifying pathogenic mechanism associated with alterations of glucose homeostasis in COPD.
In particular, the blood concentration of fasting glucose was markedly decreased in the LTS+COPD group compared with the HNS group, and this decrease was independent of BMI. Notably, this finding is compatible with previous studies showing an accelerated whole-body glycolysis rate in response to increased energy expenditure among patients with COPD.48,49 It is also possible that neutrophils secrete compounds that suppress hepatic glucose production as previously reported in an experimental study in mice and Zucker diabetic fatty rats.50 Along these lines, fasting glucose concentration correlated in a positive manner with FEV1 (% of predicted) and with the FEV1/FVC ratio, in the LTS+COPD group. Thus, our findings are compatible with fasting blood glucose declining as airway obstruction in COPD does progress.2 In addition, we observed that the protein concentration of IL-36α in BALF correlated in a strong and negative manner with fasting glucose and FEV1 (% of predicted) in LTS+COPD; this is interesting given that our previously published data from the same study material demonstrated enhanced concentrations of IL-36α in BALF and blood of this group compared with the HNS group.28 Notably, although IL-36α belongs to the interleukin-1 (IL-1) super family, just like IL-36β and -γ, we failed to detect any correlation between IL-36β and -γ and glucose homeostasis in the current study.29,30 However, to the best of our understanding, this is the first time to describe an association of IL-36α concentration in the airways with fasting blood glucose in smokers with COPD. We interpret this association as a sign that fasting blood glucose decreases in parallel with the progression of local neutrophil mobilization among these patients.
Furthermore, our study showed that the concentration of glucose at the end of OGTT correlated with the concentration of CXCL10 in BALF within the LTS+COPD group, in a strong and negative manner. We find this interesting given that the CXCL10 concentration in BALF was not markedly altered in the LTS+COPD group compared with the HNS group. However, we observed elevated BALF neutrophil concentrations in LTS+COPD compared with HNS, as expected. It is known that neutrophils produce CXCL10, a CXC chemokine, that recruits type 1 T-helper lymphocytes and natural killer cells.35,36,51 Moreover, CXCL10 has previously been related to neutrophil mobilization caused by oxidative stress in an animal airway model and is enhanced in the airways of patients with exacerbation of COPD.37,52,53 Given this and the demonstrated link between CXCL10 and T2DM in a previous publication, we think that our current findings on CXCL10 lend further support to the hypothesis that local neutrophil mobilization in COPD has an impact on glucose homeostasis that may affect the risk of developing T2DM and MetS.38,54
An important observation was that the change in blood glucose concentration during OGTT was more pronounced in the LTS+COPD group than the HNS group. In line with this finding, the LTS+COPD group tended to have a higher concentration of glucose at the end of OGTT than did the HNS group. These findings indicate a trend towards impaired glucose tolerance in COPD, as yet another sign of altered glucose homeostasis in patients with this disease. Moreover, our study showed that the concentration of blood neutrophils in LTS+COPD was increased in comparison with the HNS group and correlated with fasting glucose in a strong and positive manner, which contrasts with our finding of lower fasting glucose in LTS+COPD compared with HNS. Clearly, these seemingly contradictory results motivate further study and evidence for a causative relationship needs to be established. However, this correlation between the blood concentration of neutrophils and fasting glucose indicates that even systemic signs of neutrophil mobilization in COPD are, indeed, associated with altered glucose homeostasis, an alteration that in both of T2DM and MetS can reach pathologic levels.55
The concentration of blood neutrophils correlated with FEV1 (% of predicted) in the LTS+COPD but not in the LTS or the HNS group. Notably, this suggests an association of ventilatory lung function with systemic neutrophil mobilization, due to COPD, rather than with long-term smoking per se. Progressively declining lung function is a common feature of COPD and it has been related in previous studies to the local accumulation of neutrophils in the airways.56 It is of mechanistic interest that this local accumulation is due to the extravasation of systemically circulating neutrophils.16 Given this, our current observation of a positive correlation between blood neutrophil concentration and FEV1 (% of predicted) seems credible, reflecting the increasing tendency of neutrophil transmigration from blood circulation to the airways that follows the impairment of ventilatory lung function as the pathology of COPD progresses. In agreement with the literature, we observed a markedly enhanced concentration of BAL neutrophils in the LTS+COPD in comparison with the HNS group.57 Despite this, we failed to demonstrate statistically significant correlations between BAL neutrophil concentration and lung function in the LTS+COPD group, most likely due to the modest size of our study population.
In addition to our observations of an increased concentration of BAL neutrophils in the LTS+COPD group, we also observed a corresponding enhanced BALF concentration of IL-8 in this study group, reassuring us that our material is representative for COPD. However, the BALF concentration of neutrophil elastase in the LTS+COPD group did not differ in a statistically significant manner from that in the HNS group. Moreover, the net serine proteinase and gelatinase activity did not display any pronounced enhancement in the LTS+COPD group either. Given that neutrophil elastase and other serine proteinases, as well as gelatinases, are released by neutrophils in response to bacterial exposure, we think that these findings reflect the absence of colonization with pathogenic bacteria of the lower airway tract in the LTS+COPD group of the current study population.16 Furthermore, neither neutrophil elastase nor serine proteinase or gelatinase activity in BALF samples correlated with any of the glucose-related outcomes in the LTS+COPD group. This finding suggests that during stable disease, local proteinases are not among the key aspects of neutrophil mobilization that drive the development of metabolic comorbidities of COPD.
Naturally, the modest size of our current study material limited the number of conclusive group comparisons and associations of outcomes. Nevertheless, our careful clinical characterization of subjects and meticulous laboratory investigations enabled the identification of several group differences and correlations that proved statistically significant for outcomes of pathogenic interest, suggesting that the current findings are sound and of noteworthy biological consequence. Most importantly, we ensured stable disease in the LTS+COPD group by addressing signs of exacerbations, infections and change in inflammatory markers. In parallel, we ensured a thorough and reliable characterization of tobacco use in all three study groups, by addressing current and historic tobacco exposure as well as the systemic cotinine concentration. Furthermore, regular treatment with inhaled beta-2-agonists, which is common in patients with COPD, was excluded in this study, not only because of its anti-inflammatory properties, but even due to its potentially confounding effect on glucose homeostasis.58,59 Finally, BMI did not differ markedly in the three study groups and did not correlate with any of our key variables, which indicates that BMI did not act as a confounder in our study and this adds credibility to our findings.
Conclusion
In conclusion, this pilot study forwards the original evidence that altered glucose homeostasis is associated with specific local and systemic signs of neutrophil mobilization in COPD, and this evidence is fully compatible with the increased risk for metabolic comorbidities in this group of patients. Given our novel observations, we postulate that specific aspects of increased neutrophil mobilization constitute a common denominator for type 2 diabetes mellitus/metabolic syndrome and COPD. We think that this new paradigm motivates further mechanistic exploration with more in-depth metabolic phenotyping in larger and dedicated study materials of well-characterized patients with COPD, an exploration that may facilitate the development of novel diagnostic and therapeutic strategies for a large and neglected group of patients.
Acknowledgments
The project funding for this study was provided by the Swedish Heart-Lung Foundation (AL: No. 20210286, SKL: No. 20200579) and King Gustaf V’s and Queen Victoria’s Freemason Research Foundation (AL). Additionally, federal funding was received from Karolinska Institutet (AL), Stockholm Regional Council (ALF: AL: No. 2018-0088) and Västra Götaland Region (LUA: AL: No. 2014-1851). Additional research funding was obtained via Karolinska Severe COPD Center, through unrestricted grants for research infrastructure from AstraZeneca Nordic AB, GlaxoSmithKline AB and Boehringer-Ingelheim AB, Sweden, respectively. The sponsors’ involvement was limited strictly to their financial support, and none played a role in the execution of the study. Finally, the investigators do not have any financial or other binding to the tobacco industry.
The authors express their gratitude to study nurse Monika Crona BSc and biomedical laboratory scientist Dorota Persson BSc, for their crucial contribution in the collection and processing of the study material at Sahlgrenska University Hospital.
Disclosure
Dr Anders Andersson reports personal fees from Novartis, personal fees from Astra-Zeneca, personal fees from Boehringer-Ingelheim, outside the submitted work. Dr Melissa Kovach reports grants from European Respiratory Society, grants from VINNOVA, during the conduct of the study. The authors report no other conflicts of interest for this work.
References
1. The top 10 cases of death, World Health Organization. 2020; Available from: https://www.who.int/news-room/fact-sheets/detail/the-top-10-causes-of-death.
2. Hogg JC, Timens W. The pathology of chronic obstructive pulmonary disease. Annu Rev Pathol. 2009;4:435–459.
3. Miller J, Edwards LD, Agusti A, et al. Comorbidity, systemic inflammation and outcomes in the ECLIPSE cohort. Respir Med. 2013;107(9):1376–1384.
4. American Diabetes A. Classification and Diagnosis of Diabetes: Standards of Medical Care in Diabetes-2018. Diabetes Care. 2018;41(Suppl 1):S13–S27.
5. Spranger J, Kroke A, Mohlig M, et al. Inflammatory cytokines and the risk to develop type 2 diabetes: results of the prospective population-based European Prospective Investigation into Cancer and Nutrition (EPIC)-Potsdam Study. Diabetes. 2003;52(3):812–817.
6. Alberti KGMM, Eckel RH, Grundy SM, et al. Harmonizing the metabolic syndrome. Circulation. 2009;120(16):1640–1645.
7. Rutter MK, Meigs JB, Sullivan LM, D’Agostino RB, Wilson PW. C-reactive protein, the metabolic syndrome, and prediction of cardiovascular events in the Framingham Offspring Study. Circulation. 2004;110(4):380–385.
8. Ehrlich SF, Quesenberry CP, Van Den Eeden SK, Shan J, Ferrara A. Patients diagnosed with diabetes are at increased risk for asthma, chronic obstructive pulmonary disease, pulmonary fibrosis, and pneumonia but not lung cancer. Diabetes Care. 2010;33(1):55–60.
9. Hughes MJ, McGettrick HM, Sapey E. Shared mechanisms of multimorbidity in COPD, atherosclerosis and type-2 diabetes: the neutrophil as a potential inflammatory target. Eur Respir Rev. 2020;29:155.
10. Piazzolla G, Castrovilli A, Liotino V, et al. Metabolic syndrome and Chronic Obstructive Pulmonary Disease (COPD): the interplay among smoking, insulin resistance and vitamin D. PLoS One. 2017;12(10):e0186708.
11. Hoenderdos K, Condliffe A. The neutrophil in chronic obstructive pulmonary disease. Am J Respir Cell Mol Biol. 2013;48(5):531–539.
12. O’Donnell RA, Peebles C, Ward JA, et al. Relationship between peripheral airway dysfunction, airway obstruction, and neutrophilic inflammation in COPD. Thorax. 2004;59(10):837–842.
13. Andelid K, Andersson A, Yoshihara S, et al. Systemic signs of neutrophil mobilization during clinically stable periods and during exacerbations in smokers with obstructive pulmonary disease. Int J Chron Obstruct Pulmon Dis. 2015;10:1253–1263.
14. Zhang H, Yang Z, Zhang W, et al. White blood cell subtypes and risk of type 2 diabetes. J Diabetes Complications. 2017;31(1):31–37.
15. Buyukkaya E, Karakas MF, Karakas E, et al. Correlation of neutrophil to lymphocyte ratio with the presence and severity of metabolic syndrome. Clin Appl Thromb Hemost. 2014;20(2):159–163.
16. Liew PX, Kubes P. The neutrophil’s role during health and disease. Physiol Rev. 2019;99(2):1223–1248.
17. McDonald B, Kubes P. Innate immune cell trafficking and function during sterile inflammation of the liver. Gastroenterology. 2016;151(6):1087–1095.
18. Phillipson M, Kubes P. The neutrophil in vascular inflammation. Nat Med. 2011;17(11):1381–1390.
19. Johnson JL, Moore EE, Tamura DY, Zallen G, Biffl WL, Silliman CC. Interleukin-6 augments neutrophil cytotoxic potential via selective enhancement of elastase release. J Surg Res. 1998;76(1):91–94.
20. Zeilhofer HU, Schorr W. Role of interleukin-8 in neutrophil signaling. Curr Opin Hematol. 2000;7(3):178–182.
21. Williams JG, Jurkovich GJ, Maier RV. Interferon-gamma: a key immunoregulatory lymphokine. J Surg Res. 1993;54(1):79–93.
22. Pham CT. Neutrophil serine proteases: specific regulators of inflammation. Nat Rev Immunol. 2006;6(7):541–550.
23. Henry CM, Sullivan GP, Clancy DM, Afonina IS, Kulms D, Martin SJ. Neutrophil-derived proteases escalate inflammation through activation of IL-36 family cytokines. Cell Rep. 2016;14(4):708–722.
24. Bolton CE, Evans M, Ionescu AA, et al. Insulin resistance and inflammation - a further systemic complication of COPD. COPD. 2007;4(2):121–126.
25. Di Stefano A, Coccini T, Roda E, et al. Blood MCP-1 levels are increased in chronic obstructive pulmonary disease patients with prevalent emphysema. Int J Chron Obstruct Pulmon Dis. 2018;13:1691–1700.
26. Cimini FA, Barchetta I, Porzia A, et al. Circulating IL-8 levels are increased in patients with type 2 diabetes and associated with worse inflammatory and cardiometabolic profile. Acta Diabetol. 2017;54(10):961–967.
27. Shin MJ, Lee KH, Chung JH, et al. Circulating IL-8 levels in heart failure patients with and without metabolic syndrome. Clin Chim Acta. 2009;405(1–2):139–142.
28. Kovach MA, Che K, Brundin B, et al. IL-36 cytokines promote inflammation in the lungs of long-term smokers. Am J Respir Cell Mol Biol. 2021;64(2):173–182.
29. Bassoy EY, Towne JE, Gabay C. Regulation and function of interleukin-36 cytokines. Immunol Rev. 2018;281(1):169–178.
30. Sims JE, Smith DE, The IL-1. family: regulators of immunity. Nat Rev Immunol. 2010;10(2):89–102.
31. Elias M, Zhao S, Le HT, et al. IL-36 in chronic inflammation and fibrosis - bridging the gap? J Clin Invest. 2021;131:2.
32. Ramadas RA, Ewart SL, Medoff BD, LeVine AM. Interleukin-1 family member 9 stimulates chemokine production and neutrophil influx in mouse lungs. Am J Respir Cell Mol Biol. 2011;44(2):134–145.
33. Ramadas RA, Ewart SL, Iwakura Y, Medoff BD, LeVine AM. IL-36alpha exerts pro-inflammatory effects in the lungs of mice. PLoS One. 2012;7(9):e45784.
34. Giannoudaki E, Hernandez-Santana YE, Mulfaul K, et al. Interleukin-36 cytokines alter the intestinal microbiome and can protect against obesity and metabolic dysfunction. Nat Commun. 2019;10(1):4003.
35. Liu M, Guo S, Hibbert JM, et al. CXCL10/IP-10 in infectious diseases pathogenesis and potential therapeutic implications. Cytokine Growth Factor Rev. 2011;22(3):121–130.
36. Cassatella MA, Gasperini S, Calzetti F, Bertagnin A, Luster AD, McDonald PP. Regulated production of the interferon-gamma-inducible protein-10 (IP-10) chemokine by human neutrophils. Eur J Immunol. 1997;27(1):111–115.
37. Tangedal S, Nielsen R, Aanerud M, et al. Sputum microbiota and inflammation at stable state and during exacerbations in a cohort of chronic obstructive pulmonary disease (COPD) patients. PLoS One. 2019;14(9):e0222449.
38. Chang CC, Wu CL, Su WW, et al. Interferon gamma-induced protein 10 is associated with insulin resistance and incident diabetes in patients with nonalcoholic fatty liver disease. Sci Rep. 2015;5:10096.
39. Padra M, Andersson A, Levanen B, et al. Increased MUC1 plus a larger quantity and complex size for MUC5AC in the peripheral airway lumen of long-term tobacco smokers. Clin Sci (Lond). 2020;134(10):1107–1125.
40. Stockfelt M, Christenson K, Andersson A, et al. Increased CD11b and Decreased CD62L in Blood and Airway Neutrophils from Long-Term Smokers with and without COPD. J Innate Immun. 2020;1:1–10.
41. Quanjer PH, Tammeling GJ, Cotes JE, Pedersen OF, Peslin R, Yernault JC. Lung volumes and forced ventilatory flows. Report Working Party Standardization of Lung Function Tests, European Community for Steel and Coal. Official Statement of the European Respiratory Society. Eur Respir J Suppl. 1993;16:5–40.
42. Salorinne Y. Single-breath pulmonary diffusing capacity. Reference values and application in connective tissue diseases and in various lung diseases. Scand J Respir Dis Suppl. 1976;96:1–84.
43. Definition and classification of chronic bronchitis for clinical and epidemiological purposes. A report to the Medical Research Council by their Committee on the Aetiology of Chronic Bronchitis. Lancet. 1965;1:775–779.
44. Vestbo J, Hurd SS, Agusti AG, et al. Global strategy for the diagnosis, management, and prevention of chronic obstructive pulmonary disease: GOLD executive summary. Am J Respir Crit Care Med. 2013;187(4):347–365.
45. Kovach MA, Singer B, Martinez-Colon G, et al. IL-36gamma is a crucial proximal component of protective type-1-mediated lung mucosal immunity in Gram-positive and -negative bacterial pneumonia. Mucosal Immunol. 2017;10(5):1320–1334.
46. Kovach MA, Singer BH, Newstead MW, et al. IL-36gamma is secreted in microparticles and exosomes by lung macrophages in response to bacteria and bacterial components. J Leukoc Biol. 2016;100(2):413–421.
47. Smith ME, Bozinovski S, Malmhäll C, et al. Increase in net activity of serine proteinases but not gelatinases after local endotoxin exposure in the peripheral airways of healthy subjects. PLoS One. 2013;8(9):45.
48. Kao CC, Hsu JW, Bandi V, Hanania NA, Kheradmand F, Jahoor F. Glucose and pyruvate metabolism in severe chronic obstructive pulmonary disease. J Appl Physiol. 2012;112(1):42–47.
49. Creutzberg EC, Schols AM, Bothmer-Quaedvlieg FC, Wouters EF. Prevalence of an elevated resting energy expenditure in patients with chronic obstructive pulmonary disease in relation to body composition and lung function. Eur J Clin Nutr. 1998;52(6):396–401.
50. Liu HY, Collins QF, Moukdar F, et al. Suppression of hepatic glucose production by human neutrophil alpha-defensins through a signaling pathway distinct from insulin. J Biol Chem. 2008;283(18):12056–12063.
51. Palomino DC, Marti LC. Chemokines and immunity. Einstein. 2015;13(3):469–473.
52. Saetta M, Mariani M, Panina-Bordignon P, et al. Increased expression of the chemokine receptor CXCR3 and its ligand CXCL10 in peripheral airways of smokers with chronic obstructive pulmonary disease. Am J Respir Crit Care Med. 2002;165(10):1404–1409.
53. Michalec L, Choudhury BK, Postlethwait E, et al. CCL7 and CXCL10 orchestrate oxidative stress-induced neutrophilic lung inflammation. J Immunol. 2002;168(2):846–852.
54. Herder C, Baumert J, Thorand B, et al. Chemokines as risk factors for type 2 diabetes: results from the MONICA/KORA Augsburg study, 1984-2002. Diabetologia. 2006;49(5):921–929.
55. Punthakee Z, Goldenberg R, Katz P. Definition, classification and diagnosis of diabetes, prediabetes and metabolic syndrome. Canadian J Diabetes. 2018;42:S10–S15.
56. Stanescu D, Sanna A, Veriter C, et al. Airways obstruction, chronic expectoration, and rapid decline of FEV1 in smokers are associated with increased levels of sputum neutrophils. Thorax. 1996;51(3):267–271.
57. von Scheele I, Larsson K, Dahlen B, et al. Toll-like receptor expression in smokers with and without COPD. Respir Med. 2011;105(8):1222–1230.
58. Barisione G, Baroffio M, Crimi E, Brusasco V. Beta-Adrenergic Agonists. Pharmaceuticals. 2010;3(4):1016–1044.
59. Philipson LH. beta-Agonists and metabolism. J Allergy Clin Immunol. 2002;110(6 Suppl):S313–317.
 © 2022 The Author(s). This work is published and licensed by Dove Medical Press Limited. The
full terms of this license are available at https://www.dovepress.com/terms
and incorporate the Creative Commons Attribution
- Non Commercial (unported, 3.0) License.
By accessing the work you hereby accept the Terms. Non-commercial uses of the work are permitted
without any further permission from Dove Medical Press Limited, provided the work is properly
attributed. For permission for commercial use of this work, please see paragraphs 4.2 and 5 of our Terms.
© 2022 The Author(s). This work is published and licensed by Dove Medical Press Limited. The
full terms of this license are available at https://www.dovepress.com/terms
and incorporate the Creative Commons Attribution
- Non Commercial (unported, 3.0) License.
By accessing the work you hereby accept the Terms. Non-commercial uses of the work are permitted
without any further permission from Dove Medical Press Limited, provided the work is properly
attributed. For permission for commercial use of this work, please see paragraphs 4.2 and 5 of our Terms.