Back to Journals » Drug Design, Development and Therapy » Volume 12
Glucosamine-paracetamol spray-dried solid dispersions with maximized intrinsic dissolution rate, bioavailability and decreased levels of in vivo toxic metabolites
Authors Ali AMA, Khames A, Alrobaian MM, Hamaidi M ![]() , Abourehab MAS
, Abourehab MAS ![]()
Received 4 June 2018
Accepted for publication 31 July 2018
Published 21 September 2018 Volume 2018:12 Pages 3071—3084
DOI https://doi.org/10.2147/DDDT.S176099
Checked for plagiarism Yes
Review by Single anonymous peer review
Peer reviewer comments 3
Editor who approved publication: Prof. Dr. Cristiana Tanase
Ahmed Mahmoud Abdelhaleem Ali,1,2 Ahmed Khames,1,2 Majed Mansour Alrobaian,1 Mohammad Hamaidi,3 Mohammed AS Abourehab4,5
1Department of Pharmaceutics, Faculty of Pharmacy, Taif University, Taif, Kingdom of Saudi Arabia; 2Department of Pharmaceutics, Beni-Suef University, Beni-Suef, Egypt; 3Department of Clinical Pharmacy, Taif University, Taif, Kingdom of Saudi Arabia; 4Department of Pharmaceutics, Umm Al-Qura University, Makkah, Kingdom of Saudi Arabia; 5Department of Pharmaceutics, Minia University, Minia, Egypt
Purpose: This study is aimed at preparing and testing physicochemical, pharmacokinetic and levels of toxic metabolites of paracetamol and glucosamine solid dispersions intended for multiple deliveries via the parenteral or per oral route.
Methods: Solid dispersions were prepared using the spray drying technique at different molar ratios of paracetamol and glucosamine. Characterization of the solid dispersions was carried out using differential scanning calorimetry (DSC), Fourier transform infrared spectroscopy (FTIR), X-ray diffraction (XRD), scanning electron microscopy (SEM), equilibrium solubility and intrinsic dissolution rate. In vivo pharmacokinetics and toxic metabolites of the prepared dispersions were evaluated and compared to those of pure drugs and physical mixtures.
Results: Instant water solubility and more than 7-fold increase in dissolution rate led to significantly high plasma drug concentration (>6.5-fold) compared to paracetamol alone. More than 2-fold increase in area under the curve from 0 to 24 h from the dispersions was noticed on the third day of oral dosing to animals. Lower number and concentration followed by the complete disappearance of toxic pathway metabolites were observed on second and third days of dosing with solid dispersions and physical mixtures, respectively.
Conclusions: The spray-dried dispersions support safer and more effective delivery of multiple doses of paracetamol, leading to an acceleration of its analgesic actions. Synergism between the analgesic actions of paracetamol and joint protective actions of glucosamine in this combination is expected to facilitate effective treatment of persistent pain-related illnesses such as osteoarthritis.
Keywords: glucosamine, paracetamol, pharmacokinetics, reduced hepatotoxicity, solid dispersions, spray drying
Introduction
Paracetamol (P), also known as acetaminophen (APAP) has analgesic and antipyretic properties with weak anti-inflammatory activity. It has moderate solubility in water, high solubility at extreme pH and low permeability; therefore, it was classified as a Biopharmaceutics Classification System class III drug.1 Rapid metabolism of paracetamol in the liver limits its bioavailability and shortens its pharmacological actions. When large doses are administered in the presence of other risk factors, there is a large probability of hepatotoxicity through formation of N-acetyl-p-benzoquinoneimine (NAPQI) by different cytochrome P450 iso-enzymes including CYP2E1, CYP3A4 and CYP1A2.2 Paracetamol is mainly metabolized in the liver through phase II conjugation with glucuronide moiety to form paracetamol-glucuronide (PG) and sulfation to paracetamol sulfate (PS) with both accounting for 85% of the administered dose. The remaining amounts are subjected to oxidation to NAPQI and to a lesser extent, methoxy paracetamol (POMe). In normal liver and at normal therapeutic dosing, NAPQI is detoxified by complexation with glutathione to form paracetamol-glutathione (PGSH), that is further metabolized to paracetamol cysteine (PC) and paracetamol mercapturate (PM).3
When the hepatic reservoir of glutathione is depleted, NAPQI will accumulate and interact with proteins and nucleic acids causing cellular damage and death. Glucosamine (GlucN) is a natural amino sugar that is considered as the main building block for the glycosaminoglycan structure of cartilage found in the joints.4 Patients suffering from osteoarthritis often suffer from gastrointestinal irritation and upset caused by non-steroidal anti-inflammatory drugs (NSAIDs).5 Therefore, combination of an analgesic such as paracetamol with a joint-protective such as GlucN in a fast dissolving dosage form or parenteral injection could help solve these problems. Glucosamine is also claimed to reduce hepatic metabolism of paracetamol through inhibition of cytochrome P450 metabolizing enzymes, thus it can provide an added advantage to the combination by maximizing the bioavailable fraction of paracetamol.6
Amorphization of poorly soluble drug molecules using polymeric amorphous solid dispersions results in glass solutions with enhanced physicochemical properties of drugs.7 Often large volumes of polymers are required for complete miscibility and stability of polymer-based solid dispersions.8 Amorphous solid dispersions of drugs having inadequate physicochemical properties with highly soluble small carrier molecules such as amino acids or amino sugars are better alternatives to drug–polymer dispersions.9–12 Stable dispersions are achieved at the molecular level through H-bonding or ionic interaction between the selected components. Numerous examples of solid dispersions containing two drugs with synchronized/enhanced solubility and dissolution rate have been reported in the literature; such as indomethacin-naproxen and indomethacin-cimetidine.13,14 The presence of electron donor and acceptor sites in the chemical structures of the drug and the coformer helps in the successful formation of amorphous or coamorphous solid dispersions.15 Therefore, the presence of free −OH and amide groups in paracetamol and the multiple OH and primary amine in GlucN could be exploited for the possible formation of amorphous or coamorphous solid dispersions, which has not been previously reported in the literature for this combination.
In this study, spray-dried dispersions of paracetamol and GlucN at different molar ratios were prepared to achieve maximized solubility and instant dissolution rate, thus extending the bioavailability of paracetamol together with lowering of its hepatotoxic metabolites.
Materials and methods
Materials
Paracetamol, glucosamine HCl and acetylsalicylic acid were obtained as a gift sample from Al-Hikma Pharmaceutical Company, Oman, Jordan. HPLC grade solvents (methanol and acetonitrile) were purchased from Sigma Aldrich Co., St Louis, MO, USA. Ethanol (96%) and acetone were purchased from HiMedia laboratories (Mumbai, India). Other chemicals were of analytical grade and were used as received.
Preparation of paracetamol-glucosamine solid dispersions
Solid dispersions containing different molar ratios of paracetamol and GlucN (Table 1) and molecular weights represented by chemical structures in Figure 1A and B, were prepared by spray drying using Buchi Mini-spray dryer B-290 (Buchi Labortechnik AG, Flawil, Switzerland).
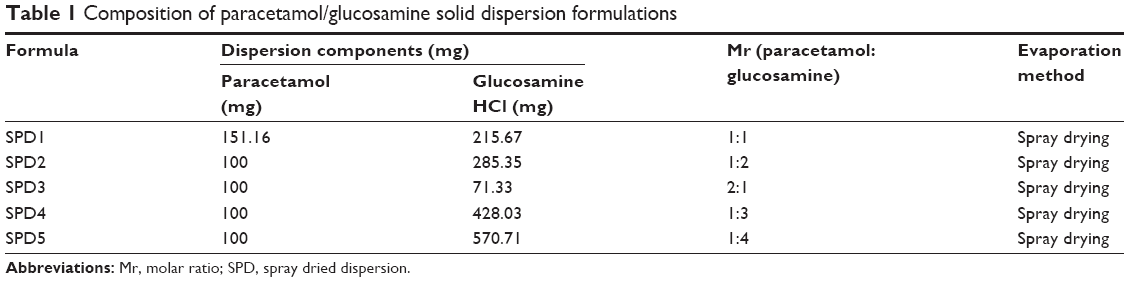 | Table 1 Composition of paracetamol/glucosamine solid dispersion formulations |
 | Figure 1 Chemical structure of glucosamine (A) and paracetamol (B). |
In this method, the weighted amounts of paracetamol and GlucN (mg) were separately dissolved in 60 mL acetone and 40 mL water respectively. The aqueous solution was added portion wise to the acetone solution and the resulting clear solution was evaporated by the spray dryer with adjustments of the inlet temperature to 99°C and the outlet temperature to 40°C. The powder was then collected and kept in a tightly closed dry container for further analysis.
Characterization of solid dispersions using scanning electron microscopy
Samples of the prepared dispersions and those of paracetamol and glucosamine individually and in the physical mixture were examined under a scanning electron microscope (JEOL Ltd, Tokyo, Japan). The shape of the obtained particles of the product was illustrated and compared to the crystalline structures of parent components.
Differential scanning calorimetry (DSC)
Solid state characterization of the dispersions was carried out using small samples (5–10 mg) placed in aluminum pans and heated using differential scanning calorimeter model STA 449 F3 Jupiter (Nietzsche, Germany) under an atmosphere of nitrogen. The heating temperature was set between 20°C and 300°C at a rate of 10°C/min.
Fourier transform infra-red analysis (FTIR)
Samples of GlucN, paracetamol, physical mixtures and solid dispersions (2–3 mg) were individually mixed with 500 mg dry potassium bromide. Powder mixtures were compressed into small discs under a pressure of 68.5–103.4 MPa using a hydrostatic press. The infrared spectrum of each sample was determined at a scanning range of 400–4,000 cm−1 using a Fourier transform infrared instrument (IR Prestige-21, Shimadzu, Japan).
X-ray powder diffraction (X-RPD)
Solid dispersion formulations, GlucN, paracetamol and physical mixtures were examined by X-ray diffraction analysis using a Shimadzu XRD-6000 X-ray powder diffractometer (Shimadzu, Japan). The system was coupled with a standard Cu sealed X-ray tube with voltage and current of 40 kV and 40 mA, respectively. Data collection was performed at 2-theta of 5°–60° in steps of 0.04 and scanning speed of 0.4 degree/sec.
Equilibrium solubility and drug content evaluation
The drug content in the prepared solid dispersions was determined using a modification of an HPLC reported method.16 Samples of solid dispersions equivalent to 10 mg paracetamol and calculated amounts of GlucN according to ratios presented in Table 1 were dissolved in acetonitrile and adjusted to volume using a standard 50 mL volumetric flask. Two milliliters was taken and diluted to 10 mL with a mobile phase composed of phosphate buffer (25 mM) and acetonitrile (80:20 v/v) adjusted to a pH of 9.3. Volumes of 20 μL (n=3) were automatically withdrawn into a photodiode array automated HPLC analysis system model DGU-20A3/LC-20AT/SIL-20A/CTO-20A/SPD-M20A (Shimadzu, Kyoto, Japan).
For equilibrium solubility, excess amounts of the prepared solid dispersions and paracetamol were separately placed into 2 mL Eppendorf tube and dispersed into 1,000 μL distilled water. The dispersions were then shaken using an orbital shaker model SSM (Stuart Equipment, Stone, UK) operated at 300 cycles per min. The shaking process was continued for 48 hours, then the supernatant was separated and diluted to 10 mL with mobile phase and HPLC analysis was used to determine the saturated equilibrium solubility of the solutions (n=3).
Evaluation of the intrinsic dissolution rate
Fixed-disc method was used for determination of the intrinsic dissolution rate.17 In this test, pure paracetamol (100 mg) and an equivalent weight of solid dispersion formulation (SPD5) and physical mixture (1:4 Mr) were compressed into small tablets (0.8 cm diameter) using an Erweka benchtop automatic tableting machine (model EP-1 Vers.2D-63150, Langen, Germany). The backs of tablets (n=3) were covered with a layer of molten hard paraffin which was permitted to solidify inside a plastic holder before immersion into the dissolution medium. This test was performed using full automated dissolution system model UDT-804 paddle dissolution apparatus (Logan Instruments Corp., Somerset, NJ, USA) with vessels containing 500 mL of phosphate buffer adjusted to pH 6.8 and rotation speeds of 50, 75, and 100 rpm in three runs.
At predetermined time intervals of 5, 10, 20, 30, and 45 minutes, 5 mL samples were automatically withdrawn and taken for HPLC analysis and fresh solution equivalent to withdrawn samples were added to replenish the dissolution medium. The amount dissolved per unit area of the tablet (Gω) was determined as a function of dissolution time (min). The intrinsic dissolution rate at infinite rotation speeds (K1) determined at zero diffusion layer (mg/cm2/s), was obtained from the following equation resulting from plotting the reciprocal of Gω against the reciprocal of the angular velocity ω.12
|

where Gω is the intrinsic dissolution rate at ω (mg/cm2/s); K1 is the intrinsic dissolution rate at infinite rotation speed (mg/cm2/s); K2 is a constant; ω is the angular velocity (radians/s) and each 6.28 radians =1× 360° revolution.
In vivo pharmacokinetics of paracetamol-glucosamine solid dispersions
A comparison between the pharmacokinetics of paracetamol alone (first group), 1:4 physical mixture with GlucN (second group) and solid dispersion SPD5 (third group) were carried out using 12 male albino rabbits (1.5–2 kg) divided into four groups, of 3 rabbits each. Three mL of the GlucN solution at a concentration of 19 mg/mL was administered three times a day to the fourth group before the administration of solid dispersion SPD5. In this study, all animals were given humane care in accordance with the local guiding standards of Taif University and in accordance with the Helsinki Declaration on animal care and handling. Ethical approval of the study was granted by Taif University ethical committee.
Oral administration of formulations equivalent to 15 mg/kg of paracetamol was given as oral solutions in phosphate buffer with pH 3 on the first day then increased to 25 mg/kg on the second and third day, using oral gavage syringe thrice daily for three consecutive days. Blood samples were withdrawn from the ear vein after 30 minute, 1, 2, 4, 6, 8, and 24 hour intervals. The maximum plasma level (Cmax), rate (tmax) and extent of bioavailability (AUC0–24) of paracetamol were determined using Microsoft Excel 2013 (Microsoft Corporation, Redmond, WA, USA) and by trapezoidal rule and regression analysis of the terminal portion of the curve. Detection and quantification of the metabolites were also performed using the HPLC method.18
Serum was separated using a centrifuge at 3,000 rpm for 10 minutes. Thereafter the serum was transferred to Eppendorf tubes and preserved at −20°C before analysis. Prior to HPLC analysis, 50 μL of 30% perchloric acid was added to each 150 μL of serum samples and re-centrifuged for at 3,000 rpm for 10 minutes. Thereafter 20 μL of sample was automatically withdrawn into the column of a fully automated UV/fluorescence HPLC system, model DGU-20A5/LC-20AD/LC-20AB/SPD-20A/SIL-20A/CBM-20A/SPD-M20A (Shimadzu). A calibration curve of paracetamol in plasma was pre-constructed after mixing of 100 μL of plasma with aliquots from a stock solution of paracetamol in the mobile phase to form serial dilutions in the range of 10–50 μg/mL.
Results
SEM characterization of solid dispersions
Samples of paracetamol, GlucN and prepared dispersions were examined under an electron microscope (Figure 2). SEM micrographs indicated large differences in the shape and size of the particles. Figure 2A showed large rhomboid crystals of paracetamol, Figure 2B showed large irregular particles of GlucN, while Figure 2C and D showed spherical aggregated powder particles of the spray-dried solid dispersion SPD5 at 400× and 800× magnification, respectively.
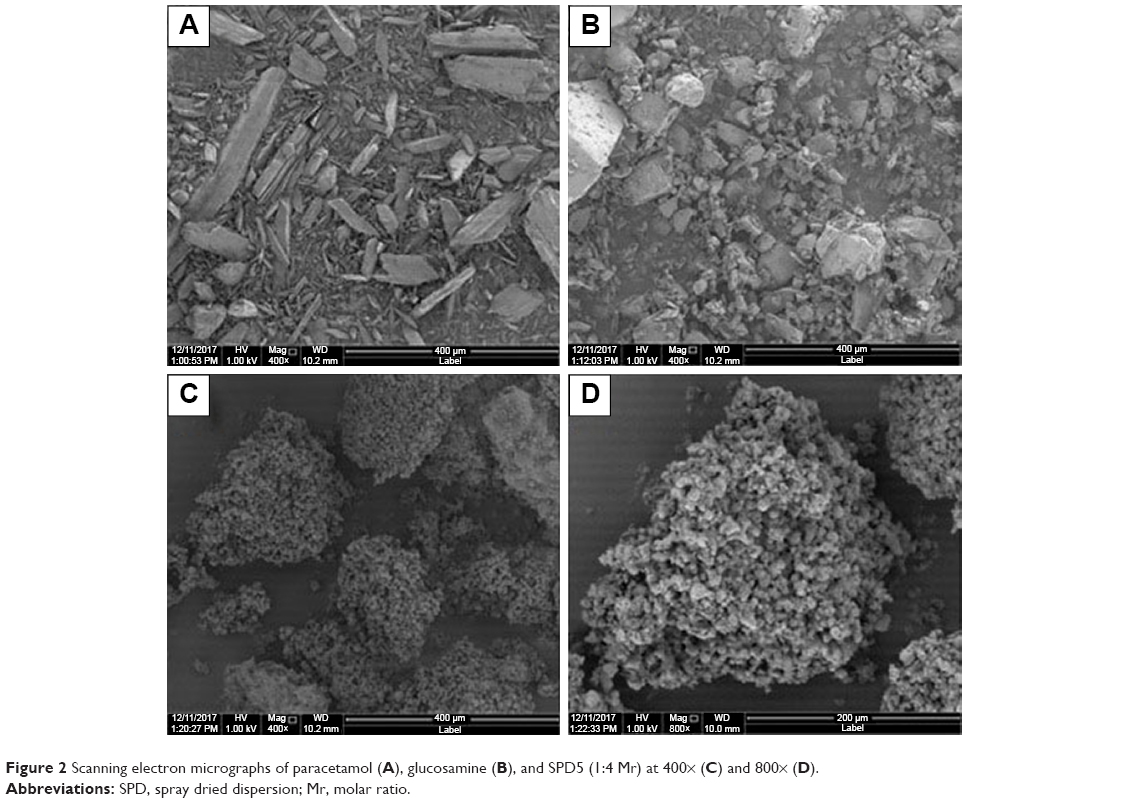 | Figure 2 Scanning electron micrographs of paracetamol (A), glucosamine (B), and SPD5 (1:4 Mr) at 400× (C) and 800× (D). |
Solid state characterization using DSC
Paracetamol (Figure 1A) showed a melting endotherm characterized by a sharp peak at 174°C corresponding to its melting point, which is similar to those found in the literature.19 The thermogram of GlucN showed broad endotherm with a large peak at 211.48°C.20 Thermograms of physical mixtures showed shortened melting endotherms of paracetamol at temperatures of 167.77°C–171.78°C, while the endotherm of GlucN remained unchanged. Shifting of the melting endotherms of physical mixtures to slightly lower temperatures than that of paracetamol (Table 2) indicated no physical interaction, but may be attributed to dilution and increased contact surface between molecules of parent components.
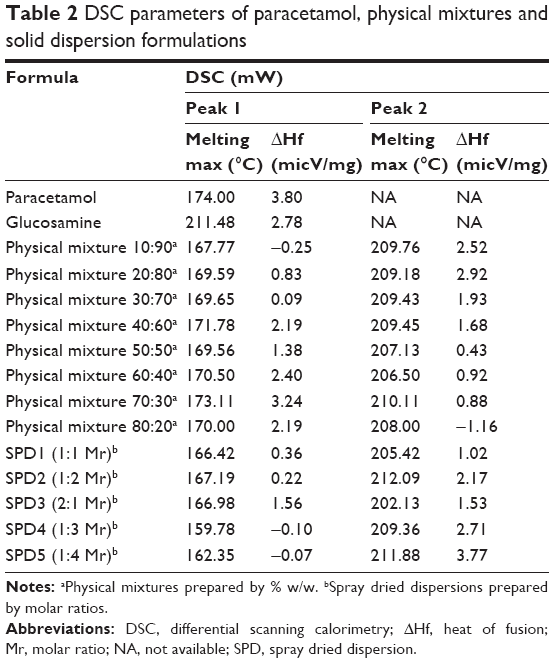 | Table 2 DSC parameters of paracetamol, physical mixtures and solid dispersion formulations |
Thermograms of spray-dried dispersions (Figure 3) showed short, less sharp endotherms with a lower melting temperature of paracetamol by more than 10° compared to those observed with pure drug and physical mixtures (Table 2). Solid dispersions obtained by spray drying at 1:3 (SPD4) and 1:4 (SPD5) molar ratios showed relatively broad and very short melting endotherms at the lowest melting temperatures (159°C and 162°C, respectively).
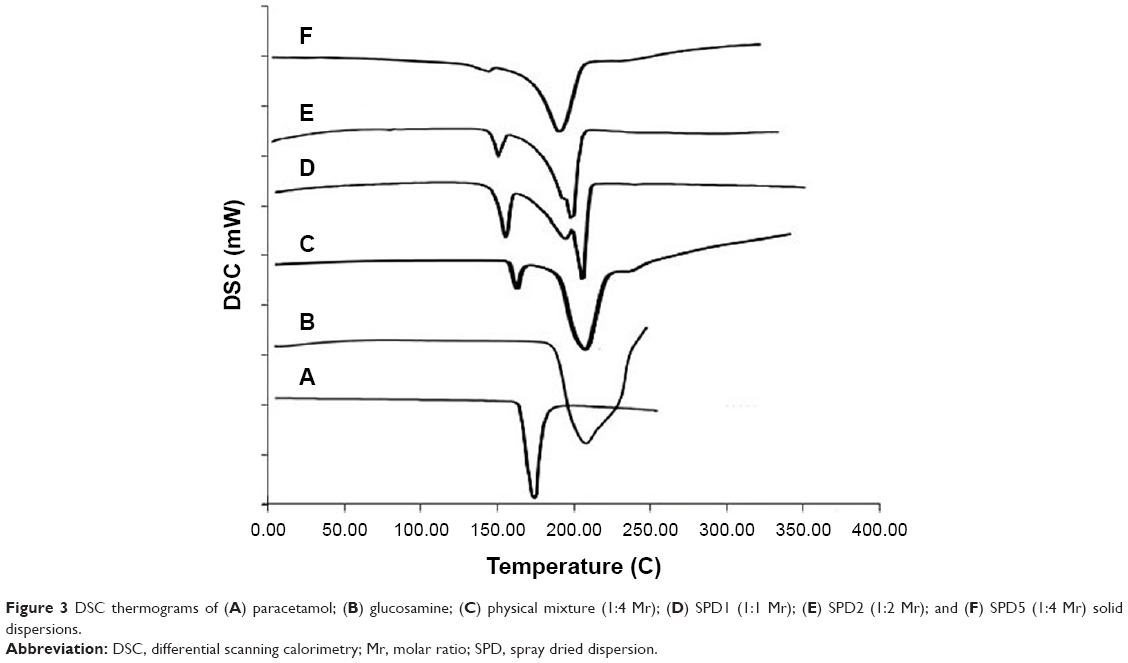 | Figure 3 DSC thermograms of (A) paracetamol; (B) glucosamine; (C) physical mixture (1:4 Mr); (D) SPD1 (1:1 Mr); (E) SPD2 (1:2 Mr); and (F) SPD5 (1:4 Mr) solid dispersions. |
Solid state characterization using FTIR
Infrared spectra of paracetamol and GlucN (Figure 4) demonstrated that the band is overlapping between CH stretch and OH-phenolic stretch between 3,300 and 3,500 cm−1, characteristic of paracetamol (Figure 4A). A characteristic band representing N−H amide bending was detected at 1,523 cm−1 and C=O amide stretching appeared at 1,630 cm−1, consistent with data reported for paracetamol in the literature.21 The IR spectrum of GlucN (Figure 4B) showed a broad duplet band between 3,200–3,500 cm−1, characteristic of primary amine, and a large band at 3,350 cm−1, characteristic of −OH stretching.22 Bands observed for the physical mixture (Figure 4C) represented the summation of characteristic bands of parent components. The most characteristic IR bands of paracetamol (phenolic −OH stretch) and GlucN (doublet bands) caused the spectra of spray-dried dispersions to disappear (red arrows). A new peak was observed on spectra of solid dispersions at 1,566 cm−1 (blue arrows), which did not show up on the spectrum of physical mixture, indicating shifting of the N−H amide band first observed on the spectrum of paracetamol at 1,523 cm−1.
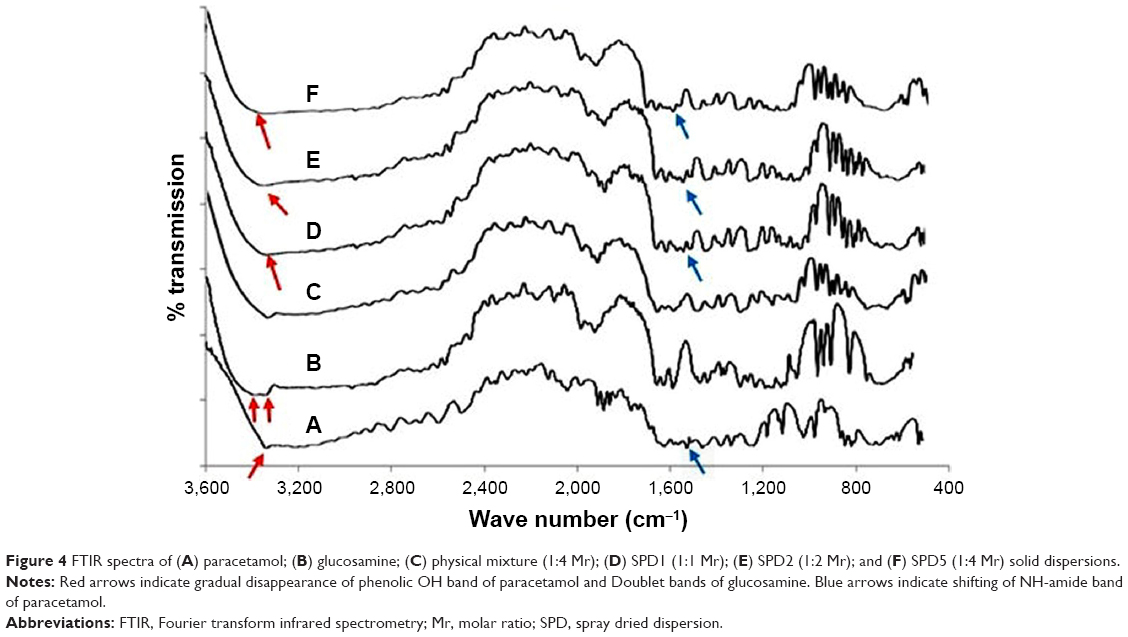 | Figure 4 FTIR spectra of (A) paracetamol; (B) glucosamine; (C) physical mixture (1:4 Mr); (D) SPD1 (1:1 Mr); (E) SPD2 (1:2 Mr); and (F) SPD5 (1:4 Mr) solid dispersions. |
Solid state characterization using XRD
Sharp diffraction lines of paracetamol and GlucN (Figure 5A and B) demonstrated the crystalline nature of both components at two theta values similar to those reported in the literature.23 Diffraction lines of the physical mixture (Figure 5C) were considered as the summation of all characteristic diffraction lines observed for parent compounds. Meanwhile, spray-dried dispersions showed less sharp and shorter diffraction lines. Diffraction line characteristic of paracetamol at 2 theta 18° was highly shortened in both physical mixture and solid dispersions SPD1 and SPD2 (Figure 5D and E) and completely disappeared with SPD5 as demonstrated by the red arrow in Figure 5F. These changes in diffractograms of solid dispersions may indicate molecular interactions and partial formation of amorphous phases in the crystalline matrix.
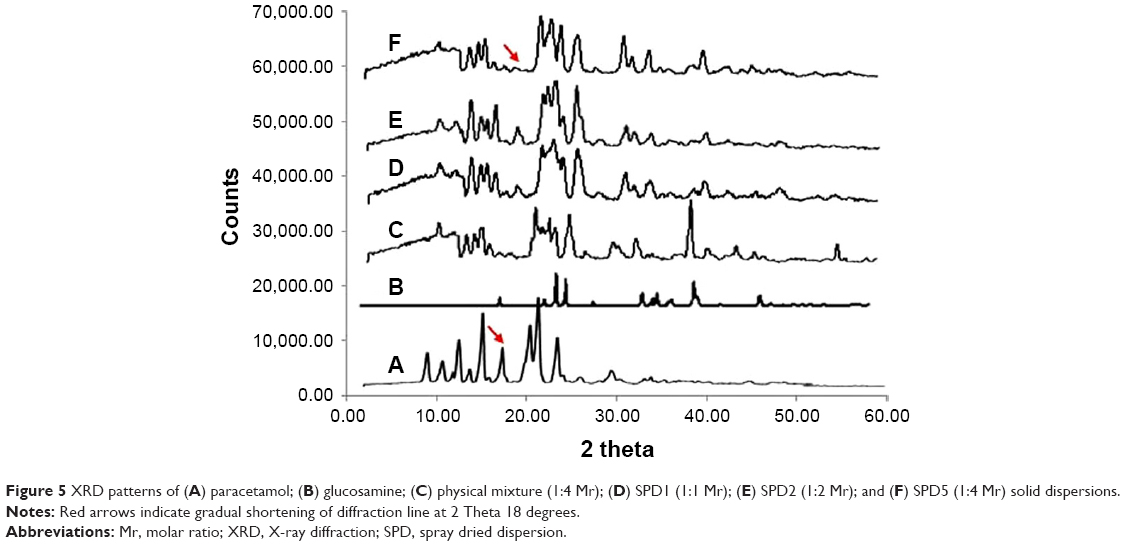 | Figure 5 XRD patterns of (A) paracetamol; (B) glucosamine; (C) physical mixture (1:4 Mr); (D) SPD1 (1:1 Mr); (E) SPD2 (1:2 Mr); and (F) SPD5 (1:4 Mr) solid dispersions. |
Equilibrium solubility of paracetamol in solid dispersions
Results of paracetamol equilibrium solubility in the presence of GlucN were compared between physical mixtures and spray dried formulations at variable molar concentrations and are shown in Table 3 and Figure 6. Physical mixtures containing paracetamol and glucosamine showed up to 92.4% dissolution of paracetamol at 60% w/w GlucN. The spray dried dispersion formulations showed an increasing percentage of dissolved paracetamol with an increased molar concentration of GlucN and the relationship was best described by an exponential function as demonstrated in Figure 6. The maximum percentage of dissolved paracetamol (94.92%) was obtained at 85% w/w GlucN (1:4 molar) represented by dispersion SPD5.
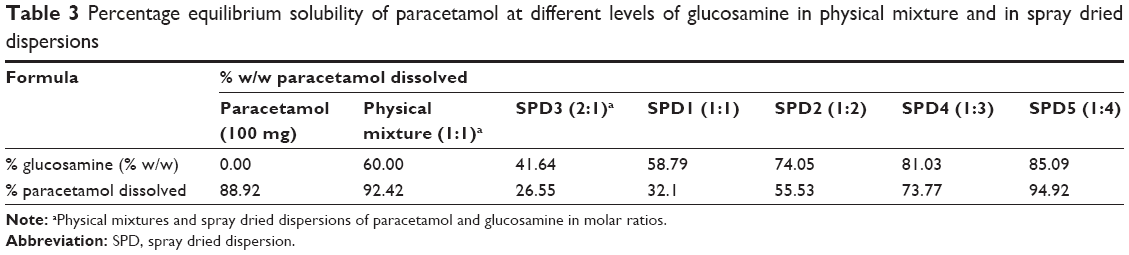 | Table 3 Percentage equilibrium solubility of paracetamol at different levels of glucosamine in physical mixture and in spray dried dispersions |
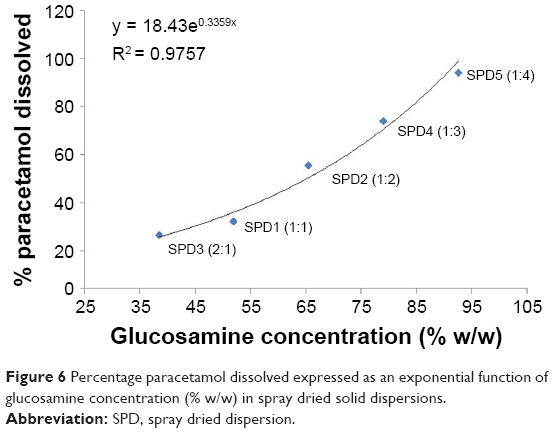 | Figure 6 Percentage paracetamol dissolved expressed as an exponential function of glucosamine concentration (% w/w) in spray dried solid dispersions. |
Intrinsic dissolution rate (IDR)
Intrinsic dissolution rate constant (K1 or Ginf) was calculated for the paracetamol, physical mixture and solid dispersion formula (Table 4). Spray dried dispersion SPD5 showed Ginf more than seven times higher compared to that of paracetamol. Also, the physical mixture (1:4 Mr) demonstrated Ginf more than 3.5 times higher than that of paracetamol. These results indicate that the inclusion of GlucN with paracetamol has a highly significant effect on its rate of dissolution. This could be explained by GlucN acting either as a carrier to paracetamol with a physical mixture or as coformer through molecular interaction by H-bonding in spray-dried dispersions. Findings from this study were superior to those demonstrated for paracetamol IDR calculated in the literature by both rotating disc and stationary disc methods.24
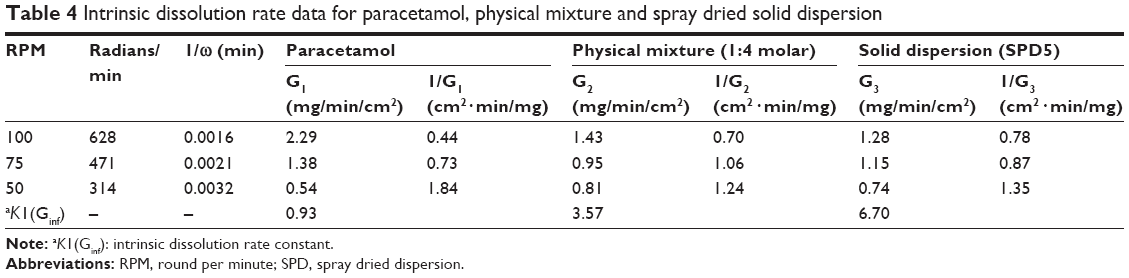 | Table 4 Intrinsic dissolution rate data for paracetamol, physical mixture and spray dried solid dispersion |
In vivo pharmacokinetic parameters
Sharp HPLC peaks of paracetamol were obtained in rabbit plasma in the presence of acetylsalicylic acid as an internal standard indicating high specificity and accuracy of the analysis method. For detection of paracetamol metabolites, the main metabolic pathways together with the structure of each metabolite was summarized in Figure 7 and were used as a reference during HPLC analysis of collected samples.25 Results of identification showed significant variability in the number and concentration of metabolites produced in plasma after multiple administrations to animal groups.
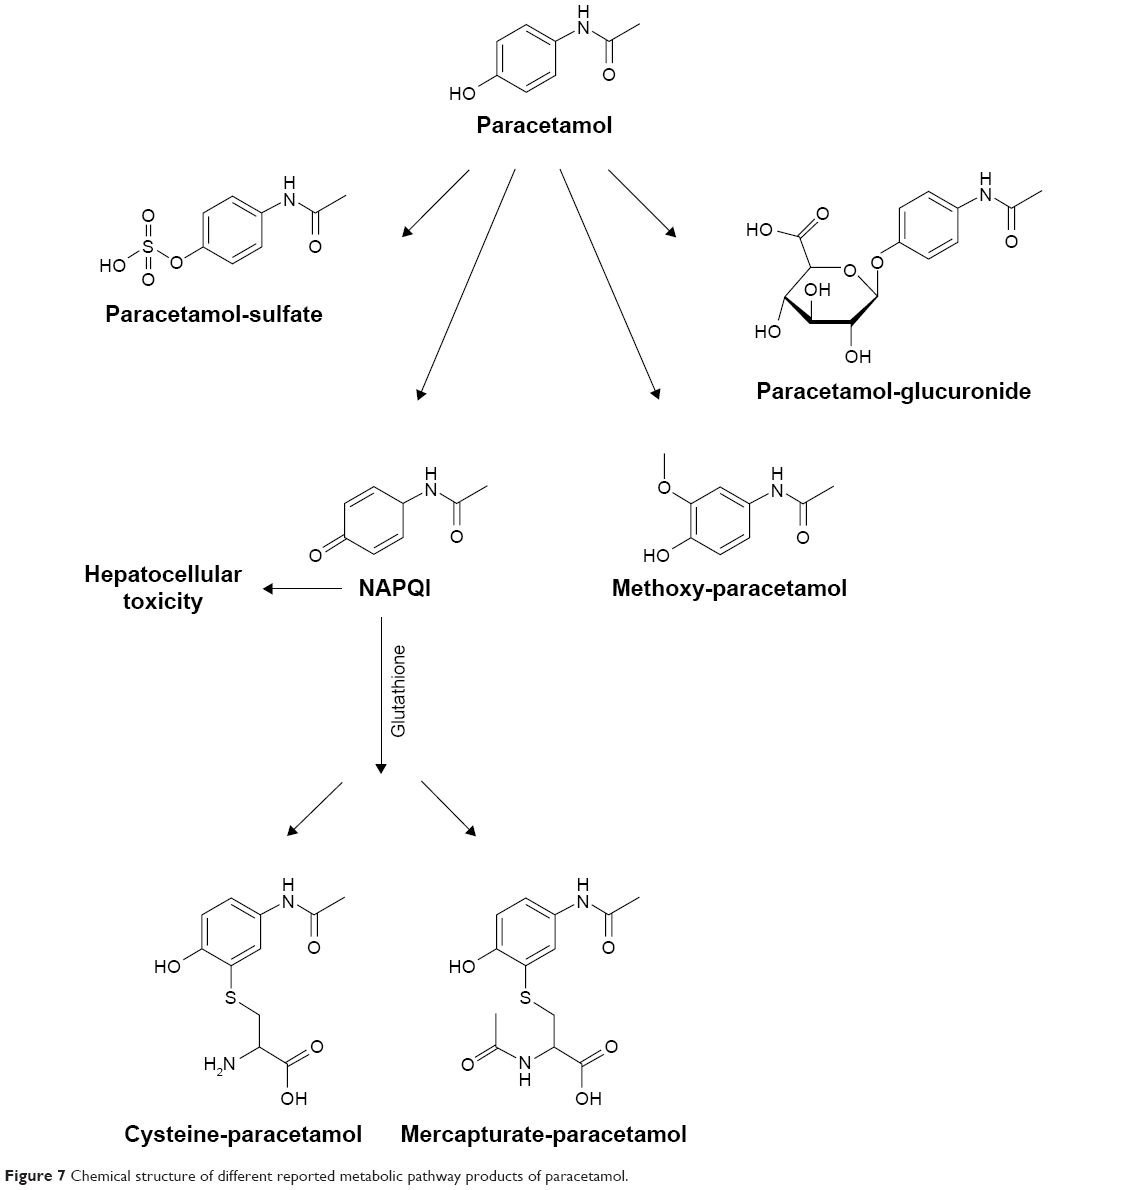 | Figure 7 Chemical structure of different reported metabolic pathway products of paracetamol. |
HPLC chromatograms of paracetamol and internal standard (aspirin) showed sharp and separate peaks following the forked peak of blank plasma as shown in Figure 8A. Treatment-1 with paracetamol alone showed six metabolites on days 2 and 3, including: PG, PS, PC, PGSH, POMe and paracetamol mercapturate (PM), as demonstrated in Figure 8B. The detected metabolites following this treatment were identical to those found in some previous studies on paracetamol metabolites determined in plasma and urine.26 Treatment-2 with a physical mixture showed five metabolites on day 2 (data not shown) and three metabolites on day 3 (Figure 8C). Treatments-3 and 4 with SPD5 alone and SPD5 plus GlucN respectively, showed six metabolites on day 2 (data not shown) and four metabolites on day 3 (Figure 8D). PC, PGSH and PM metabolites completely disappeared from chromatogram of physical mixture.
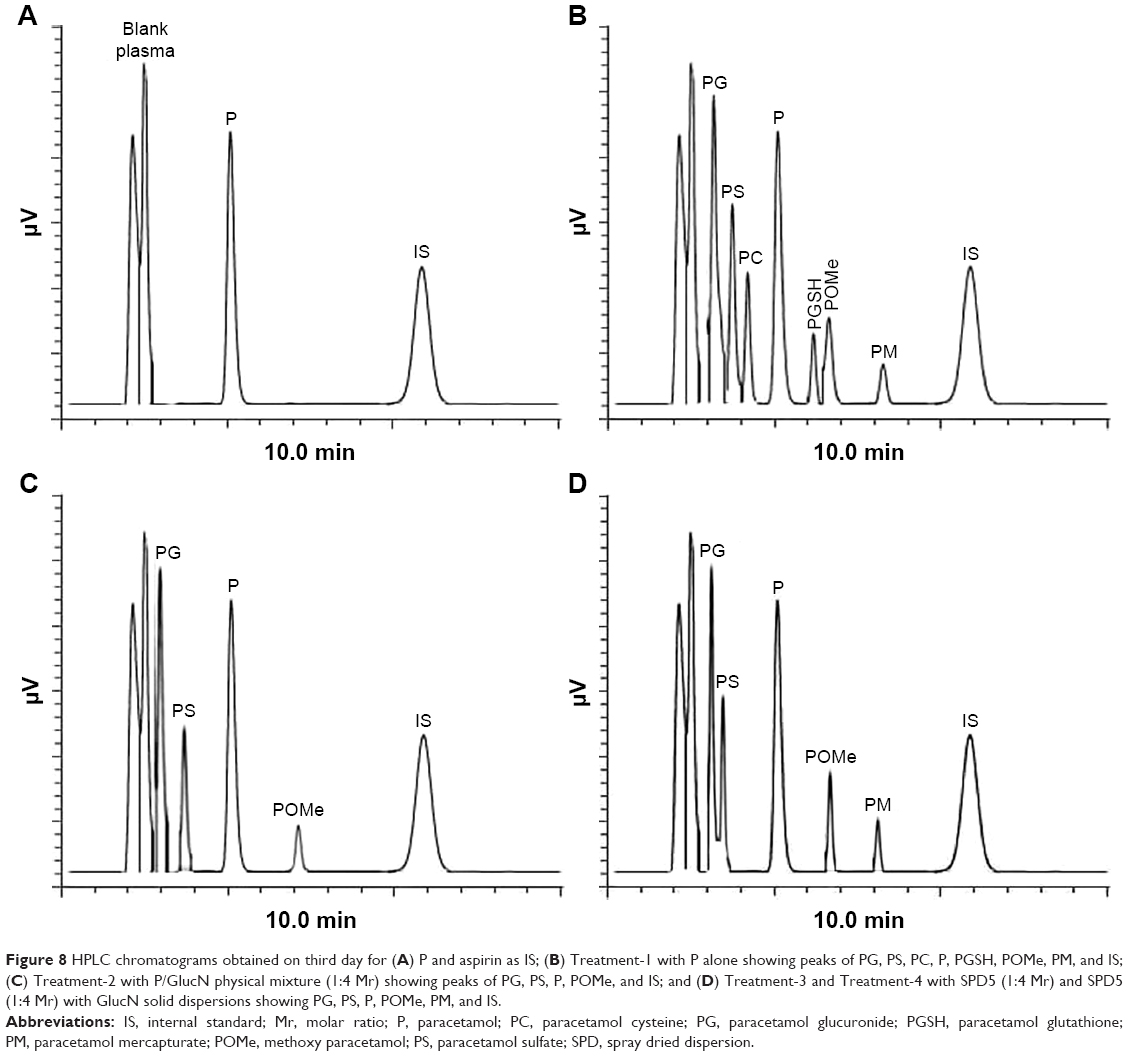 | Figure 8 HPLC chromatograms obtained on third day for (A) P and aspirin as IS; (B) Treatment-1 with P alone showing peaks of PG, PS, PC, P, PGSH, POMe, PM, and IS; (C) Treatment-2 with P/GlucN physical mixture (1:4 Mr) showing peaks of PG, PS, P, POMe, and IS; and (D) Treatment-3 and Treatment-4 with SPD5 (1:4 Mr) and SPD5 (1:4 Mr) with GlucN solid dispersions showing PG, PS, P, POMe, PM, and IS. |
Plasma drug concentration vs time curves of paracetamol obtained for each tested formula after multiple dosing for three consecutive days are shown in Figure 9A–C and pharmacokinetic data are summarized in Table 5. On day 1, each rabbit received 15 mg/kg dose, on day 2 and day 3, 25 mg/kg were given every 8 hours to increase the levels of metabolites in plasma. It was found that treatment-4 (SPD5 plus 3 doses of GlucN) had the highest plasma drug concentration (Cmax =1.86 μg/mL) in 1 hour followed by treatment-2 (physical mixture), treatment-3 (SPD5) and finally treatment-1 (paracetamol alone) as shown in Figure 9A. On day 2, a significant difference (P<0.05) was observed between Cmax of treatment-4 (SPD5 plus GlucN) and all three other treatments and was also observed on day 3 after the dose was increased to 25 mg/kg (Figure 9B and C). Treatment-2 containing physical mixture showed delayed tmax (2 hours) on the three days of treatment in contrast to 1 hour tmax obtained from paracetamol alone (treatment-1) and the two spray-dried formulations (treatments 2 and 3). This behavior can be attributed to faster absorption and longer stability of paracetamol released from SPD5 formulations. It was also observed from Table 5 that the oral bioavailability (AUC0–24 hr) was significantly higher for treatment 3 and 4 containing spray-dried formulations compared to paracetamol and physical mixture, especially on second and third days of treatment.
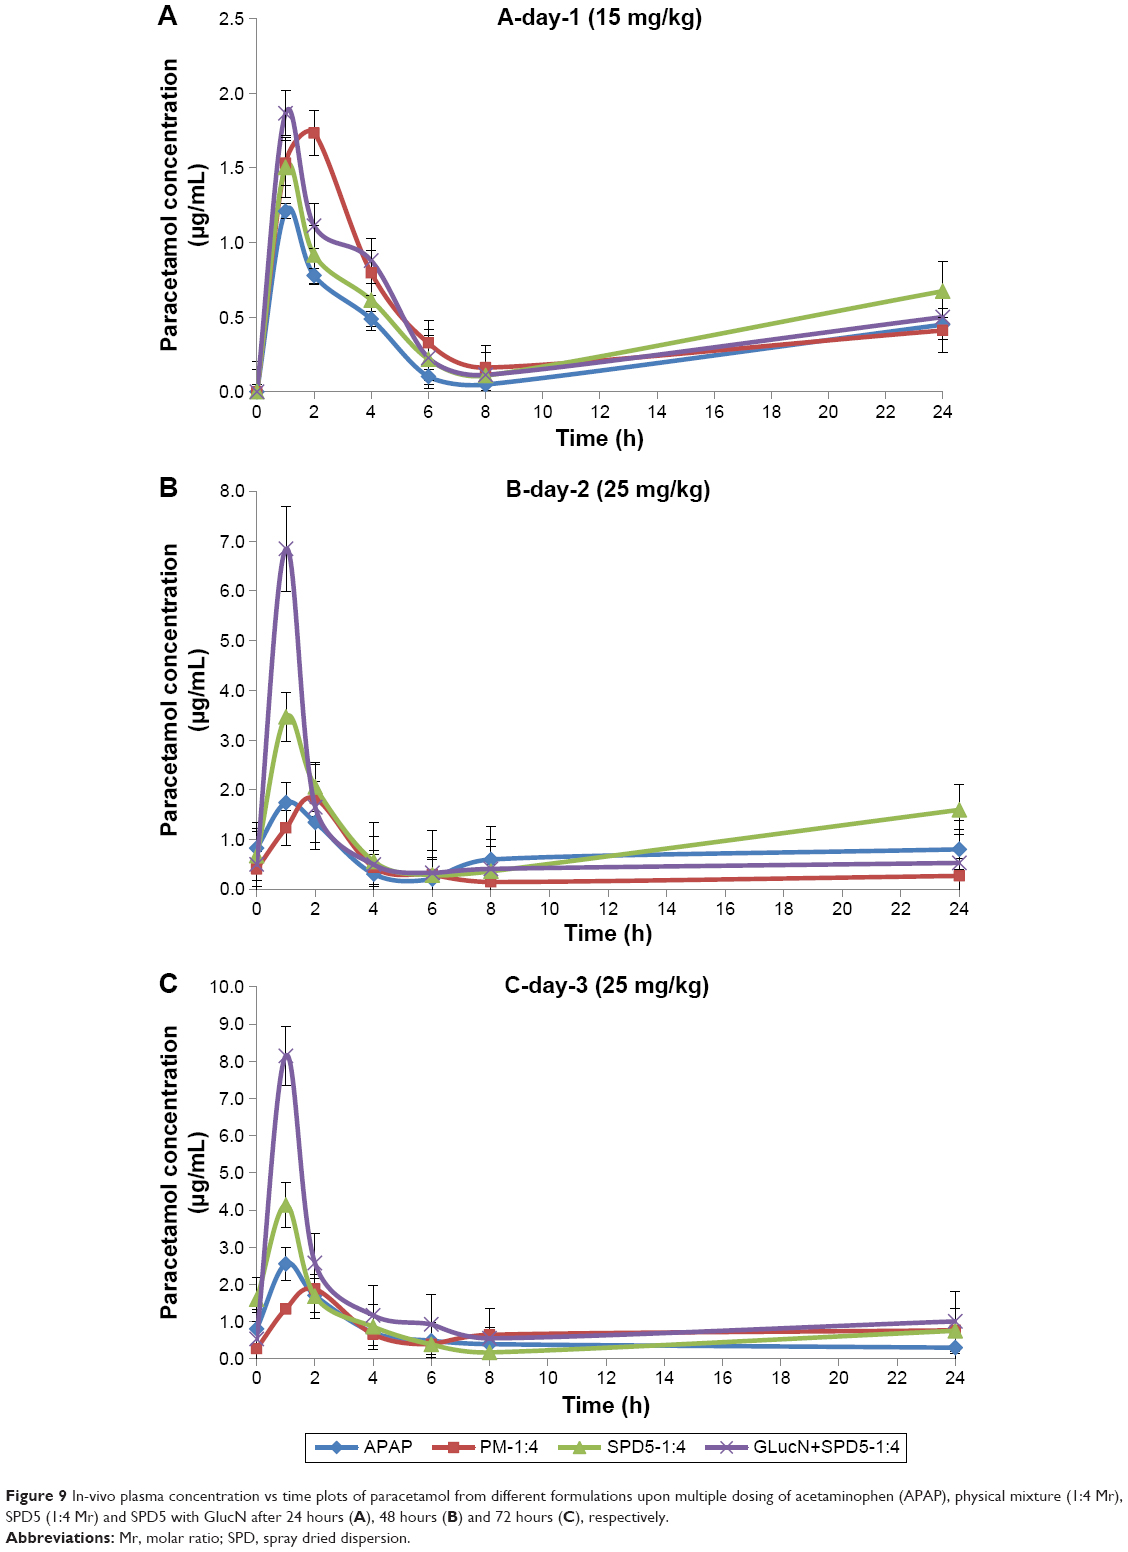 | Figure 9 In-vivo plasma concentration vs time plots of paracetamol from different formulations upon multiple dosing of acetaminophen (APAP), physical mixture (1:4 Mr), SPD5 (1:4 Mr) and SPD5 with GlucN after 24 hours (A), 48 hours (B) and 72 hours (C), respectively. |
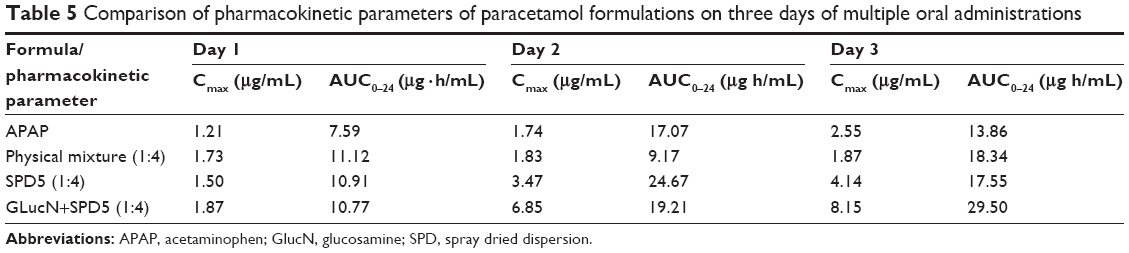 | Table 5 Comparison of pharmacokinetic parameters of paracetamol formulations on three days of multiple oral administrations |
Discussion
The lower melting endotherms of solid dispersions (Table 2) suggest intermolecular interactions such as H-bonding leading to partial amorphization and miscibility between paracetamol and GlucN at the highest molar ratio (1:4).27 IR results also demonstrated peak shortening, overlapping and disappearance of some bands on spectra of solid dispersions. Also, shifting of paracetamol band observed at 1,523 cm−1 to a new position at 1,655 cm−1 on the spectrum of solid dispersions was noticed. These findings together with shortening of XRD diffraction lines and disappearance of some characteristic peaks may support the formation of new matrices or phases between paracetamol and GlucN possibly through H-bonding interactions, as reported for similar solid dispersion combinations mentioned in the literature.28
Paracetamol is continuously and increasingly used as a non-prescription analgesic medication for all types of pain. It is widely used by all ages and in many cases, including post-surgical analgesia. Availability of paracetamol, as an OTC medication, sometimes results in accidental overdosing problems such as liver toxicity due to the accumulation of the reactive metabolite NAPQI. The risk of hepatic toxicity and death makes control of dosing and developing new delivery systems to minimize accidental poisoning of this medication an essential issue.
Many risk factors increase the incidence of paracetamol-induced liver toxicity, such as viral liver infections, fatty liver caused by obesity and type-2 diabetes as well as high alcohol consumption.29 Therefore, developing new spray-dried formulations in this study may be an appropriate solution to risk-free paracetamol administration. Many studies addressed solid dispersions of paracetamol, such as those prepared with Eudragit using hot melt extrusion which was undertaken to identify the nature of dispersed drug in the carrier.30
The results indicated dispersion of amorphous particles of the drug within the matrix of the polymer. In another study, spray drying of paracetamol with chitosan was carried out and proved to be useful in improving both solubility and dissolution rate of the drug from the newly formed matrix through H-bonding.31
These reported data support our findings regarding improved solubility and dissolution rate of paracetamol with additional benefits of the spray dried paracetamol-GlucN dispersion as a self-detoxifying and joint protective combination.
Co-spray drying was also previously applied for paracetamol with different polymers such as hydroxypropyl methylcellulose, polyvinylpyrrolidone, and copovidone, showing highly stable amorphous dispersions with the latter polymer.32
In this study, the prepared spray-dried dispersions with glucosamine showed increased total solubility of paracetamol from 88% to 95% with approximately 8% increase in total solubility. Nonetheless, the most important achievements of the dispersions include instant solubility and improvement of the intrinsic dissolution rate seven times by SPD5 compared to paracetamol alone. This could help in preparing instant dissolving formulations at physiological pH for direct parenteral use or fast dissolving oral tablets and films intended for rapid peroral administration. Results of an in vivo study indicated that incorporation of GlucN with the drug in solid dispersions significantly (P<0.05) increased maximum plasma concentration on second and third days of treatment by more than 6.5-fold. Oral bioavailability (AUC0–24 hr) of the drug obtained from SPD5 preceded by three doses/day of GlucN was also higher than those of paracetamol alone (>2 folds on the third day) and physical mixture (>1.5 folds) upon multiple dosing as showed in Table 5.
The highly accurate and specific HPLC analysis method used in this study enabled detection and differentiation between types of metabolites obtained after each of the four treatments.33,34 After analysis of samples obtained from treatment-2 with physical mixture, three main metabolites were detected with the disappearance of PC, PGSH, and PM, indicating the toxic metabolite NAPQI was not formed due to blocking of CP450 iso-enzyme pathway by GlucN.35 Treatments 3 and 4 showed four metabolites on day-3 with the disappearance of PC and lower levels of PGSH and PM, which also support the above findings.
To further confirm benefits of paracetamol-GlucN dispersions in lowering NAPQI-pathway metabolite levels, peak areas of each toxic metabolite as well as percent relative areas to that of paracetamol were calculated for treated groups (Table 6). The results confirmed decreasing concentration of metabolites on the last two days of treatment. Complete disappearance of PC and PGSH (zero values recorded under peak area) was observed in animals treated with a morning dose of physical mixture and SPD5 plus GlucN on the third day.
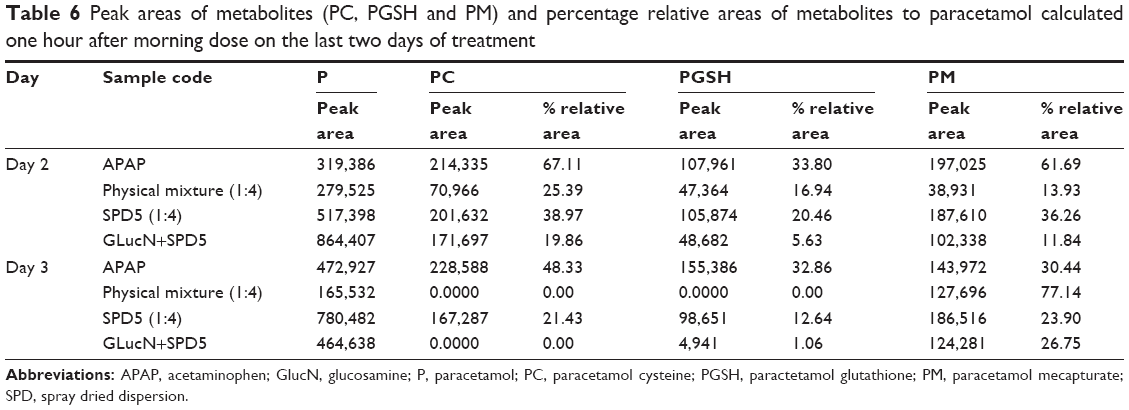 | Table 6 Peak areas of metabolites (PC, PGSH and PM) and percentage relative areas of metabolites to paracetamol calculated one hour after morning dose on the last two days of treatment |
The above findings suggest that spray-dried dispersions of paracetamol and GlucN, especially those prepared at 1:4 Mr, proved successful in achieving highest solubility and dissolution rate, increased Cmax and maximized AUC0–24 hr on three successive days.
Conclusion
Spray drying of paracetamol and GlucN resulted in solid dispersions that proved to be successful in modifying paracetamol instant solubility at physiologic pH together with highly improved intrinsic dissolution rate owing to reduced crystallinity and increased surface area of the solid matrix. The dispersions showed improved bioavailability compared to paracetamol alone and physical mixtures and reduced first pass metabolism and hepatotoxicity. These findings provide strong evidence that solid dispersions of paracetamol and GlucN can inevitably be used for rapid drug delivery at high doses and frequency of administration with minimized risk of patient liver toxicity.
Acknowledgments
The authors would like to express their sincere appreciation to the Deanship of Scientific Research Taif University, Kingdom of Saudi Arabia for its funding of this research through the research Group Project No 1-437-4998. Special thanks to Dr Mayyas Al-Remawi for time spent in proofreading and editing of the manuscript draft.
Disclosure
The authors report no conflicts of interest in this work.
References
Kalantzi L, Reppas C, Dressman JB, et al. Biowaiver monographs for immediate release solid oral dosage forms: acetaminophen (paracetamol). J Pharm Sci. 2006;95(1):4–14. | ||
Laine J, Auriola S, Pasanen M, Juvonen R. Acetaminophen bioactivation by human cytochrome P450 enzymes and animal microsomes. Xenobiotica. 2009;39:11–21. | ||
Hosomi H, Fukami T, Iwamura A, Nakajima M, Yokoi T. Development of a highly sensitive cytotoxicity assay system for CYP3A4-mediated metabolic activation. Drug Metab Dispos. 2011;39(8):1388–1395. | ||
Hrynets Y, Ndagijimana M, Betti M. Transglutaminase-catalyzed glycosylation of natural actomyosin (NAM) using glucosamine as amine donor: Functionality and gel microstructure. Food Hydrocoll. 2014;36:26–36. | ||
Crichton B, Green M. GP and patient perspectives on treatment with non-steroidal anti-inflammatory drugs for the treatment of pain in osteoarthritis. Curr Med Res Opin. 2002;18(2):92–96. | ||
Qinna NA, Shubbar MH, Matalka KZ, Al-Jbour N, Ghattas MA, Badwan AA. Glucosamine enhances paracetamol bioavailability by reducing its metabolism. J Pharm Sci. 2015;104(1):257–265. | ||
Marsac PJ, Li T, Taylor LS. Estimation of drug-polymer miscibility and solubility in amorphous solid dispersions using experimentally determined interaction parameters. Pharm Res. 2009;26(1):139–151. | ||
Dengale SJ, Grohganz H, Rades T, Löbmann K. Recent advances in co-amorphous drug formulations. Adv Drug Deliv Rev. 2016;100:116–125. | ||
Löbmann K, Jensen KT, Laitinen R, Rades T, Strachan CJ, Grohganz H. Stabilized amorphous solid dispersions with small molecule excipients. Amorphous Solid Dispersions: Springer; 2014:613p–636p. | ||
Ali AM, Ali AA, Maghrabi IA. Clozapine-carboxylic acid plasticized co-amorphous dispersions: Preparation, characterization and solution stability evaluation. Acta Pharm. 2015;65(2):133–146. | ||
Ojarinta R, Heikkinen AT, Sievänen E, Laitinen R. Dissolution behavior of co-amorphous amino acid-indomethacin mixtures: The ability of amino acids to stabilize the supersaturated state of indomethacin. Eur J Pharm Biopharm. 2017;112:85–95. | ||
Ali AM, Al-Remawi MM. Freeze Dried Quetiapine-Nicotinamide Binary Solid Dispersions: A New Strategy for Improving Physicochemical Properties and Ex Vivo Diffusion. J Pharm. 2016;2016:2126056. | ||
Beyer A, Grohganz H, Löbmann K, Rades T, Leopold CS. Improvement of the physicochemical properties of Co-amorphous naproxen-indomethacin by naproxen-sodium. Int J Pharm. 2017;526(1–2):88–94. | ||
Lim AW, Löbmann K, Grohganz H, Rades T, Chieng N. Investigation of physical properties and stability of indomethacin-cimetidine and naproxen-cimetidine co-amorphous systems prepared by quench cooling, coprecipitation and ball milling. J Pharm Pharmacol. 2016;68(1):36–45. | ||
Al-Remawi M, Ali AM, Khames A, Hamaidi M. Meloxicam-Paracetamol Binary Solid Dispersion Systems with Enhanced Solubility and Dissolution Rate: Preparation, Characterization, and In Vivo Evaluation. J Pharm Innov. 2017;12(3):206–215. | ||
Shao Y, Alluri R, Mummert M, Koetter U, Lech S. A stability-indicating HPLC method for the determination of glucosamine in pharmaceutical formulations. J Pharm Biomed Anal. 2004;35(3):625–631. | ||
Yu LX, Carlin AS, Amidon GL, Hussain AS. Feasibility studies of utilizing disk intrinsic dissolution rate to classify drugs. Int J Pharm. 2004;270(1–2):221–227. | ||
Flores-Pérez C, Chávez-Pacheco JL, Ramírez-Mendiola B, et al. A reliable method of liquid chromatography for the quantification of acetaminophen and identification of its toxic metabolite N-acetyl-p-benzoquinoneimine for application in pediatric studies. Biomed Chromatogr. 2011;25(7):760–766. | ||
Zalac S, Khan MZ, Gabelica V, Tudja M, Mestrović E, Romih M. Paracetamol-propyphenazone interaction and formulation difficulties associated with eutectic formation in combination solid dosage forms. Chem Pharm Bull. 1999;47(3):302–307. | ||
Al-Hamidi H, Edwards AA, Douroumis D, et al. Effect of glucosamine HCl on dissolution and solid state behaviours of piroxicam upon milling. Colloids Surf B Biointerfaces. 2013;103:189–199. | ||
Trivedi MK, Patil S, Shettigar H, Bairwa K, Jana S. Effect of biofield treatment on spectral properties of paracetamol and piroxicam. Chem Sci J. 2015;6:98–103. | ||
Brugnerotto J, Lizardi J, Goycoolea FM, Argüelles-Monal W, Desbrières J, Rinaudo M. An infrared investigation in relation with chitin and chitosan characterization. Polymer. 2001;42(8):3569–3580. | ||
Wang IC, Lee MJ, Seo DY, et al. Polymorph transformation in paracetamol monitored by in-line NIR spectroscopy during a cooling crystallization process. AAPS PharmSciTech. 2011;12(2):764–770. | ||
Viegas TX, Curatella RU, van Winkle LL, Brinker G. Measurement of intrinsic drug dissolution rates using two types of apparatus. Pharm technol. 2001;25:44–53. | ||
van Wijk RC, Krekels EH, Hankemeier T, Spaink HP, van der Graaf PH. Systems pharmacology of hepatic metabolism in zebrafish larvae. Drug Discov Today: Disease Models; 2017;22(Winter 2016):27–34. | ||
Vertzoni MV, Archontaki HA, Galanopoulou P. Development and optimization of a reversed-phase high-performance liquid chromatographic method for the determination of acetaminophen and its major metabolites in rabbit plasma and urine after a toxic dose. J Pharm Biomed Anal. 2003;32(3):487–493. | ||
Greenhalgh DJ, Williams AC, Timmins P, York P. Solubility parameters as predictors of miscibility in solid dispersions. J Pharm Sci. 1999;88(11):1182–1190. | ||
Wegiel LA, Zhao Y, Mauer LJ, Edgar KJ, Taylor LS. Curcumin amorphous solid dispersions: the influence of intra and intermolecular bonding on physical stability. Pharm Dev Technol. 2014;19(8):976–986. | ||
Gicquel T, Aubert J, Lepage S, Fromenty B, Morel I. Quantitative analysis of acetaminophen and its primary metabolites in small plasma volumes by liquid chromatography-tandem mass spectrometry. J Anal Toxicol. 2013;37(2):110–116. | ||
Qi S, Gryczke A, Belton P, Craig DQ. Characterisation of solid dispersions of paracetamol and EUDRAGIT E prepared by hot-melt extrusion using thermal, microthermal and spectroscopic analysis. Int J Pharm. 2008;354(1–2):158–167. | ||
Takahashi H, Chen R, Okamoto H, Danjo K. Acetaminophen particle design using chitosan and a spray-drying technique. Chem Pharm Bull. 2005;53(1):37–41. | ||
Zhao M, Barker SA, Belton PS, Mcgregor C, Craig DQM. Development of fully amorphous dispersions of a low Tg drug via co-spray drying with hydrophilic polymers. European Journal of Pharmaceutics and Biopharmaceutics. 2012;82(3):572–579. | ||
Suzuki O, Watanabe K. Acetaminophen (paracetamol). In: Drugs and Poisons in Humans. New York: Springer; 2005:335–341. | ||
An JH, Lee HJ, Jung BH. Quantitative analysis of acetaminophen and its six metabolites in rat plasma using liquid chromatography/tandem mass spectrometry. Biomed Chromatogr. 2012;26(12):1596–1604. | ||
Alkhawaja B, Arafat T, Mallah E, et al. Simultaneous determination of paracetamol and its metabolites in rat serum by HPLC method and its application supplement-drug pharmacokinetic interaction. Int J Pharm Anal. 2014;39:2051–2740. |
 © 2018 The Author(s). This work is published and licensed by Dove Medical Press Limited. The
full terms of this license are available at https://www.dovepress.com/terms
and incorporate the Creative Commons Attribution
- Non Commercial (unported, 3.0) License.
By accessing the work you hereby accept the Terms. Non-commercial uses of the work are permitted
without any further permission from Dove Medical Press Limited, provided the work is properly
attributed. For permission for commercial use of this work, please see paragraphs 4.2 and 5 of our Terms.
© 2018 The Author(s). This work is published and licensed by Dove Medical Press Limited. The
full terms of this license are available at https://www.dovepress.com/terms
and incorporate the Creative Commons Attribution
- Non Commercial (unported, 3.0) License.
By accessing the work you hereby accept the Terms. Non-commercial uses of the work are permitted
without any further permission from Dove Medical Press Limited, provided the work is properly
attributed. For permission for commercial use of this work, please see paragraphs 4.2 and 5 of our Terms.