Back to Journals » Risk Management and Healthcare Policy » Volume 14
Geographic and Sociodemographic Disparities in Cardiovascular Risk in Burkina Faso: Findings from a Nationwide Cross-Sectional Survey
Authors Cisse K ![]() , Samadoulougou S
, Samadoulougou S ![]() , Ouedraogo M, Bonnechère B, Degryse JM
, Ouedraogo M, Bonnechère B, Degryse JM ![]() , Kouanda S
, Kouanda S ![]() , Kirakoya-Samadoulougou F
, Kirakoya-Samadoulougou F
Received 20 January 2021
Accepted for publication 2 June 2021
Published 7 July 2021 Volume 2021:14 Pages 2863—2876
DOI https://doi.org/10.2147/RMHP.S301049
Checked for plagiarism Yes
Review by Single anonymous peer review
Peer reviewer comments 2
Editor who approved publication: Professor Marco Carotenuto
Kadari Cisse,1,2 Sekou Samadoulougou,3 Mady Ouedraogo,4 Bruno Bonnechère,5 Jean-Marie Degryse,6,7 Seni Kouanda,2,8 Fati Kirakoya-Samadoulougou1
1Centre de Recherche en Epidémiologie, Biostatistiques et Recherche Clinique, Ecole de Santé Publique, Université libre de Bruxelles, Brussels, Belgium; 2Departement Biomédical et Santé Publique, Institut de Recherche en Sciences de la Santé, Ouagadougou, Burkina Faso; 3Evaluation Platform on Obesity Prevention, Quebec Heart and Lung Institute Research Centre, Quebec, G1V 4G5, Canada; 4Institut National de la Statistique et de la Démographique, Ouagadougou, Burkina Faso; 5Department of Psychiatry, University of Cambridge, Cambridge, United-Kingdom; 6Institut de Recherche Santé et Société, UCLouvain, Bruxelles, Belgium; 7Department of Public Health and Primary Care, KULeuven, Leuven, Belgium; 8Institut Africain de Santé Publique, Ouagadougou, Burkina Faso
Correspondence: Kadari Cisse
Departement Biomédical et Santé Publique, Institut de Recherche en Sciences de la Santé, Ouagadougou, 03 BP 7192, Burkina Faso
Tel +226 76 42 54 86
Fax + 226 50 36 03 94
Email [email protected]
Background: Cardiovascular disease (CVD) risk assessment is a critical step in the current approach to the primary prevention of CVD, particularly in low-income countries such as Burkina Faso. In this study, we aimed to assess the geographic and sociodemographic disparities of the ten-year cardiovascular risk in Burkina Faso.
Methods: We conducted a secondary analysis of the data from the first nationwide survey using the World Health Organization (WHO) STEPwise approach. Ten-year cardiovascular risk was determined using the WHO 2019 updated risk chart (WHO risk) as main outcome, and the Framingham risk score (FRS) and the Globorisk chart for secondary outcomes. We performed a modified Poisson regression model using a generalized estimating equation to examine the association between CVD risk and sociodemographic characteristics.
Results: A total of 3081 participants aged 30 to 64 years were included in this analysis. The overall age and sex-standardized mean of absolute ten-year cardiovascular risk assessed using the WHO risk chart was 2.5% (95% CI: 2.4– 2.6), ranging from 2.3% (95% CI: 2.2– 2.4) in Centre Est to 3.0% (95% CI: 2.8– 3.2) in the Centre region. It was 4.6% (95% CI: 4.4– 4.8) for FRS and 4.0% (95% CI: 3.8– 4.1) for Globorisk. Regarding categorized CVD risk (absolute risk ≥ 10%), we found out that the age and sex-standardized prevalence of elevated risk was 1.7% (95% CI: 1.3– 2.1) for WHO risk, 10.4% (95% CI: 9.6– 11.2) for FRS, and 5.9% (95% CI: 5.1– 6.6) for Globorisk. For all of the three risk scores, elevated CVD risk was associated with increasing age, men, higher education, urban residence, and health region (Centre).
Conclusion: We found sociodemographic and geographic inequalities in the ten-year CVD risk in Burkina Faso regardless of risk score used. Therefore, population-wide interventions are needed to improve detection and management of adult in the higher CVD risk groups in Burkina Faso.
Keywords: geographic disparities, sociodemographic disparities, ten-year cardiovascular risk, Burkina Faso
Introduction
Cardiovascular disease (CVD) is the leading cause of morbidity and mortality across the world.1 In 2015, about 17.9 million deaths were attributed to CVD worldwide, with 422.7 million cases of CVD.1 More than 80% of CVD-related deaths occur in low- and middle-income countries.2 The fatal complications of CVD are observed with older age but the pathological process starts early, in the young adult period. This pathological process is asymptomatic and is influenced by traditional cardiovascular behavior risk factors, such as tobacco use, alcohol use, unhealthy diet, physical inactivity, and metabolic (intermediate) risk factors such as hypertension, dyslipidemia, elevated blood glucose, and obesity.3,4 Behavioral and metabolic CVD risk factors often coexist in the same individual and synergistically increase the risk of future CVD.3 To address this issue, CVD-specific interventions are needed in all parts of health systems, and particularly at the primary care level.4 In low-resource settings, individuals or subgroups at high risk of CVD need to be identified early in order to apply cost-effective interventions.5–8 Two strategies are applicable to achieve this goal: the use of a single-risk-factor management strategy, which focuses on one condition at a time (risk-factor approach), and the use of a more holistic approach considering several risk factors through an absolute CVD risk assessment (risk stratification approach).9 The cost-effective interventions based on each of these approaches are discussed in the literature.5,8,9 Recent studies in low-resource settings have shown the benefits of the absolute CVD risk approach.5,9 Risk assessment is a crucial step in the current approach to the primary prevention of atherosclerotic CVD, particularly in low-income countries such as Burkina Faso.10 As stated in many international guidelines, the current approach to the primary prevention of CVD is based on absolute risk assessment.4,11–13
Many CVD risk prediction tools to identify individuals or groups at high risk are available.14 Most of these risk-prediction tools were developed in high-income countries.15 No Sub-Saharan Africa (SSA) country has a specific CVD risk tool yet. However, some risk charts have been recalibrated for low-resource settings, including for use in SSA. Some of these risk charts have been used in some African countries and have produced divergent results regarding high risk of CVD. Studies have been conducted in four countries in SSA using the Framingham risk score (FRS), including Tunisia,16 Ghana,17 South Africa,18 and Kenya,19 reporting various proportions of individuals at high risk, ranging from 2.9% in Kenya to 18.1% in Tunisia. Using the World Health Organization/International Society of Hypertension (WHO/ISH) risk chart, the prevalence of high CVD risk was found to be 4.5% in Angola,20 1.7% in Kenya,21 4% in Mozambique,22 and 14.9% in Nigeria.23 The variability in reported CVD risk according to the equation used and the study population create challenges for determining the actual prevalence of high CVD risk among the population in SSA, and has motived many calls for context-specific risk-score development.24 The development of a context-specific score requires substantial long-term cohort data, which are unavailable, expensive, or difficult to collect in low-resource settings.17–19,24,25 However, due to the limitations of existing CVD risk prediction charts and the fundamental role of the current approaches in the primary prevention of CVD, many efforts have been expended to improve existing CVD risk assessment tools.25 In 2019, the WHO CVD Risk Chart Working Group updated the WHO/ISH risk prediction chart, recalibrating it for 21 global regions and 79 countries, including Burkina Faso,26 using the WHO STEPwise survey, which offered a new opportunity to assess the CVD risk in low-resource settings. This risk chart (called WHO 2019 updated risk chart (WHO risk)) has been used to estimate population-wide distribution of CVD risk in China27 and Bangladesh.9 Recently, Peiris et al28 have used WHO risk to estimate the 10-year cardiovascular risk in 45 low and middle income countries including 18 countries of Africa. This study had found out that the CVD risk tended to be lower in sub-Saharan Africa compared with other world regions. To apply cost-effective preventative CVD interventions, it is essential to provide reliable information on the distribution of the population at high, intermediate, or low CVD risk.26 All risk scores have limitations; to better understand the population distribution of CVD risk, different risk charts may be used (as Geldsetze et al29 did in India in 2019) since some charts provide complementary information.29
In Burkina Faso, CVDs are a major public health concern, placing an additional burden on the health system given the persistence of high-prevalence infectious diseases. The health system in many low-income countries, including Burkina Faso, is not adapted to manage CVD,30,31 and CVD risk is poorly screened in primary care.32 High prevalences of some CVD risk factors (hypertension, diabetes, and tobacco use) have been reported.33–35 Given the high prevalence of these CVD risk factors, atherosclerotic CVD might be the most important public health concern.36 Despite the importance of CVD risk to inform policymakers and health authorities in understanding the magnitude of the future distribution of CVDs in the population, no study has evaluated this score at the population-wide level in Burkina Faso. The country is currently experiencing demographic and epidemiological transitions, which influence sociodemographic structure and the distribution of disease.37 The availability of the STEPwise survey with biochemical data at the nationwide level has offered an opportunity to assess the population-based CVD risk in the adult population in Burkina Faso. The aim of this study was to evaluate the geographic and sociodemographic distribution of the ten-year CVD risk in Burkina Faso. To better understand the distribution of this risk in Burkina Faso, we assessed the ten-year CVD risk using three different risk scores: WHO risk, Framingham risk score (FRS), and Globorisk. The FRS is one of the most-used risk scores worldwide,17,38–40 particularly in Africa,16,41 as it includes a large number of CVDs as endpoint events. In Burkina Faso, the FRS is the risk score most commonly used to estimate the ten-year cardiovascular risk in clinical practice.42,43 The Globorisk was specially developed for low-income countries and provides 182 country-specific risk charts, including one for Burkina Faso.44
Materials and Methods
Study Type and Population
We performed a secondary analysis of data from the first nationwide cross-sectional survey on noncommunicable disease risk factors in Burkina Faso (WHO STEPwise survey). In our study, we included data from the adult population aged from 30 to 64 years for FRS, WHO risk, and Globorisk. Those participants who reported a history of heart attack, chest pain from heart disease (angina), or stroke were excluded, as were those who were taking drugs to prevent or treat heart disease.
Data Source: WHO STEPwise Survey
The WHO STEPwise approach was used in 2013 to conduct the first nationwide survey on noncommunicable disease risk factors in Burkina Faso.45 The methodology of this survey is explained elsewhere.33–35 This survey was representative at the national and regional levels. Briefly, participants were randomly selected using a cluster-stratified three-stage sampling procedure. At the first stage, a total of 240 enumeration areas (EA) were selected and 20 households were selected from each EA (second stage). In the third stage, one adult aged from 25 to 64 years was selected using the Kish method in each household. A total of 4800 adults were selected, of which 4695 agreed to participate to the study. Two hundred (200) with history of CVD and 1260 participants with less than 30 years old were not considered in the analysis (see flow chart: Figure 1). Information about eight risk factors was collected (hypertension, diabetes, hypercholesterolemia, obesity, tobacco use, alcohol consumption, low fruit and legume consumption, and low physical activity). Each risk factor was collected and recoded according to the WHO STEPwise approach guidelines.33,34,45 During the STEP survey, three measurements of blood pressure were done for each participant. The mean of last two measurements was used to define hypertension. The weight and height were measured using standard tool. These two anthropometric parameters were used to define obesity. The blood glucose and cholesterol were measured from a whole blood sample obtained from a finger pick after a minimum of eight hours fasting. Informations about tobacco use, alcohol consumption, fruit and legume consumption and physical activity were collected during face-to-face interviews using a WHO standardized questionnaire.
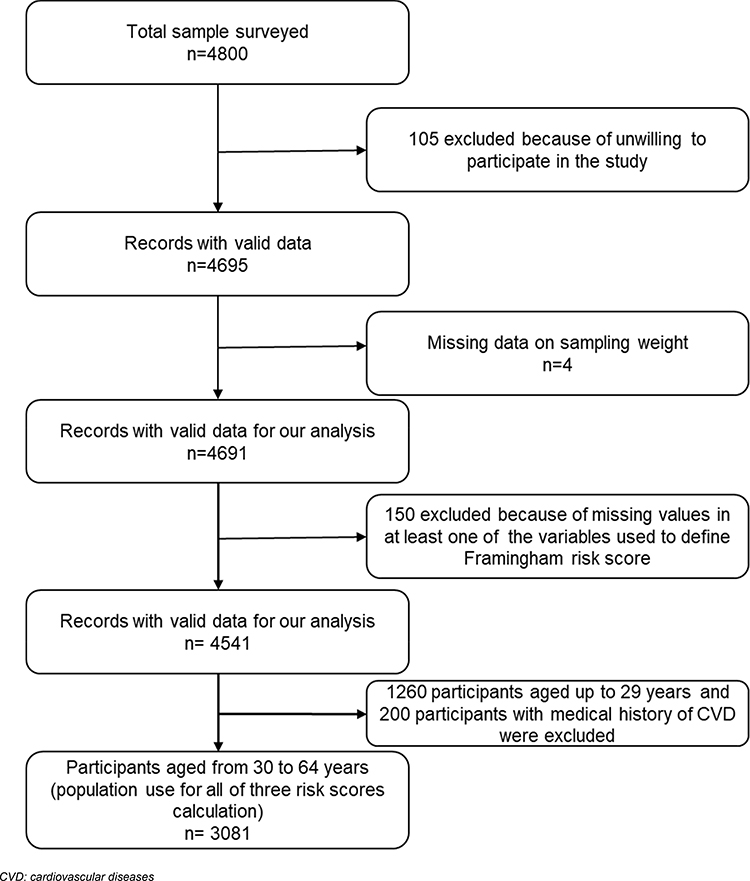 |
Figure 1 Flow chart of study participants. |
Outcome Variables
To assess the ten-year CVD risk, we used three risk scores: WHO risk, the FRS,15 and the Globorisk chart.44 These three risk scores provided complementary information about CVD risk among the adult population in Burkina Faso, as shown in Table 1. The WHO risk and Globorisk were specially developed for low-income countries. All the above scores perform well in discriminating persons who will develop CVD from those who will not.29
 |
Table 1 Population, Input Variables, and Outcome of Each Ten-Year CVD Risk Score |
The WHO risk is the most recent risk chart available to assess the absolute ten-year CVD risk for people in low income countries. Six variables were used to estimate WHO risk.26 This risk chart was developed to assess ten-year cardiovascular risk for people aged from 40 to 80 years and calibrated for 21 world regions using data from 79 countries, including Burkina Faso. In this chart, risk is stratified into five groups: <5%, 5% to <10%, 10% to <20%, 20% to <30%, and ≥30%. For our analysis, we used the risk chart adapted to western SSA26 (Supplemental Figure 1) to assign to each study participant their absolute WHO risk considering the level of each risk factor presented in the Supplementary Materials: Supplemental Table 2.
The 2008 FRS has been adapted for used in diverse populations around the world (Table 1).15 it was developed to assess ten-year cardiovascular risk for people aged from 30 to 74 years. In our study, blood cholesterol was measured for each participant, offering an opportunity to use the laboratory FRS. The detailed process for computing individual absolute risk using FRS15 is described in the supplementary materials (Supplemental Table 1.). The FRS classifies participants into three groups: low, moderate, or high risk, corresponding to <10%, 10–20%, and ≥20%, respectively.
The 2017 Globorisk44 was developed to assess ten-year cardiovascular risk for people aged from 40 to 74 years for 182 countries, including Burkina Faso. The risk is stratified into seven groups (<5%, 5% to 9%, 10% to 19%, 20% to 29%, 30% to 39%, 40% to 49%, and ≥50%). We used the risk chart for Burkina Faso (http://www.globorisk.org/risk-charts) (Supplemental Figure 2) to assign an absolute individual CVD risk for each participant considering the input variables level (Supplemental Table 2). More details on the absolute risk calculation and a summary of the variables used to build the ten-year CVD risks are presented in the supplementary materials. To make consistency between three equations, for Globorisk and WHO risk, we assigned the risk levels of participants aged 40 to 44 years to participants aged 30 to 39 years, considering the levels of the input variables as done in previous studies.27,29,46 We then carried out sensitivity analysis for participants aged 40–64 years.
For each score, the absolute individual ten-year CVD risk was categorized as either low risk (<10%) or elevated risk (≥10%). The threshold at which an intervention should be introduced to prevent CVD as proposed by the WHO differs between countries.4,47,48 Using numerous risk scores, including FRS for CVD, and comparing different thresholds (5%, 10%, and 20%), a previous study showed that at the 10% threshold, the FRS has higher sensitivity and specificity.47 The most recent WHO guidelines include lifestyle change strategies and a 3 to 6 month follow-up for the population with an absolute CVD risk ≥10%.49
Explanatory Variables
The main explanatory variables were residence (urban or rural), marital status (unmarried or married), education level (none, primary, secondary, or higher), occupation status (paid worker or jobless), and health region. The analyses were stratified by sex because of the well-known sex difference in CVD risk.29
Statistical Analysis
In the first part of our study, we calculated and presented the absolute ten-year CVD risk in the initial categorization and the variability of the mean absolute CVD risk. We then used the dichotomized CVD risk (low and elevated risk) to estimate the prevalence of elevated risk by sociodemographic characteristics and health region (map). To correct the prevalence for age–sex variation between sample and national population, we standardized the prevalence of elevated risk using the age and sex structure of the adult population in Burkina Faso in 2013.50 To examine the association between the sociodemographic characteristics and elevated risk, we performed a modified Poisson regression model using a generalized estimating equation. With this model, we have considered clustering of the observations and we derived prevalence ratios (PRs) and 95% confidence interval. All maps were plotted using QGIS 3.451 and all other analyses were performed using Stata V15.1.52
Results
Participant Characteristics
A total of 3081 participants (1533 women and 1548 men) aged 30 to 64 years including 1735 participants aged 40 to 64 years (818 women and 917 men) from 13 health regions were included in our analysis (Figure 1). Table 2 shows the sociodemographic characteristics of the study participants by sex. The majority of women (75.1%) and men (80.0%) were living in rural areas. Regarding education level, 75.9% of men and 83.8% of women aged from 30 to 64 years had not attended a formal school. Table 3 shows the characteristics of participants with and without elevated risk as defined by WHO risk. These characteristics for FRS and Globorisk are presented in supplementary materials (see Supplemental Tables 4 and 8).
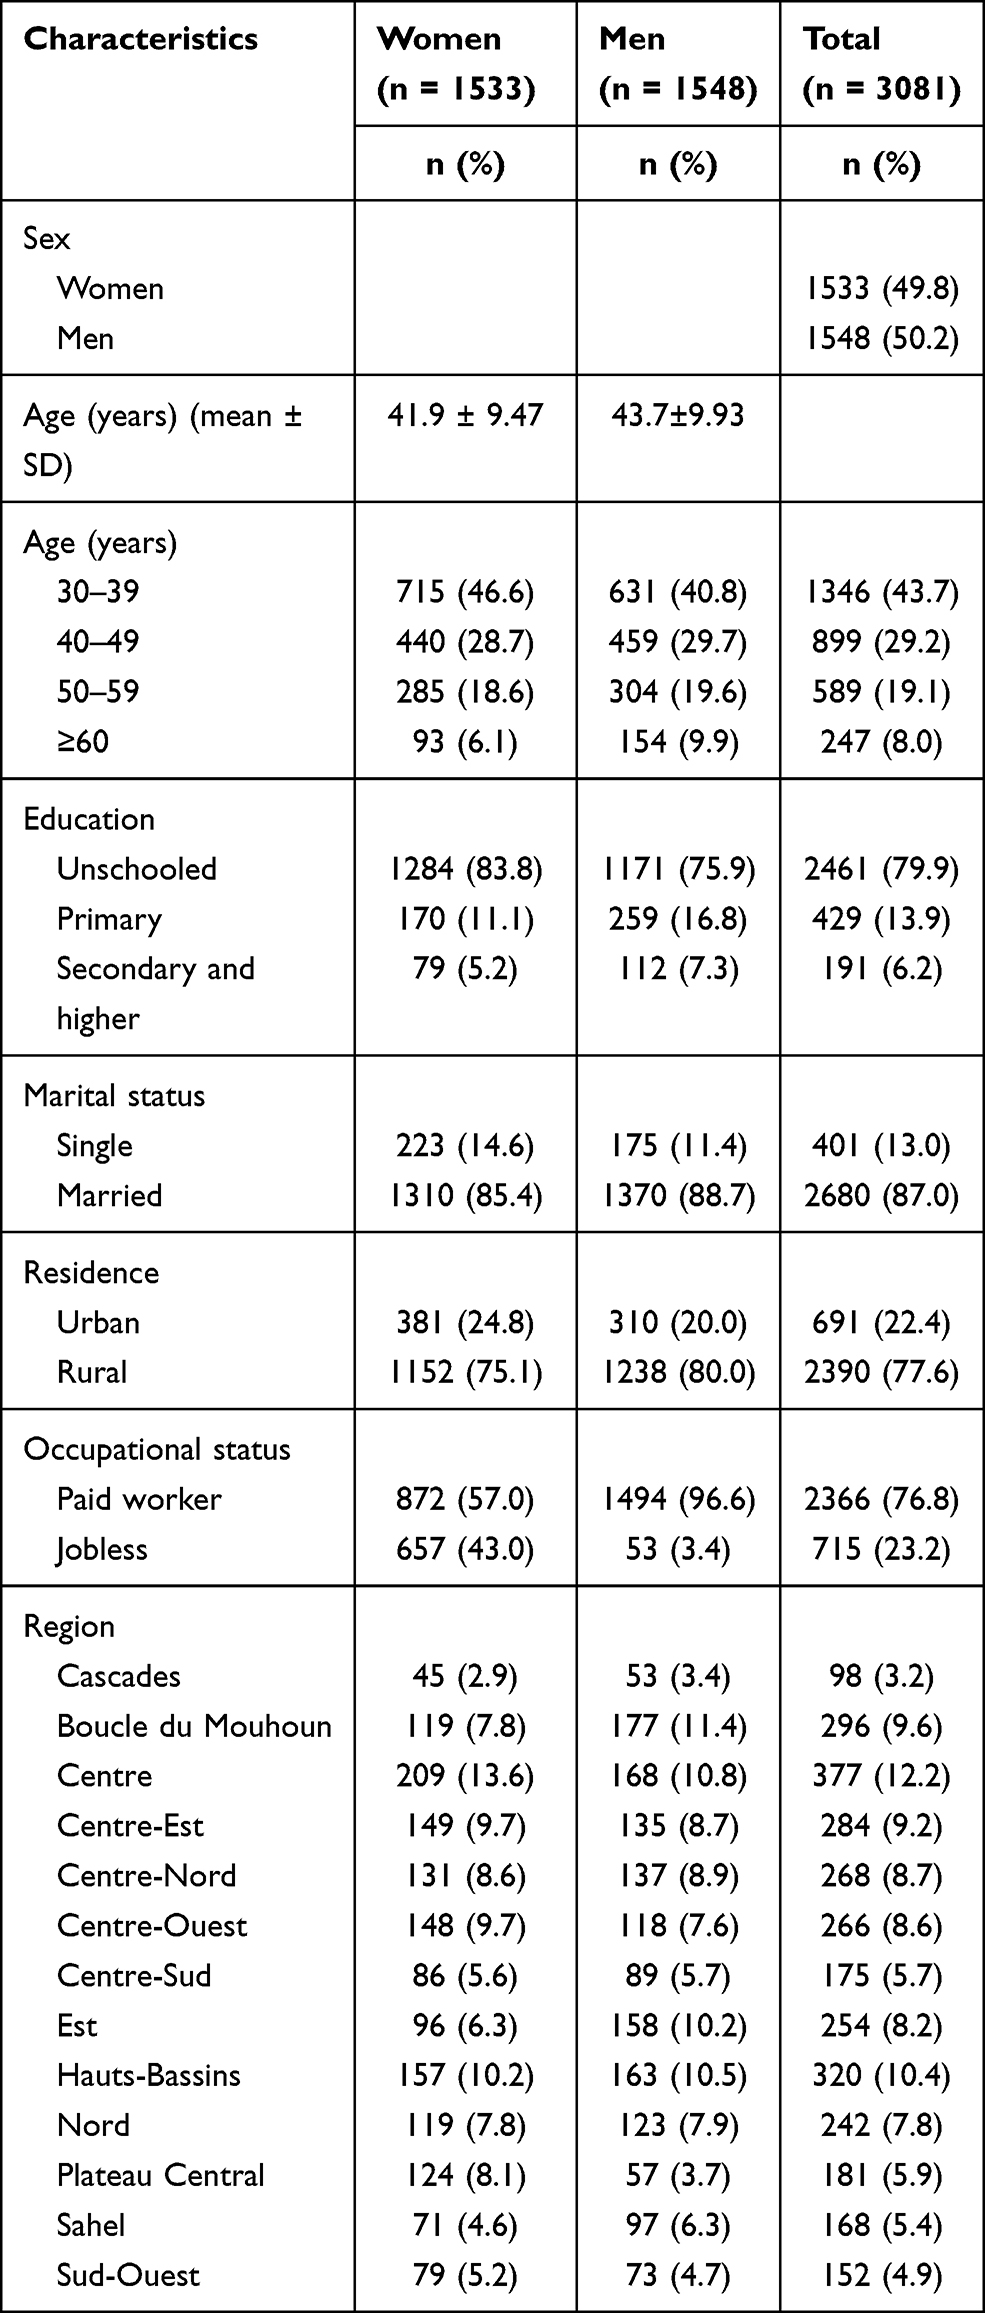 |
Table 2 Sociodemographic Characteristics of the Study Participants by Sex |
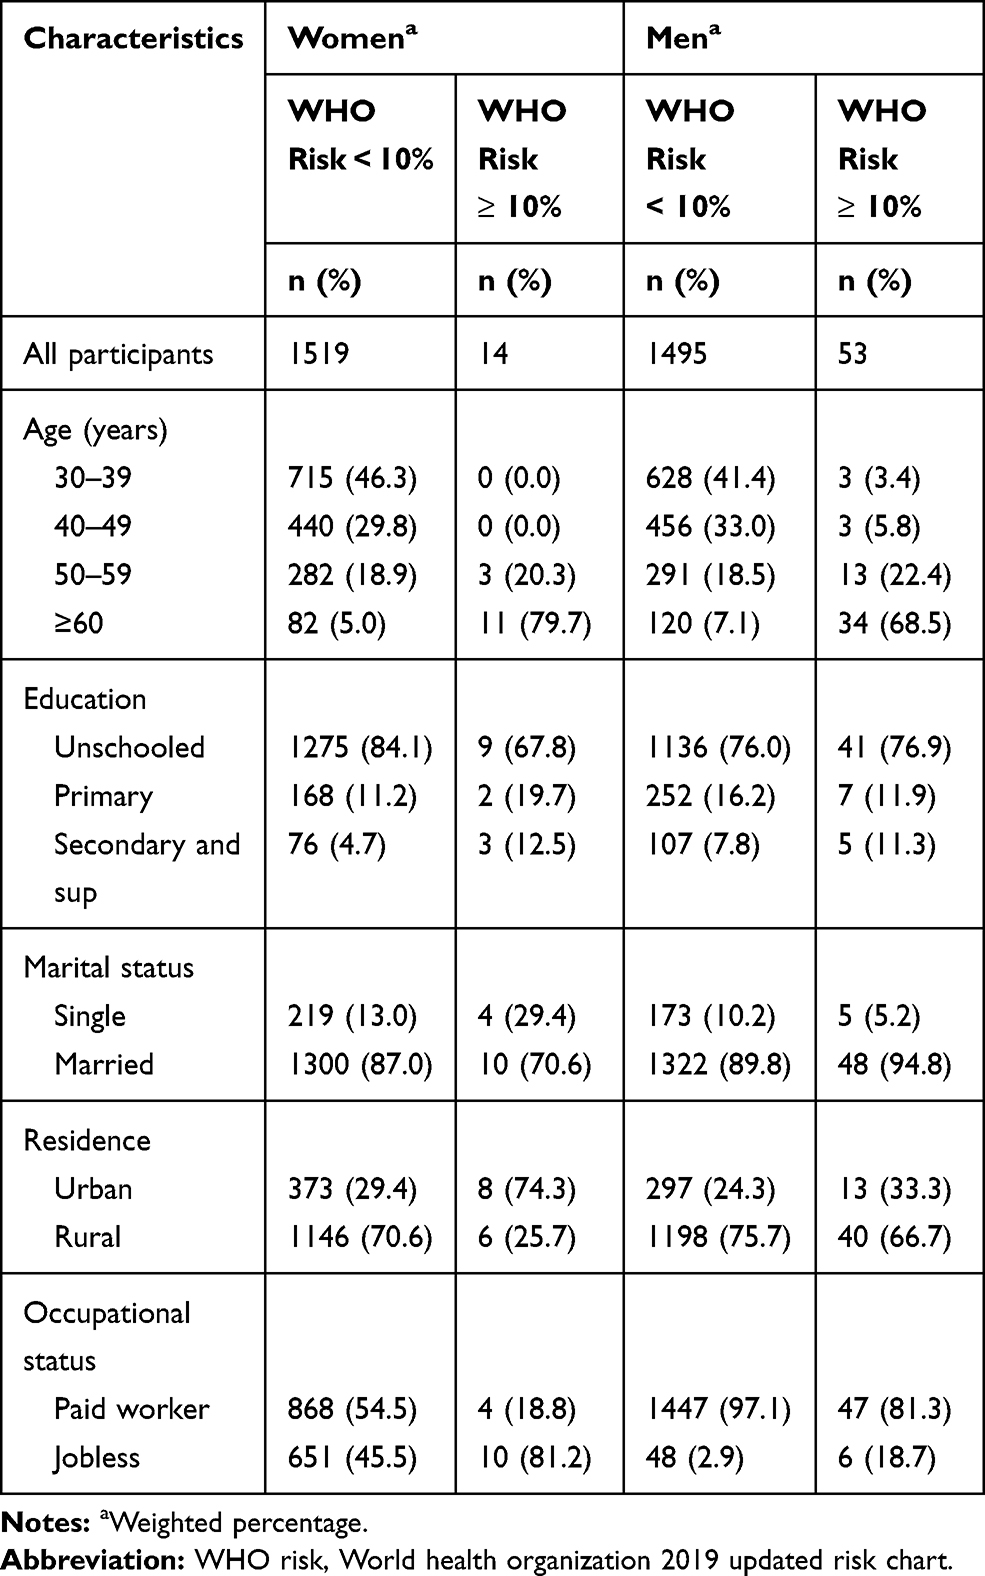 |
Table 3 Elevated Risk of Ten-Year Cardiovascular Event (WHO Risk ≥10%) by Sociodemographic Characteristics by Sex |
Cardiovascular Risk at National and Regional Level
The overall age and sex-standardized mean of ten-year cardiovascular risk was 2.5% (95% CI: 2.4–2.6) for WHO risk. Regarding the mean of WHO risk, we found geographic disparities which showed that the age and sex-standardized means of ten-year cardiovascular risk assessed using WHO risk ranged from 2.3% (95% CI: 2.2–2.4) in the Centre Est region to 3.0% (95% CI: 2.8–3.2) in the Centre region. The overall age and sex-standardized mean of ten-year cardiovascular risk was 4.6% (95% CI: 4.4–4.8) for FRS, ranged from 3.9% (95% CI: 3.4–4.3) in Sud Ouest to 6.0% (95% CI: 5.5–6.6) in the Centre region. It was 4.0% (95% CI: 3.8–4.1) for Globorisk and ranged from 3.4% (95% CI: 3.3–3.7) in Centre Est to 5.0% (95% CI: 4.6–5.5) in Centre. As shown in Figure 2, the age and sex-standardized mean of absolute risk (using WHO risk) was higher in the Centre region (Ouagadougou). The same results were reported when use FRS (Supplemental Figure 3) and Globorisk (Supplemental Figure 4)
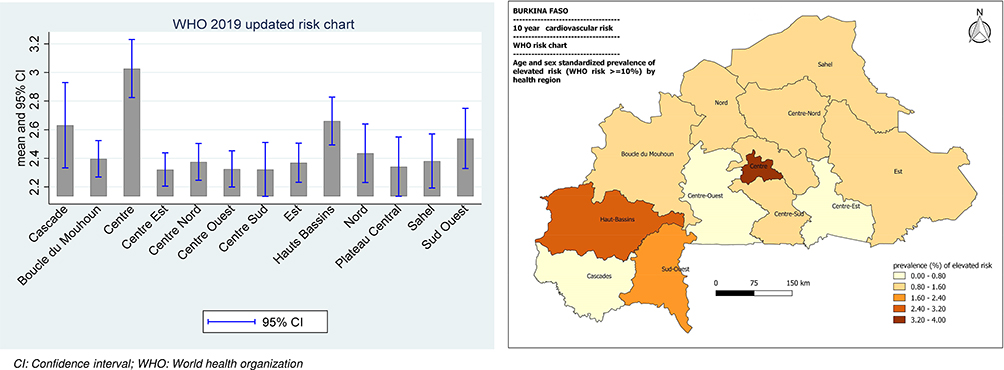 |
Figure 2 Age and sex standardized mean of absolute cardiovascular risk (left) and prevalence of elevated risk (WHO risk≥10%) (right) by region. The mean of absolute cardiovascular risk was significantly higher in Centre region (p<0.001). The prevalence of elevated risk was also higher in Centre region followed by Haut Bassins (p<0.001). |
As shown in Figure 3, using WHO risk, 97.8% (95% CI: 96.7–98.5) of the study population had a risk of <10%, 2.1% (95% CI: 1.4–3.2) had arisk of 10% to <20%, and 0.1% (95% CI: 0.0–0.3) had a a risk of ≥20%. Using FRS, 87.7% (95% CI: 86.1–89.1) of the study population had an absolute risk of <10%, 9.4% (95% CI: 8.2–10.6) had a risk of 10% to <20%, and 2.9% (95% CI: 2.3–3.8) had a risk of ≥20%. The proportions when using Globorisk were 92.9% (95% CI: 91.4–94.1) for <10%, 6.0% (95% CI: 4.9–7.2) for 10% to <20%, and 1.2% (95% CI: 0.8–1.8) for ≥20%.
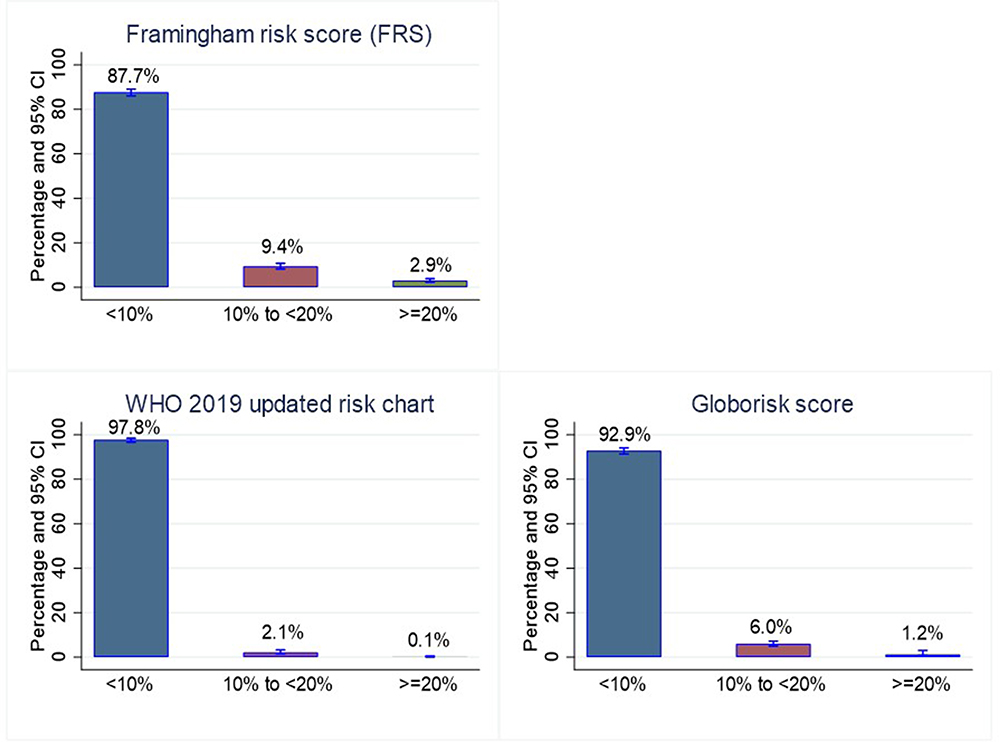 |
Figure 3 Weighted prevalence of low, moderate and high 10-years risk of cardiovascular disease assessed using WHO 2019 updated risk, Framingham risk score and Globorisk chart. (These values were not standardized). |
The overall age and sex-standardized prevalence of elevated risk was 1.7% (95% CI: 1.3–2.1) for WHO risk (In a sensitivity analysis, this prevalence was (2.9% (95% CI: 2.2–3.6) when excluded adult under 40 years of age), varied between 0.7% (95% CI: 0.0–1.9) in Centre Est to 4.5% (95% CI: 2.2–5.7) in Centre. Using FRS, this prevalence was 10.4% (95% CI: 9.6–11.2), ranged from 6.4% (95% CI: 4.0–8.7) in Centre Sud to 16.5% (95% CI: 13.6–19.4) in Centre. Using Globorisk, we found that the age and sex-standardized prevalence of elevated CVD risk was 5.9% (95% CI: 5.1–6.6) (In a sensitivity analysis, this prevalence was 10.6% (95% CI: 9.3–11.9) when excluded adult under 40 years of age), and ranged from 3.5% (95% CI: 1.1–5.2) in Est to 12.5% (95% CI: 8.8–14.6) in Centre. All three equations showed a higher prevalence of elevated risk in the Centre region, which is the capital of the country (main urban area) (see Figure 2 and Supplemental Figures 3 and 4).
Sociodemographic Disparities of Ten-Year Cardiovascular Risk
The means of absolute CVD risk by sociodemographic characteristics are presented in the supplementary materials (Supplemental Tables 3, 7 and 11). Table 4 shows the age and sex-standardized prevalence of elevated risk by sociodemographic characteristics using WHO risk: 2.6% (95% CI: 1.9–3.3) for men and 0.9% (95% CI: 0.5–1.4) for women (p-value of difference <0.001). The overall age and sex-standardized prevalence was 3.1% (95% CI: 1.9–4.3) in urban areas and 1.4% (95% CI: 1.0–1.8) in rural areas (p = 0.003). Among men, the age-standardized prevalence of elevated risk was 3.5% (95% CI: 1.6–5.4) in urban areas and 2.4% (95% CI: 1.7–3.1) in rural areas (p = 0.27). Among women, it was 2.7% [95% CI: 1.1–4.4) and 0.5% (95% CI: 0.1–0.9) in urban and rural areas, respectively (p<0.001). The age and sex-standardized prevalence of elevated risk increased with education level. The overall age and sex standardized prevalence of elevated risk among the study population who had achieved secondary school education was 7.8% (95% CI: 4.9–10.6) versus 2.8% (95% CI: 0.7–4.8) for those who achieved primary school and 1.4% (95% CI: 1.0–1.8) for those who did not attend formal education (p < 0.001). Among men, the age-standardized prevalence of elevated risk was 7.6% (95% CI: 2.6–12.5) for those who had completed secondary school, 3.0% (95% CI: 0.9–5.9) for those who completed primary, and 2.4% (95% CI: 1.7–3.1) for those who did not attend formal schooling (p < 0.001). Among women, the age-standardized prevalence was 8.0% (95% CI: 4.7–11.3) for those with a secondary school education, 2.6% (95% CI: 0.0–6.0) for those with primary education, and 0.7% (95% CI: 0.2–1.1) for those who had not attended formal schooling (p < 0.001). We also found age, sex, residence, and education level disparities of age-standardized prevalence of elevated risk when using FRS or Globorisk (see Supplemental Tables 5 and 9).
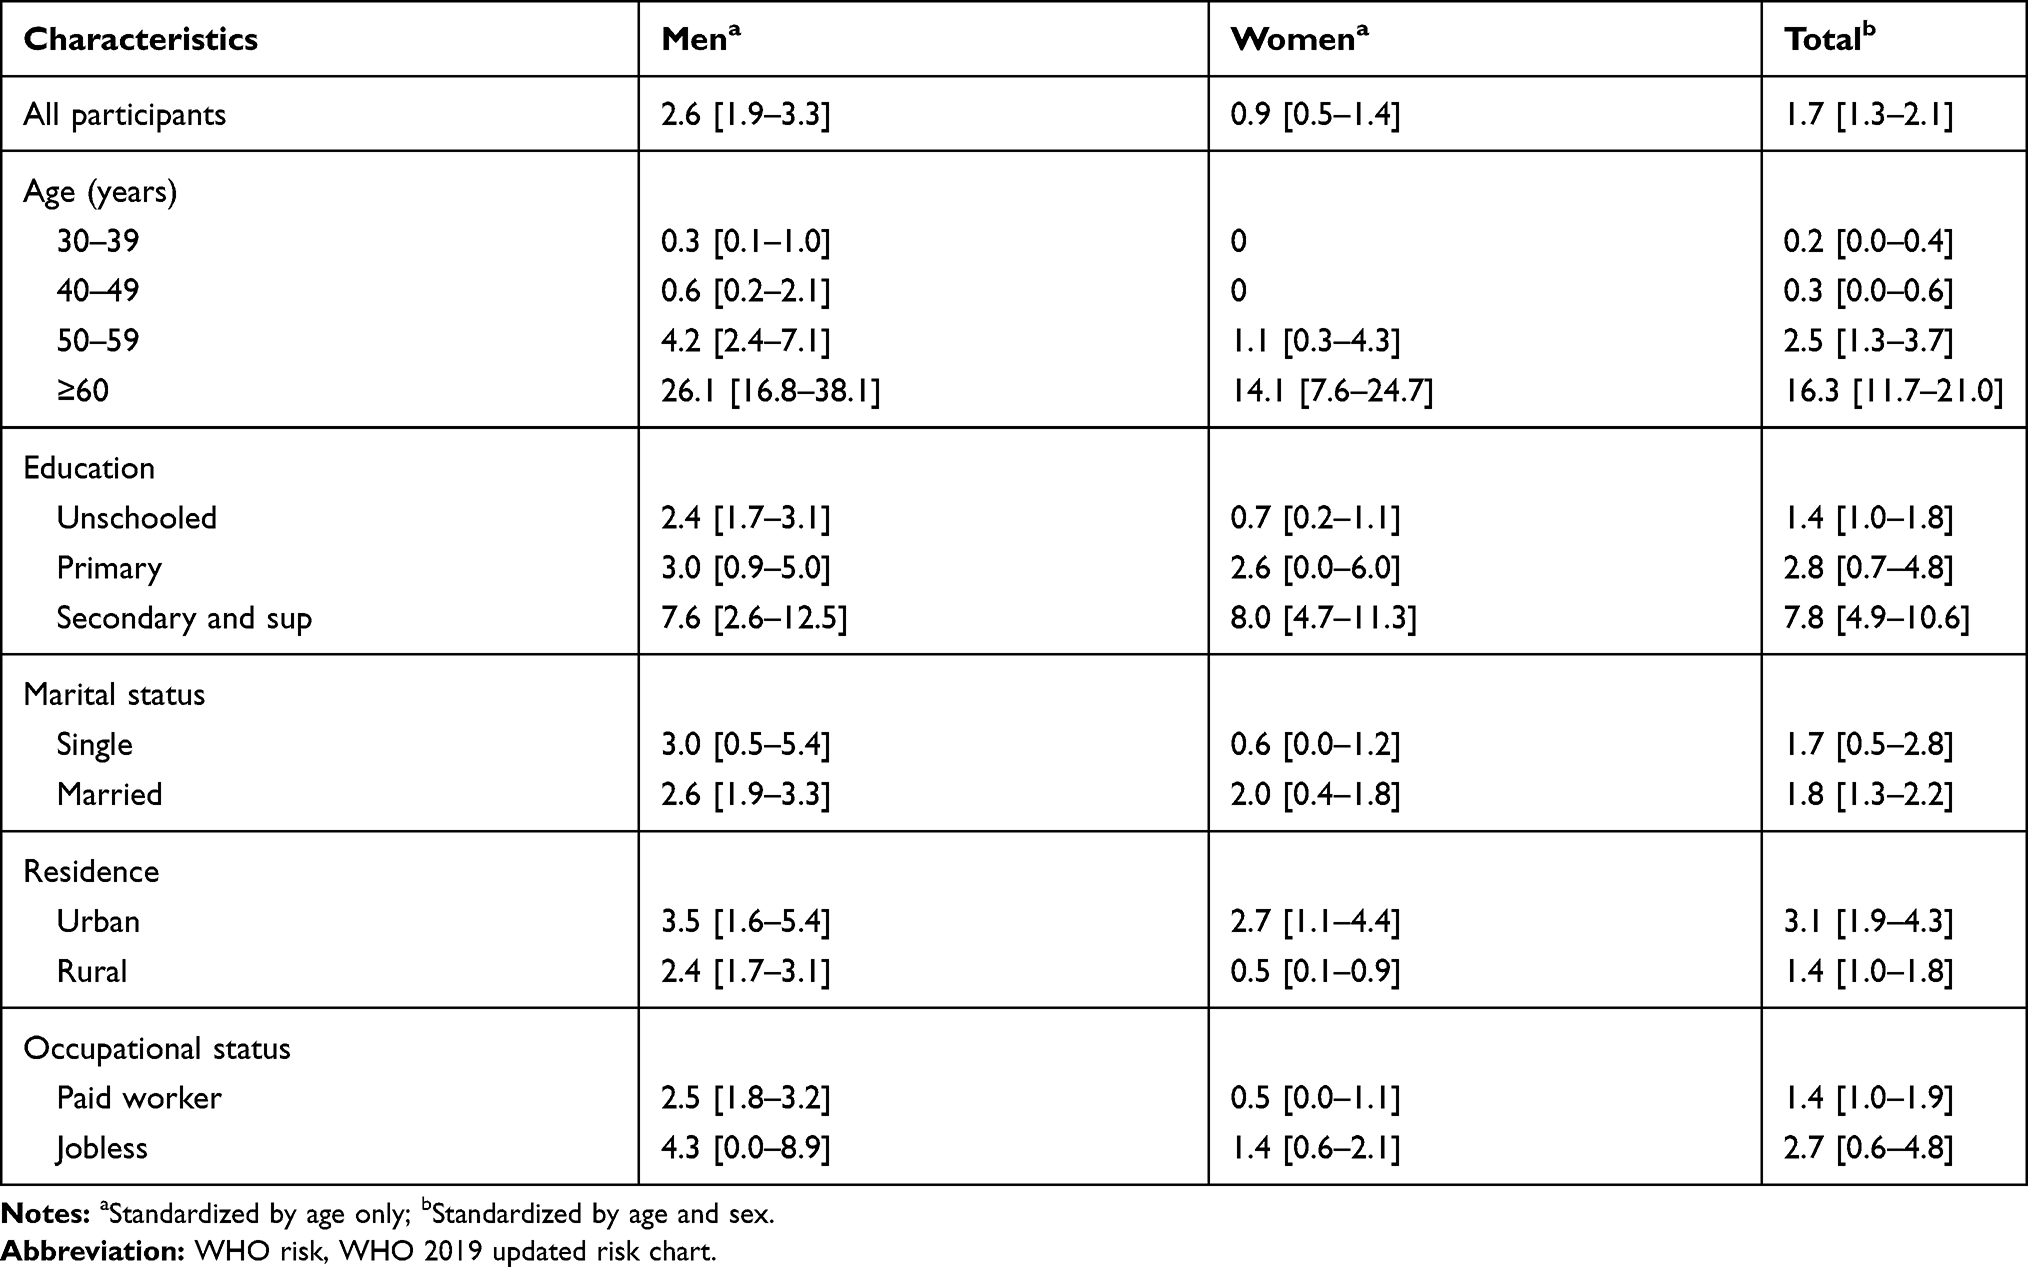 |
Table 4 Age- and Sex-Standardized Prevalence Elevated Ten-Year Risk of Cardiovascular Event (WHO Risk ≥10%) by Sociodemographic Characteristics |
Table 5 shows the association between elevated CVD risk assessed using the WHO risk and sociodemographic characteristics after multivariate analysis. Men had a higher ten-year CVD risk compared to women (adjusted prevalence ratio (aPR):3.04 [95% CI: 1.52–6.05], p < 0.001). The result was the same when we used FRS and Globorisk (see Supplemental Tables 6 and 10). The prevalence of elevated risk increased with age. Adjusting for all variables in Table 2, high levels of education was significantly associated with an elevated risk. As shown in Table 5, the prevalence of elevated risk was 3.17 times (aPR: 3.17, 95% CI: 1.30–7.72) higher among individuals who finished secondary school than those who were unschooled. The residence location was not significantly associated with elevated risk when adjusted for all explanatory variables (sex, age, marital status, education and occupation status) in FRS and Globorisk (see Supplemental Tables 6 and 10). However, the rural residents showed lower prevalence of elevated risk compared to urban residents using all three risk scores.
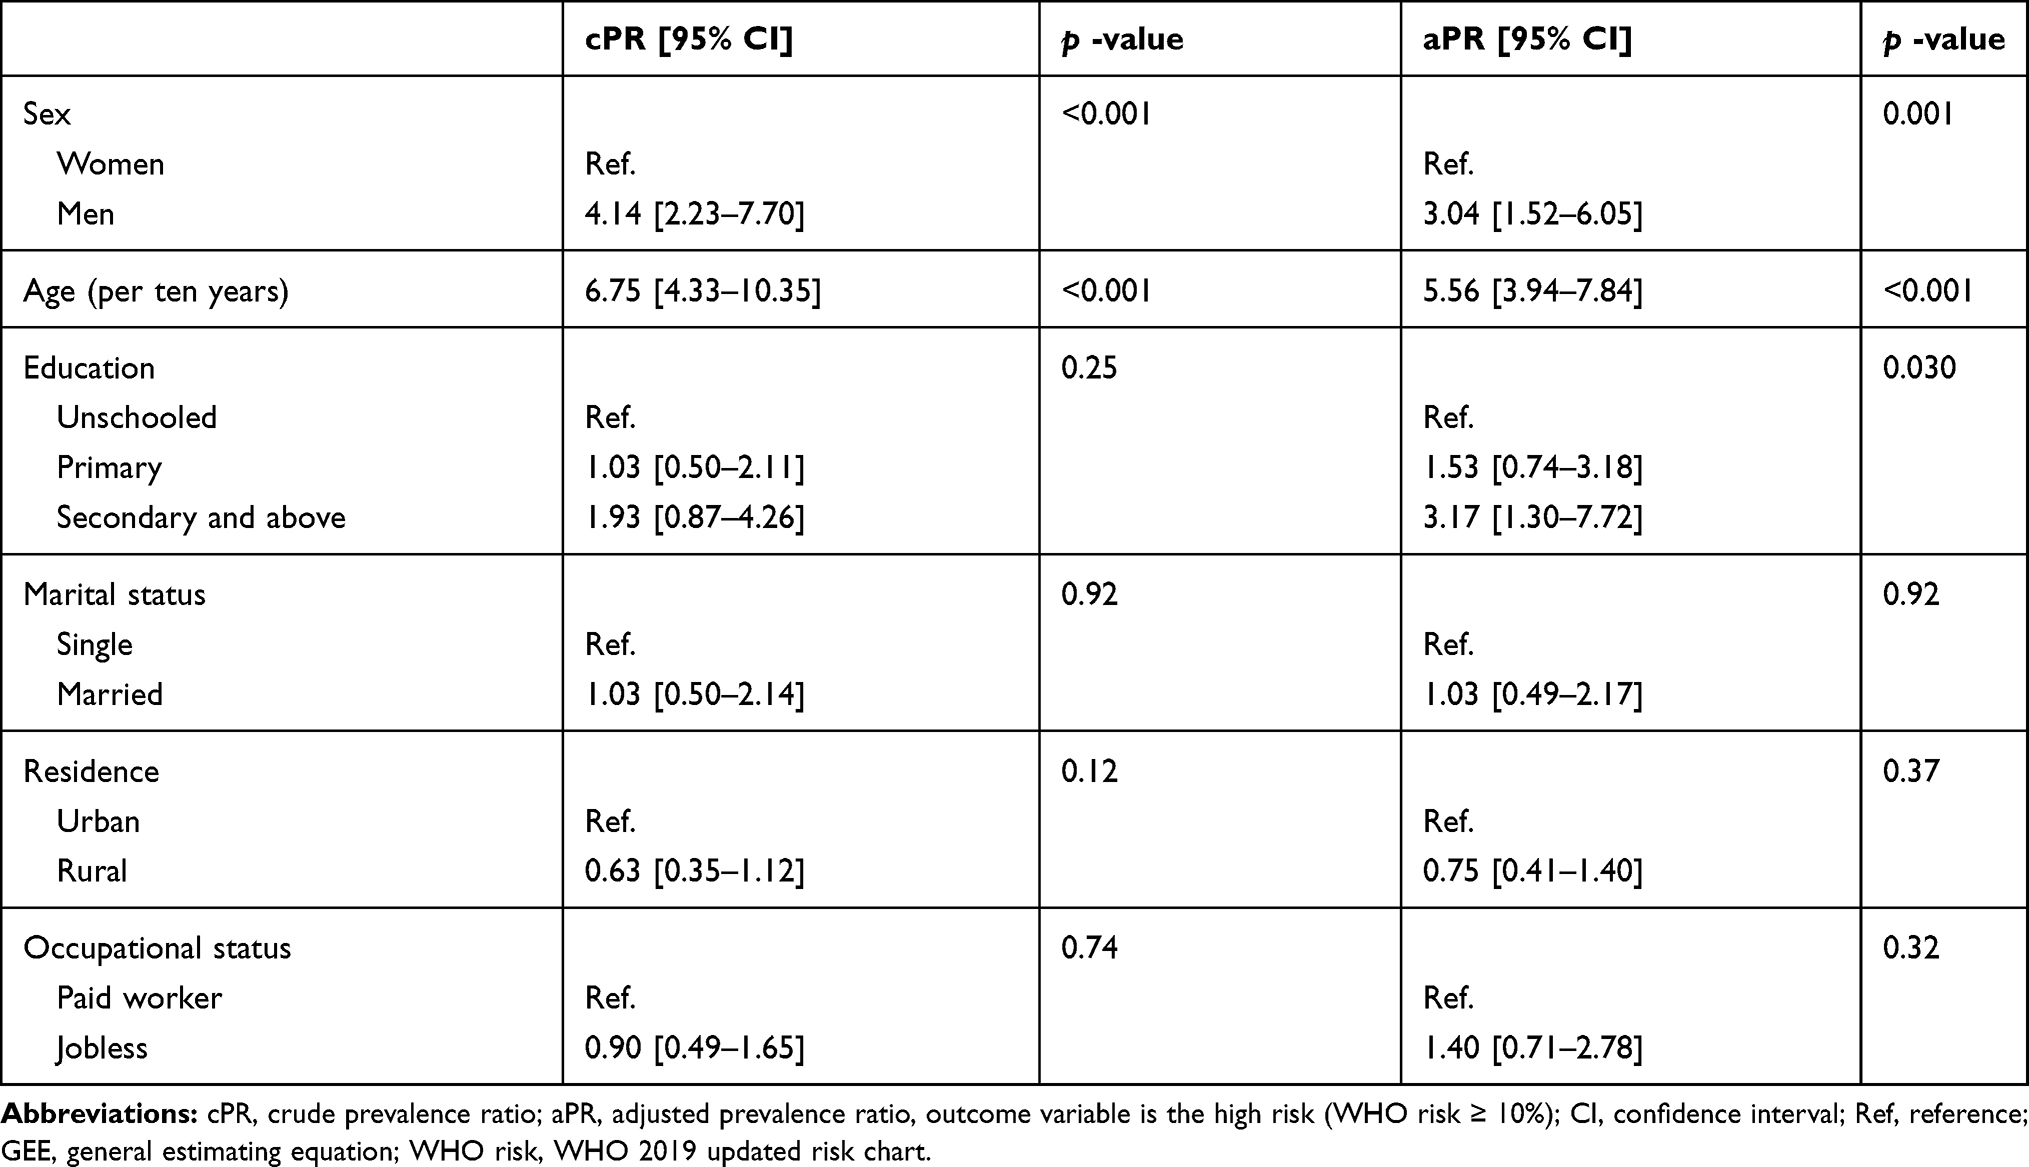 |
Table 5 Factors Associated with Elevated WHO Risk (WHO Risk ≥10%) Using Multivariate Modified Poisson Regression with GEE Model |
Discussion
To the best of our knowledge, this analysis represents the first nationwide estimation of CVD risk in Burkina Faso. It is also one of the first population-based sociodemographic and geographic assessment of disparities in the ten-year CVD risk in western SSA using the new WHO risk chart. The findings show strong individual-level sociodemographic and geographic disparities. These disparities were similar across the risk scores used in this study. In 2018 in India, Geldsetze et al29 also reported similarities in the distribution of CVD risk, even though they used different scores, which suggests that despite the limitation of each CVD risk score, there are some sociodemographic characteristics and location that indicate a higher risk of CVD within ten years. As recommended by the WHO, these groups require substantial individual lifestyle change strategies to reduce the future incidence of CVD.49 As highlighted by Geldsetze et al,29 the clinical endpoint events might explain the higher prevalence of elevated risk reported using FRS compared to WHO risk and Globorisk in our study. Thus, FRS included a large number of CVD as endpoint events to derive the equation compared to WHO risk and Globorisk (see Table 1).
We report an age and sex-standardized prevalence of elevated risk of 1.7% using WHO risk, even when choosing a low threshold (WHO risk ≥10%). This prevalence seems to be lower than that reported in Bangladesh. A study conducted in Bangladesh in 2020 found that 14.9% of the study population had a WHO risk of ≥10%.9 In a recent study, Peiris et al28 have shown that the median of CVD risk seem to be lower in SSA compared with other world regions. Nonetheless, previous study using the older version of the WHO risk reported a prevalence of 23.1% (WHO/ISH ≥10%) among workers at the local level in Nigeria.53 When considering other risk scores such as FRS, our reported prevalence is lower than those reported in other studies in Africa. Using FRS, we found a prevalence of 10.4% for elevated risk. In a study conducted in a similar context (Ghana), Boateng et al17 found that 33.8% (if using FRS ≥ 10%) of the study population were predicted to be at high ten-year CVD risk (calculated using FRS among people aged 40 to 70 years old). The age group used in the work of Boateng et al17 and the present study might explain this difference. However, CVD risk differs widely with the equation used, partly due to the components of clinical endpoints predicted and the study population.47 Our lower estimated CVD risk contrasts with the high CVD incidence and CVD mortality found in the country compared to most countries worldwide.54,55 A previous study carried out in Burkina Faso reported a heavy burden of noncommunicable disease, including CVD, with 17.9% of the adult population presenting with angina pectoris.31 This contrast is due to the lower capacity of health system to detect and treat people with elevated risk before the CVD occur. There is an urgent need for policymakers to strengthen the health system of Burkina Faso to prevent and manage CVD, particularly among people at elevated risk of CVD.56 Additionally, our findings suggest that a substantial proportion of the population needs intervention to prevent CVD. Therefore, the health system must be strengthened to screen and treat people at high risk of CVD to prevent CVD.
Our results confirm the higher ten-year CVD risk among men compared to women, as reported by Saidi et al16 in Tunisia (2015), Gaziano et al18 in South Africa (2013), Geldsetze et al29 in India (2018) and recently Peiris et al28 (2021). All three equations identified sex disparities in the ten-year CVD risk and a higher risk in men compared to women. Men adopt many combined risk behaviors that increase the risk of CVD.3 The education level disparities reported in our analysis confirm those reported in many previous studies.16,18,29,57 As found by Geldsetze et al,29 the prevalence of an elevated risk of cardiovascular events tends to increase with education level, which was in line with our findings. This might be due to factors correlated with high education level such as high socioeconomic index, urbanity, low physical activity, and other lifestyle factors that increase the level of CVD risk. Peiris et al28 had found out that wealthier quintiles are associated with higher median CVD risk. In the same study Peiris et al28 had also noted that CVD risk is lower among people with primary or higher level of education. The independent association between education and CVD risk is still discussed in the literature. Most studies shown that the level of education is inversely associated with CVD incidence and mortality in low- and middle-income countries.58,59 As noted by Rosengren et al,59 this apparent paradox might be explained by inequality in access to cardiovascular health care, which is likely limited for people with low levels of education compared to those with high levels of education in low-income countries. Interventions to reduce the level of cardiovascular risk factors might be combined with strategies to improve cardiovascular healthcare accessibility to promote the secondary prevention of CVDs.
We found geographic disparities in the distribution of CVD risk in Burkina Faso. All three scores showed a higher prevalence of elevated risk of CVD in the Centre region (Ouagadougou). This tended to confirm the spatial clustering of ten-year cardiovascular risk described in the literature.16,29 Due to urbanization and changes in lifestyle, urban area is recognized as the hotspots of cardiovascular diseases in many parts of the world.16,57,60,61 The disparities between health regions in our analysis are mostly due to differences in urbanization, changes in lifestyle, and unbalanced socioeconomic development between the regions in Burkina Faso, since we standardized the proportion of elevated risk by age and sex. To address CVD risk in the country, population-based lifestyle modification strategies might be introduced among people with elevated risk because drug-based interventions are unaffordable for the majority of the population.4
Strengths and Limitations of the Study
The main limitation of the present study was the inability to exclude all participants with current or previous confirmed CVD, since clinical examinations were not performed. However, we excluded participants who reported heart attack, angina, or stroke. We used equations that were developed for specific age groups (30 to 74 years for FRS, 40 to 80 years for WHO risk and 40 to 74 years for Globorisk) to assess the CVD risk for those aged 30 to 64 years. This difference might have caused underestimation of the prevalence of elevated risk compared to other studies in Africa (eg, Tunisia, South Africa, and Ghana). Furthermore, for WHO risk and Globorisk, we used a risk chart for people with 40–49 years to assign absolute risk for people with 30–39 years as previously done in others studies.27,29,46 However, this might overestimate the absolute risk among people with 30–39 years since the risk increase with age. The correlation between the prediction and outcome remains uncertain and varies when the algorithms are applied to populations that are not similar to those used to develop the system.62. Moreover, the sample size was low and might cause low precision of associations measured. Another limitation in this study is its cross-sectional nature. Then, we cannot exclude a risk of survival bias as participants with acute complications of CVD risk factors may die prematurely. There is residual confounding, since economic and cultural aspect of household were not collected. Furthermore, despite the use of the standard WHO measurement instruments, there was some potential measurement bias. Finally, we assessed the geographic distribution at the health region level, which is the level at which the STEPwise survey was designed to be representative. Therefore, local (subregional) hotspots might be masked and not highlighted in our study. Beyond these limitations, we provide for the first time useful findings to understand the future distribution of CVDs related to a population-based data, which might be used to drive cost-effective population-wide preventive campaigns in Burkina Faso.
Conclusion
In this study, we reported for the first time the prevalence of elevated risk of ten-year CVD risk among the adult population in Burkina Faso. The analysis demonstrated geographic, sex, age, and education disparities in the distribution of the ten-years CVD risk in Burkina Faso. Our findings suggest a need to develop prevention and control strategies (eg tobacco control policy, promoting physical activity, air quality regulation particularly in urban area) to address CVD risk among vulnerable sociodemographic groups and geographic locations who represent a higher proportion of the population with elevated ten-year CVD risk.
Abbreviations
CVD, cardiovascular disease; FRS, Framingham risk score; NCD, noncommunicable disease; STEP, World Health Organization STEPwise approach; WHO/ISH; World Health Organization/International Society of Hypertension; WHO risk, WHO 2019 updated risk chart.
Data Sharing Statement
The dataset for this research was obtained by a request to the Ministry of Health (Bicaba Brice: [email protected] or Zoma Torez: [email protected]). All WHO STEPwise survey materials and most microdata are freely available on the WHO website (https://extranet.who.int/ncdsmicrodata/index.php/catalog).
Ethics Approval and Informed Consent
We performed a secondary analysis of STEPwise survey database of Burkina Faso. The dataset used for this research was obtained by a request to the Ministry of Health and the protocol of our analysis was approved by the national ethical committee for health research of Burkina Faso ((the number of ethical approval was Deliberation No. 2020-10-231 of October,07, 2020). Furthermore, the primary study (STEP survey) had obtained ethical approval from the national ethical committee for health research of Burkina Faso (Comité d’Ethique pour la Recherche en Santé (CERS)). Indeed, Before collecting data in the field, the survey protocol was approved by the Ministry of Health’s Ethics Committee for Health Research (the number of ethical approval was Deliberation No. 2012-12-092 of December,05, 2012). Informed consent was required before the participation of any individual selected for the investigation. The confidentiality of the information collected has been mentioned in the informed consent form as well as benefit and risk. A verbal informed consent was obtained from each participant before their inclusion in the study (STEP survey). A verbal informed consent had been proposed because the majority of adult population in Burkina Faso was illiterate. The national ethics committee had approved this form of verbal informed consent. All participant's data were anonymous. The detail of ethical considerations was published in the STEP report which is available online. (https://www.who.int/ncds/surveillance/steps/BurkinaFaso_2013_STEPS_Report.pdf).
Acknowledgments
We would like to thank the ministry of health of Burkina Faso for providing data for the current study.
Author Contributions
All authors made a significant contribution to the work reported, whether that is in the conception, study design, analysis and interpretation and took part in drafting, revising the article; gave final approval of the version to be published; have agreed on the journal to which the article has been submitted; and agree to be accountable for all aspects of the work.
Funding
This work was funded by the Academie de Recherche et d’Enseignement Supérieur (ARES) of Belgium, in the context of a research program for development focused on cardiovascular diseases in Burkina Faso. S.S. received a postdoctoral fellowship from the Fonds de recherche du Québec Santé (FRQS).
Disclosure
The authors declare that they have no conflicts of interest for this work.
References
1. Roth GA, Johnson C, Abajobir A, et al. Global, regional, and national burden of cardiovascular diseases for 10 causes, 1990 to 2015. J Am Coll Cardiol. 2017;70(1):1–25. doi:10.1016/j.jacc.2017.04.052
2. Bowry ADK, Lewey J, Dugani SB, Choudhry NK. The burden of cardiovascular disease in low- and middle-income countries: epidemiology and management. Can J Cardiol. 2015;31(9):1151–1159. doi:10.1016/j.cjca.2015.06.028
3. Yusuf S, Joseph P, Rangarajan S, et al. Modifiable risk factors, cardiovascular disease, and mortality in 155 722 individuals from 21 high-income, middle-income, and low-income countries (PURE): a prospective cohort study. Lancet. 2020;395(10226):795–808. doi:10.1016/S0140-6736(19)32008-2
4. World Health Organization. Prevention of Cardiovascular Disease: Guidelines for Assessment and Management of Cardiovascular Risk. World Health Organization; 2007.
5. Subramanian S, Hilscher R, Gakunga R, Munoz B, Ogola E, Chen S. Cost-effectiveness of risk stratified medication management for reducing premature cardiovascular mortality in Kenya. PLoS One. 2019;14(6):e0218256. doi:10.1371/journal.pone.0218256
6. Gaziano TA. Cardiovascular disease in the developing world and its cost-effective management. Circulation. 2005;112(23):3547–3553. doi:10.1161/CIRCULATIONAHA.105.591792
7. Mendis S. Cardiovascular risk assessment and management in developing countries. Vasc Health Risk Manag. 2005;1(1):15–18. doi:10.2147/vhrm.1.1.15.58933
8. Basu S, Wagner RG, Sewpaul R, Reddy P, Davies J. Implications of scaling up cardiovascular disease treatment in South Africa: a microsimulation and cost-effectiveness analysis. Lancet Glob Health. 2019;7(2):e270–e280. doi:10.1016/S2214-109X(18)30450-9
9. Islam JY, Zaman MM, Moniruzzaman M, Ara Shakoor S, Hossain AHME. Estimation of total cardiovascular risk using the 2019 WHO CVD prediction charts and comparison of population-level costs based on alternative drug therapy guidelines: a population-based study of adults in Bangladesh. BMJ Open. 2020;10(7):e035842. doi:10.1136/bmjopen-2019-035842
10. Lloyd-Jones DM, Braun LT, Ndumele CE, et al. Use of risk assessment tools to guide decision-making in the primary prevention of atherosclerotic cardiovascular disease: a special report from the American Heart Association and American College of Cardiology. J Am Coll Cardiol. 2019;73(24):3153–3167. doi:10.1016/j.jacc.2018.11.005
11. Grundy SM, Stone NJ, Bailey AL, et al. 2018 AHA/ACC/AACVPR/AAPA/ABC/ACPM/ADA/AGS/APhA/ASPC/NLA/PCNA guideline on the management of blood cholesterol: a report of the American College of Cardiology/American Heart Association task force on clinical practice guidelines. J Am Coll Cardiol. 2019;73(24):e285–e350. doi:10.1016/j.jacc.2018.11.003
12. Piepoli MF, Hoes AW, Agewall S, et al. 2016 European guidelines on cardiovascular disease prevention in clinical practice: the sixth joint task force of the European Society of Cardiology and other societies on cardiovascular disease prevention in clinical practice (constituted by representatives of 10 societies and by invited experts)developed with the special contribution of the European Association for Cardiovascular Prevention & Rehabilitation (EACPR). Eur Heart J. 2016;37(29):2315–2381. doi:10.1093/eurheartj/ehw106
13. Goff DC, Lloyd-Jones DM, Bennett G, et al. 2013 ACC/AHA guideline on the assessment of cardiovascular risk. J Am Coll Cardiol. 2014;63(25):2935–2959. doi:10.1016/j.jacc.2013.11.005
14. Damen JAAG, Hooft L, Schuit E, et al. Prediction models for cardiovascular disease risk in the general population: systematic review. BMJ. 2016;353:i2416. doi:10.1136/bmj.i2416
15. D’Agostino Ralph B, Vasan Ramachandran S, Pencina Michael J, et al. General cardiovascular risk profile for use in primary care. Circulation. 2008;117(6):743–753. doi:10.1161/CIRCULATIONAHA.107.699579
16. Saidi O, Malouche D, O’Flaherty M, et al. Assessment of cardiovascular risk in Tunisia: applying the Framingham risk score to national survey data. BMJ Open. 2016;6:11. doi:10.1136/bmjopen-2015-009195
17. Boateng D, Agyemang C, Beune E, et al. Cardiovascular disease risk prediction in sub-Saharan African populations - Comparative analysis of risk algorithms in the RODAM study. Int J Cardiol. 2018;254:310–315. doi:10.1016/j.ijcard.2017.11.082
18. Gaziano TA, Pandya A, Steyn K, et al. Comparative assessment of absolute cardiovascular disease risk characterization from non-laboratory-based risk assessment in South African populations. BMC Med. 2013;11(1):170. doi:10.1186/1741-7015-11-170
19. Wekesah FM, Mutua MK, Boateng D, et al. Comparative performance of pooled cohort equations and Framingham risk scores in cardiovascular disease risk classification in a slum setting in Nairobi Kenya. Int J Cardiol Heart Vasc. 2020;28. doi:10.1016/j.ijcha.2020.100521
20. Pedro JM, Brito M, Barros H. Cardiovascular risk assessment in angolan adults: a descriptive analysis from cardiobengo, a community-based survey. Int J Hypertens. 2018;2018. doi:10.1155/2018/2532345
21. Vusirikala A, Wekesah F, Kyobutungi C, Oyebode O. Assessment of cardiovascular risk in a slum population in Kenya: use of World Health Organisation/International Society of Hypertension (WHO/ISH) risk prediction charts - secondary analyses of a household survey. BMJ Open. 2019;9(9):e029304. doi:10.1136/bmjopen-2019-029304
22. Damasceno A, Padrão P, Silva-Matos C, Prista A, Azevedo A, Lunet N. Cardiovascular risk in Mozambique: who should be treated for hypertension? J Hypertens. 2013;31(12):2348–2355. doi:10.1097/HJH.0b013e3283656a0a
23. Babatunde OA, Olarewaju SO, Adeomi AA, et al. 10-year risk for cardiovascular diseases using WHO prediction chart: findings from the civil servants in South-western Nigeria. BMC Cardiovasc Disord. 2020;20(1):154. doi:10.1186/s12872-020-01438-9
24. Boateng D, Agyemang C, Kengne AP, Grobbee DE, Klipstein-Grobusch K. Cardiovascular disease risk prediction in low income settings: a call for context specific risk equations. Int J Cardiol. 2018;265:239. doi:10.1016/j.ijcard.2018.05.010
25. Farzadfar F. Cardiovascular disease risk prediction models: challenges and perspectives. Lancet Glob Health. 2019;7(10):e1288–e1289. doi:10.1016/S2214-109X(19)30365-1
26. Kaptoge S, Pennells L, Bacquer DD, et al. World Health Organization cardiovascular disease risk charts: revised models to estimate risk in 21 global regions. Lancet Glob Health. 2019;7(10):e1332–e1345. doi:10.1016/S2214-109X(19)30318-3
27. Li X, Wu C, Lu J, et al. Cardiovascular risk factors in China: a nationwide population-based cohort study. Lancet Public Health. 2020;5(12):e672–e681. doi:10.1016/S2468-2667(20)30191-2
28. Peiris D, Ghosh A, Manne-Goehler J, et al. Cardiovascular disease risk profile and management practices in 45 low-income and middle-income countries: a cross-sectional study of nationally representative individual-level survey data. PLoS Med. 2021;18(3):e1003485. doi:10.1371/journal.pmed.1003485
29. Geldsetzer P, Manne-Goehler J, Theilmann M, et al. Geographic and sociodemographic variation of cardiovascular disease risk in India: a cross-sectional study of 797,540 adults. PLoS Med. 2018;15(6):e1002581. doi:10.1371/journal.pmed.1002581
30. DevelopingCountries I. of M (US) C on P the GE of CDM the C. In: Fuster V, Kelly BB, editors. Reducing the Burden of Cardiovascular Disease: Intervention Approaches. US: National Academies Press; 2010:3. Available from: https://www.ncbi.nlm.nih.gov/books/NBK45696/.
31. Miszkurka M, Haddad S, Langlois ÉV, Freeman EE, Kouanda S, Zunzunegui MV. Heavy burden of non-communicable diseases at early age and gender disparities in an adult population of Burkina Faso: World Health Survey. BMC Public Health. 2012;12:24. doi:10.1186/1471-2458-12-24
32. Gaziano TA, Abrahams-Gessel S, Denman CA, et al. An assessment of community health workers’ ability to screen for cardiovascular disease risk with a simple, non-invasive risk assessment instrument in Bangladesh, Guatemala, Mexico, and South Africa: an observational study. Lancet Glob Health. 2015;3(9):e556–563. doi:10.1016/S2214-109X(15)00143-6
33. Millogo T, Bicaba BW, Soubeiga JK, Dabiré E, Médah I, Kouanda S. Diabetes and abnormal glucose regulation in the adult population of Burkina Faso: prevalence and predictors. BMC Public Health. 2018;18(1):350. doi:10.1186/s12889-018-5257-4
34. Soubeiga JK, Millogo T, Bicaba BW, Doulougou B, Kouanda S. Prevalence and factors associated with hypertension in Burkina Faso: a countrywide cross-sectional study. BMC Public Health. 2017;17(1):64. doi:10.1186/s12889-016-3926-8
35. Bonnechère B, Cissé K, Millogo T, et al. Tobacco use and associated risk factors in Burkina Faso: results from a population-based cross-sectional survey. BMC Public Health. 2019;19(1). doi:10.1186/s12889-019-7826-6
36. Nonterah EA, Boua PR, Klipstein‐Grobusch K, et al. Classical cardiovascular risk factors and HIV are associated with carotid intima‐media thickness in adults from Sub‐Saharan Africa: findings from H3Africa AWI‐Gen Study. J Am Heart Assoc. 2019;8:14. doi:10.1161/JAHA.118.011506
37. Zeba AN, Yaméogo MT, Tougouma SJ-B, Kassié D, Fournet F. Can urbanization, social and spatial disparities help to understand the rise of cardiometabolic risk factors in bobo-dioulasso? A study in a secondary city of Burkina Faso, West Africa. Int J Environ Res Public Health. 2017;14(4):378. doi:10.3390/ijerph14040378
38. Wang H, Sun Y, Wang S, Tao Y, Zhang L. Comparisons of the Framingham and ASCVD risk scores for coronary heart disease risk prediction in Chinese men. Int J Cardiol. 2018;266:269. doi:10.1016/j.ijcard.2018.03.061
39. Cook Nancy R, Paynter Nina P, Eaton Charles B, et al. Comparison of the Framingham and reynolds risk scores for global cardiovascular risk prediction in the multiethnic women’s health initiative. Circulation. 2012;125(14):1748–1756. doi:10.1161/CIRCULATIONAHA.111.075929
40. Selvarajah S, Kaur G, Haniff J, et al. Comparison of the Framingham risk score, SCORE and WHO/ISH cardiovascular risk prediction models in an Asian population. Int J Cardiol. 2014;176(1):211–218. doi:10.1016/j.ijcard.2014.07.066
41. Mateen FJ, Kanters S, Kalyesubula R, et al. Hypertension prevalence and Framingham risk score stratification in a large HIV-positive cohort in Uganda. J Hypertens. 2013;31(7):1372. doi:10.1097/HJH.0b013e328360de1c
42. Sawadogo A, Sanou S, Hema A, et al. Syndrome métabolique et risque cardiovasculaire chez des patients sous antirétroviraux à l’hôpital de jour de Bobo-Dioulasso (Burkina Faso). Bull Soc Pathol Exot. 2014;107(3):151–158. doi:10.1007/s13149-014-0371-8
43. Yaméogo NV, Samadoulougou A, Kagambèga LJ, et al. Troubles du sommeil, symptômes anxio-dépressifs et risque cardio-vasculaire chez les hypertendus noirs africains: étude transversale de 414 hypertendus suivis en ambulatoire au CHU de Ouagadougou (Burkina Faso). Pan Afr Med J. 2015;21. doi:10.11604/pamj.2015.21.115.5219
44. Hajifathalian K, Ueda P, Lu Y, et al. A novel risk score to predict cardiovascular disease risk in national populations (Globorisk): a pooled analysis of prospective cohorts and health examination surveys. Lancet Diabetes Endocrinol. 2015;3(5):339–355. doi:10.1016/S2213-8587(15)00081-9
45. Ministère de la santé. Rapport de l’enquête Nationale Sur Les Facteurs de Risque Commun Aux Maladies Non Transmissibles Au Burkina Faso: Enquête STEP 2013. Vol. 104. Ministère de la santé; 2014. . Available from: https://www.who.int/chp/steps/BurkinaFaso_2013_STEPS_Report.pdf.
46. Collins D, Lee J, Bobrovitz N, Koshiaris C, Ward A, Heneghan C. whoishRisk – an R package to calculate WHO/ISH cardiovascular risk scores for all epidemiological subregions of the world. F1000Research. 2017;5:2522. doi:10.12688/f1000research.9742.2
47. Grammer TB, Dressel A, Gergei I, et al. Cardiovascular risk algorithms in primary care: results from the DETECT study. Sci Rep. 2019;9(1):1–12. doi:10.1038/s41598-018-37092-7
48. Baker S, Priest P, Jackson R. Using thresholds based on risk of cardiovascular disease to target treatment for hypertension: modelling events averted and number treated. BMJ. 2000;320(7236):680–685. doi:10.1136/bmj.320.7236.680
49. World Health Organization. Hearts: Technical Package for Cardiovascular Disease Management in Primary Health Care. World Health Organization; 2020. Available from: https://apps.who.int/iris/handle/10665/333221.
50. INSD. Projection démographique de 2007 à 2020 par région et province. August, 2009.
51. QGIS Development Team. QGIS Geographic Information System. Open Source Geospatial Foundation; 2009. Available from: http://qgis.osgeo.org.
52. StataCorp. Stata Statistical Software: Release 15. College Station, TX: StataCorp LLC; 2017.
53. Olatunbosun ST, Kaufman JS, Bella AF. Central obesity in Africans: anthropometric assessment of abdominal adiposity and its predictors in Urban Nigerians. J Natl Med Assoc. 2018;110(5):519–527. doi:10.1016/j.jnma.2018.01.001
54. Kim AS, Johnston SC. Global variation in the relative burden of stroke and ischemic heart disease. Circulation. 2011;124(3):314–323. doi:10.1161/CIRCULATIONAHA.111.018820
55. Amegah AK. Tackling the growing burden of cardiovascular diseases in Sub-Saharan Africa: need for dietary guidelines. Circulation. 2018;138(22):2449–2451. doi:10.1161/CIRCULATIONAHA.118.037367
56. Yusuf S, Wood D, Ralston J, Reddy KS. The World Heart Federation’s vision for worldwide cardiovascular disease prevention. Lancet. 2015;386(9991):399–402. doi:10.1016/S0140-6736(15)60265-3
57. Darikwa TB, Manda SO. Spatial co-clustering of cardiovascular diseases and select risk factors among adults in South Africa. Int J Environ Res Public Health. 2020;17(10):3583. doi:10.3390/ijerph17103583
58. Dégano IR, Marrugat J, Grau M, et al. The association between education and cardiovascular disease incidence is mediated by hypertension, diabetes, and body mass index. Sci Rep. 2017;7. doi:10.1038/s41598-017-10775-3
59. Rosengren A, Smyth A, Rangarajan S, et al. Socioeconomic status and risk of cardiovascular disease in 20 low-income, middle-income, and high-income countries: the Prospective Urban Rural Epidemiologic (PURE) study. Lancet Glob Health. 2019;7(6):e748–e760. doi:10.1016/S2214-109X(19)30045-2
60. Gaziano TA, Abrahams-Gessel S, Alam S, et al. Comparison of nonblood-based and blood-based total CV risk scores in global populations. Glob Heart. 2016;11(1):37–46.e2. doi:10.1016/j.gheart.2015.12.003
61. Bagheri N, Gilmour B, McRae I. Community cardiovascular disease risk from cross-sectional general practice clinical data: a spatial analysis. Prev Chronic Dis. 2015;12. doi:10.5888/pcd12.140379
62. Cooney MT, Dudina AL, Graham IM. Value and limitations of existing scores for the assessment of cardiovascular risk: a review for clinicians. J Am Coll Cardiol. 2009;54(14):1209–1227. doi:10.1016/j.jacc.2009.07.020
63. Ueda P, Woodward M, Lu Y, et al. Laboratory-based and office-based risk scores and charts to predict 10-year risk of cardiovascular disease in 182 countries: a pooled analysis of prospective cohorts and health surveys. Lancet Diabetes Endocrinol. 2017;5(3):196–213. doi:10.1016/S2213-8587(17)30015-3
 © 2021 The Author(s). This work is published and licensed by Dove Medical Press Limited. The
full terms of this license are available at https://www.dovepress.com/terms
and incorporate the Creative Commons Attribution
- Non Commercial (unported, 3.0) License.
By accessing the work you hereby accept the Terms. Non-commercial uses of the work are permitted
without any further permission from Dove Medical Press Limited, provided the work is properly
attributed. For permission for commercial use of this work, please see paragraphs 4.2 and 5 of our Terms.
© 2021 The Author(s). This work is published and licensed by Dove Medical Press Limited. The
full terms of this license are available at https://www.dovepress.com/terms
and incorporate the Creative Commons Attribution
- Non Commercial (unported, 3.0) License.
By accessing the work you hereby accept the Terms. Non-commercial uses of the work are permitted
without any further permission from Dove Medical Press Limited, provided the work is properly
attributed. For permission for commercial use of this work, please see paragraphs 4.2 and 5 of our Terms.