Back to Journals » Journal of Blood Medicine » Volume 14
Genotyping Approach to Predict Coa and Cob Antigens in Thai Blood Donor Populations
Authors Nathalang O ![]() , Asisathaporn K, Intharanut K
, Asisathaporn K, Intharanut K ![]() , Chaibangyang W, Leetrakool N, Mitundee S, Bejrachandra S
, Chaibangyang W, Leetrakool N, Mitundee S, Bejrachandra S
Received 22 November 2022
Accepted for publication 6 February 2023
Published 17 February 2023 Volume 2023:14 Pages 133—140
DOI https://doi.org/10.2147/JBM.S398720
Checked for plagiarism Yes
Review by Single anonymous peer review
Peer reviewer comments 4
Editor who approved publication: Dr Martin H Bluth
Oytip Nathalang,1 Kamonchanok Asisathaporn,1 Kamphon Intharanut,1 Wanlapa Chaibangyang,1 Nipapan Leetrakool,2 Supattra Mitundee,3 Sasitorn Bejrachandra4
1Graduate Program in Medical Technology, Faculty of Allied Health Sciences, Thammasat University, Pathumthani, Thailand; 2Blood Bank Section, Faculty of Medicine, Chiang Mai University, Chiang Mai, Thailand; 3Regional Blood Centre 12th Songkhla, Thai Red Cross Society, Songkhla, Thailand; 4National Blood Centre, Thai Red Cross Society, Bangkok, Thailand
Correspondence: Oytip Nathalang, Graduate Program in Medical Technology, Faculty of Allied Health Sciences, Thammasat University, 99 Moo 18 Klongluang, Pathumthani, 12120, Thailand, Tel +662-9869213 Ext. 7231, Fax +662-5165379, Email [email protected]
Purpose: Coa and Cob antigens of the Colton (CO) blood group system are implicated in acute and delayed hemolytic transfusion reactions (HTRs). Owing to the inadequate supply of specific antiserum, data on CO phenotypes remain limited. This study aimed to develop genotyping methods to predict Coa and Cob antigens and to estimate transfusion-induced alloimmunization risks in three Thai blood donor populations.
Materials and Methods: The study included 2451 blood samples from unrelated healthy Thai blood donors obtained from central, northern, and southern Thailand. DNA sequencing was used to determine the CO*A and CO*B alleles. In-house PCR with sequence-specific primers (PCR-SSP) and high-resolution melting curve (HRM) assays were performed and genotyping results were compared using DNA sequencing. CO*A and CO*B allele frequencies among Thais were determined using PCR-SSP and their frequencies were compared with other populations. The risks of Coa and Cob transfusion-induced alloimmunization among Thai donor populations were calculated.
Results: The validated genotyping results by PCR-SSP and HRM assays agreed with DNA sequencing. The CO*A/CO*A was the most common (100.0, 100.0, and 99.3%), followed by CO*A/CO*B (0.0, 0.0, and 0.7%) among central, northern and southern Thais. Homozygous CO*B/CO*B was not found. The CO*A and CO*B allele frequencies among central Thais significantly differed compared among southern Thais (p < 0.01) but not among northern Thais. Those allele frequencies among Thais were similar to those of Taiwanese, Chinese and Malay-Malaysian populations but not to South Asian, Southeast Asian, Korean, Japanese, Filipino, French Basque, and Maltese populations (p < 0.01). A higher risk of anti-Cob production rather than anti-Coa production was particularly noted in the southern Thai population.
Conclusion: This study constitutes the first to determine CO*A and CO*B genotypes using PCR-SSP and HRM assays among Thais and this finding would be beneficial in predicting alloimmunization risk and providing safe transfusions among Thais.
Keywords: the Colton blood group system, genotypes, PCR-SSP, HRM, Thais
Introduction
The Colton (CO) blood group system (ISBT No. 015) currently consists of four antigens; a high prevalence antigen, Coa with its antithetical antigen, Cob, and the other high prevalence antigens, Co3 and Co4.1 The CO antigens are carried on red blood cell (RBC) water transporter, aquaporin-1 (AQP1), encoded by the AQP1 gene located on chromosome 7p14.2,3 Regarding the frequency of Coa and Cob antigens in populations, Co(a+b−) is the most common phenotype, 91.4–100.0%, followed by Co(a+b+), 0.0–8.4%, and Co(a−b+), 0.0–0.2%. The Co(a−b−) is a rare phenotype.4–7 Anti-Coa is implicated in both acute and delayed hemolytic transfusion reactions (HTRs), and mild to severe hemolytic diseases of the fetus and newborn (HDFN). In contrast, anti-Cob, a rare antibody, has been involved in acute and delayed HTRs, while no case of HDFN has been reported.2–4
Both anti-Coa and anti-Cob are commonly IgG and reactive by the indirect antiglobulin test (IAT), especially when using protease-treated RBCs.3,8 However, IgM anti-Coa has been reported.3,4 To date, anti-Coa and anti-Cob are not commercialized and are only available in specialized reference laboratories. Moreover, some limitations to perform precise Coa and Cob antigen typing using serological techniques are due to the positive direct antiglobulin test (DAT) and positive autocontrol in frequent transfused patients.2 On the other hand, patients with multiple alloantibodies or unidentified antibodies make it challenging to determine antibody specificities; as a result, additional panel cells with uncommon or low prevalence antigens such as Kpa, Vel and Cob are needed.9
Given that antiserum for CO phenotyping is unavailable, CO genotyping can help to select the most appropriate blood for patients with anti-Coa or anti-Cob. The Coa/Cob polymorphism arises from a single nucleotide variation (SNV) associated with the c.134C>T (rs28362692) missense variant encoding p.Ala45Val (alanine for Coa and valine for Cob) in exon 1 of the AQP1 gene.2–4 Polymerase chain reaction with sequence-specific primers (PCR-SSP) was implemented to distinguish between CO*A and CO*B alleles to predict Coa and Cob antigens among unrelated French Basque and Maltese blood donors.10,11 Additionally, multiplex PCR has also been used to identify those alleles in Austrian blood donor populations.12 Subsequently, commercially available high-throughput techniques for red cell genotyping have been performed only in reference laboratories due to the high cost of reagents and the required complex equipment.5,6,13
In Thailand, low-throughput methods such as PCR-SSP and multiplex PCR were performed to predict extended blood group phenotypes in donor and patient populations, and the results were consistent with the serological testing.14 Recently, high-resolution melting curve (HRM) analysis has been implemented to reduce errors in interpretation and manual inspection for red cell genotyping using PCR-SSP.15 Therefore, this study aimed to develop genotyping methods to predict Coa and Cob antigens and to estimate transfusion-induced alloimmunization risks in three Thai blood donor populations.
Materials and Methods
Sample Size
This experimental cross-sectional study was approved by the Human Research Ethics Committee of Thammasat University (HREC-TUSc) Pathumthani, Thailand in accordance with the Declaration of Helsinki (COE No. 012/2565). Written informed consent was obtained from all individual participants. The study included 2451 samples of EDTA-anticoagulated blood from unrelated healthy Thai blood donors. In all, 1724 samples were from the National Blood Centre, Thai Red Cross Society, Bangkok, Thailand. In addition, 300 samples were from the Blood Bank Section, Faculty of Medicine, Chiang Mai University, Chiang Mai, Thailand and 427 samples were from the Regional Blood Centre, 12th Songkhla, Thai Red Cross Society, Songkhla, Thailand.
Genomic DNA, extracted from all subjects using a Genomic DNA extraction kit (REAL Genomics, RBCBioscience, Taipei, Taiwan), was then stored at −20°C until used for genotyping.
Sequence-Based Genotyping
The genomic DNA of 400 blood donors was sequenced to identify CO*A and CO*B alleles. Primers were designed using Primer3 and BLAST. A fragment of 150 bp containing SNV (c.134 C>T; p. Ala45Val) in exon 1 of the AQP1 gene was obtained from PCR amplification of genomic DNA using SEQ-CO-150-F forward and SEQ-CO-150-R reverse primers (Table 1). For each PCR reaction, 2 µL of genomic DNA (50 ng/µL) was a template for PCR amplification as a starting amount in a total volume of 50 µL using 0.6 µM of both forward and reverse primers for each reaction. PCR was performed using 25 µL of 2X PCR reaction mixture (Phusion High-Fidelity PCR Master Mix, New England BioLabs, MA, USA) and 17 µL of sterile distilled water in a T100 Thermal Cycler (Bio-Rad Laboratories, Inc., Hercules, CA, USA).
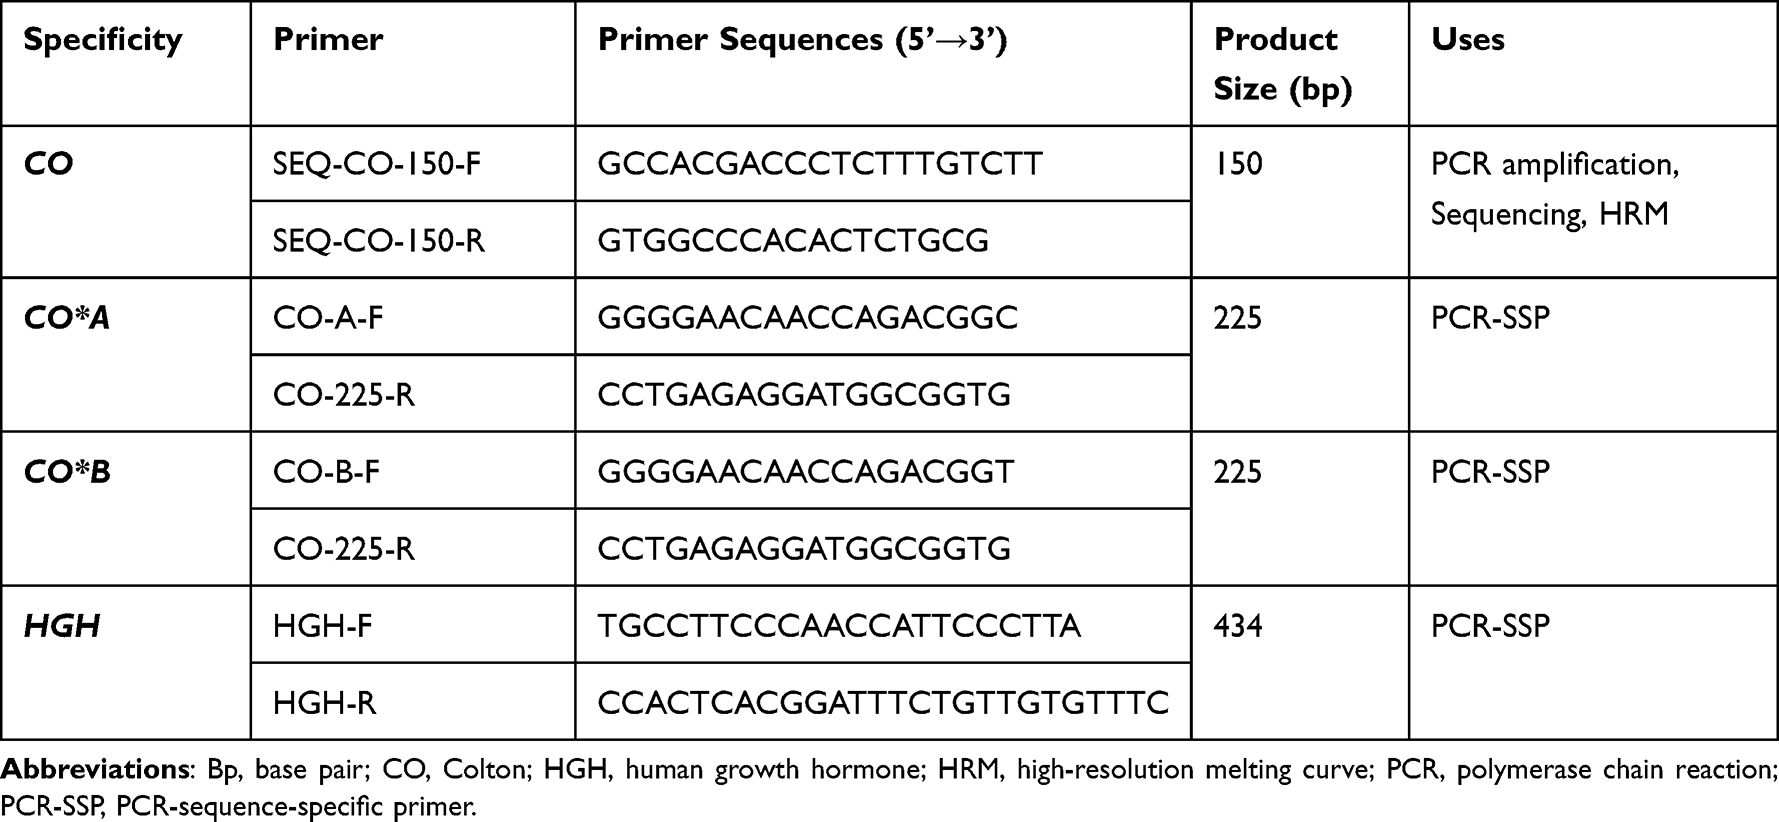 |
Table 1 Sequences of the Primers for CO*A and CO*B Genotyping |
PCR was performed under the following conditions. Initial denaturation was conducted at 95°C for 30 sec. The PCR program began with 10 cycles of 10 sec at 95°C and 60 sec at 69°C, then 20 cycles of 30 sec at 95°C, 60 sec at 62°C, and 30 sec at 72°C. The last step was a final extension for 5 min at 72°C. The PCR products were subjected to electrophoresis and were visualized under a blue-light transilluminator. Then the PCR products were purified using a gel extraction kit (GeneJET Gel Extraction Kit, Thermo Scientific, MA, USA), and eluted fragments were sequenced (U2Bio Sequencing Service, Bangkok, Thailand) using the abovementioned PCR primers.
PCR-SSP
To identify CO*A and CO*B alleles the in-house PCR-SSP technique was used. Primers and amplification conditions were designed (Table 1). Briefly, 1 µL of genomic DNA (50 ng/µL) was a template for PCR amplification as a starting amount in a total volume of 10 µL using 0.5 µM of CO-A-F and CO-225-R primers to detect CO*A alleles, and 0.5 µM of CO-B-F and CO-225-R primers to detect CO*B alleles. Co-amplification of the human growth hormone (HGH) gene using 0.6 µM of HGH-F and HGH-R primers was run as the internal control. The PCR was performed with 5 µL of 2 x PCR reaction mixture (OnePCR Plus, GeneDirex, Taiwan) in a T100 Thermal Cycler (Bio-Rad Laboratories, Inc., Hercules, CA, USA), using the identical abovementioned PCR conditions, and the sample was kept at 4°C. PCR products were subjected to electrophoresis at 100 volts on 1.5% agarose gel using 1X TBE buffer and were visualized under a blue-light transilluminator. The PCR product size of both CO*A and CO*B alleles was 225 bp, whereas that of the internal control, the HGH gene, was 434 bp. Known DNA controls of CO*A/CO*A, and CO*A/CO*B genotypes were used as positive and negative controls in parallel with unknown samples. Altogether, 2451 DNA samples (including 400 samples tested by DNA sequencing), were used to detect CO*A and CO*B alleles using PCR-SSP. Additionally, the DNA samples from 100 randomly genotyped blood donors were retested by PCR-SSP with identical conditions as the first round testing and sequenced to validate our in-house PCR-SSP technique for CO genotyping.
HRM Assay
The HRM assay was developed for CO genotyping in 400 DNA samples confirmed by DNA sequencing. Each pair of forward and reverse primers SEQ-CO-150-F and SEQ-CO-150-R was designed to amplify the CO genes (Table 1), and 150 bp PCR products were expected. A DNA typing kit (Type-it HRM PCR Kit, QIAGEN GmbH, Valencia, CA, USA) was used to perform the PCR-HRM assay.
In a PCR reaction mix, 10 μL of 2X HRM PCR Master Mix reagent, 1 μL of genomic DNA (10 to 50 ng/μL concentration), and 0.35 μM of both forward and reverse primers were combined with water to make a final volume of 20 μL. PCR reaction tubes were placed on a real-time PCR cycler (Rotor-Gene Q 5plex HRM, QIAGEN GmbH, Valencia, CA, USA). The cycling parameters for the PCR program consisted of initial denature at 95°C for 5 min, followed by 40 cycles at 95°C for 30 sec, 62°C for 40 sec and 72°C for 30 sec. At the end of the PCR step, the temperature was gradually increased by 0.1°C every 2 sec from 65°C to 95°C. Total fluorescence and the rate of change in fluorescence were monitored, and data were acquired on the green and HRM channels. Rotor-Gene Q Series Software was used to analyze the HRM data. Unknown melting profiles of DNA samples were compared with a set of determined controls on an allele-target basis. A confidence threshold of 90% was set for HRM genotyping calls.
To increase the validity and reliability of the evaluation, technicians were blinded to the PCR-SSP results. DNA sequencing was performed in case any discrepant genotyping results were obtained using the HRM and PCR-SSP assays.
Statistical Analysis
The gene and allele frequencies among the Thai blood donors were calculated using the gene-counting method. The chi-squared (χ2) test was used to evaluate whether the observed genotype frequencies agreed with the expected ones under the Hardy-Weinberg equilibrium. The two-tailed Fisher’s exact test of homogeneity was used to determine the differences of their allele frequencies among central, northern and southern Thais and to compare the differences with those reported in other populations.6,7,10,11,16,17 A p-value of less than 0.05 was considered statistically significant.
Results
Sequencing studies on 400 DNA Thai blood donor samples that exhibited the CO*A allele revealed the presence of c.134C, while the c.134T represented the CO*B allele. The two patterns of sequencing chromatograms are shown in Figure 1. The distribution of genotyping results among 400 DNA samples revealed that 398 were homozygous CO*A/CO*A, and 2 were heterozygous CO*A/CO*B. Homozygous CO*B/CO*B was not found in this group.
 |
Figure 1 Electropherograms of the AQP1 Gene at the CO*A and CO*B Polymorphism Region, SNV c.134C>T (rs28362692). (A) Homozygous state of the c.134C identified in the CO*A/CO*A genotype and (B) Heterozygous state of the c.134C/T identified in the CO*A/CO*B genotype. |
The results of the PCR-SSP were used to distinguish between the CO*A and CO*B alleles. The first and second mixes could identify the CO*A and CO*B alleles with an amplified product size of 225 bp, as shown in Figure 2. The validated genotyping results by PCR-SSP among DNA controls (CO*A/CO*A and CO*A/CO*B) were consistent with each other, and the results in both sets showed 100% concordance with 400 known DNA sequencing results. In addition, repeated PCR-SSP was performed using 100 random DNA samples and confirmed by DNA sequencing. Those results of repeated testing were identical to the first round of testing and agreed with DNA sequencing.
 |
Figure 2 Representative Gel Shows Genotyping Results of the CO*A and CO*B Alleles Using the PCR-SSP Technique. The 434 bp amplification product of the HGH control primers was present in all lanes, showing that amplification had occurred optimally. The genotype was deduced from the presence or absence of 225 bp amplification product specific for CO*A and CO*B alleles. Lanes A and B referred to the specific CO allele test (CO*A and CO*B, respectively). From left to right: Lanes 1A-1B (SM101) = CO*A/CO*A; 2A-2B (SM106) = CO*A/CO*B and NC = negative control, respectively. M: 100 bp ladder marker (Fermentas, Carlsbad, CA, USA). |
Altogether, 1724, 300, and 427 samples obtained from central, northern and southern Thai blood donors, respectively, were genotyped for CO*A and CO*B separately, using the developed PCR-SSP (Table 2).CO*A/CO*A was found to be the most common genotype in the three groups of Thai blood donors (100.0, 100.0, and 99.3% in central, northern and southern Thais, respectively), while CO*A/CO*B was found only in southern blood donors (3/427, 0.7%); CO*B/CO*B was not found in the three groups. The allele frequencies of CO*A in central, northern and southern Thais were 1.000 (3448/3448), 1.000 (600/600), and 0.996 (851/854), respectively. In addition, the frequencies of CO*B were 0.000 (0/3448), 0.000 (0/600), and 0.004 (3/854), respectively. The genotypes of the 1724 central, 300 northern and 427 southern Thais were consistent with each other according to the Hardy-Weinberg equilibrium. The detected CO*A and CO*B allele frequencies among Thai blood donors significantly differed among central Thais compared with southern Thais (p < 0.01) but not among northern Thais (Table 2). Moreover, PCR-SSP was performed using 100 randomly selected samples consisting of 98 homozygous CO*A/CO*A, and two heterozygous CO*A/CO*B, confirmed by DNA sequencing. The results of the repeated testing were consistent with the DNA sequencing results.
 |
Table 2 CO*A and CO*B Genotype and Allele Frequencies Among Thai Blood Donors |
DNA controls of CO*A/CO*A and CO*A/CO*B were amplified and analyzed using the HRM assay, while CO*A and CO*B alleles were genotyped using HRM curves. Representative normalized HRM curves were of two types: the red curve representing the homozygous CO*A/CO*A genotypes and the purple curve representing the heterozygous CO*A/CO*B genotypes. HRM curves showed a clear separation in those two genotypes at Tm ranging from 86.5 to 87.5°C for the CO genotyping (Figure 3). The developed HRM assay was implemented in 400 donor samples to predict phenotypes of Colton blood group systems. The results were concordant with those 400 samples obtained for genotypes by DNA sequencing and PCR-SSP.
 |
Figure 3 HRM analysis of CO genotypes. |
The CO*A and CO*B allele frequencies in Thai and other populations are shown in Table 3. The CO*A and CO*B frequencies among Thais were similar to previously reported in Thai,16 Taiwanese,17 Chinese6 and Malay-Malaysian7 populations (p > 0.05). Significant differences were observed when CO*A and CO*B allele frequencies among Thais compared with South Asian,6 Southeast Asian,6 Korean,6 Japanese,6 Filipino,6 French Basque,10 and Maltese11 populations (p < 0.01).
 |
Table 3 Comparison of the CO*A and CO*B Allele Frequencies Among Different Populations |
The risks of Coa and Cob alloimmunization in the three Thai populations were calculated, according to the observed phenotypes. Because the CO*B/CO*B genotype was not found in all Thai populations, only the alloimmunization risk of anti-Cob production is supposed to be calculated. The CO*A/CO*B genotype was only observed in southern Thais; hence, the possibility of anti-Cob production was 0.0069, estimated by CO*A/CO*B donor to CO*A/CO*A patient (0.9930 X 0.0070). Regarding regional groups, the risk of Cob alloimmunization in southern Thailand was higher than in central and northern Thailand.
Discussion
For the Colton blood group system, anti-Coa and anti-Cob are required to determine the three CO phenotypes. To overcome the limitation of specific antisera, red cell genotyping is helpful in predicting phenotypes among blood donors and patients. Moreover, it remains impossible to identify various antibody specificities when employing reagent RBCs with only limited serologically antigen-typed information. A related study revealed the impact of using genotyped RBCs to identify antibody specificities. Altogether, 21 different antibodies from 10 different blood group systems including Knops, Yt, Vel, Dombrock, Lutheran, Rh, Diego, Colton, Scianna and Landsteiner-Wiener could be identified among 126 patients (1.5%) due to the genotyped information of the reagent RBCs.9
Red cell genotyping by commercially available Beadchip array has been used for assigning 34 antigens in 11 blood group systems in different populations.6 Nevertheless, some blood group antigens might only be significant in somewhat different populations and the reagents required are becoming costly. In this study, we developed the genotyping methods to determine CO*A and CO*B alleles, and PCR-SSP and HRM genotyping results agreed with DNA sequencing results; hence, the genotyping results were accurate and reproducible.
In addition, CO allele frequencies of Thai populations were compared with those reported of other groups.6,7,10,11,16,17 The significant difference in CO*A and CO*B frequencies among Thais compared with French Basque and Maltese populations might induce a higher probability of finding anti-Coa in Co(a−b+) patients than in Thai patients. However, the rare donors, Co(a−b+) phenotype, still exist among those populations.10,11 A similar prevalence of predicted Co(a+) phenotype among Thais and Chinese was found in this study, corresponding to the Do(a+) phenotype in the Dombrock blood group system.18 Genotyping methods such as PCR-SSP and HRM are applicable to predict the phenotypes of extended blood group systems.14,15,19
In Thailand, the Coa/Cob phenotyping is not routinely performed, and reagent red cells for antibody identification are also unspecified Coa/Cob antigens. In this study, the predicted Coa and Cob antigens were obtained by genotyping results, the highest prevalence was Co(a+b−) phenotype in all three Thai populations and Co(a+b+) donors were only observed in southern Thais. The possibility of anti-Cob production caused by blood transfusion is high, especially among southern Thais compared with central and northern Thais. However, a related study of frequencies and antibody specificities among alloimmunized southern Thai patients revealed that more than 5% were undetermined antibody specificities.20 Anti-Cob may therefore hide in those patients owing to unspecified Coa/Cob antigens in panel cells. The genotyping in reagent RBCs, in particular Co(b+), is crucial to identify antibody specificity to prevent adverse transfusion reactions and to screen appropriate blood donors among patients with either anti-Coa or anti-Cob. Although the Co(a−b+) phenotype was not observed in this study, a patient with this phenotype produces an anti-Coa, autologous blood donation, and recruiting related donors will be necessary.
Conclusion
This study constitutes the first to determine CO*A and CO*B genotypes in Thai populations using in-house PCR-SSP and HRM assays. This finding would be beneficial in predicting the risk of alloimmunization, especially anti-Cob production, and providing safe transfusions among Thais.
Acknowledgments
This project is funded by the National Research Council of Thailand (NRCT), Bangkok, Thailand (Contract No. N35A650827). No external funding or donations were provided for this research.
Author Contributions
All authors made a significant contribution to the work reported, whether that is in the conception, study design, execution, acquisition of data, analysis and interpretation, or in all these areas; took part in drafting, revising or critically reviewing the article; gave final approval of the version to be published; have agreed on the journal to which the article has been submitted; and agree to be accountable for all aspects of the work.
Disclosure
The authors report no conflicts of interest in this work.
References
1. International Society of Blood Transfusion. Red cell immunogenetics and blood group terminology; 2022. Available from: https://www.isbtweb.org/resource/tableofbloodgroupantigenswithinsystems.html.
2. Cohn CS, Delaney M, Johnson ST, Katz LM. Technical Manual.
3. Daniels G. Human Blood Groups.
4. Halverson GR, Peyrard T. A review of the Colton blood group system. Immunohematology. 2010;26(1):22–26. doi:10.21307/immunohematology-2019-196
5. Hong YJ, Chung Y, Hwang SM, et al. Genotyping of 22 blood group antigen polymorphisms and establishing a national recipient registry in the Korean population. Ann Hematol. 2016;95(6):985–991. doi:10.1007/s00277-016-2645-7
6. Delaney M, Harris S, Haile A, Johnsen J, Teramura G, Nelson K. Red blood cell antigen genotype analysis for 9087 Asian, Asian American, and Native American blood donors. Transfusion. 2015;55(10):2369–2375. doi:10.1111/trf.13163
7. Hajar CGN, Zefarina Z, Md Riffin NS, et al. Extended blood group profiles for Malays, Chinese, and Indians in Peninsular Malaysia. Egypt J Med Hum Genet. 2020;21:51. doi:10.1186/s43042-020-00096-y
8. Issitt PD, Anstee DJ. Applied Blood Group Serology.
9. Scharberg E, Rink G, Portegys J, et al. The impact of using genotyped reagent red blood cells in antibody identification. Transfus Med Hemother. 2018;45(4):218–224. doi:10.1159/000491884
10. Touinssi M, Chiaroni J, Degioanni A, et al. DNA-based typing of Kell, Kidd, MNS, Dombrock, Colton, and Yt blood group systems in the French Basques. Am J Hum Biol. 2008;20(3):308–311. doi:10.1002/ajhb.20720
11. Sutton G, Debono J, Borg J. Determining the frequency of Colton blood group antigens Coa and Cob in the Maltese population. Malta J Health Sci. 2019;6(2):6–15.
12. Jungbauer C, Hobel CM, Schwartz DW, Mayr WR. High-throughput multiplex PCR genotyping for 35 red blood cell antigens in blood donors. Vox Sang. 2012;102(3):234–242. doi:10.1111/j.1423-0410.2011.01542.x
13. Ji Y, Wen J, Veldhuisen B, et al. Validation of the multiplex ligation-dependent probe amplification assay and its application on the distribution study of the major alleles of 17 blood group systems in Chinese donors from Guangzhou. Transfusion. 2017;57(2):423–432. doi:10.1111/trf.13940
14. Nathalang O. Red cell genotyping in Thailand: trends for blood transfusion in Asian populations. VOXS. 2020;15:310–31c4. doi:10.1111/voxs.12547
15. Nathalang O, Intharanut K, Chidtrakoon S. High-resolution melting curve analysis to predict extended blood group phenotypes among Thai donors and patients. Transfus Med Hemother. 2021;49(3):163–171. doi:10.1159/000520713
16. Jongruamklang P, Gassner C, Meyer S, et al. Matrix-assisted laser desorption/ionization time-of-flight mass spectrometry analysis of 36 blood group alleles among 396 Thai samples reveals region-specific variants. Transfusion. 2018;58(7):1752–1762. doi:10.1111/trf.14624
17. Peng CT, Tsai CH, Lee HH, Lin CL, Wang NM, Chang JG. Molecular analysis of Duffy, Yt and Colton blood groups in Taiwanese, Filipinos and Thais. Kaohsiung J Med Sci. 2000;16(2):63–67.
18. Wangmo T, Intharanut K, Leetrakool N, Mitundee S, Bejrachandra S, Nathalang O. Development of DO*A and DO*B allele detections to predict transfusion-induced alloimmunization risks in Thai populations. Clin Lab. 2021;67(10). doi:10.7754/Clin.Lab.2021.201220
19. Tanaka M, Takahahi J, Hirayama F, Tani Y. High-resolution melting analysis for genotyping Duffy, Kidd and Diego blood group antigens. Leg Med. 2011;13(1):1–6. doi:10.1016/j.legalmed.2010.08.004
20. Promwong C, Siammai S, Hassarin S, et al. Frequencies and specificities of red cell alloantibodies in the Southern Thai population. Asian J Transfus Sci. 2013;7(1):16–20. doi:10.4103/0973-6247.106718
 © 2023 The Author(s). This work is published and licensed by Dove Medical Press Limited. The
full terms of this license are available at https://www.dovepress.com/terms
and incorporate the Creative Commons Attribution
- Non Commercial (unported, 3.0) License.
By accessing the work you hereby accept the Terms. Non-commercial uses of the work are permitted
without any further permission from Dove Medical Press Limited, provided the work is properly
attributed. For permission for commercial use of this work, please see paragraphs 4.2 and 5 of our Terms.
© 2023 The Author(s). This work is published and licensed by Dove Medical Press Limited. The
full terms of this license are available at https://www.dovepress.com/terms
and incorporate the Creative Commons Attribution
- Non Commercial (unported, 3.0) License.
By accessing the work you hereby accept the Terms. Non-commercial uses of the work are permitted
without any further permission from Dove Medical Press Limited, provided the work is properly
attributed. For permission for commercial use of this work, please see paragraphs 4.2 and 5 of our Terms.