Back to Journals » Diabetes, Metabolic Syndrome and Obesity » Volume 15
Genome-Wide Transcriptome Analysis in Type 2 Diabetes Patients Treated by Sitagliptin
Authors Ma R, Deng X, Aleteng Q, Li L, Zhu J
Received 13 August 2021
Accepted for publication 3 December 2021
Published 9 June 2022 Volume 2022:15 Pages 1761—1770
DOI https://doi.org/10.2147/DMSO.S334144
Checked for plagiarism Yes
Review by Single anonymous peer review
Peer reviewer comments 4
Editor who approved publication: Prof. Dr. Juei-Tang Cheng
Rui Ma,1 Xiao-long Deng,2 Qi-qi-ge Aleteng,1 Lei Li,1 Jun Zhu3
1Department of Endocrinology, The First Affiliated Hospital of Xinjiang Medical University, Urumqi, Xinjiang, 830054, People’s Republic of China; 2Department of Endocrinology, Shunde Hospital of Southern Medical University, Foshan, Guangdong, 528300, People’s Republic of China; 3Department of Endocrinology, People’s Hospital of Shenzhen Baoan District, Shenzhen, Guangdong, 518101, People’s Republic of China
Correspondence: Jun Zhu, Department of Endocrinology, People’s Hospital of Shenzhen Baoan District, Shenzhen, 518101, Guangdong, People’s Republic of China, Tel +86 13899981212, Email [email protected]
Objective: In this study, transcriptome sequencing was performed on patients with type 2 diabetes mellitus treated with different prognosis to explore the differential level genes of different hypoglycemic effects of sitagliptin.
Methods: Patients with newly diagnosed T2DM (within six months of diagnosis) were selected as the study subjects. Patients were given sitagliptin 100 mg once a day orally. After 12 weeks of regular drug therapy, the reduction in glycated hemoglobin was compared before and after drug administration. The patients were then divided into two groups: the significantly effective group (M) and the less effective group (N). High-throughput sequencing of the transcriptome was conducted to detect the differential expression levels of genes in peripheral blood mononuclear cells. Expanded sample size validation of the candidate differential genes was conducted using reverse transcription-polymerase chain reaction (RT-PCR).
Results: After 12 weeks of treatment with sitagliptin, high-throughput sequencing of the transcriptome found that expression of the following genes was different when comparing the significantly effective group (M) and the less effective group (N): ghrelin (GHRL), insulin-like growth factor-1 receptor (IGF1R), mitogen-activated protein kinase-3 (MAPK3), phosphatidylinositol-4,5-bisphosphonate 3-kinase, catalytic subunit delta (PIK3CD), and the suppressor of cytokine signaling-3 (SOCS3). The validation results of RT-PCR showed that, in the significantly effective group (M), the expression of IGF1R was significantly increased (P = 0.034), the expression of MAPK3 was significantly reduced (P = 0.002), and the expression of SOCS3 was also significantly reduced (P < 0.001).
Conclusion: There was a significant difference in gene level between patients with significant hypoglycemic effect and patients with poor hypoglycemic effect, and the expression of IGF1R increased and the expression of MAPK3 and SOCS3 decreased.
Keywords: sitagliptin, hypoglycemic effects, transcriptome sequencing, RT-PCR, SOCS3
Introduction
As the prevalence of diabetes mellitus (DM) increases year by year, choosing a reasonable and effective hypoglycemic program is particularly important for glycemic control in patients with type 2 diabetes mellitus (T2DM).
Nowadays, a major consideration in the choice of treatment for DM is the scientific selection of new drugs that are effective, safe, have few adverse effects, do not aggravate complications, and also improve patient compliance.1 In the selection of a therapeutic protocol, it is also important to control the occurrence of hypoglycemia and prevent weight gain as much as possible, taking into account several factors, such as efficacy, cost, and adverse reactions.
The dipeptidyl peptidase-4 (DPP-4) inhibitor can reduce the endogenous inactivation of glucagon-like peptide-1 (GLP-1) and elevate the level of endogenous GLP-1, thus promoting insulin secretion in a glucose-dependent manner, and also inhibiting glucagon secretion2 in order to achieve a hypoglycemic effect. Sitagliptin, an oral DPP-4 inhibitor, is the first agent of its class to be approved for the treatment of adult patients with type 2 diabetes as monotherapy or in combination with other antihyperglycaemic agents.3 Sitagliptin has the following advantages: it does not increase the risk of hypoglycemia, it does not cause an increase in body weight, it does not aggravate the risk of heart failure, and it has few adverse effects on the digestive tract. The hypoglycemic effect of DPP-4 inhibitors was observed in clinical treatment studies in T2DM: results showed that the inhibitors reduced glycated hemoglobin A1c (HbA1c) by between 0.4% and 0.9%.4–13 However, in clinical application, it has been found that the therapeutic effect of sitagliptin in lowering glucose in patients with T2DM may vary from patient to patient. Studies have found that the hypoglycemic effect of dipeptidyl peptidase (DPP-4) inhibitors shows obvious individual differences.14,15 The hypoglycemic effect of sitagliptin can reduce more HbA1c in patients with high glycosylated hemoglobin (HbA1c) and insulin sensitivity index (HOMA-IR), or without metformin. Patients with lower baseline body mass were more likely to reduce HbA1c after treatment. Patients with high C-peptide, fasting blood glucose (FBG) and HbA1c, or without metformin decreased fasting blood glucose more significantly. Patients with low body mass, BMI, HOMA-IR and insulin levels, or without metformin or sulfonylurea, decreased postprandial blood glucose more significantly.16
Therefore, this study transcriptome sequencing was performed on patients with type 2 diabetes mellitus treated with different prognoses to explore the differential level genes of different hypoglycemic effects of sitagliptin.
Materials and Methods
Experimental Reagent
Nebnext ultra RNA library prep kit for Illumina was purchased from NEB, agency ampure XP from Beckman Coulter, Bioanalyzer 2100 RNA-6000 nano kit, Bioanalyzer 2100 DNA-1000 kit from agent, qubit RNA HS assay kit, qubit dsDNA br assay kit from Life Technologies, superscript II reverse transcriptase from Invitrogen, DEPC Agarose was purchased from Sangong Bioengineering (Shanghai), TransScript one step gDNA removal and cDNA synthesis Supermix, trans2k DNA marker and transzol up were purchased from all gold, and QuantiNova SYBR Green kit was purchased from Capgemini.
Study Grouping
Two Groups for the High-Throughput Sequencing of the Transcriptome
The significantly effective group (M) and the less effective group (N) each had three cases (M1–3, N1–3). Whole transcriptome sequencing was conducted, with a total of six samples from the two groups being sequenced in-depth, and then the data were compared and analyzed.
Validation of Messenger RNA Expression
With the completion of ribonucleic acid (RNA) sequencing, DEGs were screened from the results. Quantitative PCR was carried out for patients in the significantly effective group and the less effective group, with 20 cases in each group.
Transcriptome Sequencing
Study Subjects
A total of 6 gender- and age-matched patients aged between 30 and 40 years with newly diagnosed T2DM (within six months of diagnosis) were selected and treated with sitagliptin 100 mg orally once a day for 12 weeks. HbA1c levels before and after treatment were compared. Patients with an HbA1c reduction of less than 0.4% following treatment were assigned to the less effective group, and those with an HbA1c reduction of more than 0.9% were assigned to the significantly effective group. There were three patients in each group, two males and one females, and all the above patients were unrelated. High-throughput sequencing of the transcriptome was conducted in the six cases to detect the differential expression levels of genes in peripheral blood mononuclear cells.
Methods
PBMC Separation
3–5 mL of venous blood into anticoagulant tube, 4°C, 3000 rpm, centrifuge for 10 min, take supernatant and store it in 0.5mL/tube. Add the remaining blood cells to PBS to 5 mL, mix well, transfer to 15 mL centrifuge tube, add lymphocyte separation solution (manufacturer), separate PBMC samples according to the instructions of lymphocyte separation solution, and store them in −80 °C low-temperature environment for use.
RNA Extraction and Quality Control
Total RNA was extracted with TRLZOL from PBMC, and RNA degradation and contamination was monitored on 1% agarose gels. RNA purity was checked using the NanoPhotometer®spectrophotometer (IMPLEN, CA, USA). RNA concentration was measured using Qubit®RNA Assay Kit in Qubit®2.0 Fluorometer (Life Technologies, CA, USA). RNA integrity was assessed using the RNA Nano 6000 Assay Kit of the Agilent Bioanalyzer 2100 system (Agilent Technologies, CA, USA).
Library Preparation and Sequencing
A total amount of 1.5 μg RNA per sample was used as input material for the RNA sample preparations. Sequencing libraries were generated using NEBNext®UltraTMRNA Library Prep Kit for Illumina®(NEB, USA) following manufacturer’s recommendations. Finally, products were purified (AMPure XP system), and library quality was assessed on the Agilent Bioanalyzer 2100 system. The clustering of the index-coded samples was performed on a cBot Cluster Generation System using HiSeq 4000 PE Cluster Kit (Illumina) according to the manufacturer’s instructions. After cluster generation, the library preparations were sequenced on an Illumina HiSeq 4000 platform, and 150 bp paired-end reads were generated.
Bioinformatic Analysis
Quality Control and Mapping
Raw data (raw reads) were processed using NGS QC Toolkit. The reads containing ploy-N and the low-quality reads were removed to obtain the clean reads. Then, the clean reads were mapped to Ensembl GRCh38 transcripts annotation using Tophat. Analysis of differentially expression genes (DEGs), cluster analysis, GO and KEGG enrichment FPKM value of each gene was calculated using cufflinks, and the read counts of each gene were obtained by htseq-count. DEGs were identified using the DESeq functions estimate Size Factors and nbinom Test. Log2 fold change ≥1 or ≤−1 and p-value <0.05 was set as the threshold for significantly differential expression. Hierarchical cluster analysis of DEGs was performed to explore genes expression pattern. GO enrichment and KEGG pathway enrichment analysis of DEGs were, respectively, performed using R based on the hypergeometric distribution.
q-PCR Verification
Targeting the differentially expressed genes (DEGs), a total of 40 cases of newly diagnosed T2DM patients matched for gender and age were selected. Again, those with an HbA1c reduction of less than 0.4% after treatment were assigned to the less effective group, and those with an HbA1c reduction of more than 0.9% were assigned to the significantly effective group. There were 20 cases in each group. The candidate DEGs were validated by reverse transcription-polymerase chain reaction (RT-PCR) with an expanded sample size to screen for DEGs influencing the efficacy of sitagliptin in lowering blood glucose. Fluorescence quantitative procedure: pre-denaturation, 95°C, 2 min, once; Denaturation, 95°C, 5 sec, 40 cycles; Annealing/elongation, 60°C, 30 sec. See Table 1 for primer sequence.
 |
Table 1 Primer Sequences |
Statistical Analysis of Data
All data were expressed as the mean ± standard deviation ( ). The SPSS19.0 software was used for statistical analysis of the messenger RNA levels in each genome for each group. The Student’s t-test was used for data that satisfied the normal distribution, and P < 0.05 was considered statistically significant. The rank sum test was used for data that did not satisfy the normal distribution, and P < 0.05 was considered statistically significant.
Results
Results of Transcriptome Sequencing
Transcriptome sequencing was conducted in 6 samples and the results were as follows:
Gene Expression Analysis
By calculating and analyzing gene expression in the two groups of samples, and using data from patients in the less effective group as a control. According to the screening conditions of differentially expressed genes (log2 fold change ≥1 or ≤-1 and p-value <0.05), 922 DEGs were finally obtained, of which 481 were up-regulated (log2 fold change ≥1 and p-value <0.05) and 441 were down-regulated (log2 fold change ≤ −1 and p-value < 0.05) (see Figure 1).
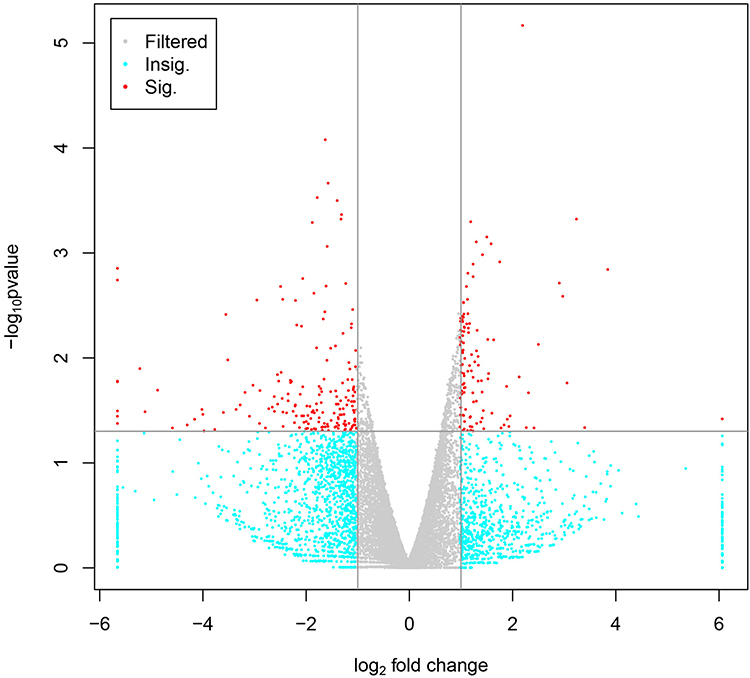 |
Figure 1 The volcano diagram of differential expression. Notes: The differences in the results from the comparison were reflected in the volcano diagram, with the gray and blue corresponding to non-significantly differential expression genes and red corresponding to significantly differential expression genes. The horizontal axis demonstrated the log2 Fold-Change, and the direction of the vertical axis demonstrated the log10 P. |
Cluster Analysis
In order to visually display the expression of each gene on each sample and the difference of gene expression after different groups, we performed unsupervised hierarchical cluster analysis on the gene expression (Figure 2). The ordinate represents each differentially expressed gene, the abscissa represents each sample, red represents high expression and green represents low expression. The upper and right evolutionary tree-like structures represent the results of cluster analysis.
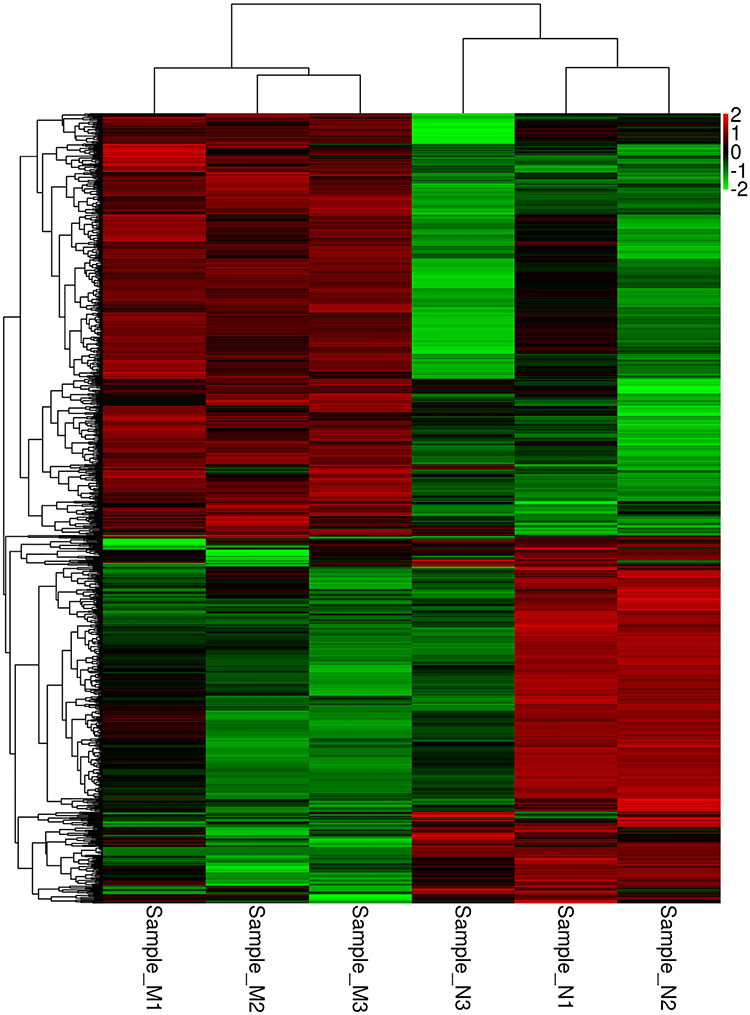 |
Figure 2 The cluster diagram of differential expression. Notes: Red represented for the high-expression transcripts, green for the low-expression transcripts. |
Functional Annotation and Enrichment Analysis
This analysis focused on the alignment of the information from the DEGs to the gene ontology (GO), clusters of orthologous groups (COG), and the Kyoto Encyclopedia of Genes and Genomes (KEGG) databases for functional annotation and enrichment analysis. A total of 2526 annotation results were obtained with 2406 in the GO database, 796 in the COG database, and 1547 in the KEGG database (see Figure 3).
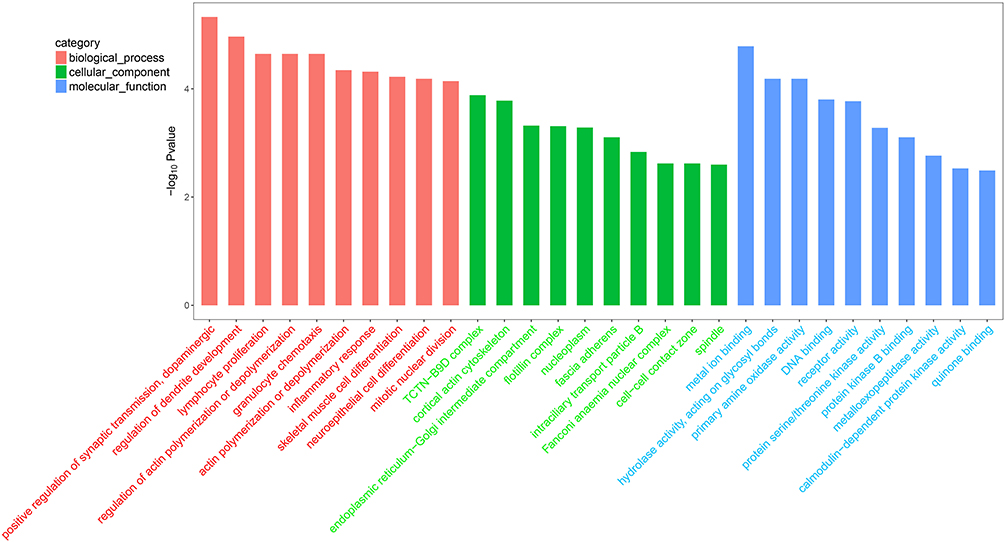 |
Figure 3 Functional annotation and enrichment analysis. |
Results of KEGG Annotation
In the present study, a total of 1547 DEGs were matched to the KEGG database, and the more enriched pathways were as follows: pathways in cancer, the phosphatidylinositol 3-kinase (PI3K) signaling pathway, the mitogen-activated protein kinase (MAPK) signaling pathway, the human T-cell lymphotropic virus type 1 infection pathway, the Rap1 signaling pathway, and the proteoglycans in cancer pathway (see Figure 4).
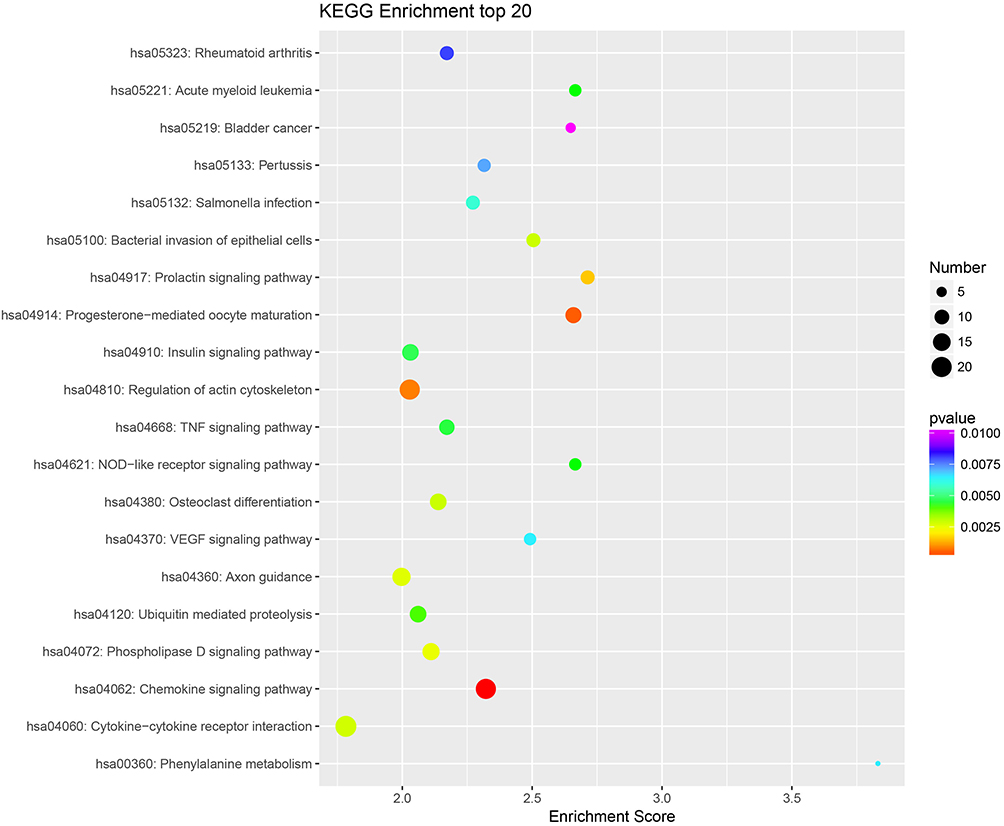 |
Figure 4 The results of KEGG annotation. |
Screening of DEGs
Through the search of signaling pathways related to T2DM, the online Mendelian inheritance in man disease-related database, together with the targets and pathways involved in the action of sitagliptin, the top-ranked pathways in the KEGG signaling pathway were screened, and the following genes were screened for subsequent validation based on the location of the DEGs in the pathway, the nodes in which they were located, and the differential fold of gene expression, etc. (see Table 2).
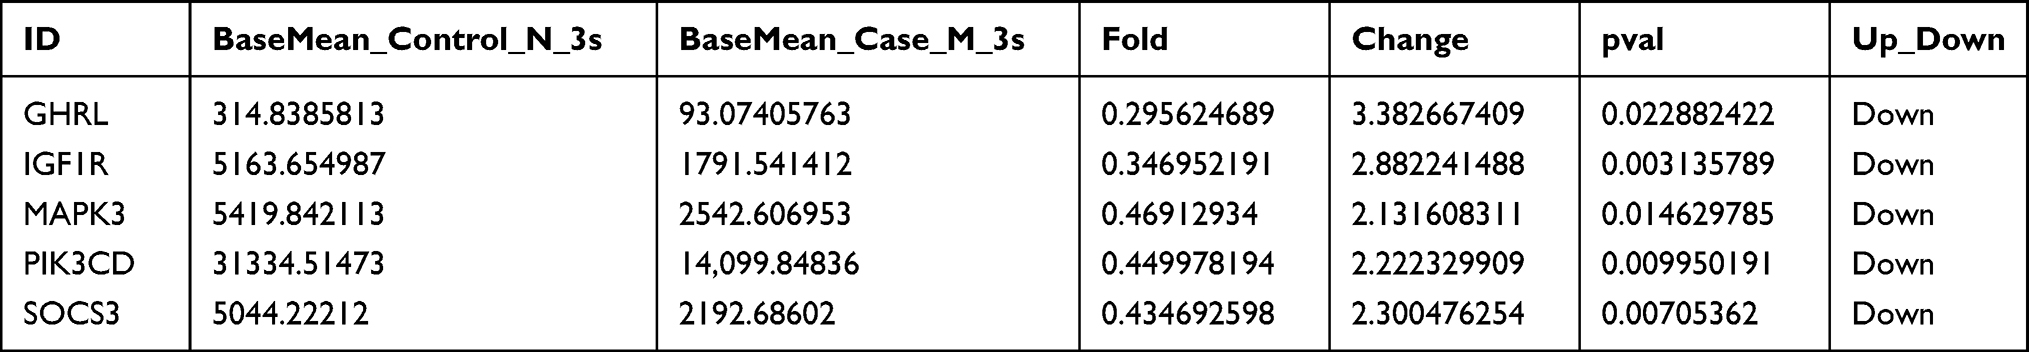 |
Table 2 The Results of Screening of the Differentially Expressed Genes |
Validation Results of Messenger RNA Expression
Electropherogram of PCR Product (See Figure 5)
Statistic Results of RT-PCR Data (See Table 3)
There was no difference in expression of the ghrelin gene (GHRL) when compared with the less effective group. Expression of insulin-like growth factor-1 receptor (IGF1R) was signifificantly increased in the signifificantly effective group as compared with the less effective group. Expression of mitogen-activated protein kinase-3 (MAPK3) and the suppressor of cytokine signaling-3(SOCS3) was signifificantly reduced in the signifificantly effective group as compared with the less effective group. The expression of phosphatidylinositol-4,5-bisphosphonate 3-kinase, catalytic subunit delta (PIK3CD) was reduced in the significantly effective group as compared with the less effective group, although this difference was not statistically significant.
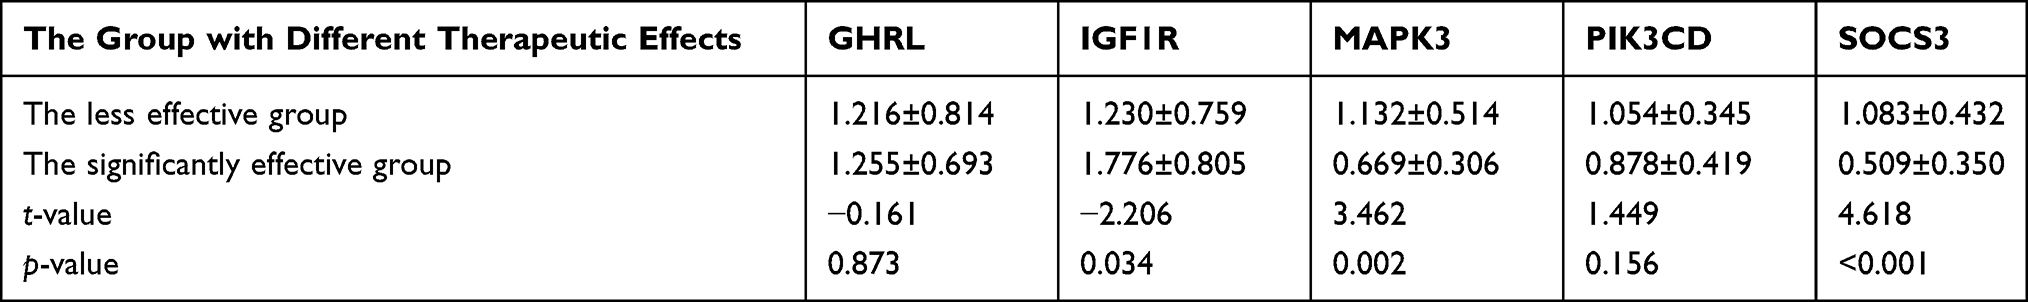 |
Table 3 The mRNA Expression Analysis in the Validation of Candidate Genes ( |

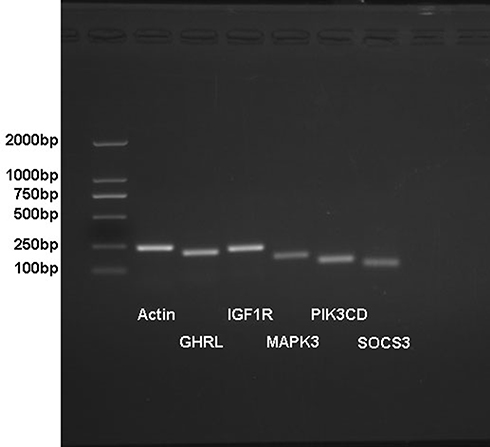 |
Figure 5 The electropherogram of PCR primer identification. Notes: The sizes of the PCR product of the tested genes GHRL, IGF1R, MAPK3, PIK3CD, SOCS3 and the internal reference gene actin were identified separately in the figure. The product sizes in the figure correspond to the fragment lengths of the tested genes with a single product band. |
Discussion
Studies have shown that there will be individual differences in the hypoglycemic efficacy of sitagliptin, while the current studies mostly analyze the correlation between the hypoglycemic efficacy of sitagliptin and HbA1c, HOMA-IR, blood glucose level, insulin level and body mass, and do not further explore the reasons for the differences in the hypoglycemic efficacy of sitagliptin from the Perspective of molecular biology.16
In this study, we performed genome-wide transcriptome sequencing and qPCR validation in patients with type 2 diabetes mellitus (hypoglycemic effect and hypoglycemic effect) with different Sig Leo Dean hypoglycemic effects. The results suggest that there are DEGs in patients with different hypoglycemic effects after 12 weeks of treatment with sitagliptin, which is manifested in the significant increase in the gene expression level of IGF1R and decrease of MAPK3 gene and SOCS3. In this study, high-throughput sequencing of the transcriptome was used for cases with significant and poor hypoglycemic effect following 12 weeks of treatment with sitagliptin. Then, the sequencing results were compared with the GO, COG, and KEGG databases for further interpretation and analysis. After the relevant genes were obtained, analysis was conducted in combination with the targets of sitagliptin action and the pathways involved along with the metabolic pathways related to T2DM. The positions of the key nodes of the genes in the metabolic pathways of DM and insulin resistance (IR) were then linked, and the DEGs were selected comprehensively. For further validation, the sample size was expanded, and RT-PCR validation of the relevant genes was conducted. Three candidate DEGs that demonstrated statistically significant differences were identified among the alternative genes.
The IGF1R gene encodes a protein that is a member of a family of proteins that mediate growth and development and is similar in function and structure to insulin. The IGF1R gene defect is a cause of IGF1 deficiency.17 However, there are few studies on the correlation between IGF1R and T2DM and it is not possible to investigate the specific underlying mechanism.
In this study, the expression of the IGF1R gene was significantly increased in the significantly effective group following sitagliptin therapy. Combined with known studies, it was considered that IGF1R might affect glucose metabolism by influencing the level of IGF1, but the exact mechanism requires further investigation.
The biological effects of insulin are influenced by the MAPK pathway, and this plays an important regulatory role in the process of cell differentiation and proliferation promoted by insulin. The results of related studies show that insulin binds to insulin receptors on the cytosolic membrane of target cells and, based on a certain cascade reaction, induces the activation of downstream signaling molecules, thus regulating insulin. Among them, insulin receptor substrate-1 (IRS-1) can effectively activate the extracellular regulated protein kinases(ERK) pathway, while IRS-2 is mainly involved in regulating the PI3K pathway.18 IRS-1 and IR are closely correlated and there is an increasing number of studies investigating this relationship. However, the mechanism of IR remains unclear and previous studies have focused on target cells, such as skeletal muscle cells19 and adipocytes.20 In this study, following 12 weeks of sitagliptin therapy, the DEGs in the significantly effective group and the less effective group were compared. It was found that gene expression of MAPK3 was significantly reduced in the significantly effective group. Previous studies have also suggested a role for the abnormal activation of the MAPK pathway in IR. The results of this study suggest that in the significantly effective group, sitagliptin might be effective in lowering blood glucose by down-regulating the expression of MAPK and reducing IR through the action of the MAPK pathway.
It has also been suggested that SOCS3 is a bridge between cell function and insulin signaling at the molecular level.21 It has been shown that a short-term high-fat diet leads to IR in rats and that lowering the expression of this gene reduces the degree of IR.22 SOCS3 is found to inhibit IR by down-regulating the IRS protein.23 Studies also suggest that SOCS3 effectively and competitively inhibits the tyrosine phosphorylation of IRS-1, thus preventing binding to subunit p85, which also triggers IR.24 The results of studies conducted by some researchers showed that SOCS3 expression and inflammation levels in monocytes, together with elevated levels of IR indicators, were significantly higher in obese patients than in normal subjects.25 The results of an experimental study also showed that increased levels of SOCS3 have a facilitative effect on the degradation of IRS-1, and this may lead to IR.26 It was found that SOCS3 expression was elevated in IR and also under conditions such as inflammation. In this study, after 12 weeks of sitagliptin therapy, the gene expression of SOCS3 was significantly reduced in the significantly effective group. This indicates that sitagliptin might exert its hypoglycemic effects by down-regulating the expression of SOCS3, reducing IR, and increasing the action of insulin. However, the detailed mechanism still needs to be further elucidated. Our study found that patients with different hypoglycemic efficacy of sitagliptin have different levels of genes, suggesting that the difference in hypoglycemic efficacy of sitagliptin may be related to the activation or inhibition of the signal pathway of related genes. The specific relationship and possible mechanism need to be further explored in the follow-up research.
Conclusion
After 12 weeks of sitagliptin therapy, when comparing the significantly effective group and the less effective group, the gene expression of IGF1R was significantly increased, the gene expression of MAPK3 was significantly reduced, and the gene expression of SOCS3 was significantly reduced.
Ethics Approval and Consent to Participate
The study was conducted in accordance with the Declaration of Helsinki (as was revised in 2013). The study was approved by the Ethics Committee of the First Affiliated Hospital of Xinjiang Medical University (K-202106-05). Written informed consent was obtained from all participants.
Acknowledgments
We are particularly grateful to all the people who have given us help with our article.
Funding
There is no funding to report.
Disclosure
The authors declare that they have no competing interests.
References
1. Tahrani AA, Piya MK, Kennedy A, Barnett AH. Glycaemic control in type 2 diabetes: targets and new therapies. Pharmacol Ther. 2010;125(2):328–361. doi:10.1016/j.pharmthera.2009.11.001
2. Lu JM. Based on the consensus of clinical application of glucagon-like peptide 1 hypoglycemic drugs. Chin J Diabetes. 2014;6(01):14–20.
3. Scott LJ. Sitagliptin: a review in type 2 diabetes. Drugs. 2017;77(2):209–224. doi:10.1007/s40265-016-0686-9
4. Ji L, Han P, Wang X, et al. Randomized clinical trial of the safety and efficacy of sitagliptin and metformin co-administered to Chinese patients with type 2 diabetes mellitus. J Diabetes Investig. 2016;7(5):727–736. doi:10.1111/jdi.12511
5. Ji L, Li L, Kuang J, et al. Efficacy and safety of fixed-dose combination therapy, alogliptin plus metformin, in Asian patients with type 2 diabetes: a Phase 3 trial. Diabetes Obes Metab. 2017;19(5):754–758. doi:10.1111/dom.12875
6. Mohan V, Yang W, Son HY, et al. Efficacy and safety of sitagliptin in the treatment of patients with type 2 diabetes in China, India, and Korea. Diabetes Res Clin Pract. 2009;83(1):106–116. doi:10.1016/j.diabres.2008.10.009
7. Pan CY, Yang W, Tou C, Gause-Nilsson I, Zhao J. Efficacy and safety of saxagliptin in drug-naïve Asian patients with type 2 diabetes mellitus: a randomized controlled trial. Diabetes Metab Res Rev. 2012;28(3):268–275. doi:10.1002/dmrr.1306
8. Wu W, Li Y, Chen X, et al. Effect of linagliptin on glycemic control in Chinese patients with newly-diagnosed, drug-naïve type 2 diabetes mellitus: a randomized controlled trial. Med Sci Monit. 2015;21:2678–2684. doi:10.12659/MSM.894026
9. Pan C, Han P, Ji Q, et al. Efficacy and safety of alogliptin in patients with type 2 diabetes mellitus: a multicentre randomized double-blind placebo-controlled phase 3 study in mainland China, Taiwan, and Hong Kong. J Diabetes. 2017;9(4):386–395. doi:10.1111/1753-0407.12425
10. Ba J, Han P, Yuan G, et al. Randomized trial assessing the safety and efficacy of sitagliptin in Chinese patients with type 2 diabetes mellitus inadequately controlled on sulfonylurea alone or combined with metformin. J Diabetes. 2017;9(7):667–676. doi:10.1111/1753-0407.12456
11. Wang W, Ning G, Ma J, et al. A randomized clinical trial of the safety and efficacy of sitagliptin in patients with type 2 diabetes mellitus inadequately controlled by acarbose alone. Curr Med Res Opin. 2017;33(4):693–699. doi:10.1080/03007995.2016.1277200
12. Yang W, Guan Y, Shentu Y, et al. The addition of sitagliptin to ongoing metformin therapy significantly improves glycemic control in Chinese patients with type 2 diabetes. J Diabetes. 2012;4(3):227–237. doi:10.1111/j.1753-0407.2012.00213.x
13. Yang W, Pan CY, Tou C, Zhao J, Gause-Nilsson I. Efficacy and safety of saxagliptin added to metformin in Asian people with type 2 diabetes mellitus: a randomized controlled trial. Diabetes Res Clin Pract. 2011;94(2):217–224. doi:10.1016/j.diabres.2011.07.035
14. Kim YG, Hahn S, Oh TJ, Kwak SH, Park KS, Cho YM. Differences in the glucose-lowering efficacy of dipeptidyl peptidase-4 inhibitors between Asians and non-Asians: a systematic review and meta-analysis. Diabetologia. 2013;56(4):696–708. doi:10.1007/s00125-012-2827-3
15. Nomiyama T, Akehi Y, Takenoshita H, et al. Contributing factors related to efficacy of the dipeptidyl peptidase-4 inhibitor sitagliptin in Japanese patients with type 2 diabetes. Diabetes Res Clin Pract. 2012;95(2):e27–e28. doi:10.1016/j.diabres.2011.08.016
16. Liao Y, Wu XW, Feng LL, et al. A research method for the influencing factors of the efficacy of sitagliptin: study group mean value extraction and statistical inference. Chin J Hosp Pharm. 2019;39(06):570–576. Chinese.
17. Bonora E, Kiechl S, Willeit J, et al. Prevalence of insulin resistance in metabolic disorders: the Bruneck Study. Diabetes. 1998;47(10):1643–1649.
18. Sekar N, Veldhuis JD. Concerted transcriptional activation of the low density lipoprotein receptor gene by insulin and luteinizing hormone in cultured porcine granulosa-luteal cells: possible convergence of protein kinase a, phosphatidylinositol 3-kinase, and mitogen-activated protein kinase signaling pathways. Endocrinology. 2001;142(7):2921–2928. doi:10.1210/endo.142.7.8287
19. Dunaif A, Wu X, Lee A, Diamanti-Kandarakis E. Defects in insulin receptor signaling in vivo in the polycystic ovary syndrome (PCOS). Am J Physiol Endocrinol Metab. 2001;281(2):E392–E399. doi:10.1152/ajpendo.2001.281.2.E392
20. Ciaraldi TP, el-Roeiy A, Madar Z, Reichart D, Olefsky JM, Yen SS. Cellular mechanisms of insulin resistance in polycystic ovarian syndrome. J Clin Endocrinol Metab. 1992;75(2):577–583. doi:10.1210/jcem.75.2.1322430
21. Li YX, Hong YZ. Mechanism and therapeutic progress of SOCS-3 in insulin resistance. China Modern Doctor. 2006;12(54):163–168.
22. Wang NH, Guo XH. SOCS-3 and insulin resistance. Int J Endocrinol Metab. 2005;06:409–411.
23. Ueki K, Kondo T, Kahn CR. Suppressor of cytokine signaling 1 (SOCS-1) and SOCS-3 cause insulin resistance through inhibition of tyrosine phosphorylation of insulin receptor substrate proteins by discrete mechanisms. Mol Cell Biol. 2004;24(12):5434–5446. doi:10.1128/MCB.24.12.5434-5446.2004
24. Jiang Y, Zhang Q, Soderland C, Steinle JJ. TNFα and SOCS3 regulate IRS-1 to increase retinal endothelial cell apoptosis. Cell Signal. 2012;24(5):1086–1092. doi:10.1016/j.cellsig.2012.01.003
25. Lebrun P, Cognard E, Bellon-Paul R, et al. Constitutive expression of suppressor of cytokine signalling-3 in skeletal muscle leads to reduced mobility and overweight in mice. Diabetologia. 2009;52(10):2201–2212. doi:10.1007/s00125-009-1474-9
26. Stern MP. Diabetes and cardiovascular disease. The “common soil” hypothesis. Diabetes. 1995;44(4):369–374. doi:10.2337/diab.44.4.369
 © 2022 The Author(s). This work is published and licensed by Dove Medical Press Limited. The
full terms of this license are available at https://www.dovepress.com/terms
and incorporate the Creative Commons Attribution
- Non Commercial (unported, 3.0) License.
By accessing the work you hereby accept the Terms. Non-commercial uses of the work are permitted
without any further permission from Dove Medical Press Limited, provided the work is properly
attributed. For permission for commercial use of this work, please see paragraphs 4.2 and 5 of our Terms.
© 2022 The Author(s). This work is published and licensed by Dove Medical Press Limited. The
full terms of this license are available at https://www.dovepress.com/terms
and incorporate the Creative Commons Attribution
- Non Commercial (unported, 3.0) License.
By accessing the work you hereby accept the Terms. Non-commercial uses of the work are permitted
without any further permission from Dove Medical Press Limited, provided the work is properly
attributed. For permission for commercial use of this work, please see paragraphs 4.2 and 5 of our Terms.