")
Back to Journals » Pharmacogenomics and Personalized Medicine » Volume 16
Genome-Wide Identification of lncRNA and mRNA for Diagnosing Type 2 Diabetes in Saudi Arabia
Authors Albogami S
Received 24 July 2023
Accepted for publication 6 September 2023
Published 15 September 2023 Volume 2023:16 Pages 859—882
DOI https://doi.org/10.2147/PGPM.S427977
Checked for plagiarism Yes
Review by Single anonymous peer review
Peer reviewer comments 2
Editor who approved publication: Dr Martin H Bluth
Sarah Albogami
Department of Biotechnology, College of Science, Taif University, Taif, 21944, Saudi Arabia
Correspondence: Sarah Albogami, Department of Biotechnology, College of Science, Taif University, P.O. Box 11099, Taif, 21944, Saudi Arabia, Email [email protected]
Purpose: According to the World Health Organization, Saudi Arabia ranks seventh worldwide in the number of patients with diabetes mellitus. To our knowledge, no research has addressed the potential of noncoding RNA as a diagnostic and/or management biomarker for patients with type 2 diabetes mellitus (T2DM) living in high-altitude areas. This study aimed to identify molecular biomarkers influencing patients with T2DM living in high-altitude areas by analyzing lncRNA and mRNA.
Patients and Methods: RNA sequencing and bioinformatics analyses were used to identify significantly expressed lncRNAs and mRNAs in T2DM and healthy control groups. Coding potential was analyzed using coding–noncoding indices, the coding potential calculator, and PFAM, and the lncRNA function was predicted using Pearson’s correlation. Differentially expressed transcripts between the groups were identified, and Gene Ontology and Kyoto Encyclopedia of Genes and Genomes enrichment analyses were performed to identify the biological functions of both lncRNAs and mRNAs.
Results: We assembled 1766 lncRNAs in the T2DM group, of which 582 were novel. This study identified three lncRNA target genes (KLF2, CREBBP, and REL) and seven mRNAs (PIK3CD, PIK3R5, IL6R, TYK2, ZAP70, LAMTOR4, and SSH2) significantly enriched in important pathways, playing a role in the progression of T2DM.
Conclusion: To the best of our knowledge, this comprehensive study is the first to explore the applicability of certain lncRNAs as diagnostic or management biomarkers for T2DM in females in Taif City, Saudi Arabia through the genome-wide identification of lncRNA and mRNA profiling using RNA seq and bioinformatics analysis. Our findings could help in the early diagnosis of T2DM and in designing effective therapeutic targets.
Keywords: T2DM, long noncoding RNA, high altitude, bioinformatic analyses
Introduction
Taif Governorate is located at an altitude of over 1800 m above sea level and has recently experienced an improvement in the quality of life, reflected in the increase in employment opportunities and tourism activities.1 At this altitude, oxygen levels are low and atmospheric pressure is decreased.2 Living at high altitudes is stressful due to susceptibility to hypoxia, an extreme form of altitude sickness.3 People living at high altitudes often have a strong, long-evolved response to hypoxic conditions; this is evident in indigenous populations that have adapted several molecular, cellular, and systemic responses to tolerate hypoxia at high altitudes.4 Various physiological responses, including increased heart and respiratory rates and red blood cell production, exist at the systemic level.5 Increased red blood cell mass and hemoglobin content in the blood are thought to be induced by gene regulation.6 Metabolic studies have found a shift in expression patterns that can provide an increased energy supply for the cells in the absence of aerobiosis (and exhibit less demand for ATP).7 This evidence and other physiological responses constitute examples of altitude adaptation.8 Usually, adaptations are considered genetic alterations that cause a particular physiological trait to develop, a phenomenon known as adaptive plasticity.9 However, not everyone responds in this way. Some individuals reportedly develop adaptive responses, but others, particularly those with chronic diseases like diabetes, experience complications due to living in such locations.8 There has been a significant increase in the prevalence of diabetes in high-altitude populations because of urbanization and rapid changes in diets and lifestyles.10–13 The global and fast expanding diabetes epidemic is likely to become the primary cause of mortality and disability in the future due to the ageing of the population and lifestyle shifts.14 The International Diabetes Federation estimates that 450 million people aged 18 and above suffer from diabetes, and this number is expected to increase to approximately 690 million by 2045.15 Notably, the World Health Organization (WHO) has identified Saudi Arabia as having the second-highest incidence of diabetes in the Middle East and the seventh-highest worldwide. Approximately 10 million people in the country have diabetes or are prediabetic.16
Type 2 diabetes mellitus (T2DM) is the most prevalent form of diabetes17 and tends to result from genetic, environmental, immunological, and lifestyle factors.18,19 T2DM is a progressive, chronic disorder whose symptoms advance over time. T2DM is characterized by low insulin sensitivity and defective insulin secretion. High blood glucose levels may also increase the risk of retinopathy, nephropathy, neuropathy, and cardiomyopathy.17 Early stages of the illness can go undiagnosed, causing symptoms or complications that are not detected until later stages.20 Approximately half of the people living with diabetes are estimated to be undiagnosed.15 If individuals can be accurately diagnosed early in the asymptomatic phase of the disease, they may benefit from early interventions, limiting the development of the disease and helping them manage their symptoms more effectively. Thus, there has been an increasing focus on finding reliable, responsive, and easily available diagnostics for diabetes. Family history is a significant risk factor for developing this disease; T2DM has a 4- to 6-fold elevated risk among relatives.21 Therefore, collecting the full family history of suspected patients is important. Furthermore, as many changes in insulin-responsive tissues are believed to underlie obesity, insulin resistance, and T2DM, it has become increasingly apparent that genetic and epigenetic markers in the blood can also play crucial roles in their respective pathologies.22–24 Therefore, new predictive biomarkers that can help diagnose diabetes at an early stage are needed, which may also aid in identifying new therapeutic targets.
Currently, genetic and genomic studies are being conducted for disease prevention and treatment.25 New genetic knowledge must be spread across the wide medical field, and the technical skills needed for disease genetic screening, diagnosis, and prevention should not be confined to research or specialist practice.26 Understanding the genetic basis of diseases requires an understanding of variation across the whole genome to determine overall influence. The current focus of clinical genomics is mainly on protein-coding genes; however, the noncoding genome is far larger than the protein-coding equivalent.27 The noncoding genome encompasses transcriptional, regulatory, and structural information, which needs to be integrated into genome annotations to optimize the use of genomic information in the healthcare system.28 According to genome-wide association studies, most diabetes-related genetic variations do not lie in protein-coding regions, making it difficult to identify functional variants.29 This highlights the importance of identifying and characterizing early noncoding RNA (ncRNA) biomarkers for T2DM management. Over the years, several classes of ncRNAs have been discovered.30 Almost all of these ncRNAs are commonly categorized as small ncRNAs (<200 nucleotides), consisting of microRNAs (miRNAs) and circular RNAs (circRNAs), and large ncRNAs, such as long ncRNAs (lncRNAs).31–33 lncRNA consists of transcripts with a size range from 200 nucleotides to 100 kilobase pair (kbp).34,35 lncRNAs are transcribed from either strand and classified as sense exonic lncRNAs, antisense exonic lncRNAs, intronic sense and antisense lncRNAs, and 3′- and 5′-UTR-associated RNAs based on their relationship with the neighboring protein-coding genes.36 lncRNAs generate a complex regulatory network by establishing links with transcription factors, transcriptional co-activators, and repressors, which can influence several aspects of transcription.37 Investigations on the effect of lncRNAs under different clinical and physiological conditions have been conducted.38–40
lncRNAs are implicated in the regulation of numerous biological reactions associated with health and disease.41 Research has demonstrated the importance of lncRNAs to inflammation,42 and the connection between different mediators of inflammation and T2DM has been determined.43,44 A cross-sectional cohort study showed that the serum neuregulin-4 level is substantially elevated in patients with T2DM compared to that in healthy controls.45 This suggests that neuregulin-4 level may serve as a biomarker for T2DM because euregulin-4 has potential anti-inflammatory properties. Furthermore, several other markers have been studied in T2DM. For example, T2DM complications, such as diabetic renal disease, could be diagnosed based on the uric acid to HDL ratio (UHR) because this ratio is connected to T2DM and inflammation.46 In T2DM, the UHR ratio is a robust predictor of metabolic syndrome.47 Another study found that uncontrolled hypertension is associated with an increased UHR ratio, which is linked to inflammation48 and fatty liver disease.49 Although inflammation plays a vital role in the development of T2DM and its related complications, hemogram parameters, including mean platelet volume, were regarded as a new inflammatory biomarker in obese patients with T2DM.50
As mentioned above, lnc-RNA is linked to inflammatory conditions and T2DM, as well as its associated conditions such as diabetic kidney disease. Additionally, hypertension, obesity, and fatty liver disease are associated with inflammation, so investigating lnc-RNA in diabetes is rational. However, no research has, to the best of our knowledge, expressly investigated the possible function of certain lncRNAs as diagnostic or management biomarkers for T2DM. In this study, we performed transcriptomic analyses to identify molecular biomarkers that influence patients with T2DM who live in high-altitude areas by analyzing noncoding regions (lncRNA) and protein-coding regions (mRNA) of the genome.
Materials and Methods
Ethics and Study Participants
This study was conducted in accordance with the Declaration of Helsinki. The study procedure was approved by the Taif University Research Ethical Committee, Taif, Saudi Arabia (NO.: 43–220). The aim and nature of the methods to be used in this study were discussed with the participants, and written informed consent was obtained from each participant. Two groups of participants living in the Taif region were enrolled—patients diagnosed with T2DM (five women; age: 27–56 years) and a healthy control group (four women; age: 29–57 years)—between January and March 2022. T2DM diagnoses were based on the 1999 WHO diabetes diagnostic criteria.51 None of the subjects had received hypoglycemic medication. Exclusion criteria for participants included a history of type 1 diabetes, pregnancy, cancer, and chronic or acute diabetic complications.
Blood Collection and RNA Extraction
Fresh blood (5 mL) was collected from each participant. Thereafter, 1.5 mL of the collected blood sample (with 4000–7000 leukocytes/µL) was processed immediately for total RNA extraction using a QIAamp RNA Blood Mini Kit (Qiagen, Hilden, Germany), following the manufacturer’s protocol. The integrity of the RNA was evaluated with an Agilent Bioanalyzer 2100 system (Agilent Technologies, Santa Clara, CA, USA), and its purity was determined using agarose gel electrophoresis and a NanoDrop2000 spectrophotometer (Thermo Fisher Scientific, Waltham, MA, USA). RNA samples with an RNA integrity number ≥8.0 were processed further.
Library Construction, Sequencing, and Mapping
Ribosomal RNA (rRNA) was removed from total RNA using an rRNA removal kit (Illumina, San Diego, CA, USA), following the manufacturer’s protocol. A KAPA Stranded RNA-Seq Library Preparation Kit (Illumina) was used to complete the RNA sequencing library following the manufacturer’s protocol. Qubit (Thermo Fisher Scientific) and real-time PCR were used to quantify the constructed library, and a bioanalyzer was used to identify the size distribution. Quantified libraries were sequenced on an Illumina HiSeq 2500 platform (Illumina). The annotation data for the reference genome and gene models were acquired directly from the Ensembl genome browser 106 (https://asia.ensembl.org/index.html). Using hierarchical indexing for spliced alignment of transcripts (HISAT 2; version 2.0.4), clean reads were mapped to the Homo sapiens genome (genome assembly: GRCh38.p13).52 Figure 1 illustrates the workflow of this study.
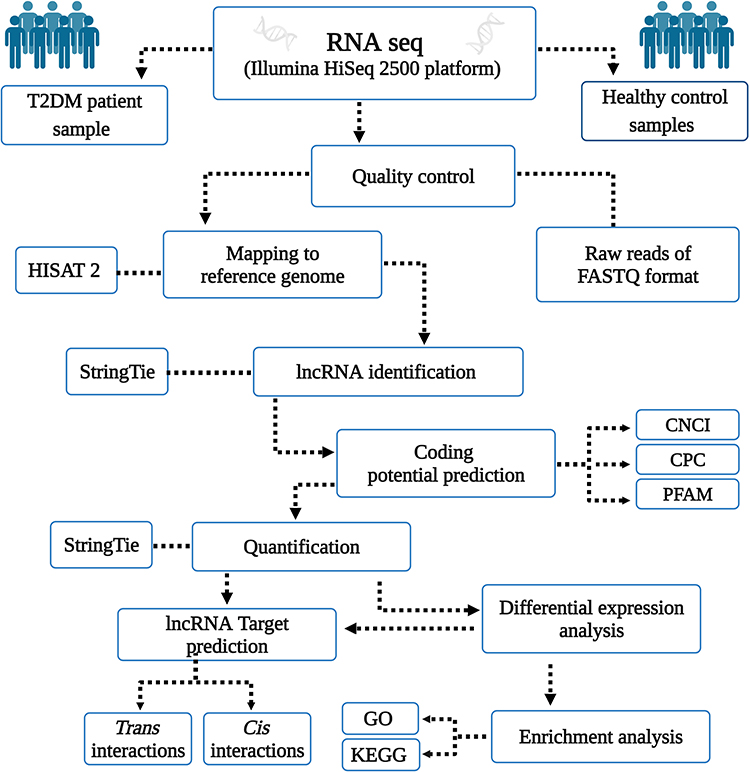 |
Figure 1 Workflow of lncRNA and mRNAs analysis for patients with T2DM versus healthy controls. Abbreviations: CNCI, coding-noncoding-index; CPC, coding potential calculator; PFAM, Pfam Scan database; GO, Gene Ontology; KEGG, Kyoto Encyclopedia of Genes and Genomes. |
lncRNA Identification
StringTie software (version 3.3.0) was utilized to assemble each sample’s mapped reads53 and run using the library-type option; all other parameters were left at their default values. Transcripts from all samples were merged using 2/cuffmerge. To find new protein-coding transcripts, the transcripts were examined for signs of protein-coding possibility and conserved sequences. Such transcripts were filtered out, and lncRNA candidates comprised those without coding potential.
Coding Potential Prediction
The coding-noncoding index (CNCI) software tool (version 2) was utilized to profile and differentiate protein-coding and noncoding sequences.54 The coding potential calculator algorithm (CPC) was used to assess the quantity and quality of the open reading frame in a transcript and search the sequences against a database of known protein sequences to distinguish between coding and noncoding transcripts. In our study, we gathered functional protein information using the UniProt Knowledgebase (https://www.uniprot.org /UniProtKB) and set the e-value to 1e−10. The Pfam Scan tool (version 1.3) was used to determine the presence of any known protein family domains listed in the Pfam database (release 27; Pfam A and Pfam B).55 Transcripts with a Pfam match were excluded in the following step.
lncRNA Function Prediction
A correlation analysis was performed using Pearson’s correlation to assess the possibility of co-expression between lncRNAs and mRNAs. An interaction between a lncRNA and an mRNA was considered significant when Pearson’s correlation value was ≥|0.70| and the P-value was <0.05. Two analyses were conducted on the total correlation matrix to determine and categorize the interactions and potential activities of lncRNAs (cis and trans) regarding their target gene. Cis-regulated genes are protein-coding genes co-expressed with a dysregulated lncRNA and located within 30 kb upstream or downstream of the same gene. Some lncRNAs trans-regulate the central transcription factors to engage specific cellular processes.
Differential Expression Analysis
Ballgown R package (version 2.4.2) was used to identify transcripts differentially expressed between the groups using the data from StringTie.56 Among any two groups, transcripts with a P-value <0.05 were classified as differentially expressed transcripts.
Comparative Analysis of mRNA Transcripts Differentially Expressed in T2DM with Genome-Wide Association Studies
To verify the functions of the 84 mRNA transcripts that exhibit differential expression in T2DM, the Type 2 Diabetes Knowledge Portal (https://t2d.hugeamp.org) was utilized. This portal contains a collection of genes that have been linked to T2DM and other glycemic traits, including HOMA-B, HbA1c, and fasting insulin adj BMI through various genome-wide association studies (GWAS).
Enrichment Analysis
GOseq R package (version 1.48.0) was used to implement Gene Ontology [GO; annotates genes to biological processes (BPs), molecular functions (MFs), and cellular components (CCs)] enrichment analysis of the differentially expressed genes (DEGs) or lncRNA target genes. GO terms with a P-value < 0.05 were deemed significantly enriched among DEGs.57 The Kyoto Encyclopedia of Genes and Genomes (KEGG) database (http://www.genome.jp/kegg/) was used to annotate genes to pathways.58
Statistical Analysis
GraphPad Prism (version 10.0.0) was used for statistical analyses. The results are presented as mean ± standard error. For all data, P < 0.05 indicated statistical significance. KOBAS R package (Version 3.0) was used to examine the statistical enrichment of DEGs or lncRNA target genes.59
Results
Several metrics, including the total number of reads, number of reads, error rate, number of reads mapped to the genome, and number of spliced and non-spliced reads, were used to evaluate the quality of the transcriptome data. The quality parameter findings between the groups are displayed in Table 1.
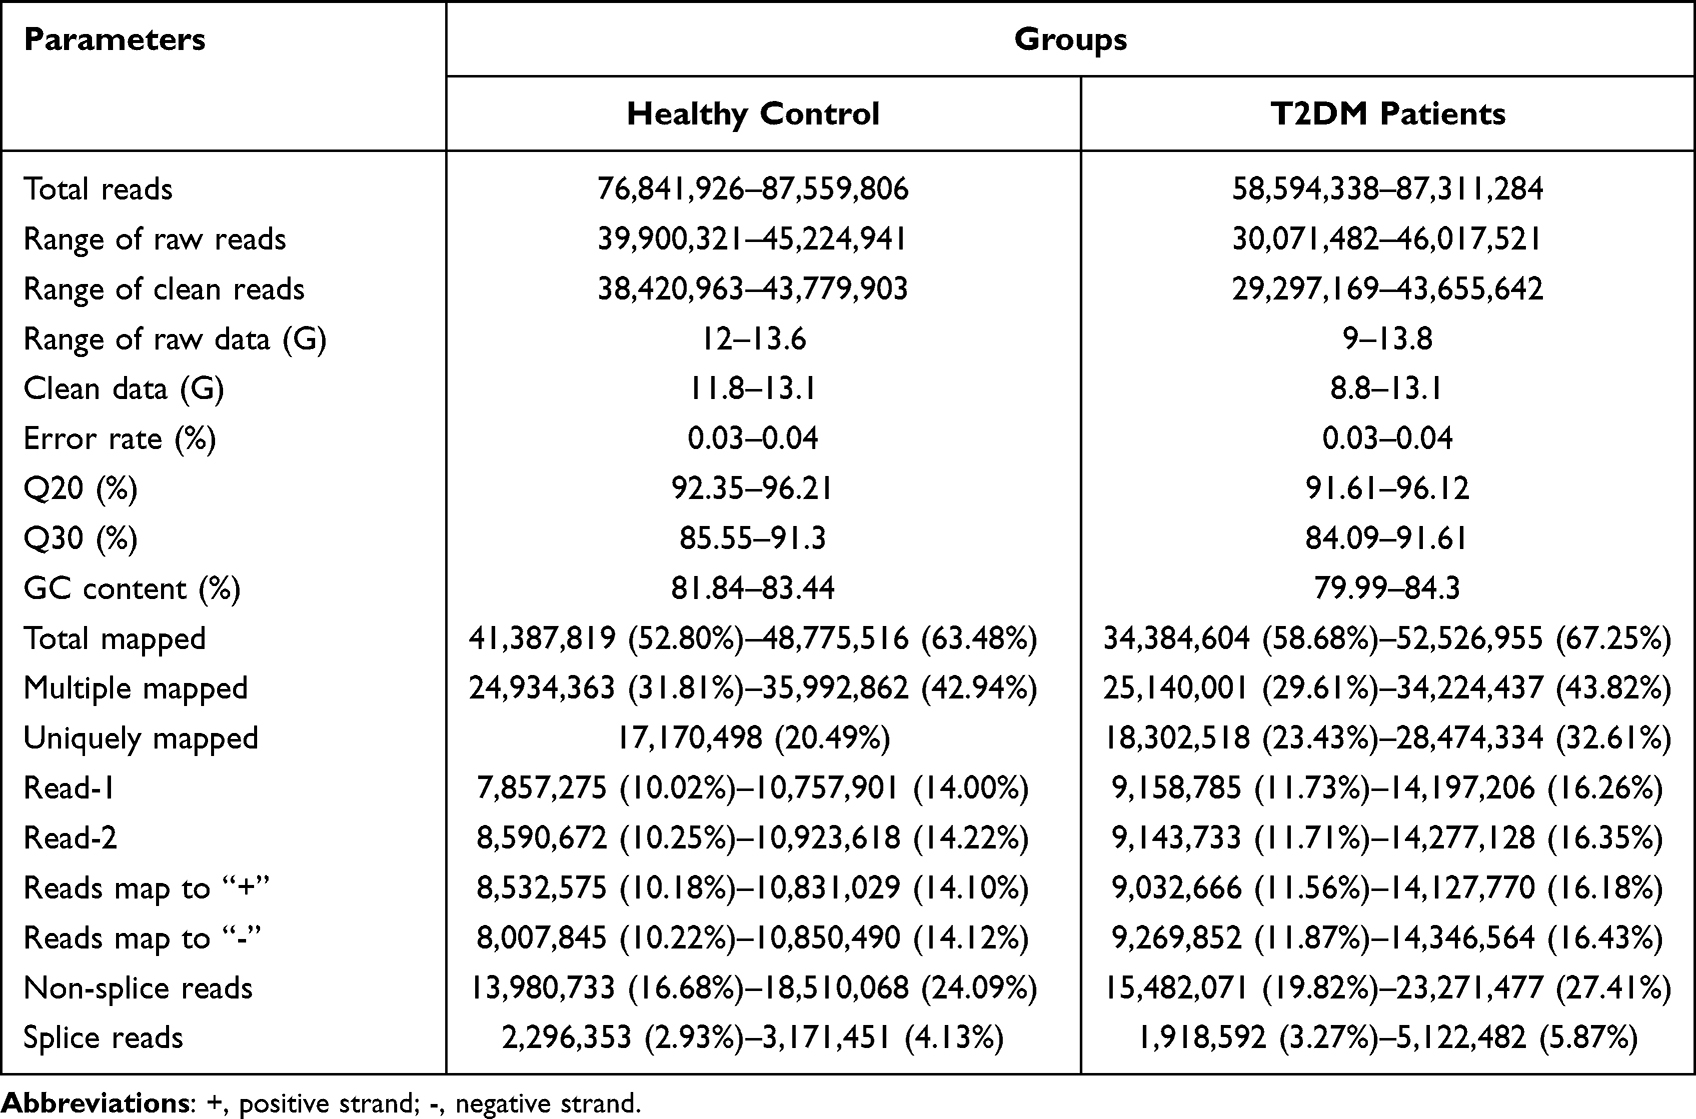 |
Table 1 Quality Parameter Information for Transcriptome Data for Both Patients with T2DM and Healthy Controls |
lncRNA Identification and Characterization
To demonstrate the differences in lncRNA profiles between patients with T2DM and healthy controls and to determine diabetes-related lncRNAs, RNA-seq was performed. The CNCI, CPC, and Pfam Scan database (PFAM) were used to exclude protein-coding transcripts and predict lncRNAs. Significantly expressed lncRNAs were identified using the overlapping results of these three approaches. Finally, 1766 lncRNAs were assembled using the three software, of which 582 were novel (Figure 2A). The lncRNAs were categorized based on their genomic location to simplify functional interpretation and undertake extensive analysis; this revealed that 637 (45.57%) of the lncRNAs were sense overlapping, 279 (19.96%) were long intergenic noncoding RNAs (lincRNA), 211 (15.09%) were sense intronic, 208 (14.88%) were antisense, and 63 (4.51%) were others (Figure 2B). The findings indicated that sense overlapping lncRNAs were the most abundant lncRNAs in the T2DM group.
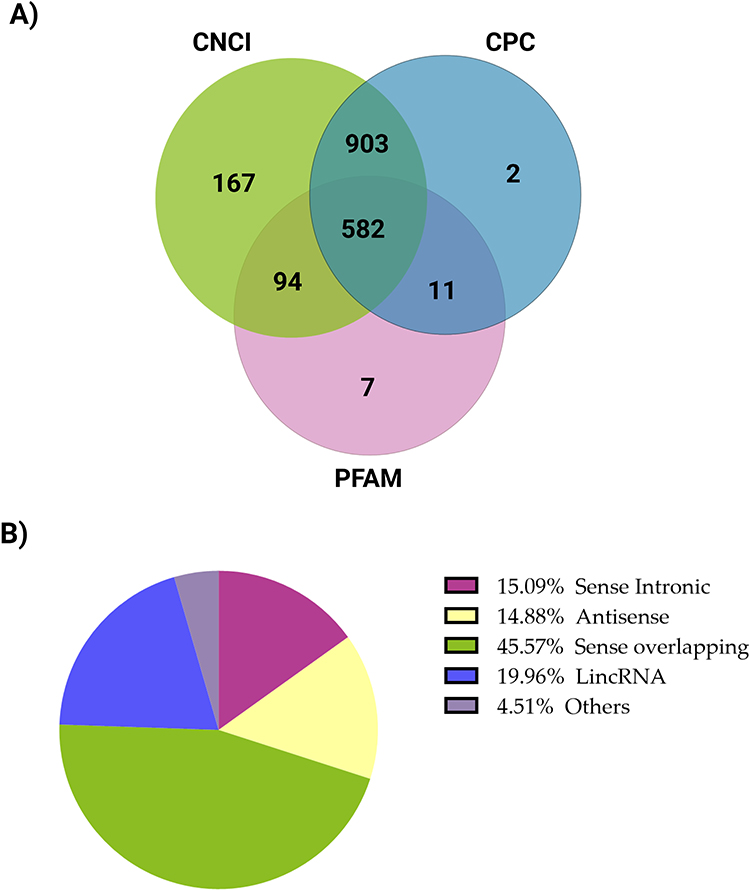 |
Figure 2 lncRNA transcriptome analysis in the T2DM group compared with the healthy control group. (A) Venn diagram representing predicted lncRNA findings using CNCI, CPC, and PFAM. The sum of the numbers in each large circle reflects the overall number of noncoding transcripts, and the portions of the circle that overlap represent the noncoding transcripts identified by all three methods. (B) A pie chart of lncRNA classification—sense overlapping, lincRNA (long intergenic noncoding RNA), sense intronic, antisense, and other distributions. Abbreviations: CNCI, coding-noncoding-index; CPC, coding potential calculator; PFAM, Pfam Scan database; T2DM, type 2 diabetes. |
Co-Expression of lncRNAs and mRNAs in Patients with T2DM vs Healthy Controls
A screen was performed for lncRNAs or mRNAs with significant expression (the default threshold of FPKM score was selected as 1), and the results were analyzed to generate Venn diagrams. The co-expressed lncRNAs and mRNAs were displayed in a Venn diagram separately (Figures 3A and B) to determine the total number of lncRNAs and mRNAs specifically expressed within and between the groups. The co-expression of lncRNAs and mRNAs between T2DM and healthy control groups provides insights into the influence of T2DM on the co-expression pattern. Figure 3A shows that 148 lncRNAs were uniquely expressed in patients with T2DM, 118 in healthy controls, and 191 in both groups. Furthermore, 467 mRNAs were exclusively expressed in patients with T2DM, 654 in healthy controls, and 658 in both groups (Figure 3B).
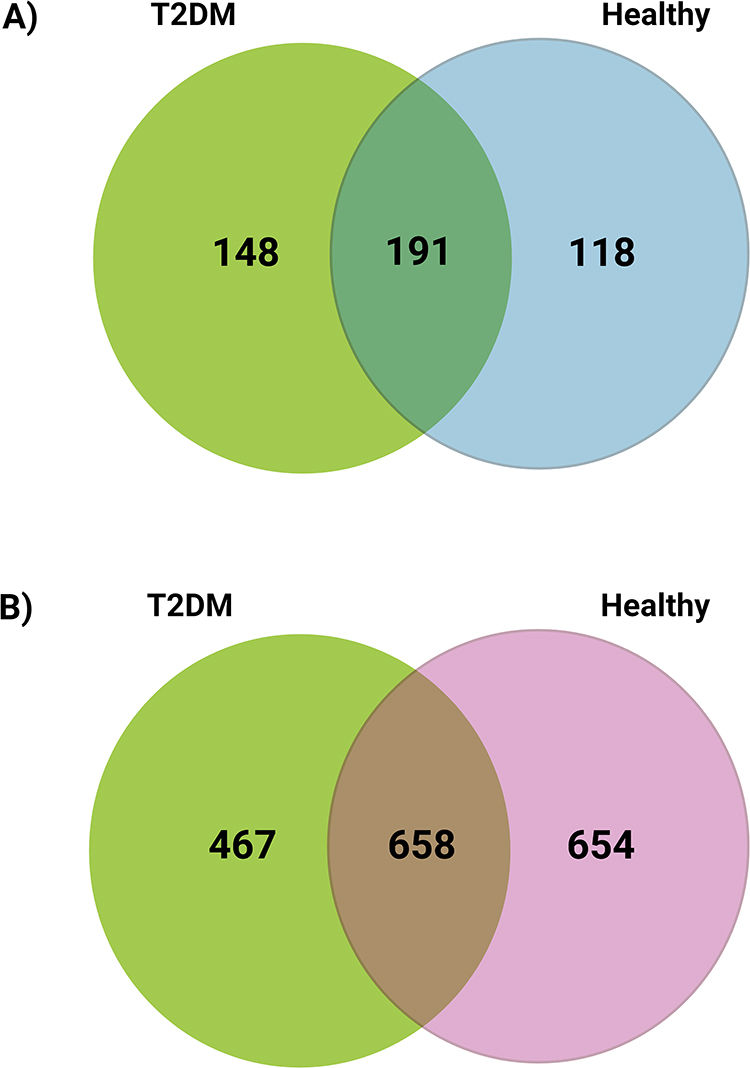 |
Figure 3 Venn Diagram of uniquely expressed and co-expressed lncRNAs and mRNAs in the T2DM and healthy control groups. Expression pattern of (A) lncRNAs and (B) mRNAs. Abbreviation: lncRNA, long noncoding RNA. |
lncRNA and mRNA Expression Profiles in Patients with T2DM vs Healthy Controls
The relative expression of lncRNAs and mRNAs was analyzed using high-throughput sequencing to explore possible correlations between alterations in lncRNAs and mRNAs and the development of T2DM. The results identified 582 lncRNAs and 2131 mRNAs in the T2DM group. We found that in the T2DM group, 22 lncRNA transcripts were differentially expressed, of which 10 (1.72%) were upregulated, 12 (2.06%) were downregulated, and 560 showed no difference (96.22%). Furthermore, 84 mRNA transcripts were significantly differentially expressed, of which 27 (1.27%) were upregulated, 57 (2.67) were downregulated, and 2048 showed no difference (96.06%). Transcripts were categorized as differentially expressed when the fold change in expression was more than 2.0 and P ˂ 0.05. Volcano plots and pie charts were used to compare the expression profiles of lncRNAs and mRNAs between the T2DM and healthy control groups (Figure 4A–D).
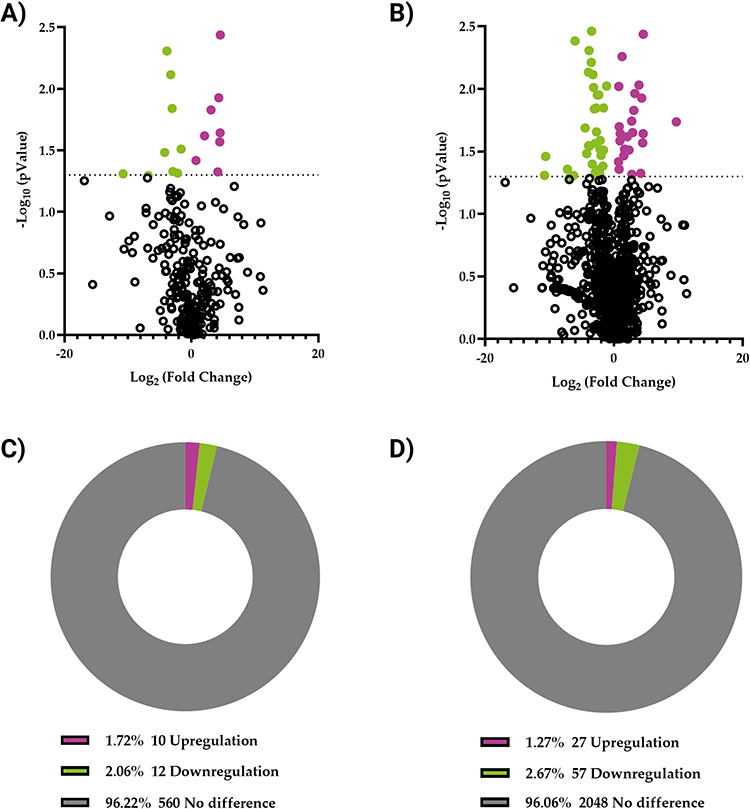 |
Figure 4 lncRNAs and mRNA expression profiles in T2DM and healthy control groups. Volcano plots clustering analysis of (A) lncRNAs and (B) mRNA. Pie charts represent the percentage of differentially expressed (C) lncRNAs and (D) mRNA. P < 0.05 was considered significant; expression changes are shown in the T2DM group compared with those in the healthy control group. Magenta represents genes whose expression has increased by >2 fold, while green represents genes whose expression has decreased by >2 fold. Abbreviations: T2DM, type 2 diabetes; lncRNA, long noncoding RNA; mRNA, messenger RNA. |
We demonstrated that the T2DM group had altered expression of lncRNAs and mRNAs compared with that of the healthy control group. The top 10 (5 upregulated and 5 downregulated) differentially expressed lncRNAs and mRNAs are shown in Table 2 and Table 3. Under varied experimental settings, cluster analysis was performed to identify genes with comparable expression patterns. A hierarchical clustering analysis was performed to identify the expression patterns of differentially expressed lncRNAs (22) and mRNA transcripts (84) in study groups by considering the FPKM. The clustering information from several experiments indicated that genes with the same gene expression patterns might have comparable roles or be involved in the same biological processes (Figure 5A and B). These findings suggest that differentially expressed lncRNAs and mRNAs are associated with T2DM development.
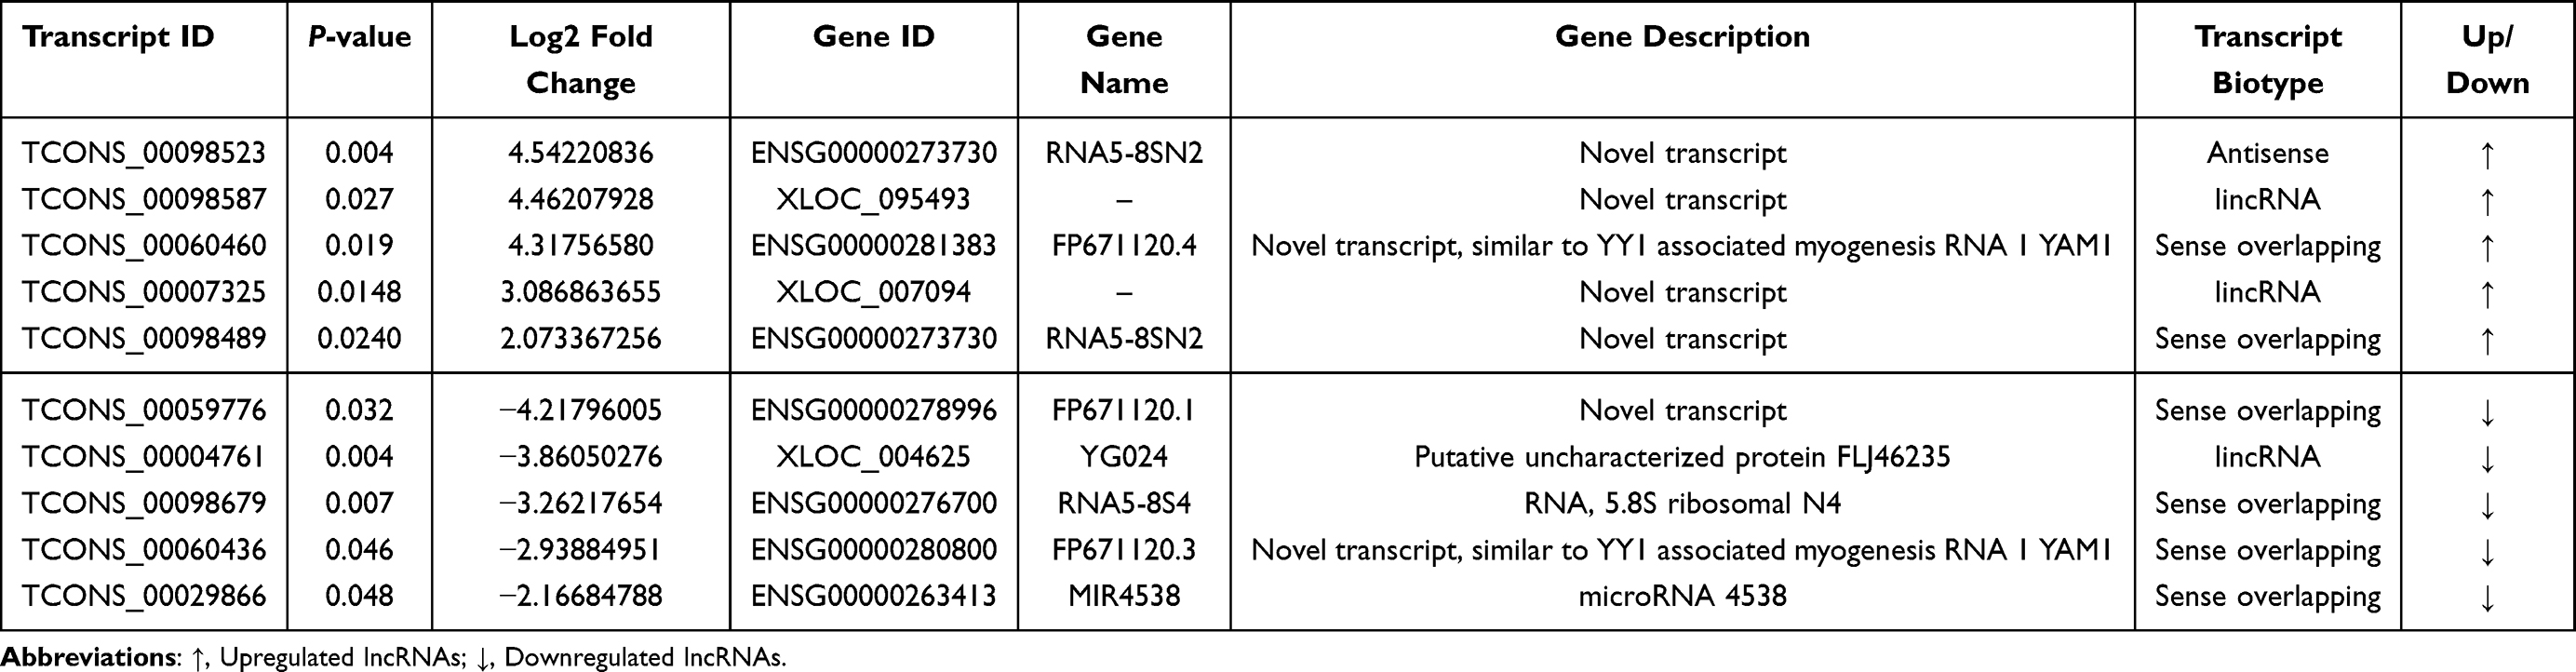 |
Table 2 Top 10 Differentially Expressed lncRNAs in the T2DM and Healthy Control Groups |
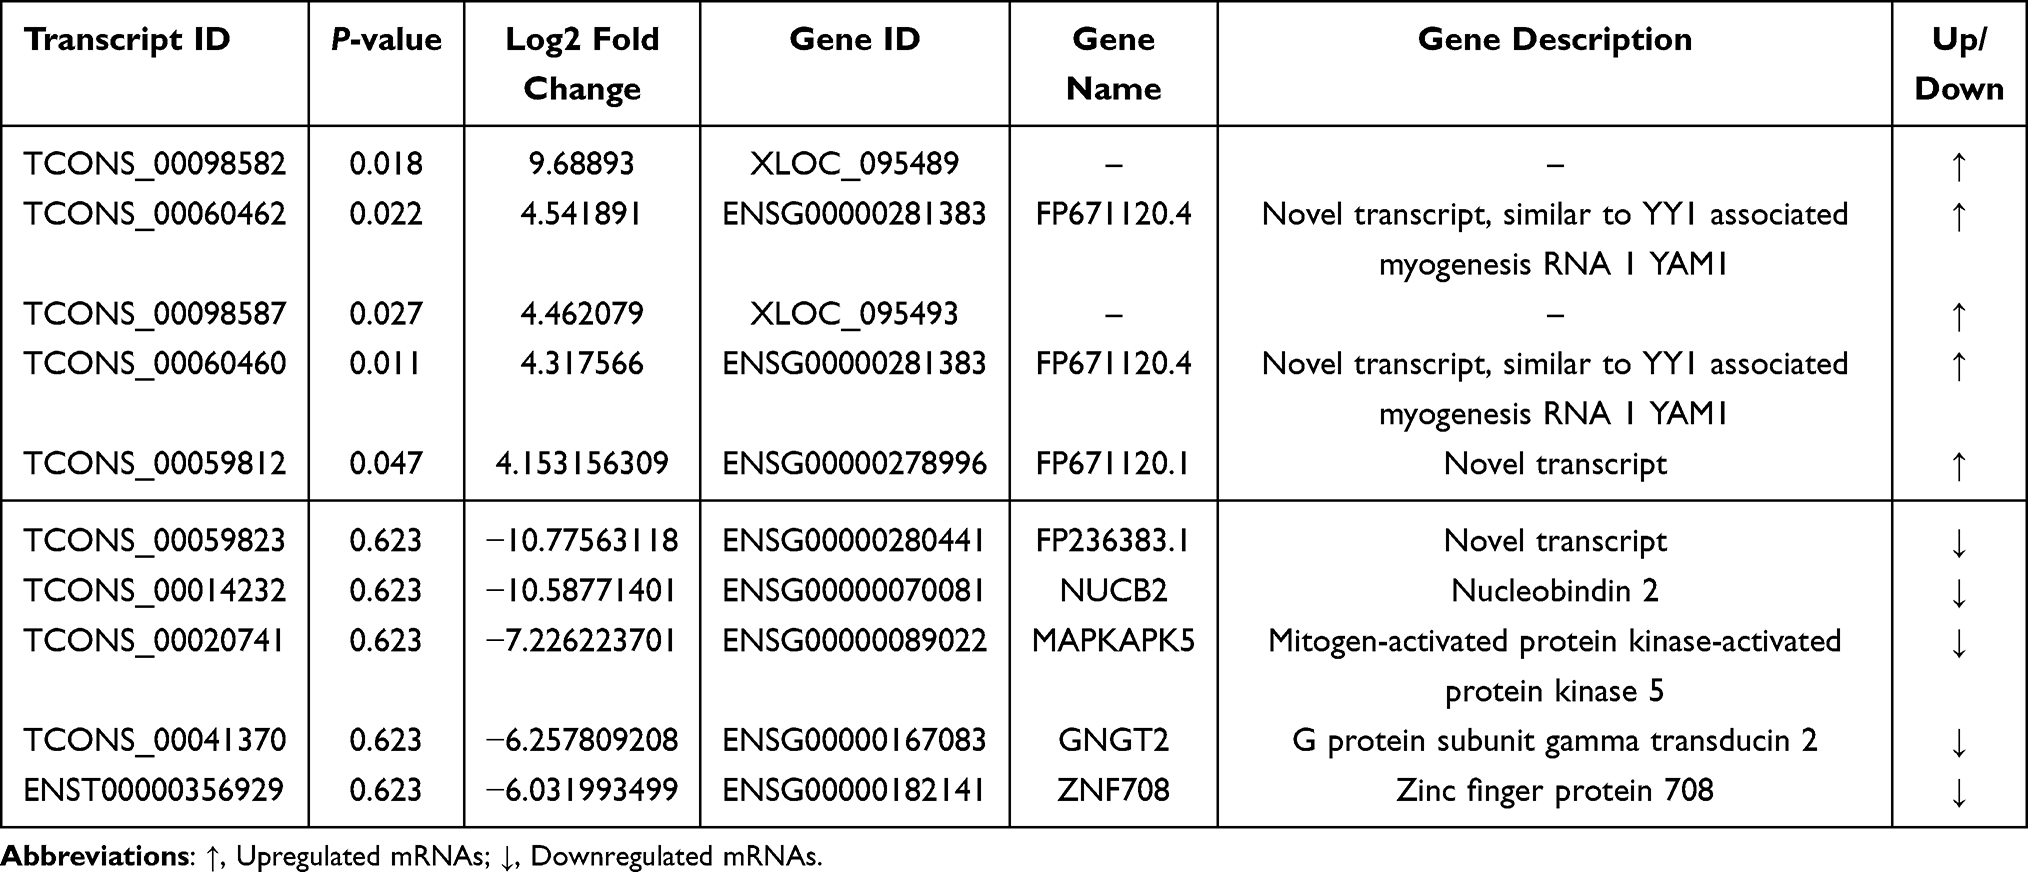 |
Table 3 Top 10 Differentially Expressed mRNAs in the T2DM and Healthy Control Groups |
 |
Figure 5 Hierarchical clustering analysis of significant differential expression profiles between T2DM and healthy groups. (A) lncRNAs and (B) mRNAs. Each row is a transcript ID, and each column represents a sample. Upregulation is represented by magenta, whereas downregulation is represented by green. Abbreviations: DM, diabetes mellitus; T2DM, type 2 diabetes; H, healthy; lncRNA, long noncoding RNA; mRNA, messenger RNA. |
The 84 mRNA transcripts that exhibited substantial differential expression were further cross-referenced with T2DM GWAS to determine their potential relevance to the genetic underpinnings of the disease. These genes were NUDT22, ATM, IL6R, FMNL1, TANGO2, ACRBP, PTPRJ, SMCHD1, and NUCB2; 3 genes related to HOMA-B-related loci, RNF19B, TNRC18, and KXD; 10 genes related to HbA1c-related loci, ZSWIM1, AKAP13, STK10, ZAP70, LAMTOR4, METRNL, CTAGE5, USP34, MAPKAPK5, and APOBEC3A; and 3 related to fasting insulin adj BMI-related loci, PIK3R5, SETX, and TAF13 (see Table 4).
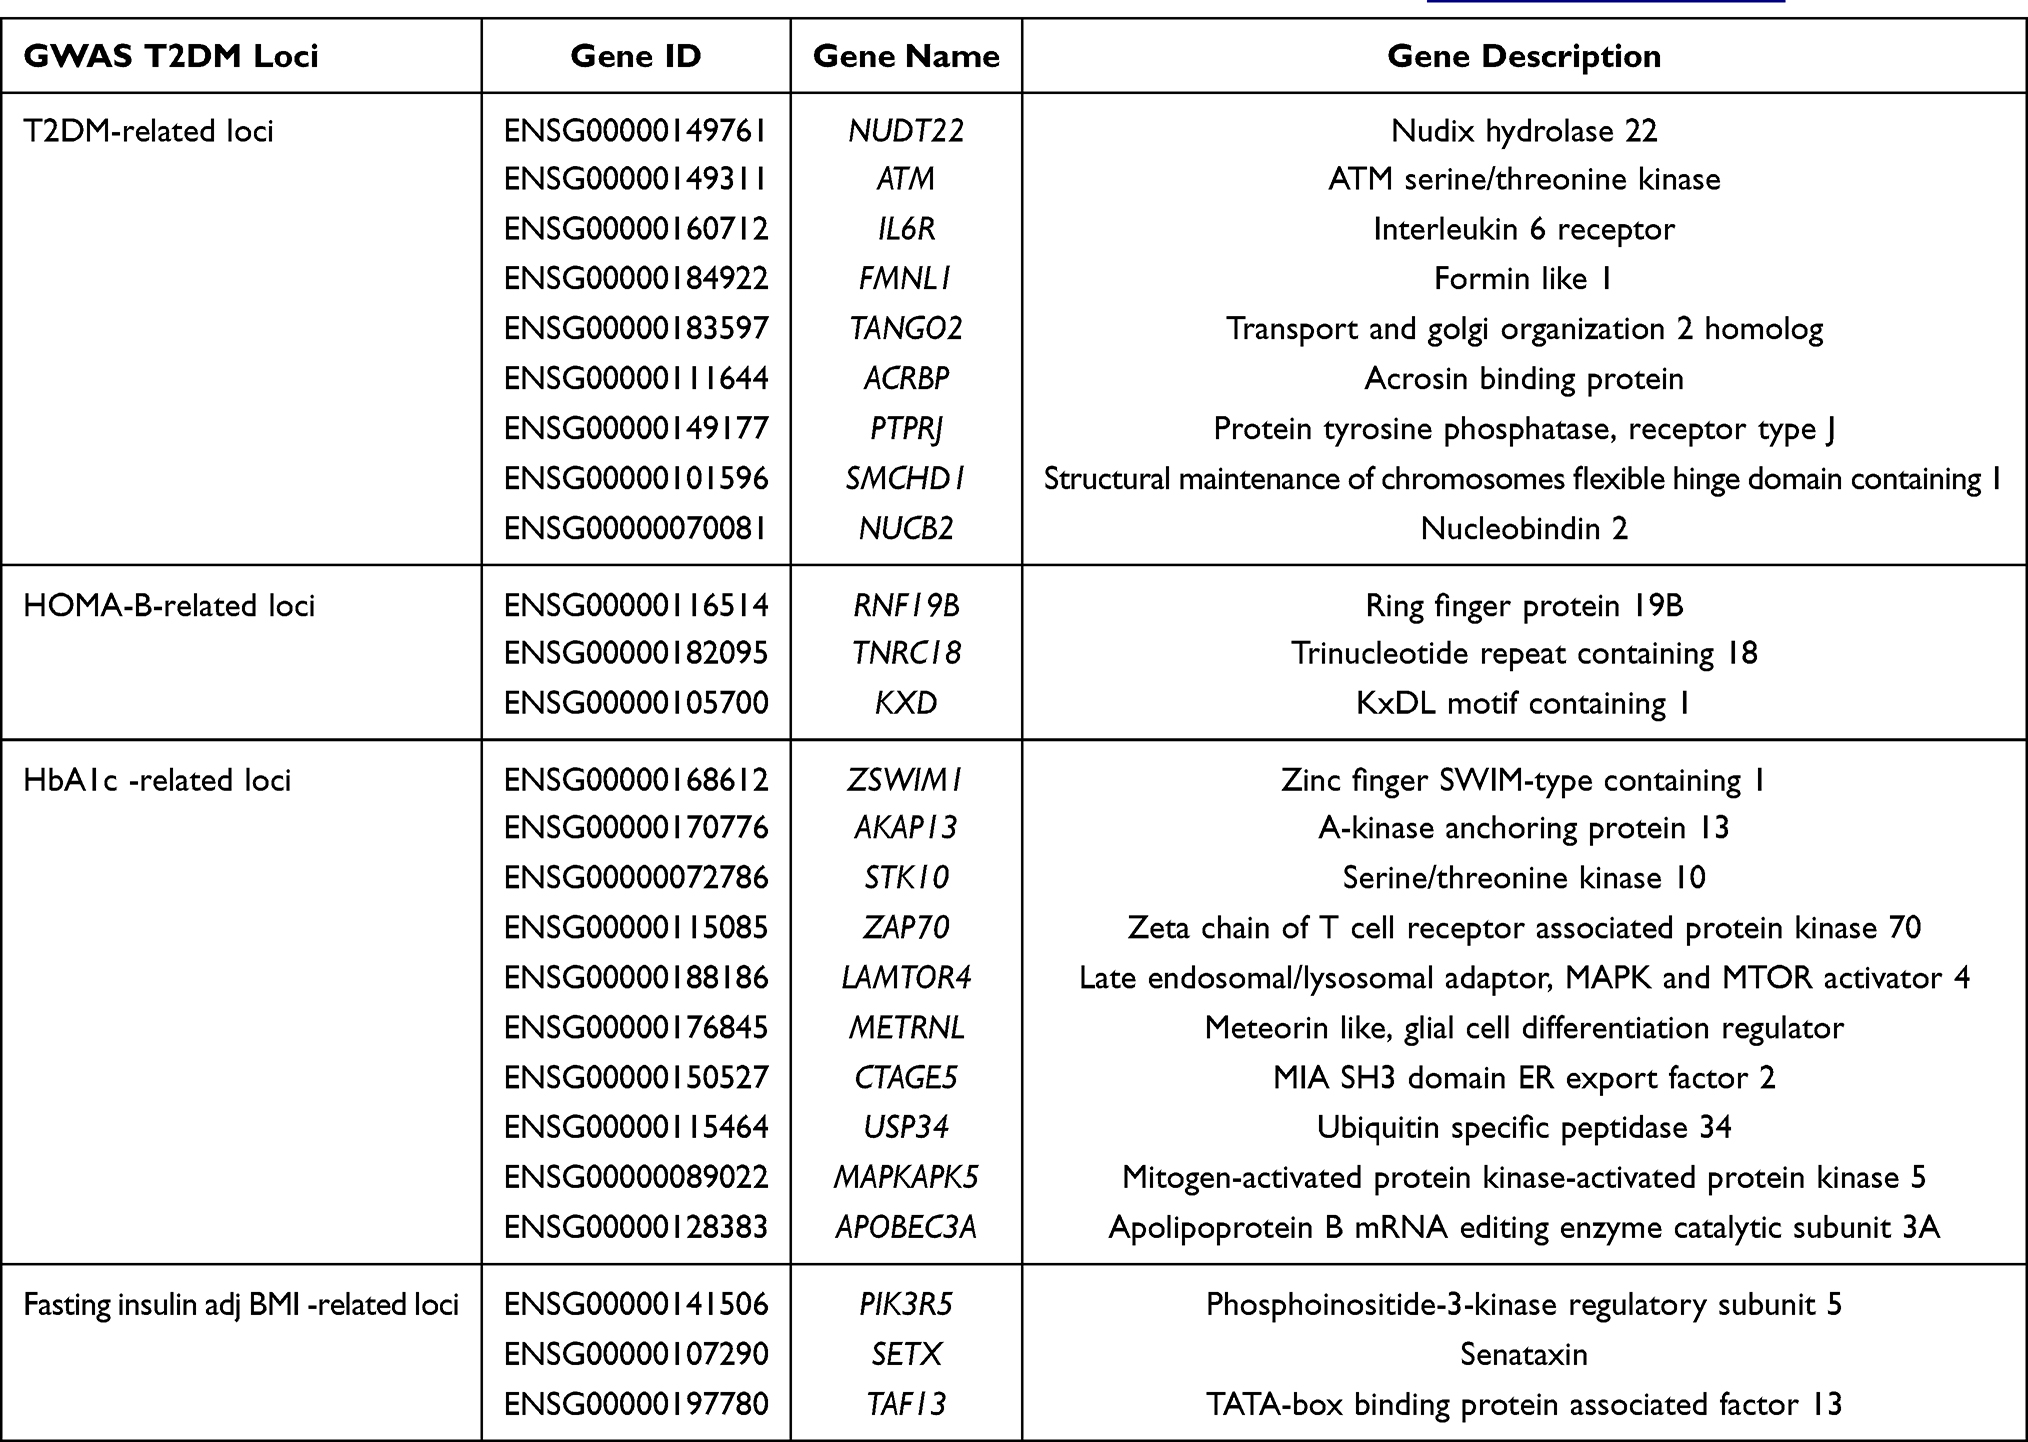 |
Table 4 Differentially Expressed mRNAs Cross-Referenced with T2DM GWAS Available at https://t2d.hugeamp.org |
lncRNA Function Prediction
Correlation analysis was performed to investigate the possibility of co-expression between lncRNAs and mRNAs and to predict the lncRNA target genes. In predicting cis lncRNAs–mRNA, no differentially expressed lncRNAs could be linked to nearby genes. However, several lncRNAs were identified to regulate their target protein-coding genes in a trans manner. The top 10 differentially expressed lncRNAs identified in this study significantly correlated to 64 nearby genes, as listed in Table 5, with a Pearson’s correlation value ≥|0.70| and P-value <0. 05.
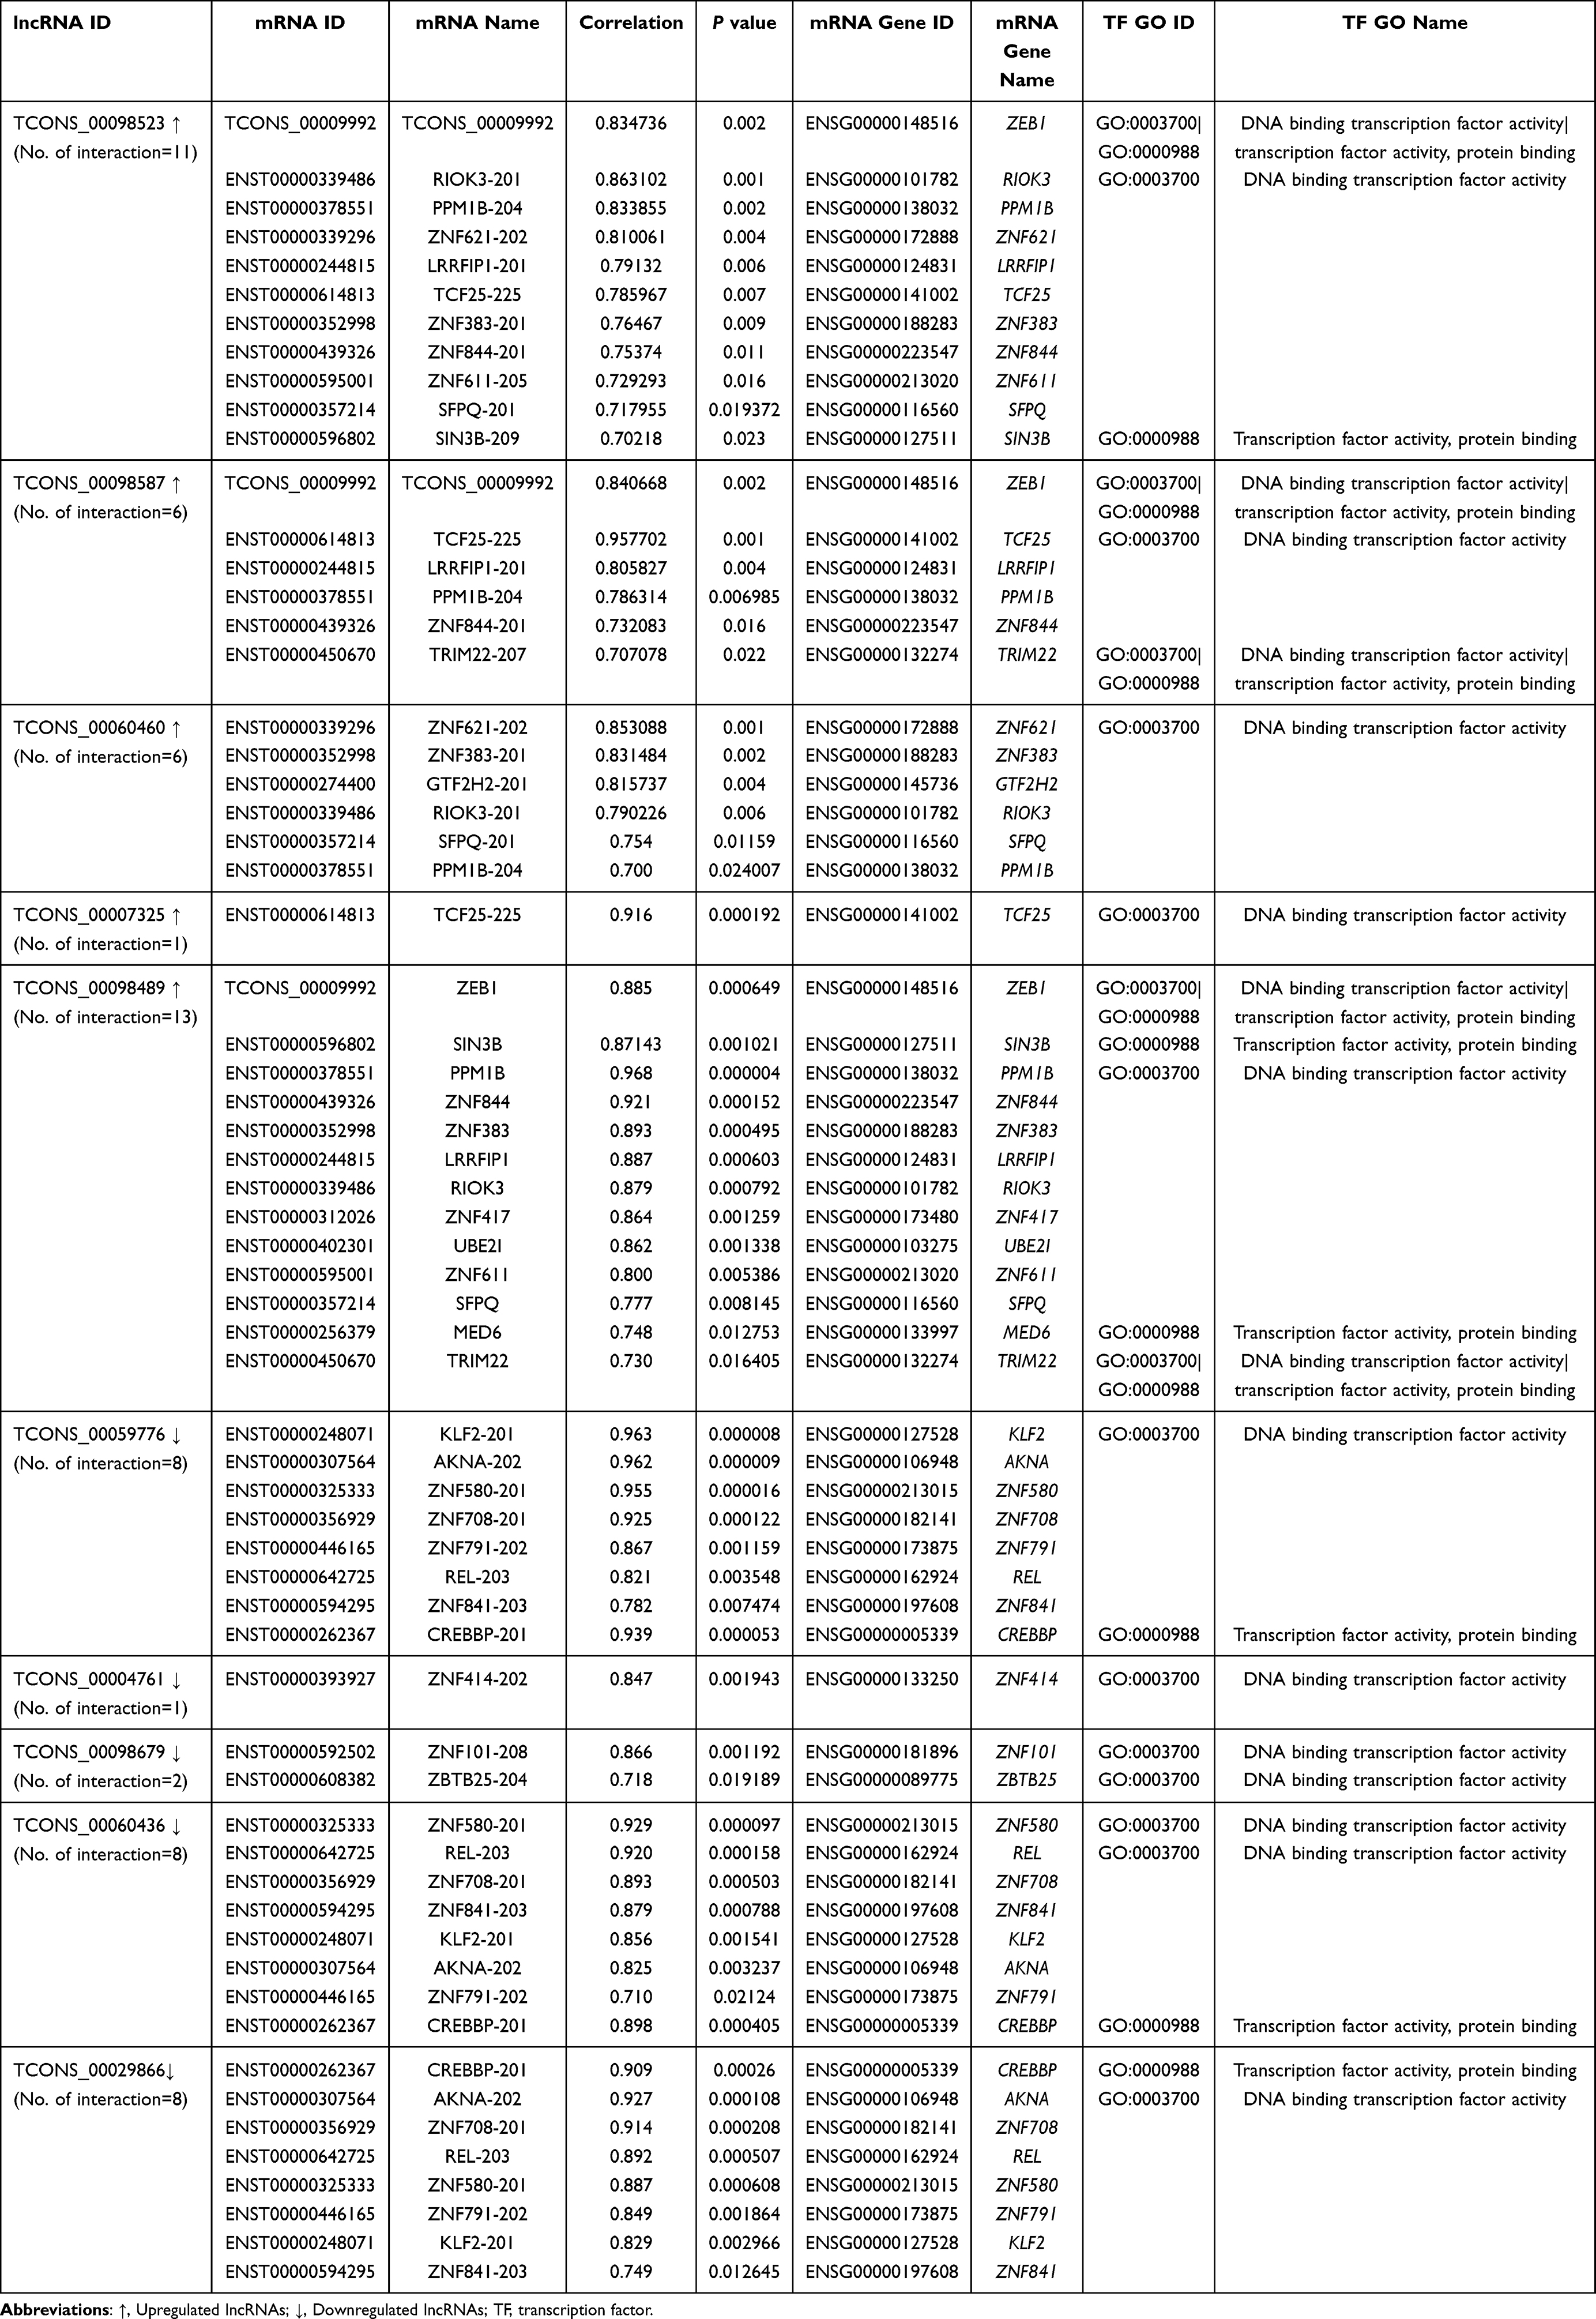 |
Table 5 Prediction of Top Differentially Expressed lncRNA-Target mRNA Genes via lncRNA–mRNA Co-Expression Trans-Interaction in the T2DM Group Compared with the Healthy Control Group |
The lncRNA TCONS_00098523 was linked to 11 genes, namely, RIOK3, ZEB1, PPM1B, ZNF621, LRRFIP1, TCF25, ZNF383, ZNF844, ZNF611, SFPQ, and SIN3B. The lncRNA TCONS_00098587 was linked to six genes, namely, TCF25, ZEB1, LRRFIP1, PPM1B, ZNF844, and TRIM22. The lncRNA TCONS_00060460 was linked to six genes, namely, ZNF621, ZNF383, GTF2H2, RIOK3, SFPQ, and PPM1B. The lncRNA TCONS_00007325 was linked to TCF25. The lncRNA TCONS_00098489 was linked to 13 genes, namely, PPM1B, ZNF844, ZNF383, LRRFIP1, ZEB1, RIOK3, SIN3B, ZNF417, UBE2I, ZNF611, SFPQ, MED6, and TRIM22. The lncRNA TCONS_00059776 was linked to eight genes, namely, KLF2, AKNA, ZNF580, CREBBP, ZNF708, ZNF791, REL, and ZNF841. The lncRNA TCONS_00004761 was linked to ZNF414. The lncRNA TCONS_00098679 was linked to two genes, namely, ZNF101 and ZBTB25. The lncRNA TCONS_00060436 was linked to eight genes, namely, ZNF580, REL, CREBBP, ZNF708, ZNF841, KLF2, AKNA, and ZNF791. The lncRNA TCONS_00029866 was linked to eight genes, namely, AKNA, ZNF708, CREBBP, REL, ZNF580, ZNF791, KLF2, and ZNF841.
Gene Ontology Enrichment Analysis of lncRNA Target Genes and mRNA
GO terms were predicted to determine the function and relationship of differentially expressed lncRNA target genes and mRNAs in the T2DM and healthy groups. The most significant GO analysis results of lncRNA targets and mRNAs are shown in Figure 6. For lncRNA target genes, the enriched MF terms were DNA binding transcription factor activity, DNA binding, and ion binding (Figure 6A). Enriched CC terms were intracellular, organelle, and nucleoplasm (Figure 6B). The most significantly enriched BP terms were cellular nitrogen compound metabolic and biosynthetic processes (Figure 6C). The most significant GO terms of the mRNAs were enriched in MFs (Figure 6D).
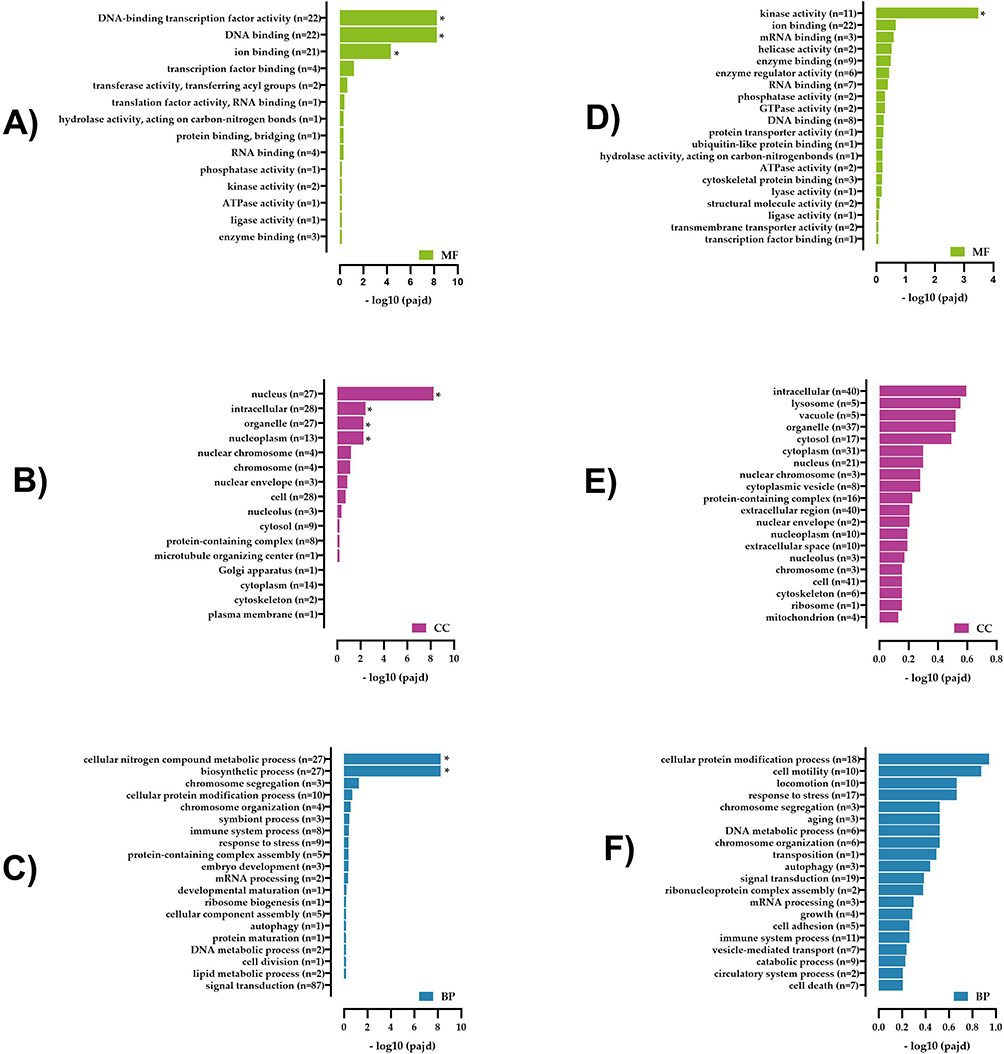 |
Figure 6 Gene Ontology enrichment analysis of differentially expressed lncRNA target genes and mRNAs in the T2DM and healthy groups. (A) Molecular functions (MF), (B) cellular components (CC), and (C) biological processes (BP) of lncRNA target genes. (D) MF, (E) CC, and (F) BP of mRNA. Abbreviations: T2DM, type 2 diabetes; lncRNA, long noncoding RNA; mRNA, messenger RNA. |
For mRNA, the most significantly enriched MF term was kinase activity. The other top terms, which were not significant, were ion binding, mRNA binding, and helicase activity (Figure 6D). No significantly enriched CC terms were found, but the gene networks appeared to be involved with the intracellular, lysosome, and organelle terms as the top three terms (Figure 6E). No significantly enriched BP terms were found, but the top three terms were cellular protein modification process, cell motility, and response to stress (Figure 6F).
KEGG Pathway Enrichment Analysis of lncRNA Target Genes and mRNA
Key pathways for lncRNA target genes and mRNA were analyzed through KEGG enrichment. lncRNA target genes were enriched in nine pathways but not significantly (Figure 7A). Notably, we found three lncRNA target genes enriched in six pathways. UBE2I was enriched in the NF-kappa B signaling pathway, ubiquitin-mediated proteolysis, and RNA transport. GTF2H2 was enriched in basal transcription factors and nucleotide excision repair. PPM1B was enriched only in the MAPK signaling pathway.
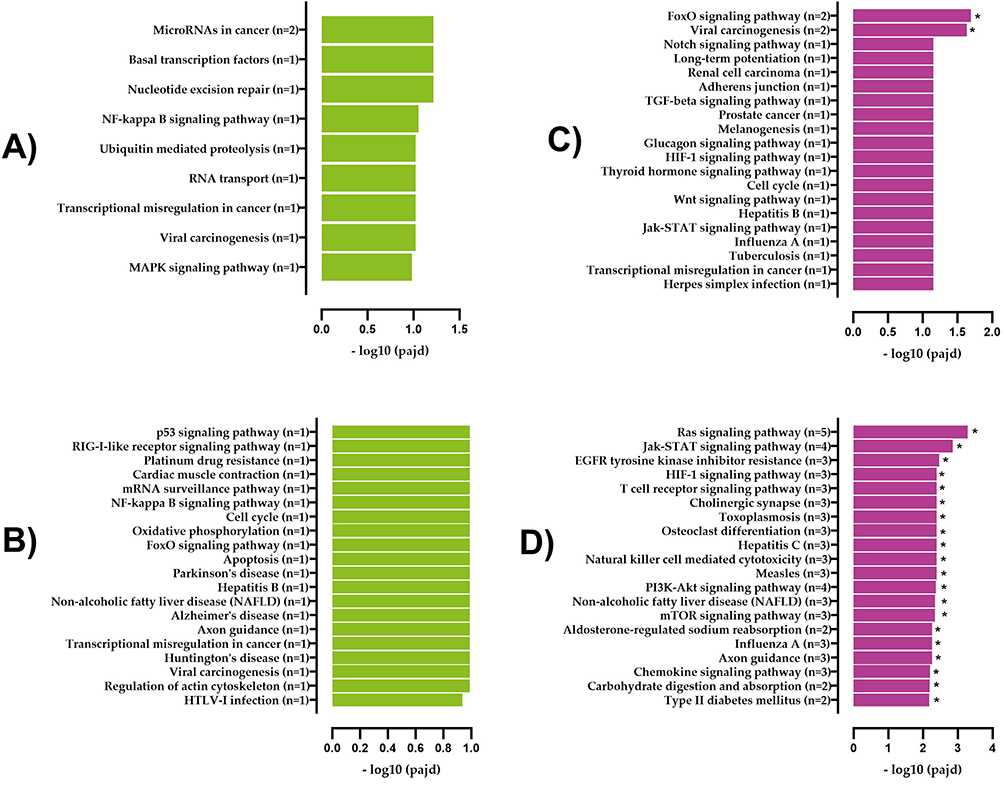 |
Figure 7 KEGG pathway analysis of differentially expressed lncRNA targets and mRNAs in T2DM and healthy groups. (A) Upregulated and (B) downregulated KEGG pathways of lncRNA target genes. (C) Upregulated and (D) downregulated KEGG pathways of mRNA. Abbreviations: lncRNA, long noncoding RNA; KEGG, Kyoto Encyclopedia of Genes and Genomes; mRNA, messenger RNA. |
Twenty-seven pathways were downregulated, of which only two were significantly downregulated (Figure 7B shows the top 20 pathways). The significantly enriched pathways identified were the FoxO signaling (P = 0.00075) and viral carcinogenesis pathways (P = 0.00172). Based on the results, the affected lncRNA target genes in the FoxO signaling pathway were KLF2 and CREBBP, and those in the viral carcinogenesis pathway were REL and CREBBP. Notably, we found that CREBBP was enriched in the most relevant downregulated pathways, including notch, TGF-beta, glucagon, HIF-1, wnt, and Jak-STAT signaling pathways; long-term potentiation; adherens junction; and cell cycle.
Upregulated mRNA transcripts were enriched in 22 pathways but not significantly (Figure 7C shows the top 20 pathways). The downregulated mRNA transcripts were enriched in 98 pathways, of which 81 were significantly downregulated (Figure 7D shows the top 20 pathways). The related pathways include the Ras signaling pathway (P = 0.0000053), Jak-STAT signaling pathway (P = 0.000028), EGFR tyrosine kinase inhibitor resistance pathway (P = 0.000105), HIF-1 signaling pathway (P = 0.000209), T cell receptor signaling pathway (P = 0.000221), cholinergic synapse (P = 0.000259), natural killer cell-mediated cytotoxicity (P = 0.000454), PI3K-AKT signaling pathway (P = 0.000529), mTOR signaling pathway (P = 0.000661), aldosterone-regulated sodium reabsorption (P = 0.000910), axon guidance (P = 0.000966), chemokine signaling pathway (P = 0.001148), carbohydrate digestion and absorption (P = 0.001245), and type II diabetes mellitus (P = 0.00135).
Figure 8 shows the most likely KEGG pathways linked to downregulated mRNA transcripts involved in T2DM .
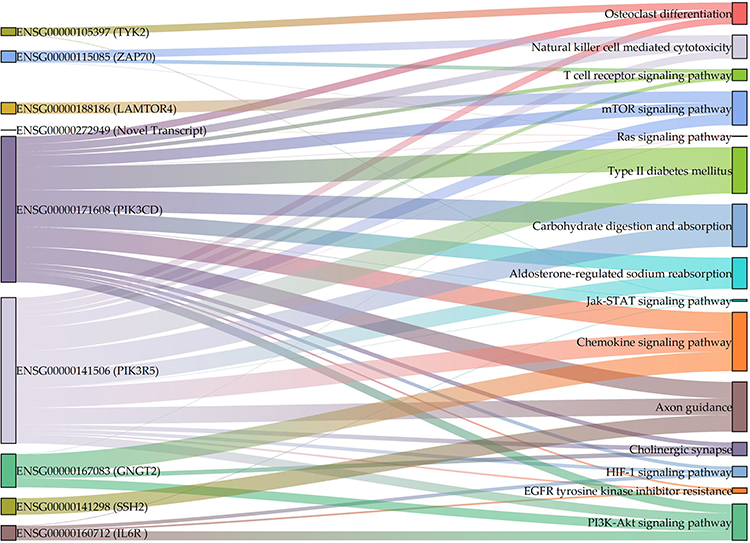 |
Figure 8 Enriched mRNA transcript genes in the KEGG pathways most likely involved in T2DM. The graph was generated using Origin Pro 2023 (OriginLab, Northampton, MA, USA). Abbreviations: T2DM, type 2 diabetes; KEGG, Kyoto Encyclopedia of Genes and Genomes; mRNA, messenger RNA. |
Discussion
According to the latest data from WHO, Saudi Arabia is ranked seventh worldwide in the number of individuals diagnosed with diabetes mellitus.60 In addition, over the past 3 years, Saudi Arabia has recorded an increase in diabetes mellitus cases, roughly equivalent to a 10-fold increase.61 The pathogenesis of T2DM is complicated and consists of multiple factors that operate in concert to produce this condition.62 Genetic, environmental, immunological, and lifestyle factors typically contribute to developing T2DM.18,19 Recent research has demonstrated the importance of lncRNA in T2DM.63 The present study utilized genome analysis using RNA sequencing to investigate the expression of lncRNA and mRNA transcripts of female patients with T2DM compared with those of healthy females in Taif City, Saudi Arabia. To our knowledge, this study is the first to be conducted in a high-altitude area, such as Taif City, to evaluate the lncRNA and mRNA expression profiles in females with T2DM to gain a better understanding of the molecular mechanisms behind the etiology of T2DM at high altitudes. In the present study, we identified 1766 lncRNAs in the T2DM group, of which 582 were novel. Additionally, we found that compared with those in the healthy control group, 22 lncRNA transcripts (10 upregulated and 12 downregulated) and 84 mRNA transcripts (27 upregulated and 57 downregulated) were differentially expressed in patients with T2DM, and most of these transcripts were novel. Hierarchical clustering analysis of expression profiles showed significant differences between the T2DM and healthy control groups. The data indicated that this analysis may lead to identifying important target genes implicated in the development of T2DM.
Based on whole-genome sequencing, lncRNA target genes in patients with diabetes were downregulated in two pathways: Forkhead box O (FoxO) signaling and viral carcinogenesis. KLF2 and CREBBP genes were most likely affected in the FoxO signaling pathway, while in the viral carcinogenesis pathway, REL and CREBBP were the most likely affected genes. FOXO is a family of transcription factors, and the FoxO signaling pathway controls many cellular physiological processes, such as glucose metabolism, cell death, cell-cycle regulation, DNA damage repair, resistance to oxidative stress, and adaption to stress stimuli.64–66 Post-translational modification strictly controls the activity of FOXOs. Patients with diabetes are at an elevated risk of acquiring various severe health complications. Evidence indicates that diabetes-induced activation of FOXO1 is linked to several diabetic problems.67 In vivo model knockdown of FOXO1 can help eliminate retinal microvascular endothelial cells that occur in the initial phase of diabetic retinopathy.68 In our study, KLF2 (encoding a zinc-finger transcription factor) was the most likely affected gene in the FoxO signaling pathway. According to reports, KLF2 is crucial in preserving endothelial function.69 Cell-based investigations have demonstrated that KLF2 directly regulates important endothelial genes, including endothelial nitric oxide synthase (eNOS), thrombomodulin (THBD),70,71 and genes that encode proteins with anti-thrombotic and anti-inflammatory properties.72 KLF2 is inhibited by 30 mM glucose exposure in human umbilical vein endothelial cells.73 KLF2 inhibition by high glucose is a potential diabetic vasculopathy mechanism.74 Furthermore, KLF2 is a powerful angiogenesis inhibitor; as shown in an animal angiogenesis model, the overexpression of KLF2 suppresses vascular endothelial growth factor A (VEGFA).75 In addition, KLF2 can reduce HIF1-α production and affect its function.76 HIF1 is a key transcription factor that regulates metabolic adaptation to hypoxia.77 Moreover, HIF1 regulates the promotion of glycolysis and inhibition of mitochondrial respiration, thereby decreasing oxygen uptake and inhibiting the generation of reactive oxygen species.78 Under intermittent hypoxic conditions, HIF1 increases the expression of pro-inflammatory and pro-angiogenic genes to induce angiogenesis.79 In endothelial cells, the expression of KLF2 was increased under hypoxia, whereas KLF2 knockdown boosted HIF1-α expression.80 The results of the present study show that CREBBP most likely plays a role in downregulating the FoxO viral carcinogenesis signaling pathway. CREBBP, a lysine acetyl transferase involved in many signaling pathways, is implicated in controlling the accessibility of chromatin and transcription.81 Based on our study, CREBBP downregulates the FoxO signaling pathway to reduce diabetes complications. We also found that the viral carcinogenesis pathway is significantly downregulated.82 Patients with T2DM are associated with a higher chance of contracting viral infections, as was recently demonstrated during the COVID-19 pandemic.82
We found that the mRNAs significantly downregulated 81 pathways. The most relevant pathways included the Ras, Jak-STAT, PI3K-AKT, mTOR, HIF-1, T cell receptor, and chemokine signaling pathways; cholinergic synapse; natural killer cell-mediated cytotoxicity; aldosterone-regulated sodium reabsorption; axon guidance; carbohydrate digestion and absorption; type II diabetes mellitus pathway; and EGFR tyrosine kinase inhibitor resistance pathway.
The Ras signaling pathway is an essential growth regulator in all eukaryotic organisms.83 The renin–angiotensin system (RAS) is closely associated with the pathogenesis of insulin resistance/diabetes,84 and RAS inhibition improves insulin sensitivity in humans.85
In our study, PIK3CD and PIK3R5 were enriched in all relevant significantly downregulated pathways. Consistent with our findings, PIK3CD expression was significantly reduced in T2DM in a previous study.86 As insulin resistance is frequently identified as the most important contributor to the development of T2DM, insulin resistance might be treated by targeting the PIK3CD gene.86 Furthermore, by analyzing the microRNA–mRNA expression patterns and functional network of the submandibular gland in T2DM mice, PIK3CD was surmised to play essential roles in developing diabetes-mediated hyposalivation.87 PIK3CB and PIK3CA are among the genes predicted to be predominantly ordered, according to a comprehensive analysis of the functions of highly disordered proteins in T2DM.88 These findings elucidated the primary biological functions of these proteins as well as the functional significance of some of their sites, which often play a part in binding between proteins and possess sites for diverse post-translational modifications.88 A previous study used high-throughput sequencing to investigate the lncRNA and circular RNA network in T2DM. A protein–protein interaction network was built to identify several hub mRNAs, including PIK3R5, enriched in key pathways such as the mTOR signaling and apoptosis pathways.89 In a previous in silico study, bioinformatics analysis was performed to comprehend differential gene expression and patterns and the enriched pathways for obesity and T2DM. Several overexpressed genes that are direct components of the T cell signaling pathway, including PIK3R5, were identified.90
In the current study, the IL6R gene was enriched in four relevant pathways, including the Jak-STAT, HIF-1, and PI3K-Akt signaling pathways and EGFR tyrosine kinase inhibitor resistance. Serum levels of the IL6/IL6R are considerably elevated in T2DM;91 IL6/IL6R has important implications for T2DM. IL6R suppresses pancreatic beta-cell viability and decreases apoptosis-related gene expression to inhibit cell apoptosis by controlling the JAK/STAT signaling pathway via miR22.92 IL-6 primarily activates the JAK/STAT signaling pathway but also activates ERK1/2 and PI3K.93 Modifications in JAK/STAT signaling are linked to numerous complications of T2DM.94 In the present study, TYK2 was enriched in the Jak-STAT signaling pathway and osteoclast differentiation. Tyk2 is a member of the Janus family kinases (Jaks), which are activated by cytokines, including IL10, IL12, and IL18, and perform important functions in signal transduction.95 In mice with gene-targeted knockout of Tyk2 kinase, the function of Tyk2 in the progression of obesity and diabetes was examined. As these animals aged, they developed obesity and T2DM, suggesting that Tyk2 kinase plays a vital role in the progression of these disorders.96 Furthermore, a study investigated the association of TYK2 gene polymorphisms with T1DM and T2DM, focusing on the correlation with flu-like syndrome. The results revealed that the variant of the TYK2 promoter has been linked with an increased risk for diabetes, making it an attractive candidate for virus-induced diabetes.97
In the current study, ZAP70 was enriched in the Ras and T cell receptor signaling pathways and natural killer cell-mediated cytotoxicity. ZAP70 is a Syk family kinase that plays a key role in triggering the T cell receptor signaling pathway and cell migration and death.98 Utilizing gene expression profiles from the Gene Expression Omnibus and a weighted gene correlation network, a comprehensive study was conducted to identify key genes implicated in the development of T2DM-associated cardiovascular disease; the researchers identified 19 genes, including ZAP70, involved in atherosclerosis.99 Earlier work combined miRNA and mRNA datasets to identify significant sepsis-related miRNA and mRNA pairings.
In the present study, the LAMTOR4 gene was enriched in the mTOR signaling pathway. mTOR signaling controls development, growth, motility, and protein production, in addition to various cellular and metabolic functions.100 A study showed that mTOR dysregulation has a significant pathology in the progression of diseases, including T2DM.101 Earlier research emphasized the crucial role of LAMTOR4 as a regulatory element.102 LAMTOR1 and LAMTOR4 are important in the mTOR signaling pathway. To the best of our knowledge, information on the role of this gene in the development of T2DM at the molecular level is unknown.
In the current study, the SSH2 gene was enriched in axon guidance pathways. These pathways control axon guidance, synaptic development, progenitor movement, and cell migration.103 Axon guidance pathways are stimulated in patients with T2DM.104,105 The profiles and networks of miRNA–mRNA expression in the submandibular gland tissues of an animal model of spontaneous T2DM were described in a previous study, which demonstrated that the 11 differentially expressed microRNAs were related to 820 mRNAs, indicating a link between the miRNAs and mRNAs of their target genes. From these, a network of 11 differentially expressed microRNAs and their target genes was built. According to the network, every miRNA was associated with many mRNAs, and every mRNA was associated with different miRNAs. The mRNA SSH2, for instance, interacts with three miRNAs.87 Studies to uncover the correlations between diabetes and sensorineural hearing loss identified two new genes, NOX1 and SSH2.106
To highlight the origin-specific targets, our results were compared to previously published transcriptomes of T2DM and healthy neutrophils of people of different ethnicity, including 9 Caucasians, 1 Hispanic, and 11 African-Americans, In their investigation, the researchers found a considerable difference in gene expression between individuals with T2DM and those with healthy neutrophils.107 Specifically, they observed a reduction in gene expression associated with inflammation and lipid metabolism in T2DM, as evidenced by the downregulation of SLC9A4, NECTIN2, and PLPP3. Furthermore, the top KEGG pathways included sphingolipid metabolism, glycerophospholipid metabolism, ether lipid metabolism, Fc gamma R-mediated phagocytosis, and phospholipase D signaling pathway. The top GO terms in the biological processes category included ammonium ion metabolic process and surfactant homeostasis; those associated with molecular functions included sphingosine-1-phosphate-phosphatase activity; and those involved in cellular components included plasma membrane and integral component of plasma membrane.107
There are some limitations to this study. The small number of samples used for RNA sequencing might have influenced the precision of the results; therefore, it is essential to increase the sample size to validate the results. The results acquired are preliminary and must be verified.
Conclusion
To the best of our knowledge, this comprehensive study is the first to explore the applicability of certain lncRNAs as diagnostic or management biomarkers for T2DM in females in Taif City, Saudi Arabia through the genome-wide identification of lncRNA and mRNA profiling using RNA seq and bioinformatics analysis. This study identified three lncRNA target genes, namely KLF2, CREBBP, and REL. Seven mRNAs, namely PIK3CD, PIK3R5, IL6R, TYK2, ZAP70, LAMTOR4, and SSH2, were significantly enriched in important pathways and perhaps play an important role in the progression of T2DM. Our findings could help in the early diagnosis of T2DM and in designing effective therapeutic targets.
Institutional Review Board Statement
The study was conducted in accordance with the Declaration of Helsinki and approved by the Taif University Research Ethical Committee, Taif, Saudi Arabia (protocol NO.: 43-220; date of approval 23-01-2022).
Informed Consent Statement
Informed consent was obtained from all subjects.
Acknowledgments
The author would like to acknowledge the Deanship of Scientific Research at Taif University for their support of this work.
Funding
This research received no external funding.
Disclosure
The author declares no conflicts of interest in this work.
References
1. Al Saeed MS, Awad NS, El-Tarras AE. Prevalence of some genetic polymorphisms among cardiovascular patients residing at high altitude and sea level. Int J Curr Microbiol App Sci. 2015;4(11):443–449.
2. Fadl MA, Al-Yasi HM, Alsherif EA. Impact of elevation and slope aspect on floristic composition in wadi Elkor, Sarawat Mountain. Saudi J Biol Sci. 2021;11(1):1–10.
3. Ulloa NA, Cook J. Altitude Induced Pulmonary Hypertension. StatPearls; 2020.
4. Ely BR, Lovering AT, Horowitz M, et al. Heat acclimation and cross tolerance to hypoxia: bridging the gap between cellular and systemic responses. Temperature. 2014;1(2):107–114. doi:10.4161/temp.29800
5. Tso E. High-altitude illness. Emerg Med Clin North Am. 1992;10(2):231–247. doi:10.1016/S0733-8627(20)30711-2
6. Mairbäurl H. Red blood cells in sports: effects of exercise and training on oxygen supply by red blood cells. Front Physiol. 2013;4:332. doi:10.3389/fphys.2013.00332
7. Clerici C, Planès C. Gene regulation in the adaptive process to hypoxia in lung epithelial cells. Am J Physiol Cell Physiol. 2009;296(3):L267–L274. doi:10.1152/ajplung.90528.2008
8. Hackett PH, Roach RC. High-Altitude Illness. N Engl J Med. 2001;345(2):107–114. doi:10.1056/NEJM200107123450206
9. McGrath C. Highlight: The Epigenetics of Life at 12,000 Ft. Oxford University Press; 2021.
10. Singh D, Bhattarai M. High prevalence of diabetes and impaired fasting glycaemia in urban Nepal. Diab Med. 2003;20(2):170–171. doi:10.1046/j.1464-5491.2003.00829_4.x
11. Sasaki H, Kawasaki T, Ogaki T, et al. The prevalence of diabetes mellitus and impaired fasting glucose/glycaemia (IFG) in suburban and rural Nepal—the communities-based cross-sectional study during the democratic movements in 1990. Diabetes Res Clin Pract. 2005;67(2):167–174. doi:10.1016/j.diabres.2004.06.012
12. Carrasco Piña E, Pérez Bravo F, Ángel Badillo B, et al. Prevalence of Type 2 Diabetes and Obesity in Two Chilean Aboriginal Populations Living in Urban Zones. Soc Medica Santiago; 2004.
13. Okumiya K, Sakamoto R, Kimura Y, et al. Diabetes mellitus and hypertension in elderly highlanders in Asia. J Am Geriatr Soc. 2010;58(6):1193–1195. doi:10.1111/j.1532-5415.2010.02862.x
14. Wagner K-H, Schwingshackl L, Draxler A, et al. Impact of dietary and lifestyle interventions in elderly or people diagnosed with diabetes, metabolic disorders, cardiovascular disease, cancer and micronutrient deficiency on micronuclei frequency–a systematic review and meta-analysis. Mutat Res Rev Mutat Res. 2021;787:108367. doi:10.1016/j.mrrev.2021.108367
15. Cho NH, Shaw JE, Karuranga S, et al. IDF diabetes atlas: global estimates of diabetes prevalence for 2017 and projections for 2045. Diabetes Res Clin Pract. 2018;138:271–281. doi:10.1016/j.diabres.2018.02.023
16. Robert AA, Abdulaziz Al Dawish M, Braham R, et al. Type 2 diabetes mellitus in Saudi Arabia: major challenges and possible solutions. Curr Diabetes Rev. 2017;13(1):59–64.
17. Gómez-Peralta F, Abreu C, Cos X, et al. When does diabetes start? Early detection and intervention in type 2 diabetes mellitus. Rev Clin Esp. 2020;220(5):305–314. doi:10.1016/j.rce.2019.12.003
18. Guariguata L, Whiting DR, Hambleton I, et al. Global estimates of diabetes prevalence for 2013 and projections for 2035. Diabetes Res Clin Pract. 2014;103(2):137–149.
19. Kadamkode V, Banerjee G. Micro RNA: an epigenetic regulator of type 2 diabetes. Microrna. 2014;3(2):86–97.
20. Cerf ME. Beta cell dysfunction and insulin resistance. Front Endocrinol (Lausanne). 2013;4:37. doi:10.3389/fendo.2013.00037
21. Florez JC, Hirschhorn J, Altshuler D. The inherited basis of diabetes mellitus: implications for the genetic analysis of complex traits. Annu Rev Genomics Hum Genet. 2003;4(1):257–291.
22. Kwak SH, Park KS. Recent progress in genetic and epigenetic research on type 2 diabetes. Exp Mol Med. 2016;48(3):e220–e220.
23. Heyn H, Esteller M. DNA methylation profiling in the clinic: applications and challenges. Nat Rev Genet. 2012;13(10):679–692.
24. Geach T. Blood-based markers for T2DM. Nat Rev Endocrinol. 2016;12(6):311. doi:10.1038/nrendo.2016.63
25. Bloss CS, Jeste DV, Schork NJ. Genomics for disease treatment and prevention. Psychiatr Clin. 2011;34(1):147–166.
26. Burton H, Jackson C, Abubakar I. The impact of genomics on public health practice. Br Med Bull. 2014;112(1):37.
27. Salzman J, Chen RE, Olsen MN, et al. Cell-type specific features of circular RNA expression. PLoS Genet. 2013;9(9):e1003777. doi:10.1371/journal.pgen.1003777
28. Gloss BS, Dinger ME. Realizing the significance of noncoding functionality in clinical genomics. Exp Mol Med. 2018;50(8):1–8. doi:10.1038/s12276-018-0087-0
29. Cebola I, Pasquali L. Non-coding genome functions in diabetes 1 2; 2015.
30. Zhang P, Wu W, Chen Q, et al. Non-Coding RNAs and their Integrated Networks. J Integr Bioinform. 2019;16(3):20190027. doi:10.1515/jib-2019-0027
31. López-Jiménez E, Andrés-León E. The Implications of ncRNAs in the development of human diseases. Non-Coding RNA. 2021;7(1):17. doi:10.3390/ncrna7010017
32. May JM, Bylicky M, Chopra S, et al. Long and short non-coding RNA and radiation response: a review. Transl Res. 2021;233:162–179. doi:10.1016/j.trsl.2021.02.005
33. He X, Ou C, Xiao Y, et al. LncRNAs: key players and novel insights into diabetes mellitus. Oncotarget. 2017;8(41):71325. doi:10.18632/oncotarget.19921
34. Vance KW, Ponting CP. Transcriptional regulatory functions of nuclear long noncoding RNAs. Trends Genet. 2014;30(8):348–355. doi:10.1016/j.tig.2014.06.001
35. Knauss JL, Sun T. Regulatory mechanisms of long noncoding RNAs in vertebrate central nervous system development and function. Neuroscience. 2013;235:200–214. doi:10.1016/j.neuroscience.2013.01.022
36. Kazemzadeh M, Safaralizadeh R, Orang AV. LncRNAs: emerging players in gene regulation and disease pathogenesis. J Genet. 2015;94(4):771–784. doi:10.1007/s12041-015-0561-6
37. Pastori C, Wahlestedt C. Involvement of long noncoding RNAs in diseases affecting the central nervous system. RNA Biol. 2012;9(6):860–870. doi:10.4161/rna.20482
38. Chen D, Sun Q, Cheng X, et al. Genome-wide analysis of long noncoding RNA (lnc RNA) expression in colorectal cancer tissues from patients with liver metastasis. Cancer Med. 2016;5(7):1629–1639. doi:10.1002/cam4.738
39. Sauvageau M, Goff LA, Lodato S, et al. Multiple knockout mouse models reveal lincRNAs are required for life and brain development. elife. 2013;2:e01749. doi:10.7554/eLife.01749
40. Sallam T, Sandhu J, Tontonoz P. Long noncoding RNA discovery in cardiovascular disease: decoding form to function. Circ Res. 2018;122(1):155–166. doi:10.1161/CIRCRESAHA.117.311802
41. Simion V, Haemmig S, Feinberg MW. LncRNAs in vascular biology and disease. Vascul Pharmacol. 2019;114:145–156. doi:10.1016/j.vph.2018.01.003
42. Guo F-X, Wu Q, Li P, et al. The role of the LncRNA-FA2H-2-MLKL pathway in atherosclerosis by regulation of autophagy flux and inflammation through mTOR-dependent signaling. Cell Death Differ. 2019;26(9):1670–1687. doi:10.1038/s41418-018-0235-z
43. Spranger J, Kroke A, Mohlig M, et al. Inflammatory cytokines and the risk to develop type 2 diabetes: results of the prospective population-based European Prospective Investigation into Cancer and Nutrition (EPIC)-Potsdam Study. Diabetes. 2003;52(3):812–817. doi:10.2337/diabetes.52.3.812
44. Herder C, Brunner EJ, Rathmann W, et al. Elevated levels of the anti-inflammatory interleukin-1 receptor antagonist precede the onset of type 2 diabetes: the Whitehall II study. Diabetes Care. 2009;32(3):421–423. doi:10.2337/dc08-1161
45. Koçak MZ, Aktaş G, Erkuş E, et al. Neuregulin-4 is associated with plasma glucose and increased risk of type 2 diabetes mellitus. Swiss Med Wkly. 2019;2019:1.
46. Aktas G, Yilmaz S, Kantarci DB, et al. Is serum uric acid-to-HDL cholesterol ratio elevation associated with diabetic kidney injury? Postgrad Med. 2023;135(5):519–523. doi:10.1080/00325481.2023.2214058
47. Kocak MZ, Aktas G, Erkus E, et al. Serum uric acid to HDL-cholesterol ratio is a strong predictor of metabolic syndrome in type 2 diabetes mellitus. Rev Assoc Med Bras. 2019;65:9–15. doi:10.1590/1806-9282.65.1.9
48. Aktas G, Khalid A, Kurtkulagi O, et al. Poorly controlled hypertension is associated with elevated serum uric acid to HDL-cholesterol ratio: a cross-sectional cohort study. Postgrad Med. 2022;134(3):297–302. doi:10.1080/00325481.2022.2039007
49. Kosekli MA, Kurtkulagii O, Kahveci G, et al. The association between serum uric acid to high density lipoprotein-cholesterol ratio and non-alcoholic fatty liver disease: the abund study. Rev Assoc Med Bras. 2021;67:549–554. doi:10.1590/1806-9282.20201005
50. Aktaş G, Kocak MZ, Duman TT, et al. Mean Platelet Volume (MPV) as an inflammatory marker in type 2 diabetes mellitus and obesity. Bali Med J. 2018;2018:1.
51. Group, IDFGD. Global guideline for type 2 diabetes. Diabetes Res Clin Pract. 2014;104(1):1–52. doi:10.1016/j.diabres.2012.10.001
52. Kim D, Langmead B, Salzberg SL. HISAT: hierarchical indexing for spliced alignment of transcripts. BioRxiv. 2014;2014:012591.
53. Pertea M, Pertea GM, Antonescu CM, et al. StringTie enables improved reconstruction of a transcriptome from RNA-seq reads. Nat Biotechnol. 2015;33(3):290–295. doi:10.1038/nbt.3122
54. Sun L, Luo H, Bu D, et al. Utilizing sequence intrinsic composition to classify protein-coding and long non-coding transcripts. Nucleic Acids Res. 2013;41(17):e166–e166. doi:10.1093/nar/gkt646
55. Punta M, Coggill PC, Eberhardt RY, et al. The Pfam protein families database. Nucleic Acids Res. 2012;40(D1):D290–D301. doi:10.1093/nar/gkr1065
56. Frazee AC, Pertea G, Jaffe AE, et al. Ballgown bridges the gap between transcriptome assembly and expression analysis. Nat Biotechnol. 2015;33(3):243–246. doi:10.1038/nbt.3172
57. Young MD, Wakefield MJ, Smyth GK, et al. Gene ontology analysis for RNA-seq: accounting for selection bias. Genome Biol. 2010;11(2):1–12. doi:10.1186/gb-2010-11-2-r14
58. Kanehisa M, Araki M, Goto S, et al. KEGG for linking genomes to life and the environment. Nucleic Acids Res. 2007;36(suppl_1):D480–D484. doi:10.1093/nar/gkm882
59. Mao X, Cai T, Olyarchuk JG, et al. Automated genome annotation and pathway identification using the KEGG Orthology (KO) as a controlled vocabulary. Bioinformatics. 2005;21(19):3787–3793. doi:10.1093/bioinformatics/bti430
60. Gollapalli M, Alansari A, Alkhorasani H, et al. A novel stacking ensemble for detecting three types of diabetes mellitus using a Saudi Arabian dataset: pre-diabetes, T1DM, and T2DM. Comput Biol Med. 2022;147:105757. doi:10.1016/j.compbiomed.2022.105757
61. Al Dawish MA, Robert AA. Diabetes Mellitus in Saudi Arabia: challenges and possible solutions. In: Handbook of Healthcare in the Arab World. Springer; 2021:1083–1100.
62. Leahy JL. Pathogenesis of type 2 diabetes mellitus. Arch Med Res. 2005;36(3):197–209. doi:10.1016/j.arcmed.2005.01.003
63. Kowluru RA, Mohammad G. Epigenetic modifications in diabetes. Metabolism. 2022;126:154920. doi:10.1016/j.metabol.2021.154920
64. Arden K. FOXO animal models reveal a variety of diverse roles for FOXO transcription factors. Oncogene. 2008;27(16):2345–2350. doi:10.1038/onc.2008.27
65. Dansen TB, Burgering BM. Unravelling the tumor-suppressive functions of FOXO proteins. Trends Cell Biol. 2008;18(9):421–429. doi:10.1016/j.tcb.2008.07.004
66. Bakker WJ, Harris IS, Mak TW. FOXO3a is activated in response to hypoxic stress and inhibits HIF1-induced apoptosis via regulation of CITED2. Mol Cell. 2007;28(6):941–953. doi:10.1016/j.molcel.2007.10.035
67. Wang Y, Zhou Y, Graves DT. FOXO transcription factors: their clinical significance and regulation. Biomed Res Int. 2014;2014:1.
68. Behl Y, Krothapalli P, Desta T, et al. FOXO1 plays an important role in enhanced microvascular cell apoptosis and microvascular cell loss in type 1 and type 2 diabetic rats. Diabetes. 2009;58(4):917–925. doi:10.2337/db08-0537
69. Sangwung P, Zhou G, Nayak L, et al. KLF2 and KLF4 control endothelial identity and vascular integrity. JCI Insight. 2017;2(4). doi:10.1172/jci.insight.91700
70. Dekker RJ, Van Soest S, Fontijn RD, et al. Prolonged fluid shear stress induces a distinct set of endothelial cell genes, most specifically lung Kruppel-like factor (KLF2). Blood J Am Soc Hematol. 2002;100(5):1689–1698.
71. Lin Z, Kumar A, SenBanerjee S, et al. Kruppel-like factor 2 (KLF2) regulates endothelial thrombotic function. Circ Res. 2005;96(5):e48–e57. doi:10.1161/01.RES.0000159707.05637.a1
72. Atkins GB, Jain MK. Role of Kruppel-like transcription factors in endothelial biology. Circ Res. 2007;100(12):1686–1695. doi:10.1161/01.RES.0000267856.00713.0a
73. Lee H-Y, Youn S-W, Cho H-J, et al. FOXO1 impairs whereas statin protects endothelial function in diabetes through reciprocal regulation of Krüppel-like factor 2. Cardiovasc Res. 2013;97(1):143–152. doi:10.1093/cvr/cvs283
74. Lee H-Y, Youn SW, Oh BH, et al. Krüppel-like factor 2 suppression by high glucose as a possible mechanism of diabetic vasculopathy. Korean Circ J. 2012;42(4):239–245. doi:10.4070/kcj.2012.42.4.239
75. Bhattacharya R, SenBanerjee S, Lin Z, et al. Inhibition of vascular permeability factor/vascular endothelial growth factor-mediated angiogenesis by the Kruppel-like factor KLF2. J Biol Chem. 2005;280(32):28848–28851. doi:10.1074/jbc.C500200200
76. Wang H-G, Cao B, Zhang L-X, et al. KLF2 inhibits cell growth via regulating HIF-1α/Notch-1 signal pathway in human colorectal cancer HCT116 cells. Oncol Rep. 2017;38(1):584–590. doi:10.3892/or.2017.5708
77. Ziello JE, Jovin IS, Huang Y. Hypoxia-Inducible Factor (HIF)-1 regulatory pathway and its potential for therapeutic intervention in malignancy and ischemia. Yale J Biol Med. 2007;80(2):51.
78. Jensen KS, Binderup T, Jensen KT, et al. FoxO3A promotes metabolic adaptation to hypoxia by antagonizing Myc function. EMBO J. 2011;30(22):4554–4570. doi:10.1038/emboj.2011.323
79. Toffoli S, Roegiers A, Feron O, et al. Intermittent hypoxia is an angiogenic inducer for endothelial cells: role of HIF-1. Angiogenesis. 2009;12(1):47–67. doi:10.1007/s10456-009-9131-y
80. Kawanami D, Mahabeleshwar GH, Lin Z, et al. Kruppel-like factor 2 inhibits hypoxia-inducible factor 1α expression and function in the endothelium. J Biol Chem. 2009;284(31):20522–20530. doi:10.1074/jbc.M109.025346
81. Dutto I, Scalera C, Prosperi E. CREBBP and p300 lysine acetyl transferases in the DNA damage response. Cell Mol Life Sci. 2018;75(8):1325–1338. doi:10.1007/s00018-017-2717-4
82. Wensveen TT, Gašparini D, Rahelić D, et al. Type 2 diabetes and viral infection; cause and effect of disease. Diabetes Res Clin Pract. 2021;172:108637. doi:10.1016/j.diabres.2020.108637
83. Vojtek AB, Der CJ. Increasing complexity of the Ras signaling pathway. J Biol Chem. 1998;273(32):19925–19928. doi:10.1074/jbc.273.32.19925
84. El-Nasr NMA, Saleh DO, Mahmoud SS, et al. Olmesartan attenuates type 2 diabetes-associated liver injury: cross-talk of AGE/RAGE/JNK, STAT3/SCOS3 and RAS signaling pathways. Eur J Pharmacol. 2020;874:173010. doi:10.1016/j.ejphar.2020.173010
85. Pereira LX, Alves da Silva LC, de Oliveira Feitosa A, et al. Correlation between renin-angiotensin system (RAS) related genes, type 2 diabetes, and cancer: insights from metanalysis of transcriptomics data. Mol Cell Endocrinol. 2019;493:110455. doi:10.1016/j.mce.2019.110455
86. Du X, Li X, Chen L, et al. Hepatic miR‐125b inhibits insulin signaling pathway by targeting PIK3CD. J Cell Physiol. 2018;233(8):6052–6066. doi:10.1002/jcp.26442
87. Liu H-M, Huang Y, Li L, et al. MicroRNA-mRNA expression profiles and functional network of submandibular gland in type 2 diabetic db/db mice. Arch Oral Biol. 2020;120:104947. doi:10.1016/j.archoralbio.2020.104947
88. Du Z, Uversky VN. A comprehensive survey of the roles of highly disordered proteins in type 2 diabetes. Int J Mol Sci. 2017;18(10):2010. doi:10.3390/ijms18102010
89. Yang F, Chen Y, Xue Z, et al. High-throughput sequencing and exploration of the lncRNA-circRNA-miRNA-mRNA network in type 2 diabetes mellitus. Biomed Res Int. 2020;2020:1.
90. Eldakhakhny BM, Al Sadoun H, Choudhry H, et al. In-Silico study of immune system associated genes in case of type-2 diabetes with insulin action and resistance, and/or obesity. Front Endocrinol (Lausanne). 2021;12:641888. doi:10.3389/fendo.2021.641888
91. Kado S, Nagase T, Nagata N. Circulating levels of interleukin-6, its soluble receptor and interleukin-6/interleukin-6 receptor complexes in patients with type 2 diabetes mellitus. Acta Diabetol. 1999;36:67–72. doi:10.1007/s005920050147
92. Wu X, Yu T, Ji N, et al. IL6R inhibits viability and apoptosis of pancreatic beta-cells in type 2 diabetes mellitus via regulation by miR-22 of the JAK/STAT signaling pathway. Diabetes Metab Syndr Obes. 2019;Volume 12:1645–1657. doi:10.2147/DMSO.S211700
93. Horsten U, Schmitz-Van de Leur H, Müllberg J, et al. The membrane distal half of gp130 is responsible for the formation of a ternary complex with IL‐6 and the IL‐6 receptor. FEBS Lett. 1995;360(1):43–46. doi:10.1016/0014-5793(95)00053-C
94. Moshapa FT, Riches-Suman K, Palmer TM. Therapeutic targeting of the proinflammatory IL-6-JAK/STAT signalling pathways responsible for vascular restenosis in type 2 diabetes mellitus. Cardiol Res Pract. 2019;2019:1–15. doi:10.1155/2019/9846312
95. Ghoreschi K, Laurence A, O’Shea JJ. Janus kinases in immune cell signaling. Immunol Rev. 2009;228(1):273–287. doi:10.1111/j.1600-065X.2008.00754.x
96. Gornicka AO, Millward C, Croniger C, Larner A. Deficiency of Tyk2 Kinase in Mice Leads to Obesity and Insulin Resistance. Wiley Online Library; 2008.
97. Nagafuchi S, Kamada-Hibio Y, Hirakawa K, et al. TYK2 promoter variant and diabetes mellitus in the Japanese. E Bio Med. 2015;2(7):744–749.
98. Amin S, Parker A, Mann J. ZAP70 in chronic lymphocytic leukaemia. Int J Biochem Cell Biol. 2008;40(9):1654–1658. doi:10.1016/j.biocel.2007.05.016
99. Huang Q, Deng G, Wei R, et al. Comprehensive identification of key genes involved in development of diabetes mellitus-related atherogenesis using weighted gene correlation network analysis. Front Cardiovasc Med. 2020;7:580573. doi:10.3389/fcvm.2020.580573
100. Efeyan A, Zoncu R, Sabatini DM. Amino acids and mTORC1: from lysosomes to disease. Trends Mol Med. 2012;18(9):524–533. doi:10.1016/j.molmed.2012.05.007
101. Laplante M, Sabatini DM. mTOR signaling in growth control and disease. cell. 2012;149(2):274–293. doi:10.1016/j.cell.2012.03.017
102. Rasheed N, Lima TB, Mercaldi GF, et al. C7orf59/LAMTOR4 phosphorylation and structural flexibility modulate Ragulator assembly. FEBS Open Bio. 2019;9(9):1589–1602. doi:10.1002/2211-5463.12700
103. Russell SA, Bashaw GJ. Axon guidance pathways and the control of gene expression. Dev Dyn. 2018;247(4):571–580. doi:10.1002/dvdy.24609
104. Das UN, Rao AA. Gene expression profile in obesity and type 2 diabetes mellitus. Lipids Health Dis. 2007;6:1–19. doi:10.1186/1476-511X-6-35
105. Guo K, Elzinga S, Eid S, et al. Genome-wide DNA methylation profiling of human diabetic peripheral neuropathy in subjects with type 2 diabetes mellitus. Epigenetics. 2019;14(8):766–779. doi:10.1080/15592294.2019.1615352
106. Sherif M. Understanding the Genetic Basis of Diabetes Mellitus and Sensorineural Deafness. UCL (University College London); 2015.
107. Kleinstein SE, McCorrison J, Ahmed A, et al. Transcriptomics of type 2 diabetic and healthy human neutrophils. BMC Immunol. 2021;22(1):1–16. doi:10.1186/s12865-021-00428-6
 © 2023 The Author(s). This work is published and licensed by Dove Medical Press Limited. The full terms of this license are available at https://www.dovepress.com/terms.php and incorporate the Creative Commons Attribution - Non Commercial (unported, v3.0) License.
By accessing the work you hereby accept the Terms. Non-commercial uses of the work are permitted without any further permission from Dove Medical Press Limited, provided the work is properly attributed. For permission for commercial use of this work, please see paragraphs 4.2 and 5 of our Terms.
© 2023 The Author(s). This work is published and licensed by Dove Medical Press Limited. The full terms of this license are available at https://www.dovepress.com/terms.php and incorporate the Creative Commons Attribution - Non Commercial (unported, v3.0) License.
By accessing the work you hereby accept the Terms. Non-commercial uses of the work are permitted without any further permission from Dove Medical Press Limited, provided the work is properly attributed. For permission for commercial use of this work, please see paragraphs 4.2 and 5 of our Terms.