Back to Journals » OncoTargets and Therapy » Volume 10
Genome-scale analysis to identify prognostic markers in patients with early-stage pancreatic ductal adenocarcinoma after pancreaticoduodenectomy
Authors Liao X ![]() , Huang K, Huang R
, Huang K, Huang R ![]() , Liu X, Han C, Yu L, Yu T, Yang C
, Liu X, Han C, Yu L, Yu T, Yang C ![]() , Wang X, Peng T
, Wang X, Peng T
Received 25 May 2017
Accepted for publication 12 August 2017
Published 12 September 2017 Volume 2017:10 Pages 4493—4506
DOI https://doi.org/10.2147/OTT.S142557
Checked for plagiarism Yes
Review by Single anonymous peer review
Peer reviewer comments 3
Editor who approved publication: Dr Yao Dai
Xiwen Liao,1,* Ketuan Huang,1,* Rui Huang,2 Xiaoguang Liu,1,3 Chuangye Han,1 Long Yu,1,4 Tingdong Yu,1 Chengkun Yang,1 Xiangkun Wang,1 Tao Peng1
1Department of Hepatobiliary Surgery, The First Affiliated Hospital of Guangxi Medical University, 2Department of Hematology, The First Affiliated Hospital of Guangxi Medical University, Nanning, 3Department of Hepatobiliary Surgery, Affiliated Hospital of Guangdong Medical University, Zhanjiang, 4Department of Hepatobiliary and Pancreatic Surgery, The First Affiliated Hospital of Zhengzhou University, Zhengzhou, China
*These authors contributed equally to this work
Background: Molecular analysis is a promising source of clinically useful prognostic biomarkers. The aim of this investigation was to identify prognostic biomarkers for patients with early-stage pancreatic ductal adenocarcinoma (PDAC) after pancreaticoduodenectomy.
Methods: An RNA sequencing dataset of PDAC was obtained from The Cancer Genome Atlas. Survival analysis and weighted gene co-expression network analysis were used to investigate the prognostic markers of early-stage PDAC after pancreaticoduodenectomy.
Results: Using whole genome expression level screening, we identified 1,238 markers that were related to the prognosis of PDAC after pancreaticoduodenectomy, and identified 9 hub genes (ARHGAP30, HCLS1, CD96, FAM78A, ARHGAP15, SLA2, CD247, GVINP1, and IL16) using the weighted gene co-expression network analysis approach. We also constructed a signature comprising the 9 hub genes and weighted by the regression coefficient derived from a multivariate Cox proportional hazards regression model to divide patients into a high-risk group, with increased risk of death, and a low-risk group, with significantly improved overall survival (adjusted P=0.026, adjusted HR =0.513, 95% CI =0.285–0.924). The prognostic signature of the 9 genes demonstrated good performance for predicting 1-year overall survival (area under the respective receiver operating characteristic curves =0.641).
Conclusion: Our results have provided a new prospect for prognostic biomarkers of PDAC after pancreaticoduodenectomy, and may have a value in clinical application.
Keywords: prognostic, pancreatic ductal adenocarcinoma, TCGA, WGCNA, pancreaticoduodenectomy
Introduction
Pancreatic cancer is a highly lethal malignant tumor. The major histological type of pancreatic cancer is pancreatic ductal adenocarcinoma (PDAC) accounting for >80% of total cases.1–3 The Chinese National Cancer Center estimated that in 2015, about 90,100 Chinese would be newly diagnosed with pancreatic cancer and 79,400 would die of the disease, with mortality rates showing a rising trend in the Chinese male population.4 The age-standardized 5-year survival rate in patients with pancreatic cancer remains as low as 11.7% in China.5 However, pancreatic cancer is also one of the most aggressive malignancies with an estimated overall 5-year survival rate of <7%, and the fourth leading cause of cancer death in the USA.6 The high mortality rate can be attributed to multiple factors, the most important factor of which is that most patients with pancreatic cancer are often diagnosed at the advanced stage and cannot undergo surgery.7,8 Even after potentially curative resection, most patients will eventually have a recurrence. Because of the growing incidence, late diagnosis, and insufficient treatment options, it is necessary to investigate early diagnostic and prognostic markers of pancreatic cancer and apply them in treatment guidance and patient management.
Treatment of pancreatic cancer includes surgical resection, chemotherapy, radiation therapy, and palliative care. Indeed, surgery is the only option to permanently remove or cure pancreatic cancer, but only 15%–20% of patients are eligible for surgical resection at the time of initial diagnosis. Radical surgical resection with adjuvant chemotherapy or chemo-radiotherapy is the most effective treatment for PDAC. Treatment options are selected depending on the stage of pancreatic cancer in a multidisciplinary approach.7,9 In addition, pancreaticoduodenectomy, also known as the Whipple procedure, has become a commonly performed operation with a low hospital mortality and has become an effective operation for pancreatic cancer in those patients that are node-negative with a negative tumor margin.10
Previous studies have demonstrated that tumor size and histological grade, lymph node status, resection margins and vascular or neural invasion are the prognostic factors of pancreatic cancer.11 Furthermore, a number of molecular markers have also been identified as potential prognostic markers for pancreatic cancer, and molecular analysis is a promising source of clinically useful prognostic biomarkers.12 These could be involved in pancreatic tumor growth, apoptosis, angiogenesis, invasion, and resistance to chemotherapy.12 The purpose of the present study was to investigate the prognostic markers for patients with early-stage PDAC after pancreaticoduodenectomy by using whole genome expression profile dataset. By searching the public expression profile database, we found that the dataset of pancreatic cancer in The Cancer Genome Atlas (TCGA) database could satisfy our study requirements.
Materials and methods
Data source and pre-processing
An RNA sequencing dataset of pancreatic cancer patients was obtained from TCGA (https://tcga-data.nci.nih.gov/), while the corresponding survival profiles and clinical features were obtained from the University of California Santa Cruz (UCSC) Xena (http://xena.ucsc.edu/). The raw dataset of RNA sequencing was normalized by the DESeq package in the R platform.13
Inclusion and exclusion criteria
The inclusion criteria of study patients were as follows: 1) complete survival data available; 2) the histology type was PDAC, 3) American Joint Committee on Cancer (AJCC 7th) stage I or II; and 4) patients underwent pancreaticoduodenectomy. PDAC patients with stage III or IV disease and those who underwent other types of surgery were excluded.
Identification of prognosis-related genes
Survival analyses were conducted on patients with normalized mRNA expression and overall survival (OS) profiles. Patients were divided into low- and high-expression groups according to the gene expression median value. Multivariate Cox proportional hazards regression analysis was applied to estimate survival in the study sample by using the survival package in the R platform, and the low expression group was set as a reference group. An adjusted P-value cutoff of 0.05 was considered statistically significant and used to identify prognosis-related genes.
Weighted gene co-expression network analysis (WGCNA) and hub gene detection
WGCNA, an R package for weighted correlation network analysis,14 was used for co-expression analysis of genes and for screening hub genes in the current study. An appropriate soft threshold power was selected in accordance with standard scale-free distribution, with which adjacencies between all input genes were calculated by a power function.15 Based on the selected soft threshold power, and by using clustering in combination with the topological overlap matrix (TOM) in module detection analysis, we selected the number of genes in each module with a minimum threshold of 20, setting a cutoff height of 0.8. Then, the threshold of weighted co-expression correlation coefficient between 2 genes >0.4 was exported for hub gene screening and weighted co-expression network construction. The degree of a node was defined as the number of connections or edges the node has to other nodes in a network. The node degree represented the overall strength of connections between a given node and all of the other nodes in a network and was used for screening the hub genes.
Construction of prognostic model and receiver operating characteristic curve
Furthermore, we utilized the hub genes that were derived from the WGCNA analysis to construct a prognostic model. A prognosis risk score was established on the basis of a linear combination of gene expression level multiplied by a regression coefficient (β) as the weight that was derived from a multivariate Cox proportional hazards regression model, adjusted for the hub genes’ expression and clinical features, with the following formula: Risk score = expression of Gene1 × β1Gene1 + expression of Gene2 × β2Gene2 +…expression of Genen × βnGenen.16,17 The time-dependent receiver operating characteristic (ROC) curve analysis was performed by using the survival ROC package in the R platform to evaluate the predictive accuracy of our prognostic model for time-dependent cancer death.18
Functional assessment
The Database for Annotation, Visualization and Integrated Discovery (DAVID; https://david.ncifcrf.gov/home.jsp) v6.8 is a comprehensive set of functional annotation tools to understand the biological meaning of specified genes.19,20 Gene ontology (GO) terms and Kyoto Encyclopedia of Genes and Genomes (KEGG) pathway enrichment analysis were carried out using DAVID. An enrichment P-value <0.05 was considered statistically significant.
Statistical analysis
A multivariate Cox proportional hazards regression model was used for calculating the clinical outcome between different gene expression groups. Hazard ratio (HR) and 95% CI were calculated from the multivariate Cox proportional hazards regression model after adjusting for pathologic stage, histologic grade, radical resection, radiation therapy and targeted molecular therapy. The heat map of genes was constructed using the ggplot2 package in the R platform. The weighted co-expression networks were constructed using the Cytoscape software (version 3.4.0; http://www.cytoscape.org/), a biomolecular interaction networks platform.21 A value of P<0.05 was considered statistically significant. All statistical analyses were conducted with SPSS version 20.0 (IBM Corporation, Armonk, NY, USA) and R 3.3.0 (https://mirrors.tuna.tsinghua.edu.cn/CRAN/).
Results
Study population
An RNA sequencing dataset of 177 patients was downloaded from the TCGA, and the corresponding survival profiles were obtained from the UCSC Xena. By performing our inclusion and exclusion criteria, 112 early-stage PDAC patients that underwent pancreaticoduodenectomy were included in further analysis. Of these patients, only 8 were stage I, while the remaining were stage II. The histologic grade of PDAC was significantly associated with OS (log-rank P=0.034). There were 66 (59%) patients who received a radical resection and with a significantly long median survival time (MST: radical resection vs non-radical resection, 691 vs 473 days; log-rank P=0.009, Table 1). Patients received radiation therapy (log-rank P=0.029, HR =0.527, 95% CI =0.293–0.947, Table 1) and targeted molecular therapy (log-rank P<0.001, HR =0.168, 95% CI =0.095–0.296, Table 1) had significantly decreased risk of death in PDAC, respectively.
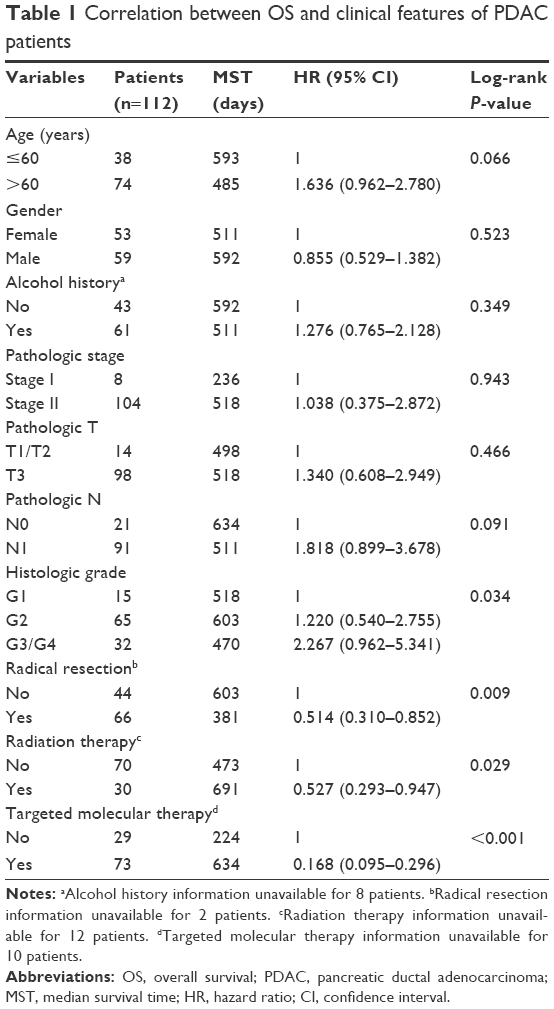 | Table 1 Correlation between OS and clinical features of PDAC patients |
Prognosis-related genes screening
Early-stage PDAC patients (n=112) that underwent pancreaticoduodenectomy with complete follow-up data were included in further survival analyses. A multivariate Cox proportional hazards regression model after being adjusted for pathologic stage, histologic grade, radical resection, radiation therapy and targeted molecular therapy was performed using the survival package in R platform. A total of 1,238 genes with an adjusted P-value <0.05 were identified as prognosis-related genes for early-stage PDAC after pancreaticoduodenectomy (Table S1). The heat map of all prognosis-related genes is shown in Figure S1. Among these prognosis-related genes, several of them have already been identified as pancreatic cancer prognosis-related genes in previous studies, such as C-X-C motif chemokine receptor 4 (CXCR4, adjusted P=0.032, HR =0.523, 95% CI =0.289–0.947),22–24 XIAP-associated factor 1 (XAF1, adjusted P=0.048, HR =1.738, 95% CI =1.00–3.01),25 interleukin 18 (IL18, adjusted P=0.036, HR =1.851, 95% CI =1.04–3.29),26 and secreted protein acidic and cysteine rich (SPARC, adjusted P=0.012, HR =0.0487, 95% CI =0.277–0.855).27–30
Weighted gene co-expression network analysis
WGCNA was used for co-expression analysis and hub gene screening. The appropriate soft threshold power beta was set to 3 based on the soft threshold screening by PickSoftThreshold function (Figure 1A and B). A total of 4 modules were revealed using the cuttreeStaticColor function from the WGCNA package (cutHeight =0.8; minSize =20), and the number of genes in the module ranged from 20 to 1,086 (Table S2; Figure 1C). In addition, the gray module represents a gene set that is not assigned to any of the modules, containing 1,086 genes. TOM plot was generated by the TOMplot function from the WGCNA package (Figure 1D). Then, the value of weighted co-expression coefficient between 2 genes >0.4 was exported for weighted co-expression network construction by the Cytoscape software (Figure 2). Weighted co-expression network construction was also performed in modules (Figures 3 and 4A–C). The heat map of the turquoise module is shown in Figure 5.
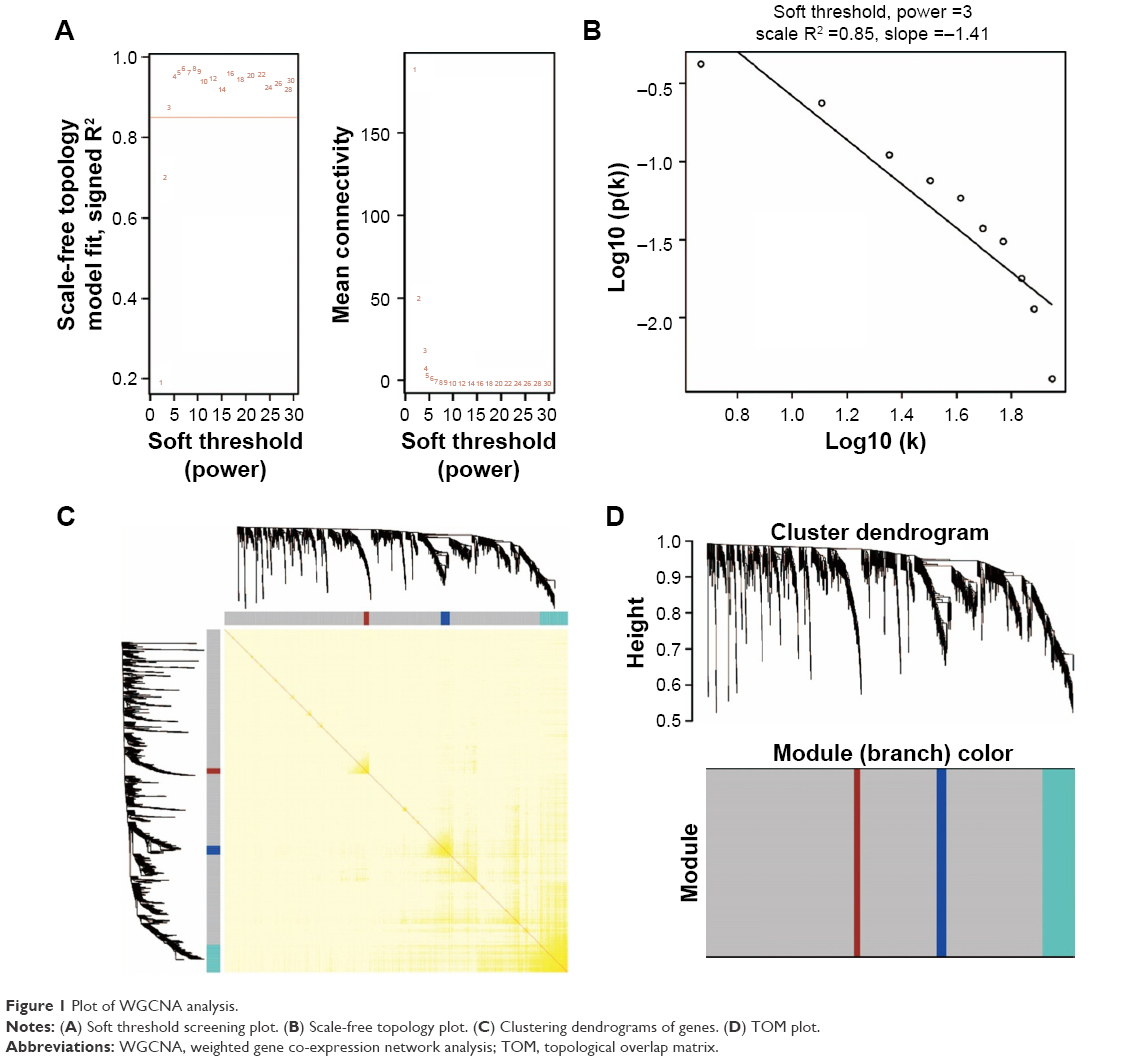 | Figure 1 Plot of WGCNA analysis. |
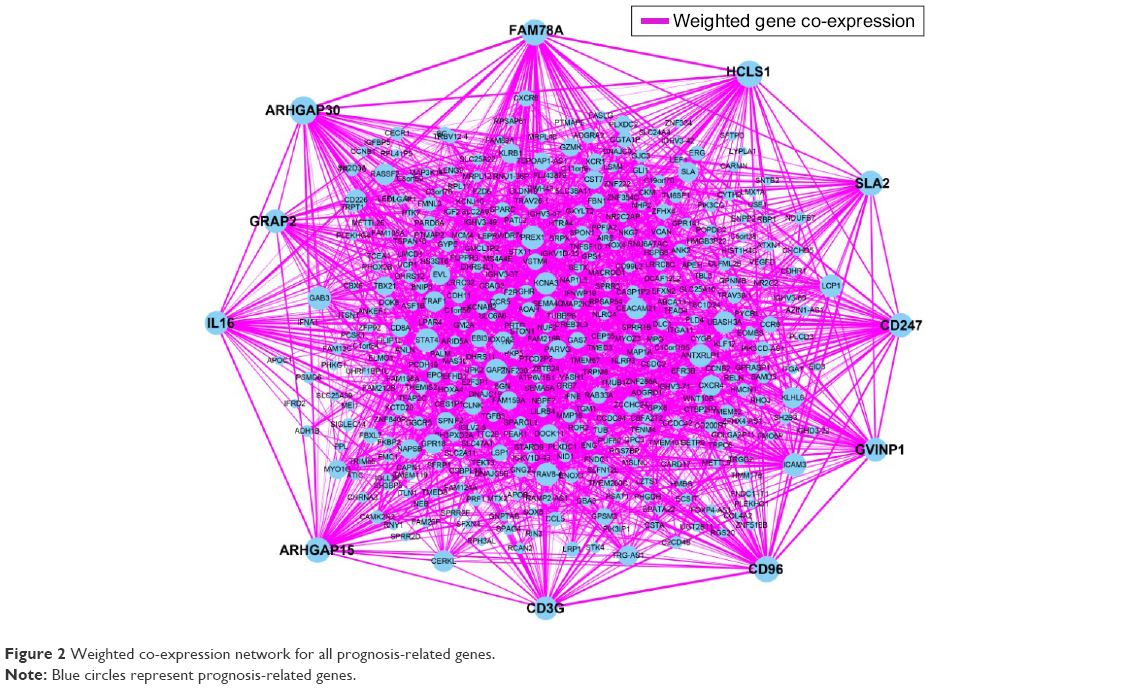 | Figure 2 Weighted co-expression network for all prognosis-related genes. |
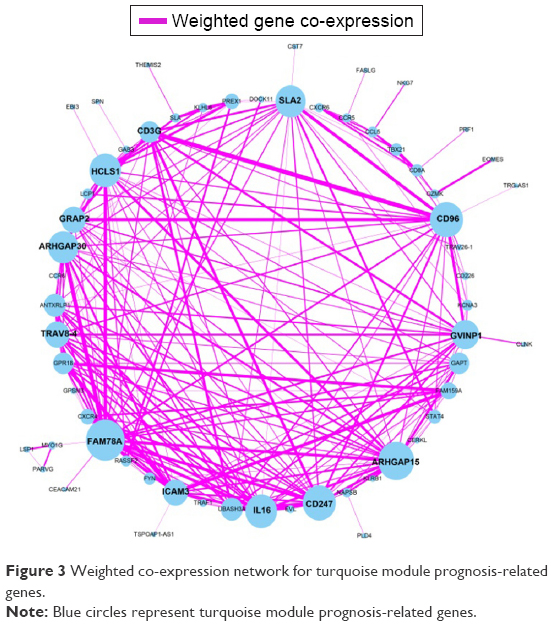 | Figure 3 Weighted co-expression network for turquoise module prognosis-related genes. |
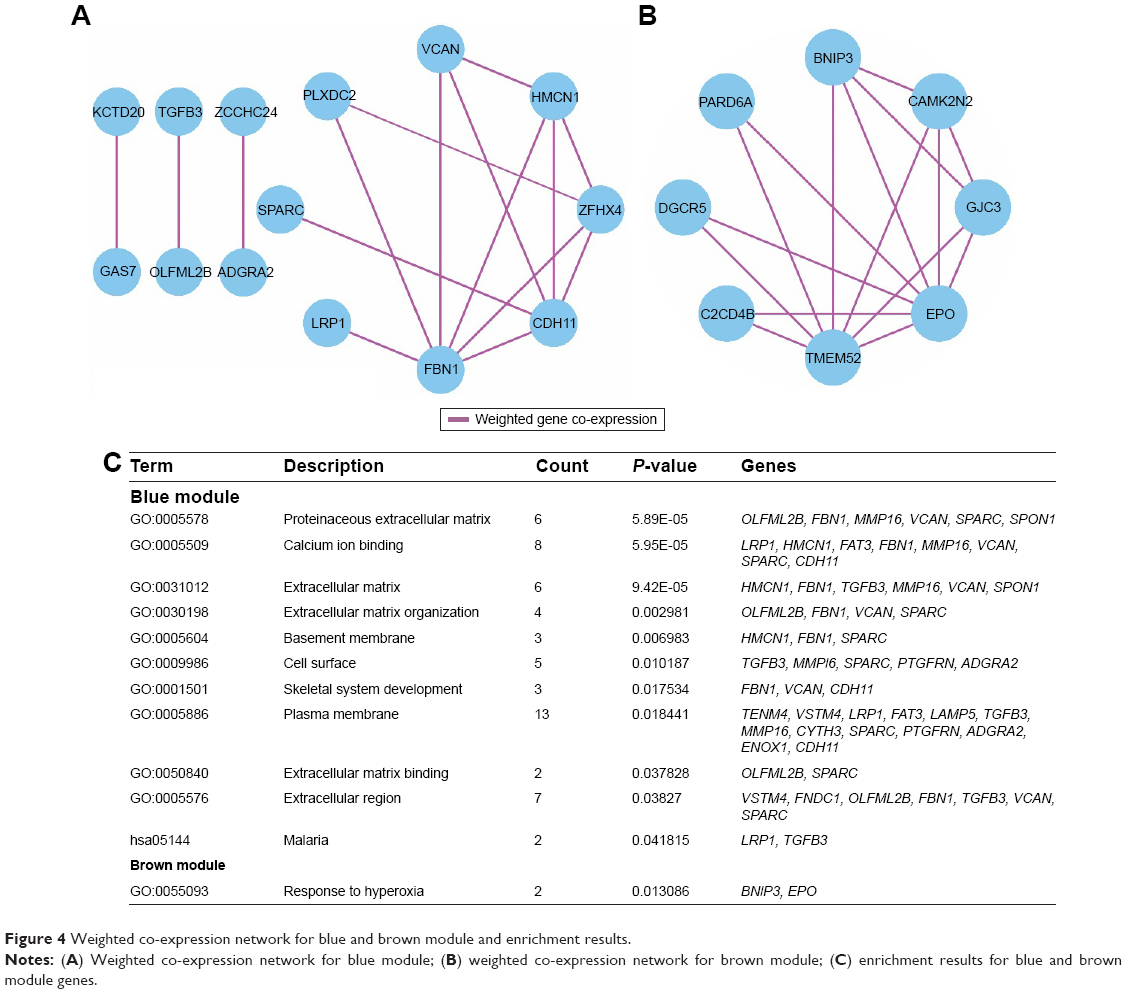 | Figure 4 Weighted co-expression network for blue and brown module and enrichment results. |
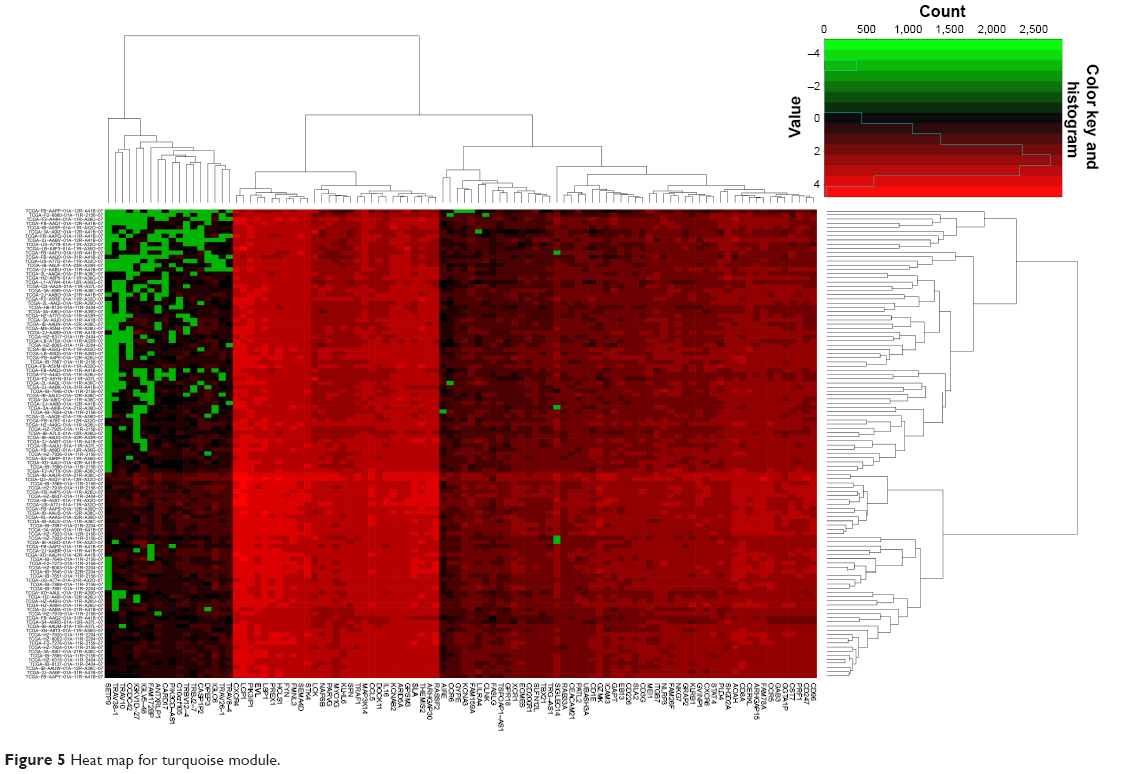 | Figure 5 Heat map for turquoise module. |
The weighted co-expression networks of all potential prognosis-related genes and genes in the turquoise module were used for hub gene screening, and the top 10 node degree genes at the intersection of 2 interactome networks were identified as hub genes. We identified 9 genes as hub genes (Table 2; Figure 6A–I): Rho GTPase-activating protein 30 (ARHGAP30), hematopoietic cell-specific Lyn substrate 1 (HCLS1), CD96 molecule (CD96), family with sequence similarity 78 member A (FAM78A), Rho GTPase-activating protein 15 (ARHGAP15), Src-like adaptor 2 (SLA2), CD247 molecule (CD247), GTPase, very large interferon-inducible pseudogene 1 (GVINP1) and interleukin 16 (IL16). The highest node degree of all prognosis-related genes and turquoise module networks was ARHGAP30 with a node degree of 69 and FAM78A with a node degree of 25 (Table 2), respectively.
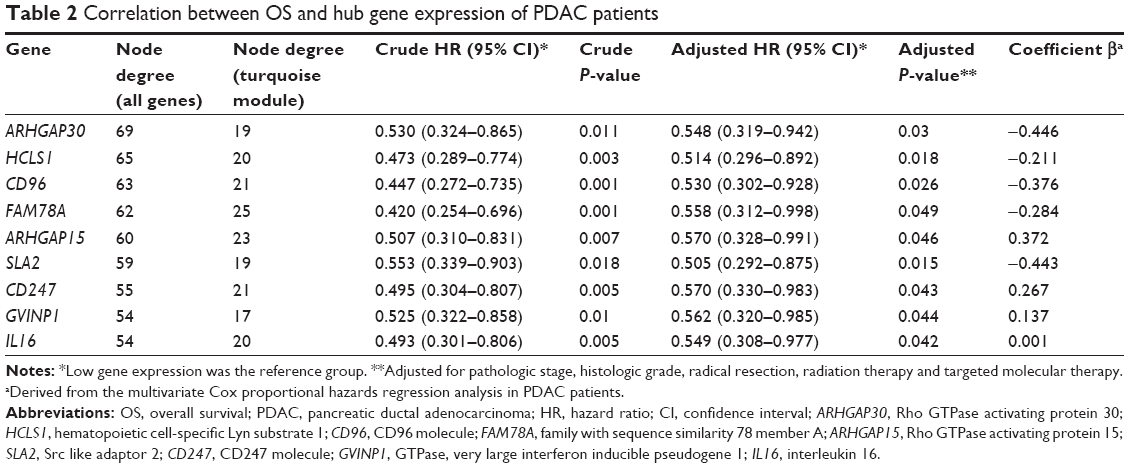 | Table 2 Correlation between OS and hub gene expression of PDAC patients |
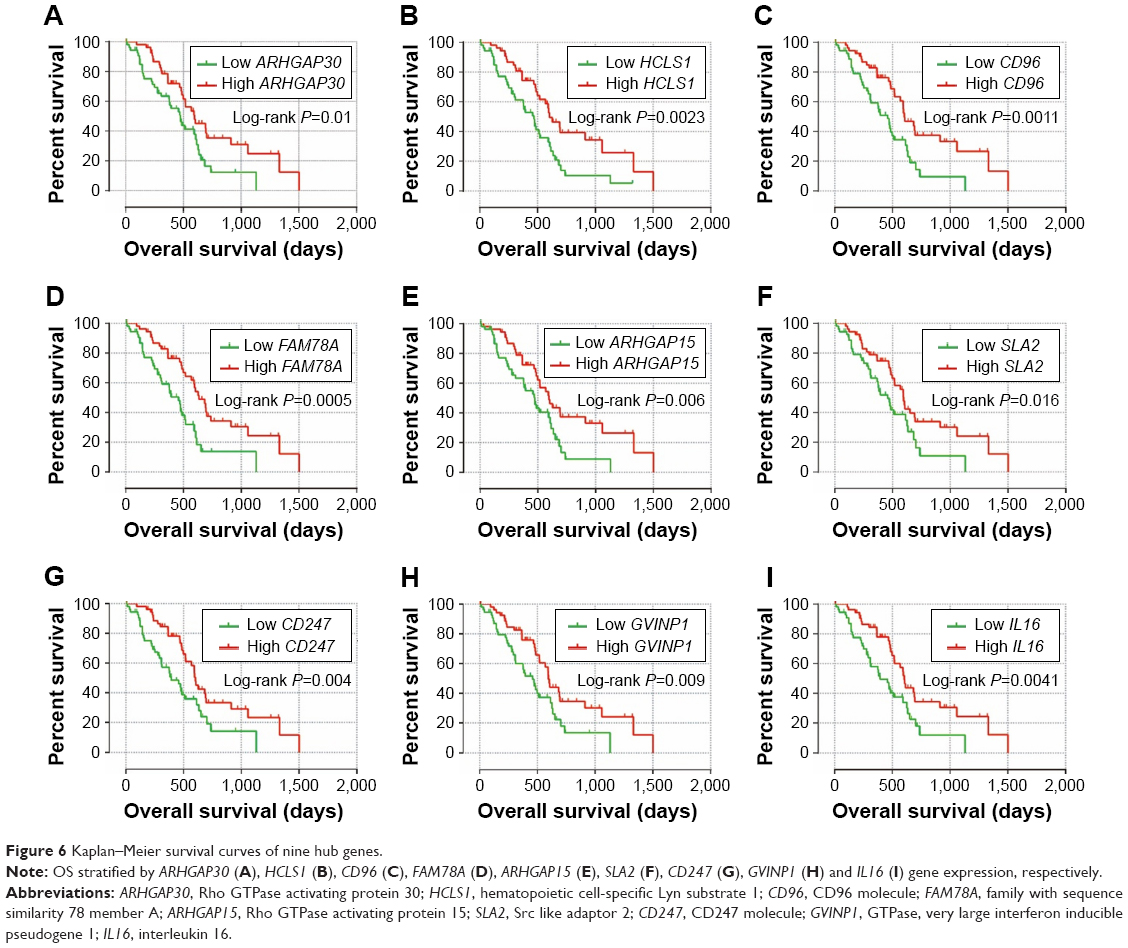 | Figure 6 Kaplan–Meier survival curves of nine hub genes. |
Prognostic model construction and ROC curve analysis
We further investigated the co-expression relationship among the hub genes and observed that these genes had a strong positive correlation with each other (Table 3). Patients were divided into 2 groups according to the median cutoff of the prognosis risk score from the formula (Figure 7A): Risk score = expression of ARHGAP30 × (−0.446) + expression of HCLS1 × (−0.211) + expression of CD96 × (−0.376) + expression of FAM78A × (−0.284) + expression of ARHGAP15 × (0.372) + expression of SLA2 × (−0.443) + expression of CD247 × (0.267) + expression of GVINP1 × (0.137) + expression of IL16 × (0.001). Survival analysis indicates that patients with a low-risk score have a significantly longer MST than those with a high-risk score (log-rank P=0.0038; 603 vs 458 days for low risk vs high risk; Figure 7B), and a significantly decreased risk of death (adjusted P=0.026, HR =0.513, 95% CI =0.285–0.924; Table 4; Figure 7B). This risk score also demonstrated a prognosis prediction on early-stage PDAC after pancreaticoduodenectomy, as the area under ROC curve (AUC) was 0.641, 0.623, and 0.554 for 1, 3 and 5 years (Figure 7C), respectively. This prognostic signature of the 9 genes showed a good performance in clinical outcome prediction for the 1-year survival of PDAC patients. The expression level distribution of the 9 genes in the low- and high-risk group is also presented in Figure 8.
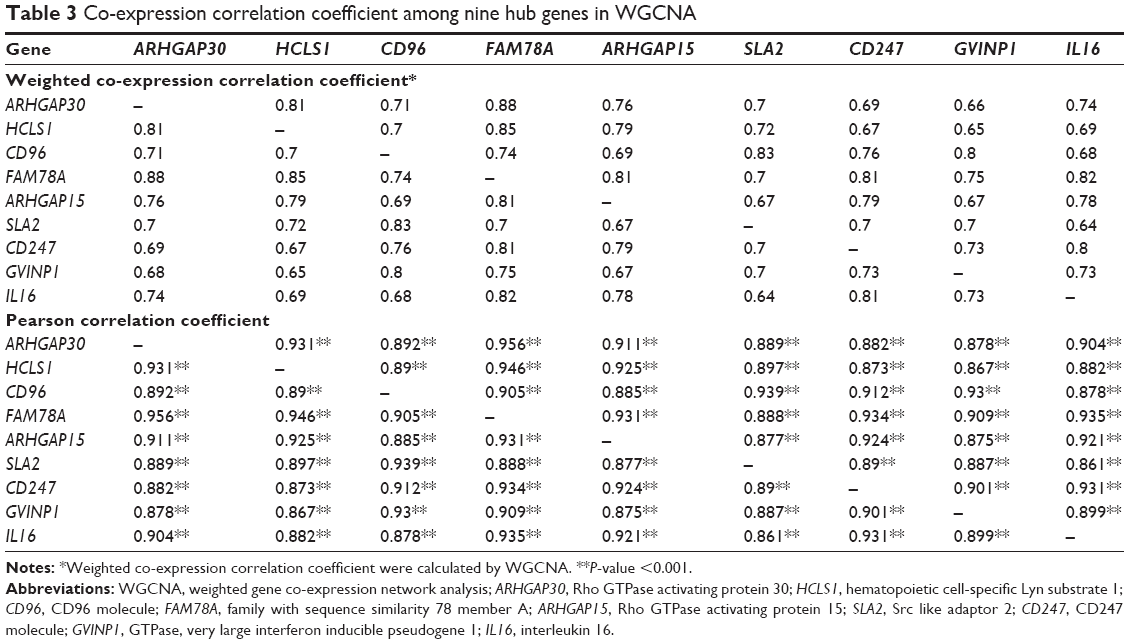 | Table 3 Co-expression correlation coefficient among nine hub genes in WGCNA |
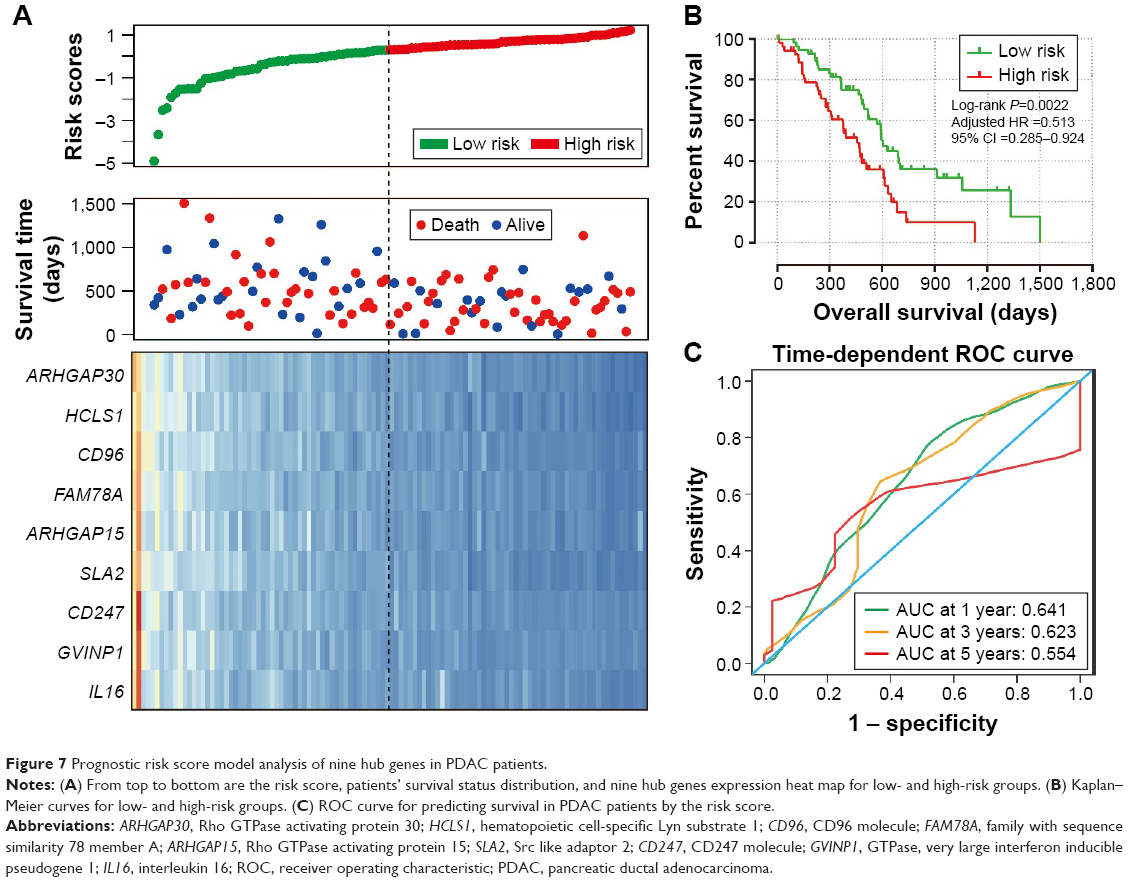 | Figure 7 Prognostic risk score model analysis of nine hub genes in PDAC patients. |
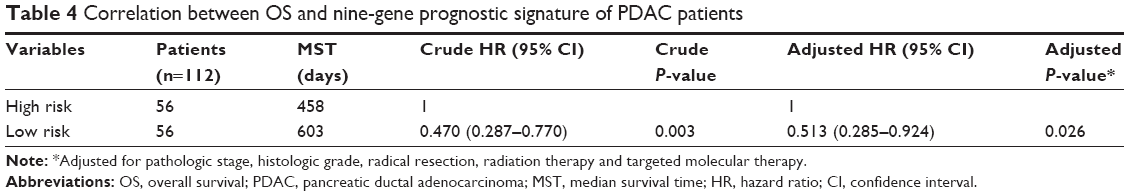 | Table 4 Correlation between OS and nine-gene prognostic signature of PDAC patients |
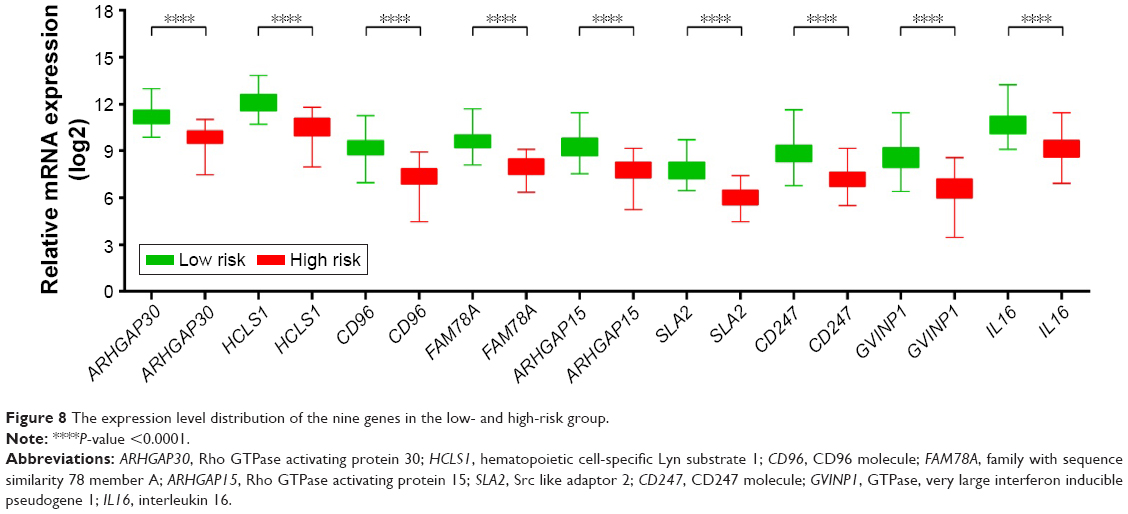 | Figure 8 The expression level distribution of the nine genes in the low- and high-risk group. |
Functional assessment
Enrichment analysis was performed in modules and for all prognosis-related genes. Enrichment analysis for all prognosis-related genes suggested that these genes were significantly involved in cell adhesion, regulation of cytokine production, positive regulation of cell migration and hepatocyte apoptotic biological processes, and cytokine–cytokine receptor interaction, PI3K-Akt signaling pathway, FoxO signaling pathway, Hippo signaling pathway, Rap1 signaling pathway, chemokine signaling pathway and Ras signaling pathway (Figure 9A and B). Enrichment analysis indicated that regulation of the immune response and PI3K signaling, T cell co-stimulation, chemokine-mediated signaling pathway, T cell differentiation, T cell migration, T cell receptor signaling pathway, T cell activation and cell adhesion biological processes were involved in turquoise module, whereas KEGG showed that these genes were enriched in the T cell receptor signaling pathway, Chemokine signaling pathway, cytokine–cytokine receptor interaction, natural killer cell-mediated cytotoxicity and the cell adhesion molecule (CAM) signaling pathway (Figure 10A and B). Enrichment analyses for blue and brown modules correlated with calcium ion binding and extracellular matrix, while brown module genes were related to the hyperoxia response (Figure 4C).
 | Figure 9 GO and KEGG enrichment results of all prognosis-related genes. |
 | Figure 10 GO and KEGG enrichment results of turquoise module genes. |
Discussion
The prognosis of PDAC is determined by the interaction of multivariate factors, such as clinical factors, tumor biological characteristics and genetic factors. Pancreatic stump closure and pancreatic fistula after pancreatoduodenectomy may have affected the patients’ prognosis,31,32 as well as the tumor’s biological characteristics, such as tumor size and histological grade, lymph node status, vascular or neural invasion.11 In addition, it has already been substantiated that genetic factors in pancreatic cancer may play a critical role in tumor occurrence, development, and prognosis.7,12,33 Due to the high mortality rate of pancreatic cancer, it is necessary to investigate reliable prognostic markers in order to select a subset of patients that would benefit from additional treatment options to improve survival. RNA sequencing can investigate the gene functions at the whole genome-scale level, whereas the WGCNA is a method of systems biology for describing the correlation patterns among genes across microarray samples.14 Our current study used an RNA sequence dataset of patients receiving pancreaticoduodenectomy to identify 1238 genes that were associated with PDAC prognosis, then we used WGCNA to investigate a hub of genes among these prognosis-related genes. Through the WGCNA assessment, we identified 9 hub genes among the prognosis-related gene co-expression networks and constructed a 9-gene signature consisting of ARHGAP30, HCLS1, CD96, FAM78A, ARHGAP15, SLA2, CD247, GVINP1 and IL16, which was validated as an independent predictor for PDAC patient survival. The AUC of a survival ROC curve for the 9-gene signature in predicting 1-year survival was 0.633. This 9-gene signature showed a good performance in predicting the 1-year survival of PDAC patients and may have further potential in predicting the prognosis in patients with PDAC after pancreaticoduodenectomy to reveal targets for the development of therapy.
The high expression of all the 9 genes was associated with a favorable prognosis of PDAC patients; however, the role of these genes in PDAC prognosis has not been reported in previous studies. It is worth noting that several of these genes have already been reported to be associated with the prognosis of cancer disease. Work by Wang et al revealed that ARHGAP30 promotes p53 acetylation, and low expression of ARHGAP30 was associated with unfavorable prognosis in colorectal cancer patients, consistent with our results of ARHGAP30 in PDAC patients’ survival.34 In previous studies, the expression of another hub gene, IL16, appeared to be a useful prognostic biomarker in patients with multiple myeloma and prostate cancer,35,36 while polymorphisms in IL16 also showed a correlation with clinical outcome in prostate cancer and non-small cell lung cancer.37,38 In addition, a study has demonstrated that the expression of HCLS1 plays a central role in lymphocyte trafficking and homing regulation, and influences tissue invasion and infiltration in chronic lymphocytic leukemia (CLL).39 Furthermore, HCLS1 was notably up-regulated in CLL patients compared with healthy subjects, and high expression of HCLS1 and its phosphorylation in CLL were significantly correlated with poor survival, respectively.40–42 The prognostic prediction value of gene expression in CLL can also be observed in CD247 by using gene co-expression network analysis.43 A study by Arai et al indicated that DNA methylation alteration of FAM78A combined with the DNA methylation of other genes alteration at precancerous stages can be used to identified tumor aggressiveness and patient outcome in clear cell renal cell carcinomas.44 No studies have reported a correlation of the 4 remaining genes, CD96, SLA2, GVINP1, and ARHGAP15, with the prognosis of cancer.
We also performed functional enrichment analysis for these prognosis-related genes in order to identify potential biological processes and pathways that are associated with PDAC prognosis. Cell adhesion was the most significant biological process in GO enrichment analysis of all prognosis-related genes and was also the significant GO enrichment in turquoise module genes. In addition, the turquoise module was also significantly enriched in the CAM pathway. Numerous studies have demonstrated that the altered expression of adhesion molecules is associated with pancreatic cancer invasion and metastasis.45,46 CAMs also serve as predictive biomarkers for pancreatic cancer prognosis.47,48 Expanding evidence reveals that the Rap1 signaling pathway was associated with cell adhesion49 and that Rap1 activation is required for epidermal growth factor receptor-mediated metastasis in pancreatic cancer.50 KEGG enrichment results of all the prognosis-related genes suggested that PI3K-Akt, Ras, cytokine–cytokine receptor interaction, and FoxO signaling pathway were associated with PDAC prognosis. Evidence shows that PI3K-Akt and the Ras signaling pathway can serve as a potential targeted therapy for pancreatic cancer.51,52 Bioinformatics analysis in the comparison of pancreatic cancer patients and healthy subjects identified that cytokine–cytokine receptor interaction and the FoxO signaling pathway play a role in the occurrence of pancreatic cancer.53,54
The most significant biological process in the GO enrichment analysis of the turquoise module genes was the regulation of the immune response, while the most significant pathway in KEGG enrichment analysis was the T cell receptor signaling pathway. Furthermore, biological processes of turquoise module genes were also significantly involved in T cell co-stimulation, differentiation, migration, activation, and the T cell receptor signaling pathway. The latest research argues that spatial computation of intratumoral T cells correlates with pancreatic cancer prognosis,55 and the level of T cells have a prognostic prediction value that can be considered an independent prognostic factor for pancreatic cancer.56–58 In addition, a high degree of infiltration of both CD4+ and CD8+ T cells around tumor cells seems to be associated with favorable prognosis and a high prevalence of regulatory T cells can serve as an independent negative predictive factor of PDAC.30,59,60
There were limitations in our study that need to be recognized. First, the clinical information from the TCGA database was not comprehensive, and the detailed information of some clinical treatment regimens also could not be obtained, such as the detailed information of radiation and targeted molecular therapy. Therefore, our study evaluates the association between gene expression level and OS based on a multivariate survival analysis that was only adjusted for pathologic stage, histologic grade, radical resection, radiation therapy and targeted molecular therapy in the multivariate Cox proportional hazards regression model. In addition, due to the incomplete clinical information in the present study, we could not analyse the joint effect between this 9-gene prognostic signature and the prognostic model that was constructed using only clinical data.61–63 Second, the TCGA PDAC cohort had a relatively short follow-up period (median follow-up of 518 days) and the censored rate was high, which may have affected the reliability of the Kaplan–Meier estimates. Third, patients in our study were exclusively from a single source, and the development and assessment of this prognostic model still have certain limitations. Independent external validation datasets with long-term follow-up and complete clinical information to provide a realistic assessment of the performance of this gene signature would be more reliable.
Despite these limitations, our current study has identified 1,238 prognostic markers via a whole genome expression level screening and 9 hub genes by using a bioinformatics method. We then constructed a 9-gene prognostic signature of early-stage PDAC. These findings provide insight into prognosis-related genes of PDAC and may have a clinical utility for prognosis prediction and decision-making in PDAC management.
Conclusions
On the basis of whole genome expression level screening, we identified 1,238 markers that are related to the prognosis of PDAC after pancreaticoduodenectomy and selected 9 genes among these prognosis-related genes by using a WGCNA analysis. In addition, we also succeeded in identifying a gene signature comprising 9 hub genes (ARHGAP30, HCLS1, CD96, FAM78A, ARHGAP15, SLA2, CD247, GVINP1, and IL16), which helped to classify patients into a high-risk group that had increased risk of death, and a low-risk group that had significantly improved OS. The independent prognostic model demonstrated a good performance in the clinical 1-year survival prediction for PDAC patients and can be used for prognosis prediction indicators in PDAC patients after pancreaticoduodenectomy. Due to the limitations in the present study, our findings still need to be verified in a future large cohort study.
Acknowledgments
This work was supported in part by the National Nature Science Foundation of China (No: 81560535, 81072321, 30760243, 30460143 and 30560133), 2009 Program for New Century Excellent Talents in University (NCET), Guangxi Nature Sciences Foundation (No: GuiKeGong 1104003A-7), and Guangxi Health Ministry Medicine Grant (Key-Scientific Research-Grant Z201018). Self-raised Scientific Research Fund of the Health and Family Planning Commission of Guangxi Zhuang Autonomous Region (Z2016318). The authors thank the contributors of TCGA for sharing the PDAC data on open access. In addition, we also would like to acknowledge the helpful comments on this paper received from our reviewers.
Disclosure
The authors report no conflicts of interest in this work.
References
Seufferlein T, Bachet JB, Van Cutsem E, Rougier P, Group EGW. Pancreatic adenocarcinoma: ESMO-ESDO Clinical Practice Guidelines for diagnosis, treatment and follow-up. Ann Oncol. 2012;23 (Suppl 7):vii33–vii40. | ||
Siegel R, Ma J, Zou Z, Jemal A. Cancer statistics, 2014. CA Cancer J Clin. 2014;64(1):9–29. | ||
Torre LA, Bray F, Siegel RL, Ferlay J, Lortet-Tieulent J, Jemal A. Global cancer statistics, 2012. CA Cancer J Clin. 2015;65(2):87–108. | ||
Chen W, Zheng R, Baade PD, et al. Cancer statistics in China, 2015. CA Cancer J Clin. 2016;66(2):115–132. | ||
Zeng H, Zheng R, Guo Y, et al. Cancer survival in China, 2003–2005: a population-based study. Int J Cancer. 2015;136(8):1921–1930. | ||
Siegel RL, Miller KD, Jemal A. Cancer statistics, 2016. CA Cancer J Clin. 2016;66(1):7–30. | ||
Kamisawa T, Wood LD, Itoi T, Takaori K. Pancreatic cancer. Lancet. 2016;388(10039):73–85. | ||
Hidalgo M. Pancreatic cancer. N Engl J Med. 2010;362(17):1605–1617. | ||
Vincent A, Herman J, Schulick R, Hruban RH, Goggins M. Pancreatic cancer. Lancet. 2011;378(9791):607–620. | ||
Cameron JL, Riall TS, Coleman J, Belcher KA. One thousand consecutive pancreaticoduodenectomies. Ann Surg. 2006;244(1):10–15. | ||
Garcea G, Dennison AR, Pattenden CJ, Neal CP, Sutton CD, Berry DP. Survival following curative resection for pancreatic ductal adenocarcinoma. A systematic review of the literature. JOP. 2008;9(2):99–132. | ||
Ansari D, Rosendahl A, Elebro J, Andersson R. Systematic review of immunohistochemical biomarkers to identify prognostic subgroups of patients with pancreatic cancer. Br J Surg. 2011;98(8):1041–1055. | ||
Anders S, Huber W. Differential expression analysis for sequence count data. Genome Biol. 2010;11(10):R106. | ||
Langfelder P, Horvath S. WGCNA: an R package for weighted correlation network analysis. BMC Bioinformatics. 2008;9:559. | ||
Zhang B, Horvath S. A general framework for weighted gene co-expression network analysis. Stat Appl Genet Mol Biol. 2005;4:Article17. | ||
Zhou M, Zhao H, Wang Z, et al. Identification and validation of potential prognostic lncRNA biomarkers for predicting survival in patients with multiple myeloma. J Exp Clin Cancer Res. 2015;34:102. | ||
Zhou X, Huang Z, Xu L, et al. A panel of 13-miRNA signature as a potential biomarker for predicting survival in pancreatic cancer. Oncotarget. 2016;7(43):69616–69624. | ||
Heagerty PJ, Zheng Y. Survival model predictive accuracy and ROC curves. Biometrics. 2005;61(1):92–105. | ||
Huang da W, Sherman BT, Lempicki RA. Systematic and integrative analysis of large gene lists using DAVID bioinformatics resources. Nat Protoc. 2009;4(1):44–57. | ||
Huang da W, Sherman BT, Lempicki RA. Bioinformatics enrichment tools: paths toward the comprehensive functional analysis of large gene lists. Nucleic Acids Res. 2009;37(1):1–13. | ||
Shannon P, Markiel A, Ozier O, et al. Cytoscape: a software environment for integrated models of biomolecular interaction networks. Genome Res. 2003;13(11):2498–2504. | ||
Marechal R, Demetter P, Nagy N, et al. High expression of CXCR4 may predict poor survival in resected pancreatic adenocarcinoma. Br J Cancer. 2009;100(9):1444–1451. | ||
Marchesi F, Monti P, Leone BE, et al. Increased survival, proliferation, and migration in metastatic human pancreatic tumor cells expressing functional CXCR4. Cancer Res. 2004;64(22):8420–8427. | ||
Liao WC, Wang HP, Huang HY, et al. CXCR4 expression predicts early liver recurrence and poor survival after resection of pancreatic adenocarcinoma. Clin Transl Gastroenterol. 2012;3:e22. | ||
Huang J, Yao WY, Zhu Q, et al. XAF1 as a prognostic biomarker and therapeutic target in pancreatic cancer. Cancer Sci. 2010;101(2):559–567. | ||
Carbone A, Vizio B, Novarino A, et al. IL-18 paradox in pancreatic carcinoma: elevated serum levels of free IL-18 are correlated with poor survival. J Immunother. 2009;32(9):920–931. | ||
Sinn M, Sinn BV, Striefler JK, et al. SPARC expression in resected pancreatic cancer patients treated with gemcitabine: results from the CONKO-001 study. Ann Oncol. 2014;25(5):1025–1032. | ||
Han W, Cao F, Chen MB, et al. Prognostic value of SPARC in patients with pancreatic cancer: a systematic review and meta-analysis. PLoS One. 2016;11(1):e0145803. | ||
Infante JR, Matsubayashi H, Sato N, et al. Peritumoral fibroblast SPARC expression and patient outcome with resectable pancreatic adenocarcinoma. J Clin Oncol. 2007;25(3):319–325. | ||
Oikonomopoulos GM, Syrigos KN, Saif MW. Prognostic factors in pancreatic cancer. JOP. 2013;14(4):322–324. | ||
Mauriello C, Polistena A, Gambardella C, et al. Pancreatic stump closure after pancreatoduodenectomy in elderly patients: a retrospective clinical study. Aging Clin Exp Res. 2017;29 (Suppl 1):35–40. | ||
Conzo G, Gambardella C, Tartaglia E, et al. Pancreatic fistula following pancreatoduodenectomy. Evaluation of different surgical approaches in the management of pancreatic stump. Literature review. Int J Sur. 2015;21 (Suppl 1):S4–S9. | ||
Bailey P, Chang DK, Nones K, et al. Genomic analyses identify molecular subtypes of pancreatic cancer. Nature. 2016;531(7592):47–52. | ||
Wang J, Qian J, Hu Y, et al. ArhGAP30 promotes p53 acetylation and function in colorectal cancer. Nat Commun. 2014;5:4735. | ||
Atanackovic D, Hildebrandt Y, Templin J, et al. Role of interleukin 16 in multiple myeloma. J Natl Cancer Inst. 2012;104(13):1005–1020. | ||
Comperat E, Roupret M, Drouin SJ, et al. Tissue expression of IL16 in prostate cancer and its association with recurrence after radical prostatectomy. Prostate. 2010;70(15):1622–1627. | ||
Woods NT, Monteiro AN, Thompson ZJ, et al. Interleukin polymorphisms associated with overall survival, disease-free survival, and recurrence in non-small cell lung cancer patients. Mol Carcinog. 2015;54 (Suppl 1):E172–E184. | ||
Hughes L, Ruth K, Rebbeck TR, Giri VN. Genetic variation in IL-16 miRNA target site and time to prostate cancer diagnosis in African-American men. Prostate Cancer Prostatic Dis. 2013;16(4):308–314. | ||
Scielzo C, Bertilaccio MT, Simonetti G, et al. HS1 has a central role in the trafficking and homing of leukemic B cells. Blood. 2010;116(18):3537–3546. | ||
Butrym A, Majewski M, Dzietczenia J, Kuliczkowski K, Mazur G. High expression of hematopoietic cell specific Lyn substrate-1 (HS1) predicts poor survival of B-cell chronic lymphocytic leukemia patients. Leuk Res. 2012;36(7):876–880. | ||
Frezzato F, Gattazzo C, Martini V, et al. HS1, a Lyn kinase substrate, is abnormally expressed in B-chronic lymphocytic leukemia and correlates with response to fludarabine-based regimen. PLoS One. 2012;7(6):e39,902. | ||
Scielzo C, Ghia P, Conti A, et al. HS1 protein is differentially expressed in chronic lymphocytic leukemia patient subsets with good or poor prognoses. J Clin Invest. 2005;115(6):1644–1650. | ||
Zhang J, Xiang Y, Ding L, et al. Using gene co-expression network analysis to predict biomarkers for chronic lymphocytic leukemia. BMC. 2010;11 (Suppl 9):S5. | ||
Arai E, Chiku S, Mori T, et al. Single-CpG-resolution methylome analysis identifies clinicopathologically aggressive CpG island methylator phenotype clear cell renal cell carcinomas. Carcinogenesis. 2012;33(8):1487–1493. | ||
Principe M, Borgoni S, Cascione M, et al. Alpha-enolase (ENO1) controls alpha v/beta 3 integrin expression and regulates pancreatic cancer adhesion, invasion, and metastasis. J Hematol Oncol. 2017;10(1):16. | ||
Perl AK, Dahl U, Wilgenbus P, Cremer H, Semb H, Christofori G. Reduced expression of neural cell adhesion molecule induces metastatic dissemination of pancreatic beta tumor cells. Nat Med. 1999;5(3):286–291. | ||
Tsutsumi S, Morohashi S, Kudo Y, et al. L1 Cell adhesion molecule (L1CAM) expression at the cancer invasive front is a novel prognostic marker of pancreatic ductal adenocarcinoma. J Surg Oncol. 2011;103(7):669–673. | ||
Li H, Wang X, Fang Y, et al. Integrated expression profiles analysis reveals novel predictive biomarker in pancreatic ductal adenocarcinoma. Oncotarget. 2017. | ||
Bos JL. Linking Rap to cell adhesion. Curr Opin Cell Biol. 2005;17(2):123–128. | ||
Huang M, Anand S, Murphy EA, et al. EGFR-dependent pancreatic carcinoma cell metastasis through Rap1 activation. Oncogene. 2012;31(22):2783–2793. | ||
Kennedy AL, Adams PD, Morton JP. Ras, PI3K/Akt and senescence: paradoxes provide clues for pancreatic cancer therapy. Small GTPases. 2011;2(5):264–267. | ||
Hubbard PA, Moody CL, Murali R. Allosteric modulation of Ras and the PI3K/AKT/mTOR pathway: emerging therapeutic opportunities. Front Physiol. 2014;5:478. | ||
Giulietti M, Occhipinti G, Principato G, Piva F. Identification of candidate miRNA biomarkers for pancreatic ductal adenocarcinoma by weighted gene co-expression network analysis. Cell Oncol. 2017;40(2):181–192. | ||
Wang CJ, Xu RH, Yuan QY, et al. Bioinformatics method to analyze the mechanism of pancreatic cancer disorder. J Comput Biol. 2013;20(6):444–452. | ||
Carstens JL, Correa de Sampaio P, Yang D, et al. Spatial computation of intratumoral T cells correlates with survival of patients with pancreatic cancer. Nat Commun. 2017;8:15095. | ||
Liu L, Zhao G, Wu W, et al. Low intratumoral regulatory T cells and high peritumoral CD8(+) T cells relate to long-term survival in patients with pancreatic ductal adenocarcinoma after pancreatectomy. Cancer Immunol Immunother. 2016;65(1):73–82. | ||
Liu HL, Guan CJ, Wu YJ, Hu MG, Zhao ZM, Liu R. Clinical significance of preoperative CD8+ central memory T cells for operable pancreatic asdenocarcinoma. Dig Surg. 2015;32(6):433–438. | ||
Niccolai E, Cappello P, Taddei A, et al. Peripheral ENO1-specific T cells mirror the intratumoral immune response and their presence is a potential prognostic factor for pancreatic adenocarcinoma. Int J Oncol. 2016;49(1):393–401. | ||
Hiraoka N, Onozato K, Kosuge T, Hirohashi S. Prevalence of FOXP3+ regulatory T cells increases during the progression of pancreatic ductal adenocarcinoma and its premalignant lesions. Clin Cancer Res. 2006;12(18):5423–5434. | ||
Fukunaga A, Miyamoto M, Cho Y, et al. CD8+ tumor-infiltrating lymphocytes together with CD4+ tumor-infiltrating lymphocytes and dendritic cells improve the prognosis of patients with pancreatic adenocarcinoma. Pancreas. 2004;28(1):e26–e31. | ||
Ferrone CR, Kattan MW, Tomlinson JS, Thayer SP, Brennan MF, Warshaw AL. Validation of a postresection pancreatic adenocarcinoma nomogram for disease-specific survival. J Clin Oncol. 2005;23(30):7529–7535. | ||
Brennan MF, Kattan MW, Klimstra D, Conlon K. Prognostic nomogram for patients undergoing resection for adenocarcinoma of the pancreas. Ann Surg. 2004;240(2):293–298. | ||
de Castro SM, Biere SS, Lagarde SM, Busch OR, van Gulik TM, Gouma DJ. Validation of a nomogram for predicting survival after resection for adenocarcinoma of the pancreas. Br J Surg. 2009;96(4):417–423. |
 © 2017 The Author(s). This work is published and licensed by Dove Medical Press Limited. The
full terms of this license are available at https://www.dovepress.com/terms
and incorporate the Creative Commons Attribution
- Non Commercial (unported, 3.0) License.
By accessing the work you hereby accept the Terms. Non-commercial uses of the work are permitted
without any further permission from Dove Medical Press Limited, provided the work is properly
attributed. For permission for commercial use of this work, please see paragraphs 4.2 and 5 of our Terms.
© 2017 The Author(s). This work is published and licensed by Dove Medical Press Limited. The
full terms of this license are available at https://www.dovepress.com/terms
and incorporate the Creative Commons Attribution
- Non Commercial (unported, 3.0) License.
By accessing the work you hereby accept the Terms. Non-commercial uses of the work are permitted
without any further permission from Dove Medical Press Limited, provided the work is properly
attributed. For permission for commercial use of this work, please see paragraphs 4.2 and 5 of our Terms.