Back to Journals » OncoTargets and Therapy » Volume 11
Genome-scale analysis identifies SERPINE1 and SPARC as diagnostic and prognostic biomarkers in gastric cancer
Authors Liao P, Li W, Liu RZ, Teer JK, Xu BB, Zhang W, Li X, Mcleod HL, He YJ
Received 12 May 2018
Accepted for publication 8 August 2018
Published 15 October 2018 Volume 2018:11 Pages 6969—6980
DOI https://doi.org/10.2147/OTT.S173934
Checked for plagiarism Yes
Review by Single anonymous peer review
Peer reviewer comments 2
Editor who approved publication: Dr Leo Jen-Liang Su
Ping Liao,1 Wei Li,1 Ruizheng Liu,2 Jamie K Teer,2 Biaobo Xu,3 Wei Zhang,1 Xi Li,1 Howard L Mcleod,1,2 Yijing He1,2
1Hunan Key Laboratory of Pharmacogenetics, Department of Clinical Pharmacology, Institute of Clinical Pharmacology, Xiangya Hospital, Central South University, Changsha, Hunan, China; 2Moffitt Cancer Center, DeBartolo Family Personalized Medicine Institute, Tampa, FL, USA; 3Institute of Pharmacy, Affiliated Hospital of Jiujiang University, Jiujiang, Jiangxi, China
Background: Gastric cancer (GC) is one of the most common types of malignancy and is associated with high morbidity and mortality rates around the world. With poor clinical outcomes, potential biomarkers for diagnosis and prognosis are important to investigate.
Objective: The aim of this study is to investigate the gene expression module of GC and to identify potential diagnostic and prognostic biomarkers.
Method: Microarray data (GSE13911, GSE29272, GSE54129, and GSE79973), including 293 stomach tumor tissues and 196 normal tissues, were analyzed to identify differentially expressed genes (DEGs). DEGs were identified in four profiles by intersecting four overlapping subsets, including 90 downregulated and 45 upregulated DEGs in common. Gene ontology (GO) and Kyoto Encyclopedia of Genes and Genomes pathway analyses have been showed that extracellular matrix was the most enriched signal pathway. Furthermore, hub genes were analyzed by protein–protein interaction network and clinical outcomes were assessed by Kaplan–Meier survival analysis. Two independent datasets were used to validate the differential expression of two hub genes: Serpin Family E Member 1 (SERPINE1) and Secreted Protein Acidic and Cysteine Rich (SPARC).
Results: Validation of independent datasets indicated that SERPINE1 and SPARC expression were drastically increased in gastric tumor tissues and associated with poor outcomes in GC patients. The expression of SERPINE1 was related to race (Asian and White) (P < 0.05).
Conclusion: SERPINE1 and SPARC were significantly upregulated in gastric tissues and associated with poor outcomes. The investigations of SERPINE1 and SPARC may promote their predictive and prognostic value in GC.
Keywords: gastric cancer, SERPINE1, SPARC, diagnosis, prognosis, biomarker
Introduction
Gastric cancer (GC), a common heterogeneous disease, is a leading cause of cancer associated death worldwide. More than 950,000 new cases and 720,000 deaths from GC occurred in 2012. Incidence and mortality rates of GC are highest in East Asia, especially in China.1 Diets rich in salt, smoking, and obesity are considered increased risk factor for GC.2–4 According to the distinct patterns of molecular alterations, gastric adenocarcinoma can be classified into four subtypes: Epstein–Barr virus (EBV), chromosomal instability (CIN), microsatellite instability (MSI), and genomically stable (GS). The four subtypes are associated with patients’ prognosis.5,6 But the cause of GC remains to be further elucidated.
Conventional diagnostic methods for GC largely consists of endoscopy or histological detection, which lack specificity and sensitivity. The major clinical treatment is gastrectomy combined with chemotherapy or radiotherapy as adjuvant or neoadjuvant management.7 GC is asymptomatic in early stage and most patients are diagnosed at an advanced stage with poor prognosis. New biomarkers of gastric carcinomas to determine prognosis and predict the clinical outcomes are vital in the future.
Microarray analysis can reveal primary genes associated with GC progression and outcomes.8 Gene expression microarray technology provided a wealth of functional information to investigate tumor progression and identify novel targets for early diagnosis for GC.9 Four independent GC transcriptome microarray datasets were used in this research. A total of 135 common differentially expressed genes (DEGs) were identified by the four datasets. Protein–protein interaction (PPI) network analysis was performed to find common hub genes. Additional GC datasets were examined to validate those results. We found that the expression of Serpin Family E Member 1 (SERPINE1) and Secreted Protein Acidic and Cysteine Rich (SPARC) were drastically increased in gastric tumor tissues and were also associated with poor survival in GC patients by Kaplan–Meier analysis. These results indicated that SERPINE1 and SPARC may be regarded as potential biomarkers to diagnose and inform the clinical outcomes of GC. Patients prognosis may be improved in the future by targeting SERPINE1 or SPARC in GC patients.
Methods
Stomach adenocarcinoma datasets
Four gene expression profiles (GSE13911, GSE29272, GSE54129, and GSE79973) were obtained from NCBI Gene Expression Omnibus. GPL96 [HG-U133A] Affymetrix Human Genome U133A Array was performed for gene expression profiling (GSE29272). GSE13911, GSE54129, and GSE79973 datasets were performed by GPL570 [HG-U133_Plus_2] Affymetrix Human Genome U133 Plus 2.0 Array. GSE26899 and GSE81948 were used as independent datasets to verify the correctness of the conclusions. The platform of GSE26899 is GPL6947 (Illumina HumanHT-12 V3.0 expression beadchip). GSE81948 dataset was generated from GPL6244 [HuGene-1_0-st] Affymetrix Human Gene 1.0 ST Array (transcript [gene] version). All datasets were classified into normal and tumor tissues. In GSE29272 and GSE79973 datasets, GC tumor tissues and adjacent normal tissues were matched. A total of 443 stomach cancer patient’s clinical data as part of the Cancer Genome Atlas (TCGA) were downloaded from the Genomic Data Commons Data Portal and were used for survival analysis.
Data preprocessing and identification of DEGs
The raw probe-level data were downloaded in CEL files. Gene expression matrices were extracted with expression set of bioconductor biobase package in R. Empirical Bayes statistics in limma package were applied in differential expression between normal and tumor tissues.10 In our study, the value of all logFC in those datasets accorded with the normal distribution. The notion of medical reference value was used to define cutoff. We used cutoff and P-value to identify the DEGs. The formula for cutoff is shown as the following
|
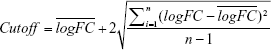
Genes with P < 0.05 and |logFC| > cutoff were considered to be DEGs between tumors and normal tissues.
Gene functional enrichment analysis
Venn diagram was implemented to show a combination of all gene expression profiles (GSE13911, GSE29272, GSE54129, and GSE79973), both higher and lower DEGs.11 The cluster profiler package in R was used to perform clustering analysis followed by Gene Ontology (GO) and Kyoto Encyclopedia of Genes and Genomes (KEGG) pathway enrichment for DEGs and was used as a visualization module for displaying analysis results.12 The number of core genes (“count”), divided by number of total genes is gene ratio. The sizes of the dots represent the number of core genes, and the color means adjust P-value. Only pathways with P-values <0.01 were eligible for enriched biological processes.
PPI network construction and identification of hub genes
STRINGdb package in R was utilized to analyze PPI networks. The interactions were analyzed by Cytoscape v3.4.0 software and the molecular complex detection (MCODE) clustering algorithm. MCODE with three stage, vertex weighting, complex prediction, and optional post-processing, which detects densely connected regions in large PPI networks.13 The clusters were generated by the MCODE clustering algorithm at K-core = 4, node score cutoff = 0.3, and max depth up to 100 along with interacting gene partners.14 The genes with the highest 100 MCODE score were identified as hub genes. Four datasets had 13 common interaction hub genes.
Statistical analysis
SPSS statistic software (version 24.0, IBM Corporation, Armonk, NY, USA) was used for general statistical analysis. The Student’s t-test was performed in gene expression comparisons of normal and tumor tissue. The significance of clinic characteristics and gene expression among groups was analyzed by the chi-squared test and Fisher’s exact test. Kaplan–Meier estimates and the log-rank test were applied for comparisons. Two-sided P-value <0.05 was considered as statistically significant.
Results
Identification of DEGs
DEGs were identified by tumor tissue and normal stomach tissue samples from four separate gene expression profile datasets (GSE13911, GSE29272, GSE54129, and GSE79973). The four discovery datasets included 196 normal tissues and 293 tumor samples, which were from multiple research sites. The detailed information in each dataset is described in Table S1. In order to investigate gene expression alteration associated with GC progression, the common DEGs across datasets were explored. The measured parameter of assuming normal distribution is used to estimate the 95% interval. The 95% reference range is defined as the mean minus 1.96 standard deviations to mean plus 1.96 standard deviations (often rounded up to 2).15 According to our research criterion of P < 0.05 and |logFC| > cutoff, a total of 1,626 genes (487 upregulated and 1,139 downregulated genes) in GSE13911, 755 genes (448 upregulated and 307 downregulated genes) in GSE29272, 2,032 genes (975 upregulated and 1,057 downregulated genes) in GSE54129, 1,610 genes (447 upregulated and 1,163 downregulated) in GSE79973 were found. All DEGs were viewed by volcano plots between tumor tissues and normal tissues (Figure 1A–D).
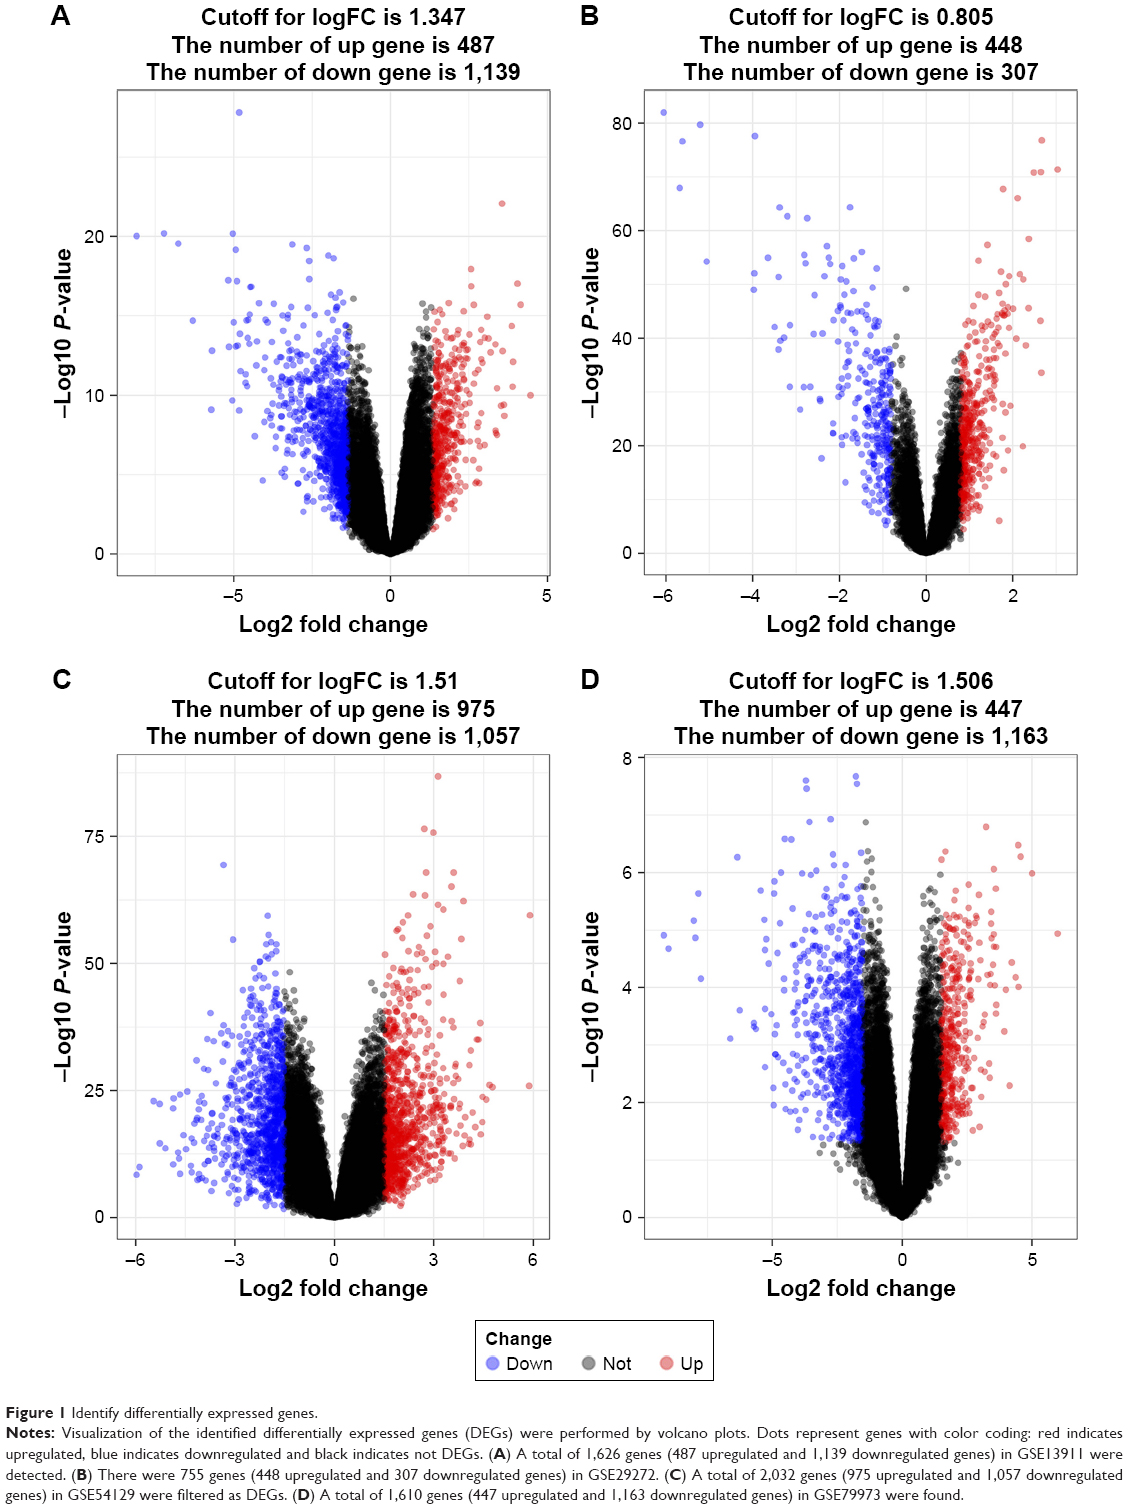 | Figure 1 Identify differentially expressed genes. |
GO and KEGG functional enrichment analysis
The four datasets were intersected to find common DEGs using Venn diagram. The intersecting part of the four subsets consisted of 135 common DEGs, including 90 downregulated genes (Figure 2A) and 45 upregulated genes (Figure 2B). All stomach tumor samples were analyzed and were believed to be relevant in the progression of GC. GO analysis indicated that of 15 enriched pathways, the main terms were extracellular matrix (ECM) and collagen (Figure 2C). The ECM pathway has been enriched in GO terms, indicating that the pathway might play an important role in GC progression. KEGG analysis indicated that focal adhesion, protein digestion, and absorption and ECM-receptor interaction pathway were the most significantly enriched pathways (Figure 2D). KEGG terms indicated that cancer progression might be influenced by metabolism.
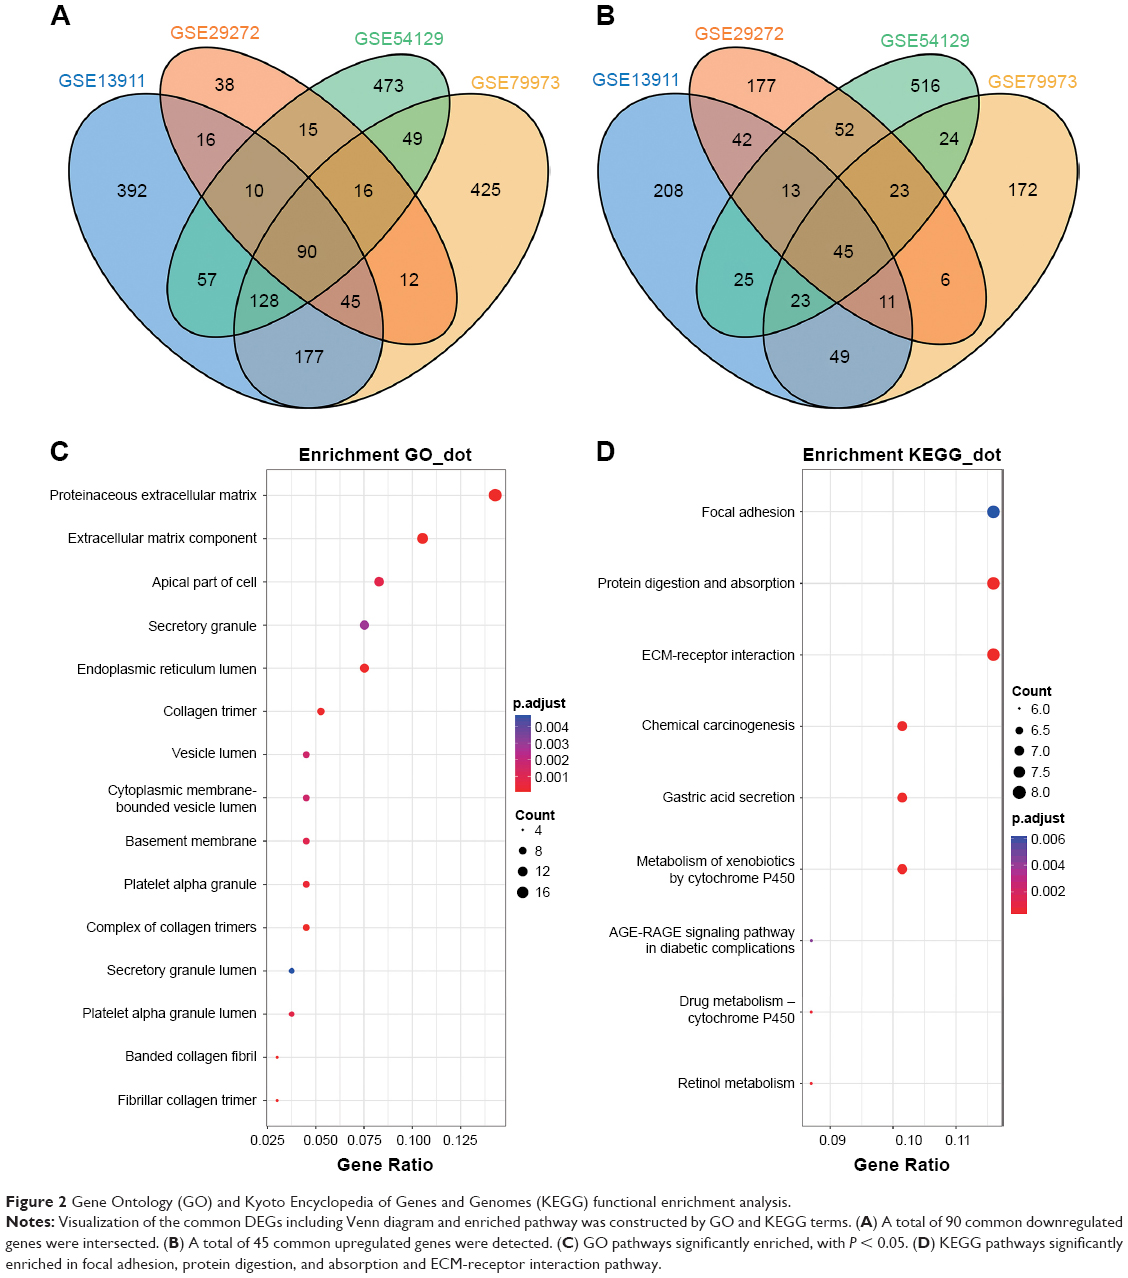 | Figure 2 Gene Ontology (GO) and Kyoto Encyclopedia of Genes and Genomes (KEGG) functional enrichment analysis. |
PPI network construction and identification of hub gene
The genes with the 100 highest of MCODE scores were identified as hub genes. Then common hub genes were defined by interacting GSE13911, GSE29272, GSE54129, and GSE79973 datasets. A total of 13 hub genes were found, including carbonic anhydrase 2 (CA2), fibronectin 1 (FN1), C-X-C motif chemokine ligand 8 (CXCL8), TIMP metallopeptidase inhibitor 1 (TIMP1), SERPINE1, Collagen Type I Alpha 1 Chain (COL1A1), SPARC, secreted phosphoprotein 1 (SPP1), thrombospondin 1 (THBS1), GPNMB (Glycoprotein Nmb), CA9, matrix metallopeptidase 7 (MMP7), and COL1A2 chain. Those hub genes were located at cluster 1 and cluster 2, both are the most informative clusters in PPI analysis. A PPI network was drawn by Cytoscape (Figure 3A–H). We identified 13 hub genes in common across the four datasets. The score of MCODE and cluster of those networks were listed (Table 1).
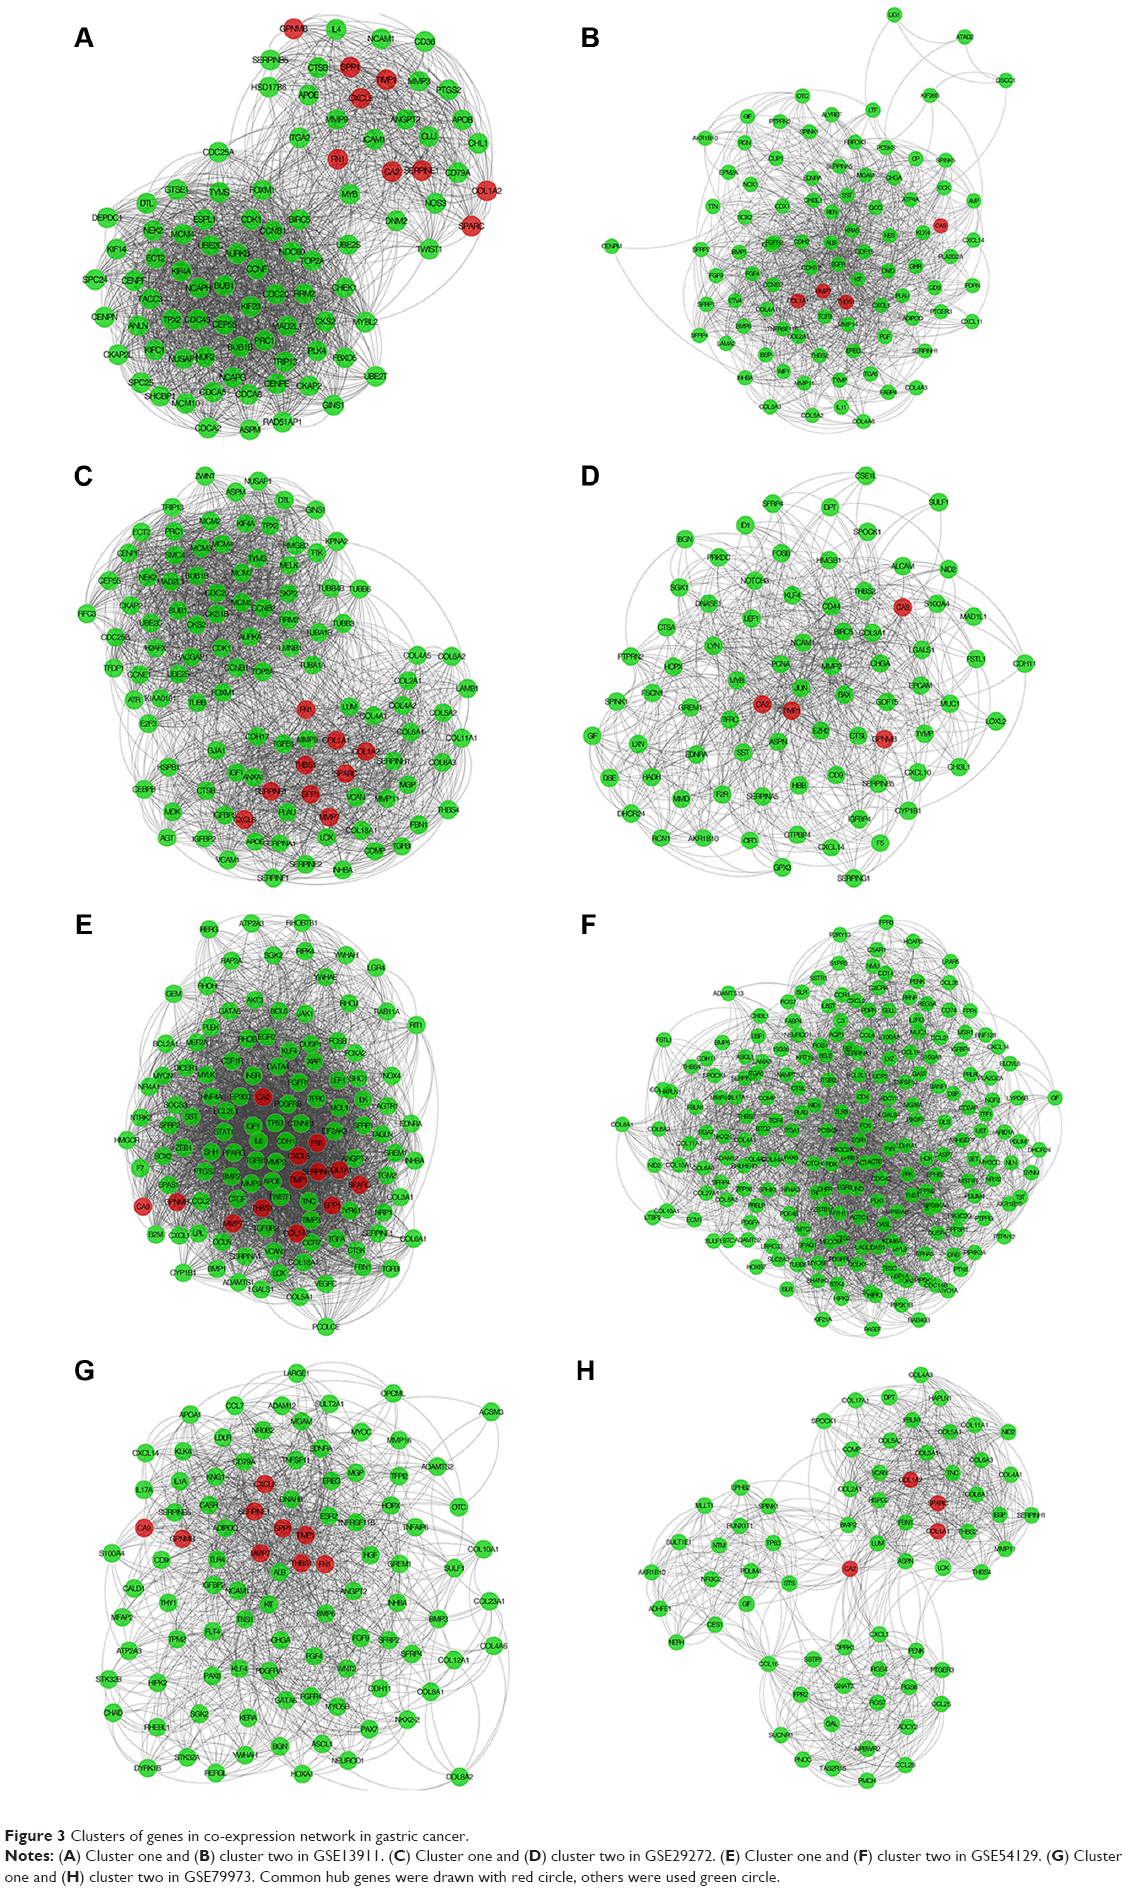 | Figure 3 Clusters of genes in co-expression network in gastric cancer. |
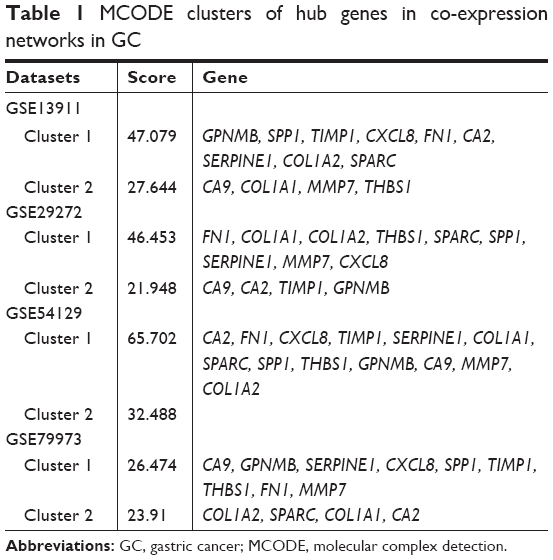 | Table 1 MCODE clusters of hub genes in co-expression networks in GC |
Association of hub genes with patient outcomes in the cancer genome atlas
Kaplan–Meier survival analysis was performed using TCGA clinical data (368 samples). The 13 hub genes were divided into low and high groups by median expression. Overall survival (OS) analysis was used to estimate the potential significance for hub genes. Survival analysis indicated that SERPINE1 and SPARC high expression was associated with poor OS (P-values: 0.0002 and 0.0246, respectively) (Figure 4A and B). The other 11 hub genes were not significantly associated with OS (P > 0.05). This indicated that the expression of SERPINE1 and SPARC might be viewed as potential markers of clinical outcomes for GC patients.
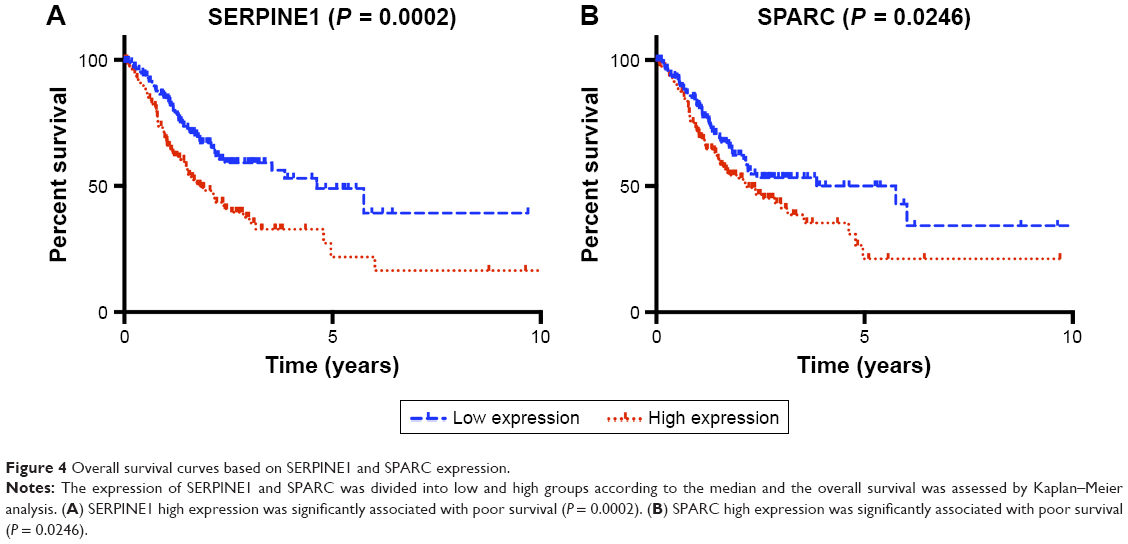 | Figure 4 Overall survival curves based on SERPINE1 and SPARC expression. |
Validation of hub genes in independent stomach adenocarcinomas
The expression of SERPINE1 and SPARC were significantly increased in tumor tissues compared to normal (Figure 5A–H) (P < 0.05). GSE26899 and GSE81948 were viewed as two validation profiles to further verify those hub genes expression. The expression of SERPINE1 and SPARC were remarkably increased in gastric tumor tissues both in GSE26899 and GSE81948 (Figure 6A–D) (P < 0.05). The expression of SERPINE1 and SPARC had no significant association with age, gender, grade, or pathologic stage. These results indicated that SERPINE1 and SPARC expression were drastically increased in gastric tumor tissues and directly associated with poor survival in GC patients. A chi-squared test demonstrated showed that the expression of SERPINE1 was significantly correlated with race (Asian or White) (P < 0.05) (Table 2). A multivariable cox-regression analysis with TCGA was performed to evaluate the impact of chemotherapy on OS in the context of multiple factors, such as gender, age, race, stage, TNM (the TNM Classification of Malignant Tumors), SERPINE1, and SPARC expression (Table 3). Age was significantly associated with OS (HR = 0.525, 95% CI 0.320–0.859, P = 0.010). Stage was significantly associated with OS (HR = 0.597, 95% CI 0.357–0.999, P = 0.050). SERPINE1 was significantly associated with OS (HR = 0.584, 95% CI 0.367–0.930, P = 0.024). It is interesting to note that the expression of SERPINE1 was associated with race, which was analogous with geographic variation in molecular subtype for gastric adenocarcinoma.
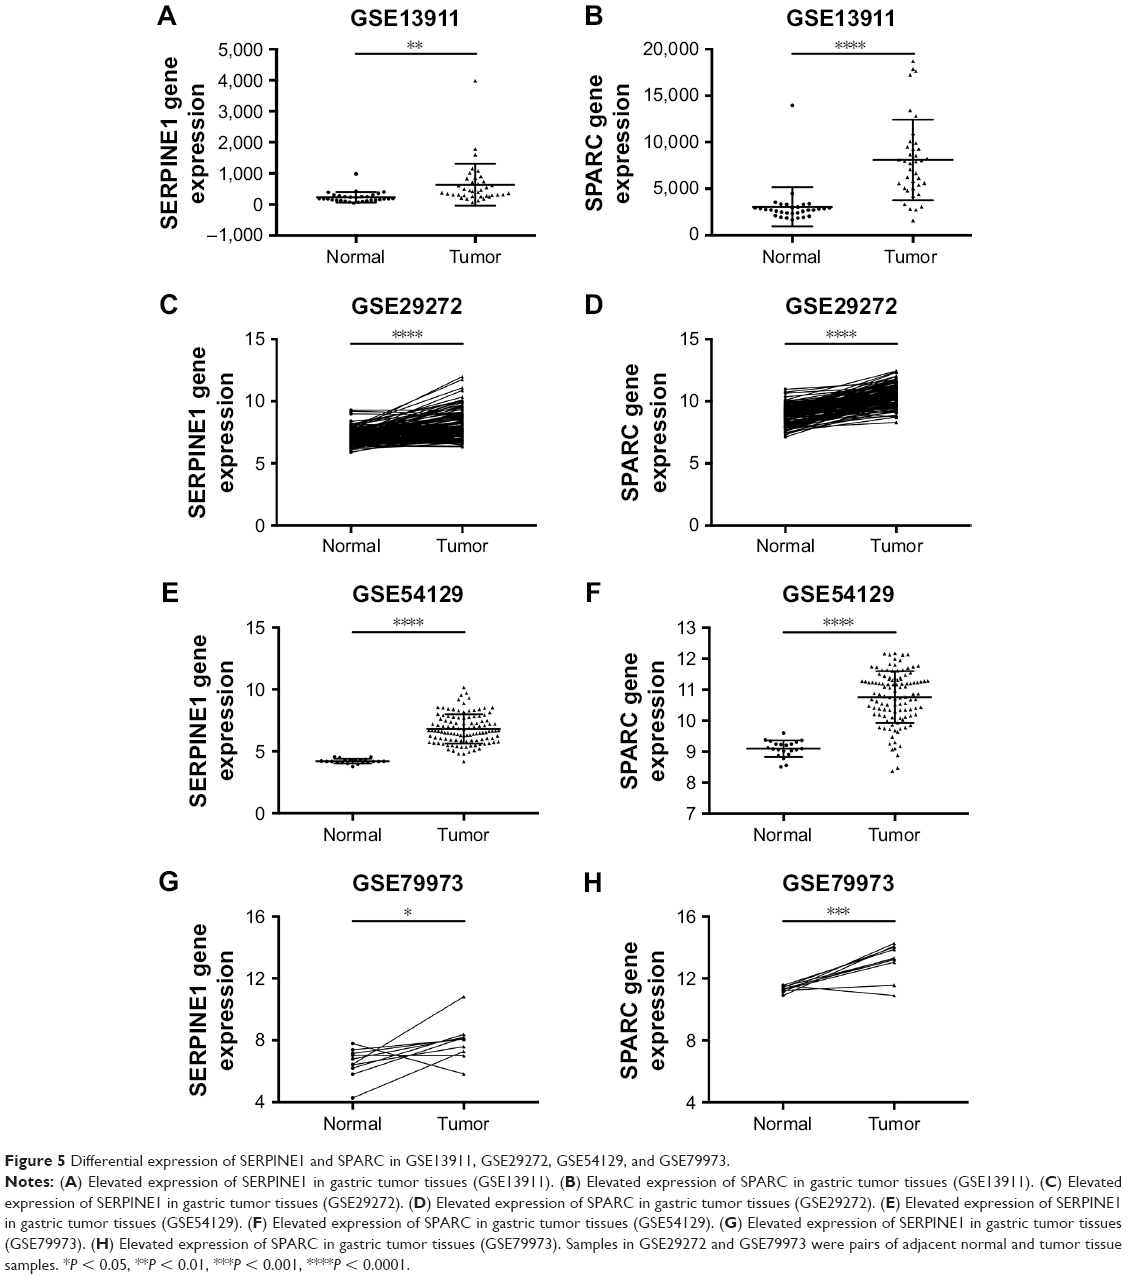 | Figure 5 Differential expression of SERPINE1 and SPARC in GSE13911, GSE29272, GSE54129, and GSE79973. |
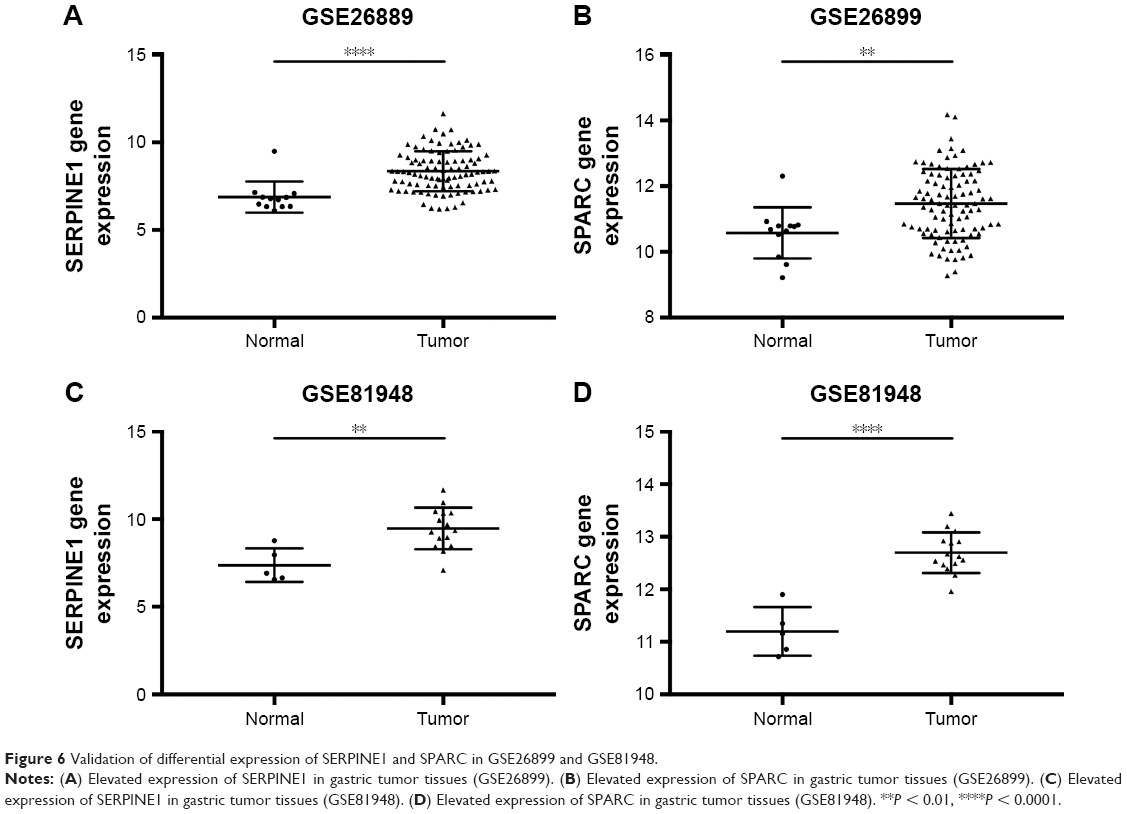 | Figure 6 Validation of differential expression of SERPINE1 and SPARC in GSE26899 and GSE81948. |
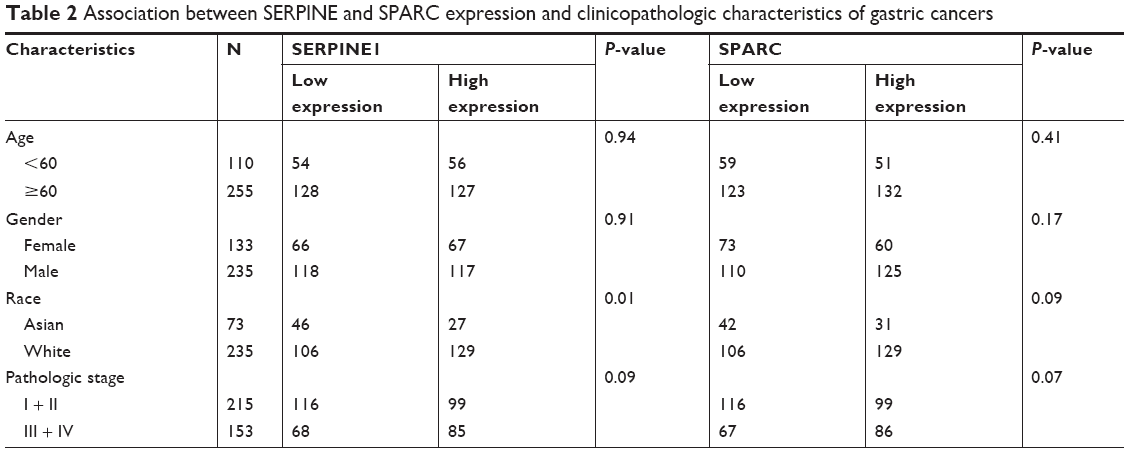 | Table 2 Association between SERPINE and SPARC expression and clinicopathologic characteristics of gastric cancers |
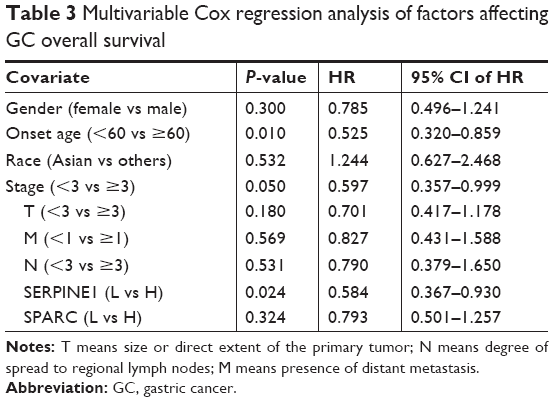 | Table 3 Multivariable Cox regression analysis of factors affecting GC overall survival |
Discussion
The research of molecular genetics and signal pathways can promote understanding of GC pathogenesis and potentially, which may help diagnosis early stage in GC. Therefore, identification of genes differentially expressed in GC by transcriptome microarray datasets may facilitate early diagnosis and develop effective treatment approaches. However, the cutoff criterion of |logFC| is arbitrary and is often set as 1, 1.5, or 2.16–18 In our study, the value of all logFC in the examined datasets accorded with the normal distribution. The notion of reference range was used to define cutoff. We used cutoff and P-value to identify the DEGs. Any fold-change threshold would not be absolute. Gene expression may vary by environmental stimuli, genetic modifications, disease state, or array process. A significant benefit of the reference range approach is improved interpretability and comparability. In our study, we defined DEGs across four datasets and further examined the top ranking common DEGs. Once we have such a reference set, we can plot sensitivity (ie, the fraction of genes from the set that are found) as function of the rank of the gene by volcano plots in order verify whether these DEGs indeed make sense.
SERPINE1 is a protein coding gene that regulates the adhesion balance of cells to the ECM. This process is correlated with tumor cell migration.19 Mazzoccoli et al reported that the high expression of SERPINE1 may promote colorectal cancer invasiveness and aggressiveness.20 Klimczak-Bitner et al demonstrated that the expression of SERPINE1 may be one of the key prognostic genes in esophageal cancer.21 Pavón et al reported that overexpression of SERPINE1 enhances tumor cell migration and invasion.22 We found that SERPINE1 was significantly upregulated in gastric tissues and SERPINE1 high expression associated with poor survival. The expression of SERPINE1 was associated with race, which was analogous with geographic variation in molecular subtype for gastric adenocarcinoma, such as the four molecular subtypes: EBV, CIN, MSI, and GS. However, further research is needed to determine these relationship and underlying mechanisms.
SPARC codes for an ECM protein that regulates matrix remodeling during tumor progression. Tumor microenvironment was mediated by SPARC in different cancers.23 Thomas et al reported that the expression of SPARC was elevated in metastatic prostate cancers.24 Zhao et al found that SPARC could be potential biomarker for survival in GC.25 Yusuf et al demonstrated that SPARC was overexpressed in endometrial cancer and enhanced the level of FN expression and migration activity.26 Yang et al showed that suppression SPARC expression was correlated with poor colon cancers clinical outcomes.27 Botti et al found that SPARC was not expressed in lung metastases of gastrointestinal and urogenital cancer, low expressed in lung metastases of breast cancer, and SPARC was associated with lung metastases from melanoma.28 We found that SPARC was significantly upregulated in gastric tissues and SPARC high expression associated with poor survival.
GO and KEGG analysis indicated that focal adhesion, protein digestion and absorption, and ECM-receptor interaction pathway were the most significantly enriched pathways. The ECM provides structure to support cells and is composed of collagens, proteoglycans, and several other glycoproteins. Cell surface receptors transduce signals into cells from the ECM. These signals regulate diverse cellular functions, such as tumor growth and migration, and are vital for maintaining normal homeostasis.29 Therefore, ECM macromolecules appear to be important for the progression of GC and the further research for it will help us to understanding the mechanism and potential targets of ECM in GC. SERPINE1 and SPARC are components of the ECM. The ECM has been linked to the tumor microenvironment,30 regulation of cell proliferation, migration, and oncogenic transformation. In certain circumstances, ECM may promote cancer growth and migration.31 In our research, the ECM-receptor interaction pathway stood out as enriched among the identified DEGs. Therefore, we speculate that the ECM-receptor interaction pathway plays a critical role in GC progression.
Significant geographic variation in disease features, including MSI, EBV, and GS subgroups, has been observed across countries. At the same time, morbidity of people with GC in Eastern Asia is more significant compared to other high-income countries, especially with the increasing westernization of diet, obesity, lifestyle (alcohol and smoking) in East Asia. More importantly, there is a great deal of variation in reported incidence and mortality within the individual countries.32 These rates are markedly higher in developing than developed nations, yet very scarce published data evaluating etiology, prevention, or management exists. It will be of great importance and interest to assess GC molecular subtype patterns worldwide and, also, intriguing to compare with Asian and Caucasian GC patients to make GC personalized medicine globally. In our study, we found that SERPINE1 expression is associated with race (Asian and White). The molecular subtype can be offer opportunities for epidemiologists and cancer biologists to ascertain molecular and environmental risk factors behind the specific subtypes.
Conclusion
In summary, SERPINE1 and SPARC were viewed as potential prognostic biomarker for GC. These potential markers (SERPINE1 and SPARC) were significantly upregulated in gastric tissues and high expression associated with poor survival. However, further research is needed to understand the underlying mechanisms.
Acknowledgments
This work was supported by the National Natural Science Foundation of China (Grant No 81403022, No 81673517 and No 81773821), National key research and development program (No 2016YFC0905000), and The Fundamental Research Funds for the Central Universities of Central South University (No 2017zzts870).
Disclosure
The authors report no conflicts of interest in this work.
References
Torre LA, Bray F, Siegel RL, Ferlay J, Lortet-Tieulent J, Jemal A. Global cancer statistics, 2012. CA Cancer J Clin. 2015;65(2):87–108. | ||
Lunet N, Valbuena C, Vieira AL, et al. Fruit and vegetable consumption and gastric cancer by location and histological type: case-control and meta-analysis. Eur J Cancer Prev. 2007;16(4):312–327. | ||
Ladeiras-Lopes R, Pereira AK, Nogueira A, et al. Smoking and gastric cancer: systematic review and meta-analysis of cohort studies. Cancer Causes Control. 2008;19(7):689–701. | ||
Yang P, Zhou Y, Chen B, et al. Overweight, obesity and gastric cancer risk: results from a meta-analysis of cohort studies. Eur J Cancer. 2009;45(16):2867–2873. | ||
van Cutsem E, Sagaert X, Topal B, Haustermans K, Prenen H. Gastric cancer. Lancet. 2016;388(10060):2654–2664. | ||
Cancer Genome Atlas Research, N. Comprehensive molecular characterization of gastric adenocarcinoma. Nature. 2014;513(7517):202–209. | ||
Cristescu R, Lee J, Nebozhyn M, et al. Molecular analysis of gastric cancer identifies subtypes associated with distinct clinical outcomes. Nat Med. 2015;21(5):449–456. | ||
Chang W, Ma L, Lin L, et al. Identification of novel hub genes associated with liver metastasis of gastric cancer. Int J Cancer. 2009;125(12):2844–2853. | ||
Zhu T, Gao YF, Chen YX, et al. Genome-scale analysis identifies GJB2 and ERO1LB as prognosis markers in patients with pancreatic cancer. Oncotarget. 2017;8(13):21281–21289. | ||
Ritchie ME, Phipson B, Wu D, et al. Limma powers differential expression analyses for RNA-sequencing and microarray studies. Nucleic Acids Res. 2015;43(7):e47. | ||
Chen H, Boutros PC. VennDiagram: a package for the generation of highly-customizable Venn and Euler diagrams in R. BMC Bioinformatics. 2011;12:35. | ||
Yu G, Wang LG, Han Y, He QY. clusterProfiler: an R package for comparing biological themes among gene clusters. OMICS. 2012;16(5):284–287. | ||
Bader GD, Hogue CW. An automated method for finding molecular complexes in large protein interaction networks. BMC Bioinformatics. 2003;4:2. | ||
Zhuang DY, Jiang L, He QQ, Zhou P, Yue T. Identification of hub subnetwork based on topological features of genes in breast cancer. Int J Mol Med. 2015;35(3):664–674. | ||
Kirkwood BR, Sterne JAC. Essential Medical Statistics. 2nd ed. Malden, MA: Blackwell Publishers; 2008. | ||
Gao YF, Mao XY, Zhu T, et al. COL3A1 and SNAP91: novel glioblastoma markers with diagnostic and prognostic value. Oncotarget. 2016;7(43):70494–70503. | ||
Jung H, Han S, Kim S. The construction of regulatory network for insulin-mediated genes by integrating methods based on transcription factor binding motifs and gene expression variations. Genomics Inform. 2015;13(3):76–80. | ||
Alajez NM. Large-scale analysis of gene expression data reveals a novel gene expression signature associated with colorectal cancer distant recurrence. PLoS One. 2016;11(12):e0167455. | ||
Simone TM, Longmate WM, Law BK, Higgins PJ. Targeted inhibition of PAI-1 activity impairs epithelial migration and wound closure following cutaneous injury. Adv Wound Care. 2015;4(6):321–328. | ||
Mazzoccoli G, Pazienza V, Panza A, et al. ARNTL2 and SERPINE1: potential biomarkers for tumor aggressiveness in colorectal cancer. J Cancer Res Clin Oncol. 2012;138(3):501–511. | ||
Klimczak-Bitner AA, Kordek R, Bitner J, Musiał J, Szemraj J. Expression of MMP9, SERPINE1 and miR-134 as prognostic factors in esophageal cancer. Oncol Lett. 2016;12(5):4133–4138. | ||
Pavón MA, Arroyo-Solera I, Céspedes MV, Casanova I, León X, Mangues R. uPA/uPAR and SERPINE1 in head and neck cancer: role in tumor resistance, metastasis, prognosis and therapy. Oncotarget. 2016;7(35):57351–57366. | ||
Chlenski A, Cohn SL. Modulation of matrix remodeling by SPARC in neoplastic progression. Semin Cell Dev Biol. 2010;21(1):55–65. | ||
Thomas R, True LD, Bassuk JA, Lange PH, Vessella RL. Differential expression of osteonectin/SPARC during human prostate cancer progression. Clin Cancer Res. 2000;6(3):1140–1149. | ||
Zhao ZS, Wang YY, Chu YQ, Ye ZY, Tao HQ. SPARC is associated with gastric cancer progression and poor survival of patients. Clin Cancer Res. 2010;16(1):260–268. | ||
Yusuf N, Inagaki T, Kusunoki S, et al. SPARC was overexpressed in human endometrial cancer stem-like cells and promoted migration activity. Gynecol Oncol. 2014;134(2):356–363. | ||
Yang E, Kang HJ, Koh KH, Rhee H, Kim NK, Kim H. Frequent inactivation of SPARC by promoter hypermethylation in colon cancers. Int J Cancer. 2007;121(3):567–575. | ||
Botti G, Scognamiglio G, Marra L, et al. SPARC/osteonectin is involved in metastatic process to the lung during melanoma progression. Virchows Arch. 2014;465(3):331–338. | ||
Theocharis AD, Skandalis SS, Gialeli C, Karamanos NK. Extracellular matrix structure. Adv Drug Deliv Rev. 2016;97:4–27. | ||
Naba A, Clauser KR, Whittaker CA, Carr SA, Tanabe KK, Hynes RO. Extracellular matrix signatures of human primary metastatic colon cancers and their metastases to liver. BMC Cancer. 2014;14:518. | ||
Rainero E. Extracellular matrix endocytosis in controlling matrix turnover and beyond: emerging roles in cancer. Biochem Soc Trans. 2016;44(5):1347–1354. | ||
Ferlay J, Soerjomataram I, Dikshit R, et al. Cancer incidence and mortality worldwide: sources, methods and major patterns in GLOBOCAN 2012. Int J Cancer. 2015;136(5):E359–E386. |
Supplementary material
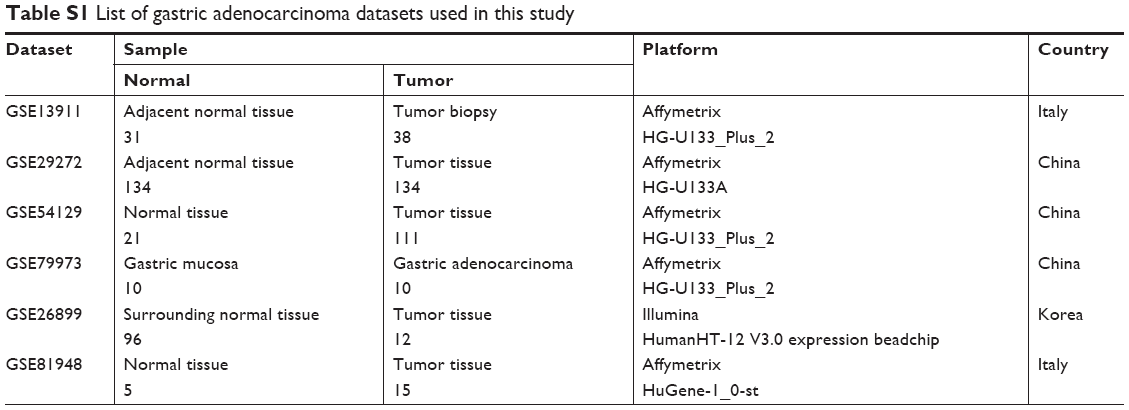 | Table S1 List of gastric adenocarcinoma datasets used in this study |
 © 2018 The Author(s). This work is published and licensed by Dove Medical Press Limited. The
full terms of this license are available at https://www.dovepress.com/terms
and incorporate the Creative Commons Attribution
- Non Commercial (unported, 3.0) License.
By accessing the work you hereby accept the Terms. Non-commercial uses of the work are permitted
without any further permission from Dove Medical Press Limited, provided the work is properly
attributed. For permission for commercial use of this work, please see paragraphs 4.2 and 5 of our Terms.
© 2018 The Author(s). This work is published and licensed by Dove Medical Press Limited. The
full terms of this license are available at https://www.dovepress.com/terms
and incorporate the Creative Commons Attribution
- Non Commercial (unported, 3.0) License.
By accessing the work you hereby accept the Terms. Non-commercial uses of the work are permitted
without any further permission from Dove Medical Press Limited, provided the work is properly
attributed. For permission for commercial use of this work, please see paragraphs 4.2 and 5 of our Terms.