Back to Journals » Nature and Science of Sleep » Volume 14
Generalized EEG Slowing Across Phasic REM Sleep, Not Subjective RBD Severity, Predicts Neurodegeneration in Idiopathic RBD
Authors Gong SY, Shen Y, Gu HY, Zhuang S, Fu X, Wang QJ, Mao CJ ![]() , Hu H, Dai YP, Liu CF
, Hu H, Dai YP, Liu CF ![]()
Received 17 December 2021
Accepted for publication 18 February 2022
Published 11 March 2022 Volume 2022:14 Pages 407—418
DOI https://doi.org/10.2147/NSS.S354063
Checked for plagiarism Yes
Review by Single anonymous peer review
Peer reviewer comments 3
Editor who approved publication: Prof. Dr. Ahmed BaHammam
Si-Yi Gong,1,* Yun Shen,1,* Han-Ying Gu,1 Sheng Zhuang,1 Xiang Fu,1,2 Qiao-Jun Wang,1 Cheng-Jie Mao,1 Hua Hu,1 Yong-Ping Dai,1 Chun-Feng Liu1– 3
1Department of Neurology and Clinical Research Center of Neurological Disease, The Second Affiliated Hospital of Soochow University, Suzhou, People’s Republic of China; 2Institute of Neuroscience, Soochow University, Suzhou, Jiangsu, 215123, People’s Republic of China; 3Department of Neurology, Suqian First Hospital, Suqian, People’s Republic of China
*These authors contributed equally to this work
Correspondence: Chun-Feng Liu; Yong-Ping Dai, Department of Neurology and Clinical Research Center of Neurological Disease, The Second Affiliated Hospital of Soochow University, Suzhou, People’s Republic of China, Tel +86 512-67783307 ; +86 512-67784179, Fax +86 512-68284303, Email [email protected]; [email protected]
Purpose: Idiopathic rapid eye movement sleep behavior disorder (iRBD) is the prodromal marker of α-synuclein degeneration with markedly high predictive value. We aim to evaluate the value of electroencephalography (EEG) data during rapid eye movement (REM) sleep and subjective RBD severity in predicting the conversion to neurodegenerative diseases in iRBD patients.
Methods: At the baseline, iRBD patients underwent clinical assessment and video-polysomnography (PSG). Relative spectral power for nine frequency bands during phasic and tonic REM sleep in three regions of interest, slow-to-fast ratios, clinical and PSG variables were estimated and compared between iRBD patients who converted to neurodegenerative diseases (iRBD-C) and iRBD patients who remained disease-free (iRBD-NC). Receiver operating characteristic (ROC) curves evaluated the predictive performance of slow-to-fast ratios, and subjective RBD severity as assessed with RBD Questionnaire-Hong Kong.
Results: Twenty-two (33.8%) patients eventually developed neurodegenerative diseases. The iRBD-C group showed shorter total sleep time (p < 0.001), lower stage 2 sleep percentage (p = 0.044), more periodic leg-movement-related arousal index (p = 0.004), increased tonic chin electromyelographic activity (p = 0.040) and higher REM density in the third REM episode (p = 0.034) than the iRBD-NC group. EEG spectral power analyses revealed that iRBD phenoconverters showed significantly higher delta and lower alpha power, especially in central and occipital regions during the phasic REM state compared to the iRBD-NC group. Significantly higher slow-to-fast ratios were observed in a more generalized way during the phasic state in the iRBD-C group compared to the iRBD-NC group. ROC analyses of the slowing ratio in occipital areas during phasic REM sleep yielded an area under the curve of 0.749 (p = 0.001), while no significant predictive value of subjective RBD severity was observed.
Conclusion: Our study shows that EEG slowing, especially in a more generalized manner during the phasic period, may be a promising marker in predicting phenoconversion in iRBD, rather than subjective RBD severity.
Keywords: idiopathic rapid eye movement sleep behavior disorder, neurodegenerative diseases, EEG slowing, RBD severity, phenoconversion, neuroprotective therapy
Introduction
Rapid eye movement (REM) sleep behavior disorder (RBD) refers to a type of parasomnia that is featured by increased muscle tone and dream enactment behaviors,1 which usually cause injury to themselves or the bed partner.2 Mounting evidence showed that approximately 35–45% of the patients with idiopathic RBD (iRBD) will develop neurodegenerative diseases in five years after the diagnosis of iRBD, including Parkinson’s disease (PD), dementia with Lewy bodies, multiple system atrophy (MSA), mild cognitive impairment (MCI), and Alzheimer’s disease (AD).3–6 The conversion rate will rise to approximately 91% after 14 years post-diagnosis.7 Meanwhile, iRBD tends to precede neurodegenerative diseases for about 13 years on average,5 providing an optimal opportunity to conduct neuroprotective therapies. However, the question of when to suggest that patients undertake neuroprotective trials remains controversial. Therefore, identifying sensitive markers in iRBD patients for phenoconversion is of the utmost importance.
Previous longitudinal and multicenter studies have revealed that predictors of parkinsonism and dementia included abnormal quantitative motor testing, olfactory deficit, MCI, erectile dysfunction, constipation, REM sleep without atonia (RWA), acoustic speech impairment and so on.8,9 Researchers further evaluated the role of RWA in predicting phenoconversion and concluded that severity of RWA,10 tonic electromyography (EMG) activities,11 and mixed RWA12 could serve as the markers for prediction. Additionally, a recent study showed that iRBD patients who had phenoconverted exhibited specific electroencephalography (EEG) abnormalities during wakefulness, compared to those who did not, remained disease-free.13 More electrophysiological markers of neurodegeneration in iRBD have been thoroughly reviewed by Figorilli and Ferini-Strambi et al.14,15 However, few studies have demonstrated the role of EEG data recorded during REM sleep and RBD severity as assessed with the RBD questionnaire—Hong Kong (RBD-HK) to predict phenoconversion in iRBD.
In brief, the REM-sleep state comprises two distinct sleep states (ie, tonic and phasic periods) based on the presence of REM, which display functional disparity from each other in terms of arousal thresholds,16 information processing,17 and synchronized oscillatory activities.18 Studies showed that motor activities mostly occur during the phasic REM-sleep state,19 and behavioral arousal thresholds were relatively higher in phasic REM sleep than tonic REM sleep.16 Hence, accumulating evidence suggests that REM sleep should not be assumed to be a uniform state.16,19–21 A recent study further corroborated this notion by stating that the blunted difference regarding EEG spectral power between the sub-stages of REM sleep may be a biomarker of RBD.22 However, no studies to date are available to determine the usefulness of EEG data during sub-stages of REM sleep and RBD severity as biomarkers of neurodegeneration in iRBD.
Therefore, we hypothesized that if EEG data during REM sleep, especially during phasic and tonic sleep states, and RBD severity could identify iRBD patients at an elevated risk of developing neurodegenerative diseases. To test the hypothesis, we compared EEG spectral power during phasic and tonic REM sleep states and RBD severity as assessed with RBD-HK between iRBD patients who developed neurodegenerative diseases and those who remained disease-free.
Materials and Methods
Participants
Seventy-one iRBD patients were recruited at the Sleep Center of the Second Affiliated Hospital of Soochow University from July 2010 to July 2019 and were followed for at least two years. The diagnosis of iRBD was based primarily on the International Classification of Sleep Disorders, 2nd edition (ICSD-2).23 Six iRBD patients were excluded due to invalid EEG data at the baseline. Finally, sixty-five iRBD patients were included in this study. All the patients were free of medications that might affect sleep, including antidepressants, benzodiazepine, and melatonin.24–26 This study complied with the Declaration of Helsinki. Ethics approval was obtained from the Research Ethics Committee of the Second Affiliated Hospital of Soochow University, and all the written informed consents were provided.
Neurophysiological Assessment
Patients were routinely followed up every 0.5–1 year by the treating neurologists. If the patients were unable to present to the clinic due to severe disability or refusal of in-person assessments, telephone interviews were conducted by their previous treating neurologists. At the baseline, eligible iRBD patients completed the Mini-Mental State Examination (MMSE),27 Montreal Cognitive Assessment (MoCA, Beijing version),28 Epworth Sleepiness Scale (ESS),29 RBD Screening Questionnaire (RBDSQ) and RBD-HK.30,31 RBD-HK comprises 13 questions about the presence and severity of RBD itself. It also can be classified into factors I and II, with factor I related to dreaming content (Q1-5 and Q13) and factor II related to behavioral manifestation (Q6-12).32 Subjective RBD severity was assessed with RBD-HK. During follow-up, iRBD patients were diagnosed by specialists as PD,33,34 MSA,35 AD,36,37 or MCI,38 according to their respective diagnostic criteria. Follow-up duration was defined as the interval from the time of RBD diagnosis to the time of the last visit or to the time of neurological-disease diagnosis.
Polysomnography (PSG) Recording
At the baseline, eligible iRBD patients underwent video-PSG using an E-Series System digital polygraph (Compumedics Company, Abbotsford, Victoria, Australia) after comprehensive neurophysiological assessments. Scalp EEG montages, including frontal (F3, F4), central (C3, C4) and occipital (O1, O2), with A1, A2 being the linked mastoid references, were placed based on the 10–20 international system. The EEG impedances were kept below 10kΩ. All the EEG data were sampled at 256Hz and recorded with a bandpass filter of 0.5–35Hz. EMG activities were recorded for submentalis and both anterior tibialis muscles. A bilateral electrooculogram (EOG) was recorded with two electrodes placed at the outer canthi of both eyes, either below or above each eye. Respirations were monitored with the nasal cannula, thermistor, and thoracic and abdominal piezoelectric belts. Registered sleep technicians reclassified sleep stages based on the American Academy of Sleep Medicine (AASM)’s scoring manual. Polysomnographic variables included total sleep time (TST); sleep efficiency; sleep latency; sleep stages 1, 2 (N1, N2), and REM sleep; percentage of slow-wave sleep; REM-sleep latency; arousal index (ArI); wake-after-sleep onset (WASO); periodic limb movements during sleep; REM and non-REM sleep (PLMS, PLM-REM, PLM-NREM); periodic leg-movement-related arousal index (PLMArI); and apnea-hypopnea index (AHI).
RWA and Rapid Eye Movement Density (REMD) Scoring
RWA and REMD scoring was performed by the same registered sleep technicians, who were blinded to the patients’ diagnoses, according to the methods reported by previous literature.39 EMG activity scored from submentalis muscles was analyzed. “Percent phasic EMG activity” refers to the percentage of 3-second mini-epochs, containing intermittent bursts of EMG activity lasting 0.1–5.0 seconds with amplitudes of at least twice the background, divided by all the 3-second mini-epochs. “Percent tonic EMG activity” is identified as the percentage of the epochs in which a persistent increase occurs in EMG activity for at least half of a 30-second epoch with amplitudes of more than twice that of the baseline signals, in all the 30-second epochs across REM sleep. Any epoch containing arousals or related respiratory events was excluded. “REMD” was defined as the number of ocular movements divided by the length of REM sleep in minutes. Only continuous REM sleep lasting for at least 3 minutes was included for analysis. The REMD for each REM-sleep episode and total REM sleep throughout the night was calculated. Any epoch contaminated by movements was selected by visual inspections and excluded from this study.
EEG Preprocessing and Power-Spectral Analysis
EEG data preprocessing and power-spectral analyses were performed utilizing Matlab R2013b (Mathworks, Natick, MA, USA). Phasic or tonic REM sleep was visually selected throughout the whole-night REM sleep. Segments were defined as phasic REM sleep when at least two eye movements (EMs) occurred in adjacent 2s mini-epochs. Tonic REM-sleep segments were detected when there were no EMs (amplitude <25μV)40 in consecutive 2s windows. Segments of less than 8s between phasic and tonic REM-sleep epochs were discarded to avoid contamination from intermediate stages. Transition stages around 30s, either from non-REM (NREM) to REM or REM to NREM, were removed from further analysis. EEG epochs contaminated by movement-related artifacts were excluded from this study.
Absolute spectral power in the delta (2.0–3.9Hz), theta (4.0–7.9Hz), alpha (8.0–12.9Hz), alpha1 (8.0–9.9Hz), alpha2 (10–12.9Hz), beta (13.0–32.0Hz), beta1 (13.0–21.9Hz), beta2 (22.0–32.0Hz), and sigma (12.0–14.9Hz) was calculated using Fast Fourier transform (FFT) and averaged over each region of interest (ROI), including frontal, central and occipital regions. Relative power was obtained by normalizing to the total absolute power (2.0–32.0Hz). Several ratios reflecting EEG slowing were calculated in each ROI as follows:


Statistical Analysis
Normality tests were verified using the Shapiro–Wilk normality test. Data were presented as mean with standard deviations when they passed the normality tests; otherwise, data were reported as median with quartiles. For the demographic, clinical, and PSG variables, Mann–Whitney U-tests or independent sample t-tests were used to analyze quantitative data, and categorical data were compared with Chi-square tests. For the power-spectral analysis, relative power data for each frequency band in each ROI were log-transformed to normalize the data distribution. Repeated measures of analysis of variance (ANOVA) were applied with the group as the independent factor and ROIs as the repeated measures. Additional analyses for the ratios (log-transformed) applied the same ANOVA design. The p values were adjusted using the Huynh-Feldt correction of sphericity. Simple effect analyses were conducted for decomposing significant interactions. ROC curves were calculated to evaluate the sensitivity and specificity of the ratios in predicting the phenoconversion of iRBD patients. Optimal cutoff values were yielded when the largest Youden index was achieved. Additionally, ROC analysis was performed to assess the predictive ability of RBD severity, as assessed with RBD-HK and RWA. All the statistical analyses were performed with IBM SPSS Statistics, version 24.0, 64-bit (IBM Corporation, Armonk, NY, USA), and p < 0.05 was regarded statistically significant.
Results
Demographics and Polysomnographic Variables
In total, 65 iRBD patients were included in this study. At follow-ups, 22 patients eventually developed a neurodegenerative disease. Of the 22 patients, 15 were diagnosed as PD, 1 developed MSA, 2 developed AD, and 4 developed MCI. The average age at RBD diagnosis was 67.64 ± 8.27 years old, and 17 (77.27%) were male. The mean follow-up duration was 6.64 ± 2.48 years, and RBD symptoms preceded the onset of the neurologic symptoms at approximately five years. At the baseline, no significant difference was observed in body mass index (BMI), RBD-HK and its subfactors, RBDSQ, MMSE, MoCA, or ESS between the iRBD-C and iRBD-NC groups (Table 1).
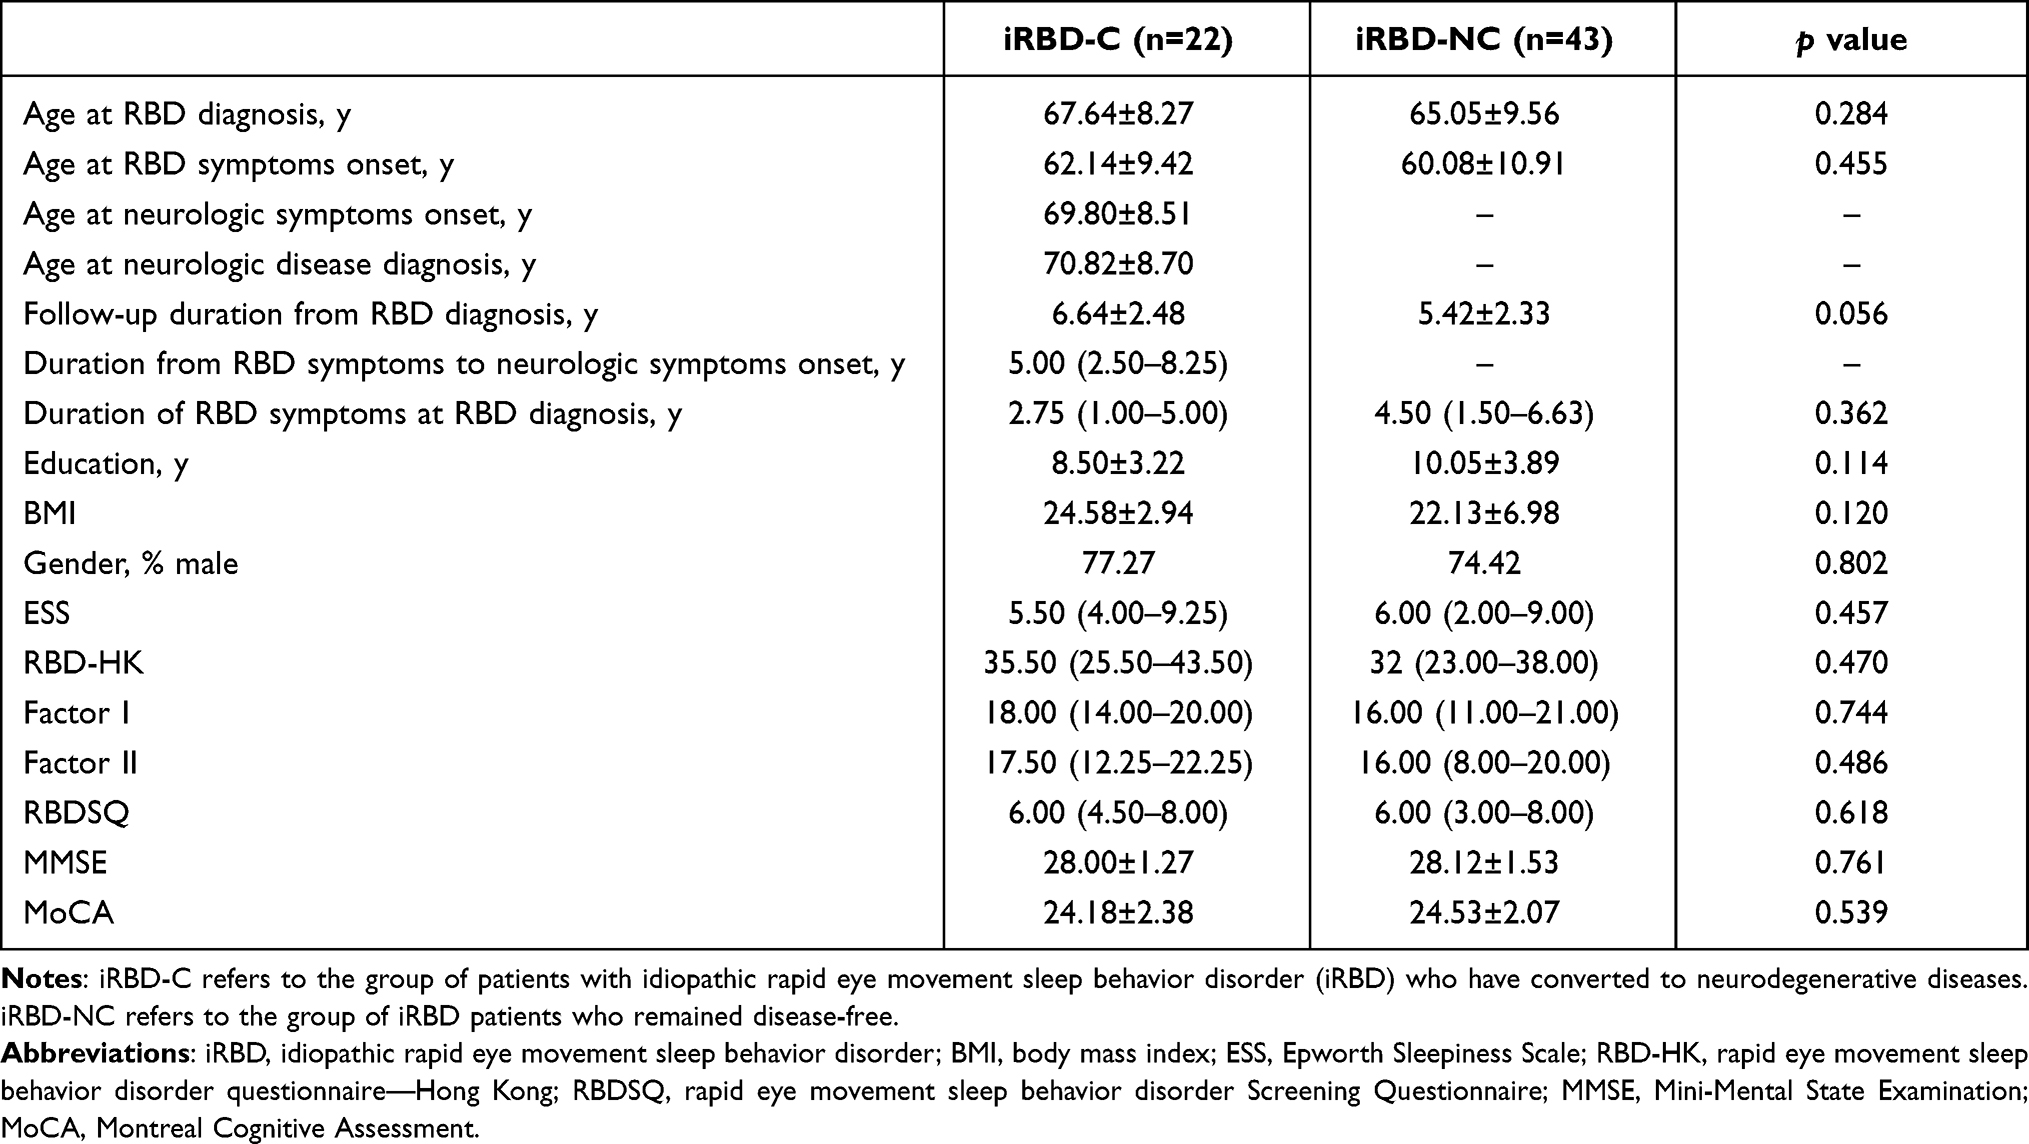 |
Table 1 Demographic and Clinical Characteristics |
IRBD phenoconverters had a shorter total sleep time (TST, p < 0.001), lower stage 2 sleep percentage (p = 0.044), more PLM-NREM (p = 0.032), and more PLMArI (p = 0.004) compared to the iRBD-NC group (Table 2). Moreover, the iRBD-C group exhibited significantly increased chin %tonic EMG activity (p = 0.040), and higher REM density during the third REM episode (p = 0.034) compared to the iRBD-NC group (Table 3).
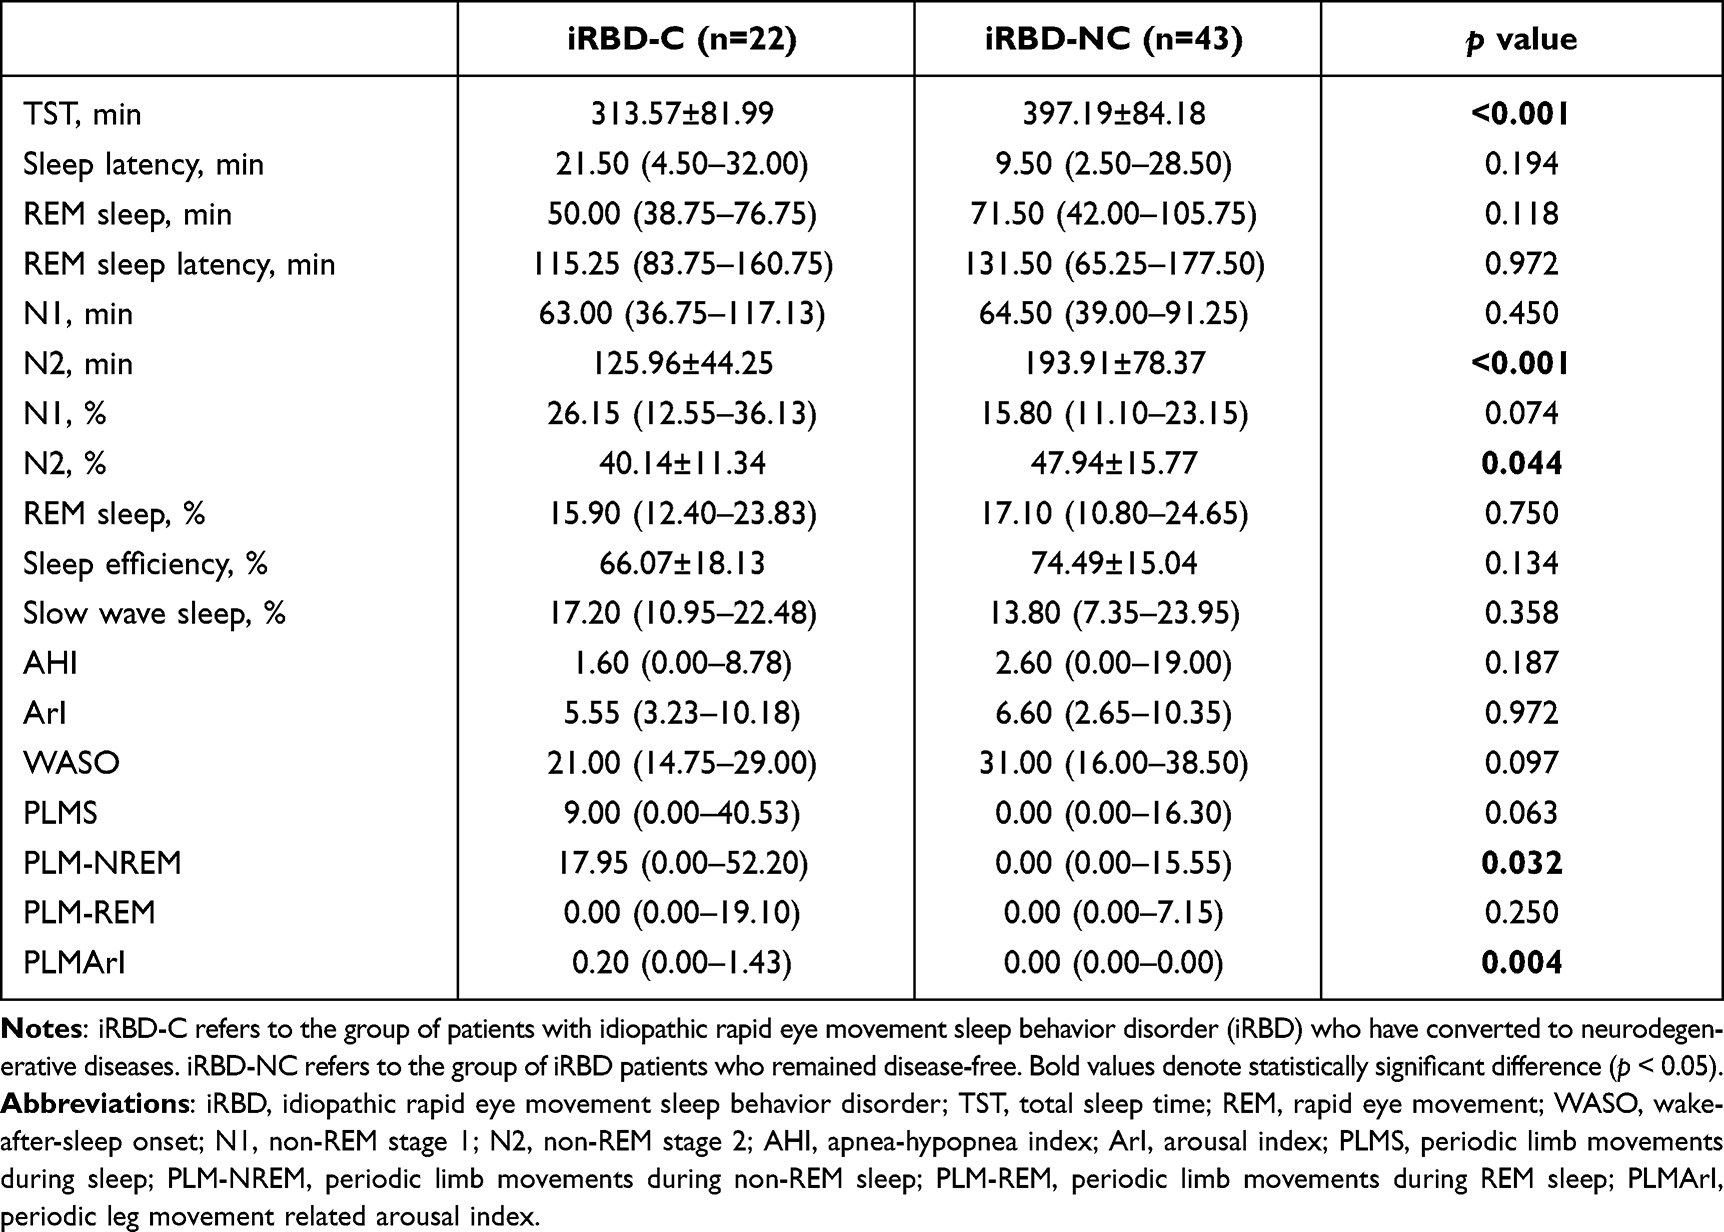 |
Table 2 Comparisons of Polysomnographic Variables Between iRBD Patients Who Have Converted and Those Who Remained Disease Free |
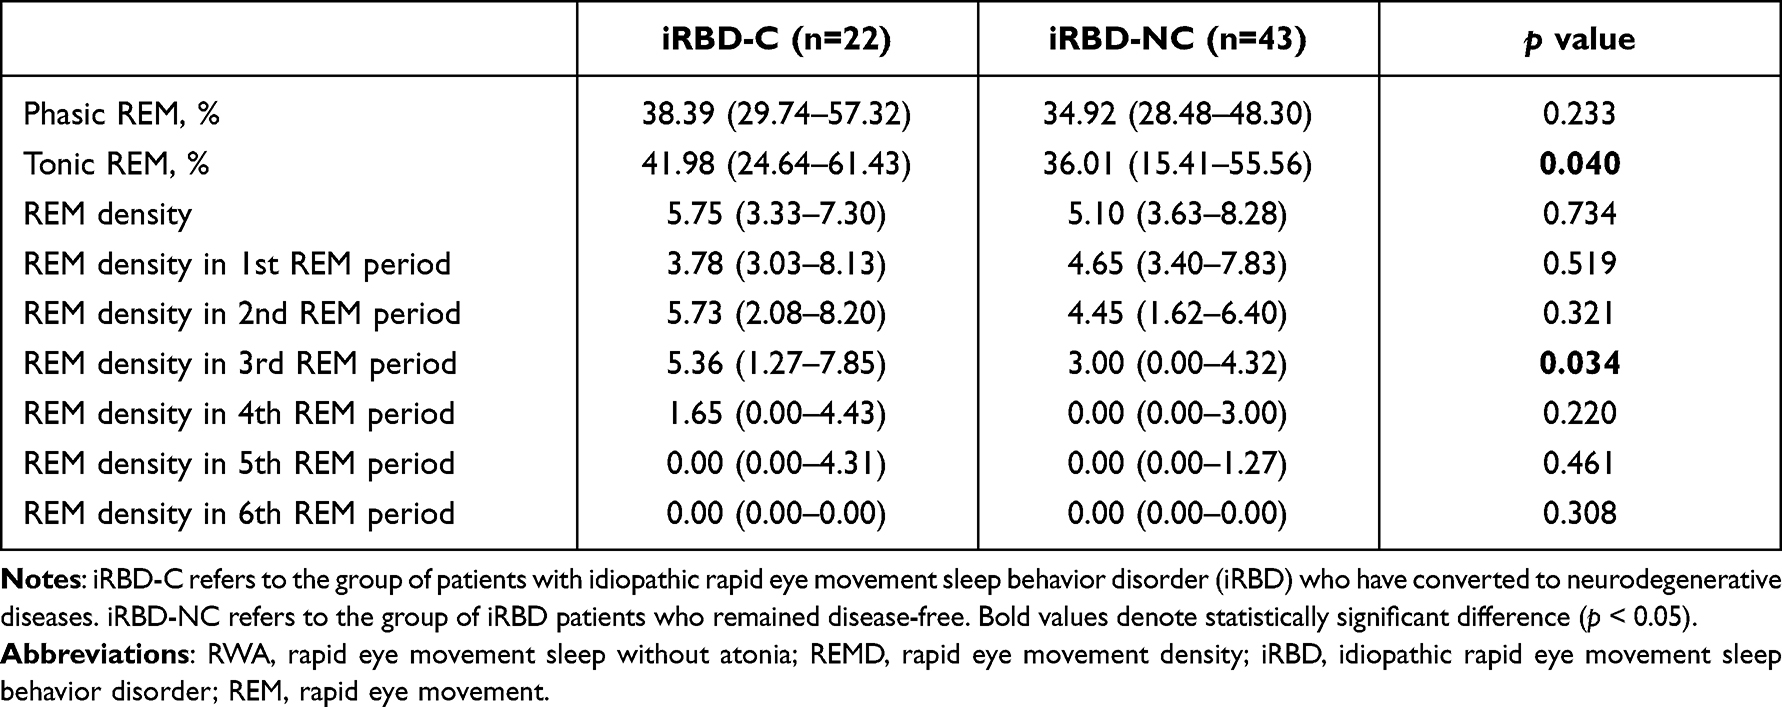 |
Table 3 Comparisons of RWA and REMD Variables Between iRBD Patients Who Have Converted and Those Who Remained Disease Free |
Additionally, ROC analyses revealed that RBD severity, as assessed with RBD-HK (Area Under the Curve, AUC = 0.555, p = 0.471), was not the predictor of neurodegeneration in iRBD.
EEG Power-Spectral Analysis
Relative Power
A significant group-by-REM sleep-state interaction was found in the alpha, alpha2, and delta bands. Further simple effect analyses demonstrated a significant decrease in alpha, alpha1, alpha2, beta, beta1, and sigma and increased delta power in phasic REM sleep in the iRBD-C group (Figure 1).
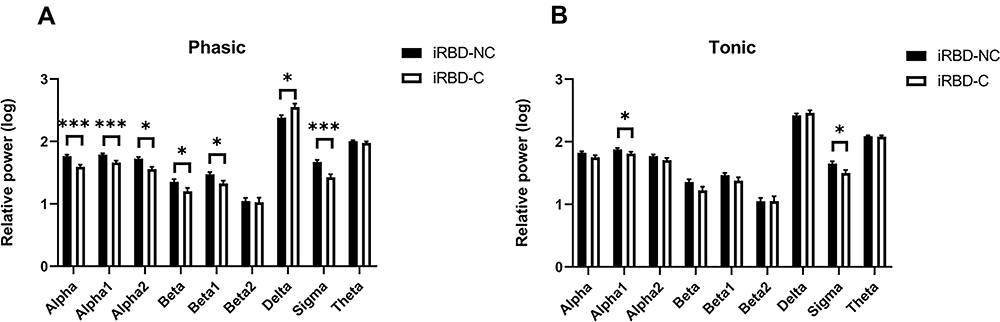 |
Figure 1 Comparisons of the relative power between the iRBD-C and the iRBD-NC group during (A) phasic REM sleep and (B) tonic REM sleep. Results are stated as mean ± standard error of the mean. *Denotes p < 0.05; ***Denotes p < 0.001. |
During phasic REM sleep, the iRBD-C group showed lower alpha, alpha1, and alpha2 and higher delta power in the central and occipital regions compared to the iRBD-NC group. Additionally, the iRBD-C group exhibited lower frontal alpha, alpha1 power, occipital beta, and sigma power than the iRBD-NC group. During tonic REM sleep, iRBD phenoconverters exhibited lower alpha, beta1, and sigma power in occipital areas (Figure 2).
 |
Figure 2 Comparisons of the relative power between the iRBD-C and the iRBD-NC group during (A–C) phasic REM sleep and (D–F) tonic REM sleep in three regions of interest (frontal, central and occipital) respectively. Results are stated as mean ± standard error of the mean. *Denotes p < 0.05; **Denotes p < 0.01; ***Denotes p < 0.001. |
Slow-to-Fast Frequency Ratios
More generalized EEG slowing was observed during the phasic period in iRBD phenoconverters compared to the iRBD-NC group. Specifically, the iRBD-C group exhibited a higher ratio1, ratio2, and ratio4 in central and occipital regions during phasic REM sleep and a higher ratio1, ratio3 and ratio4 only in occipital regions during tonic REM sleep than the nonconverted group (Figure 3).
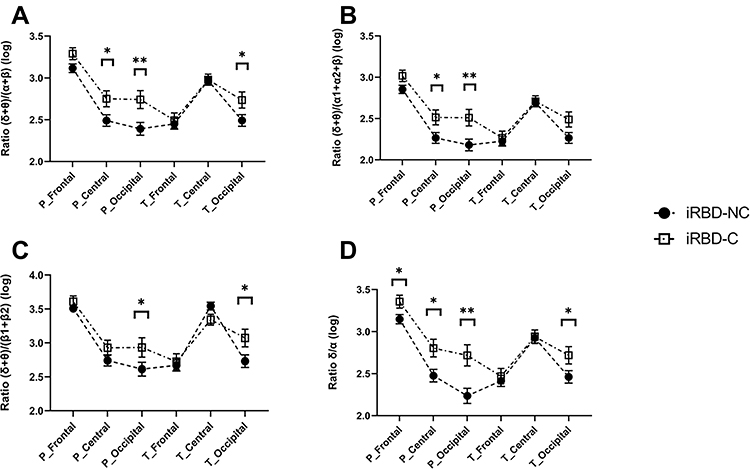 |
Figure 3 Comparisons between the iRBD-C and the iRBD-NC group on four slow-to-fast ratios (A–D). Results are stated as mean ± standard error of the mean. *Denotes p < 0.05; **Denotes p < 0.01. Notes: P_Frontal refers to the ratio in frontal regions during the phasic REM sleep, P_Central refers to the ratio in central regions during the phasic REM sleep, P_Occipital refers to the ratio in occipital regions during the phasic REM sleep, T_Frontal refers to the ratio in frontal regions during the tonic REM sleep, T_Central refers to the ratio in central regions during the tonic REM sleep, T_Occipital refers to the ratio in occipital regions during the tonic REM sleep. |
ROC analyses revealed that ratio1 (( ) in the occipital areas during phasic REM sleep turned out to be the best predictor of iRBD phenoconversion, yielding an AUC of 0.749 (95% CI 0.625 to 0.874), with the optimal cutoff value of 2.204 (Figure 4). Further details of other predictors are included in Table 4.
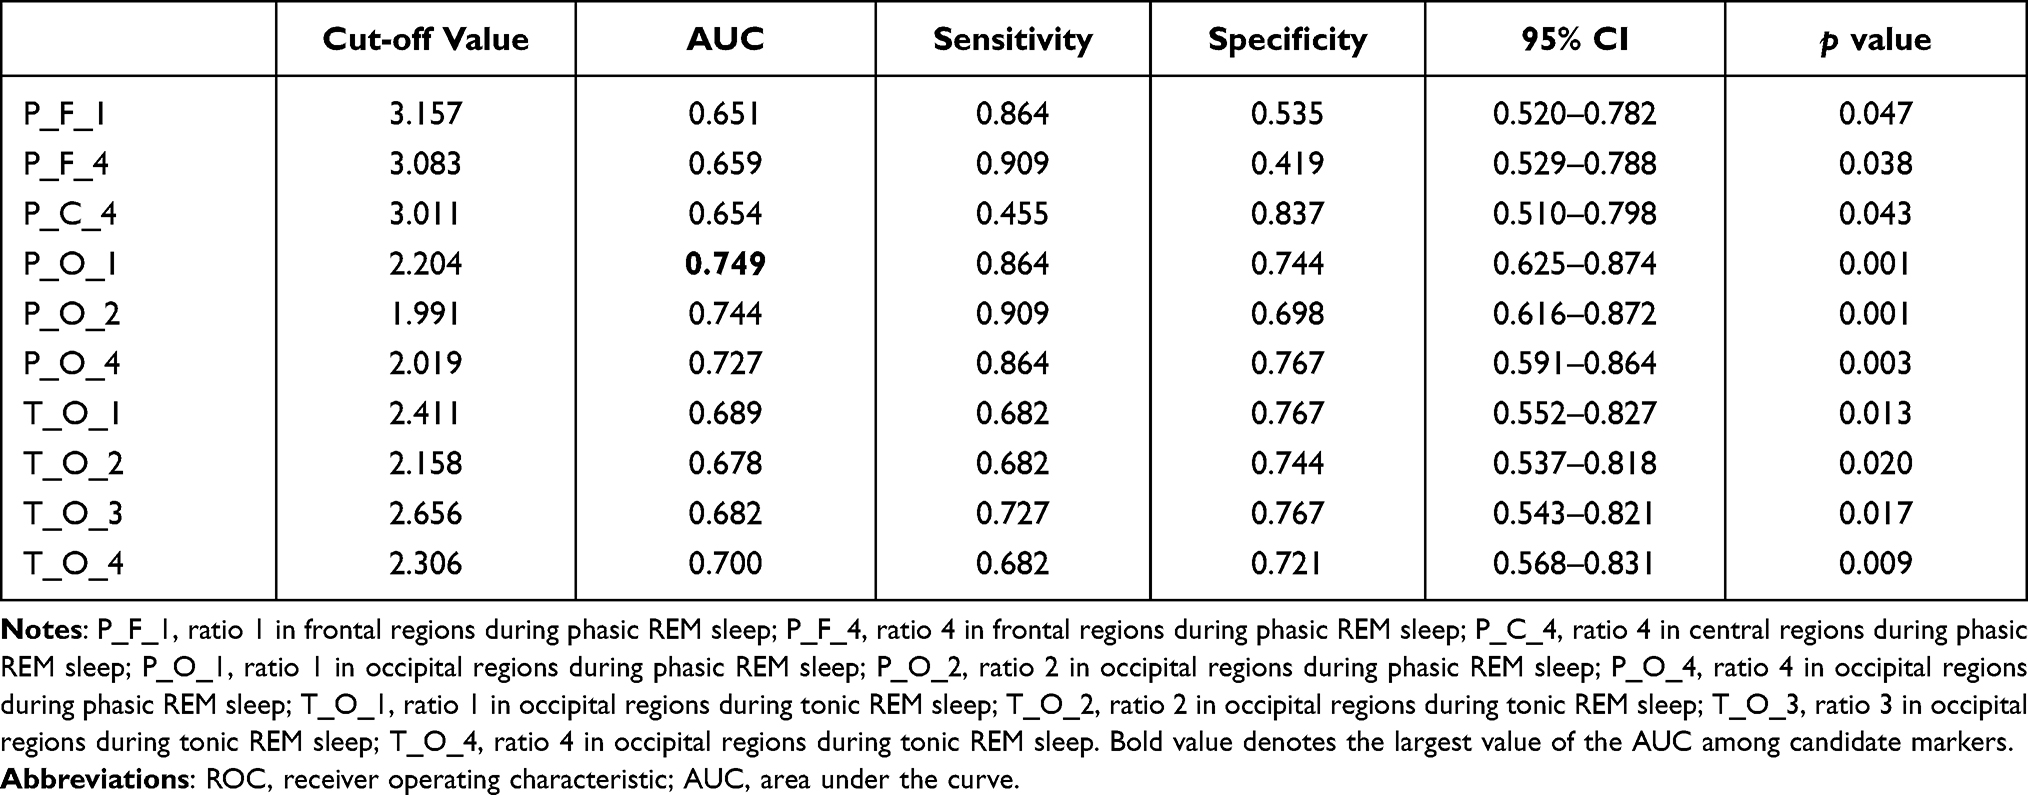 |
Table 4 Results of ROC Curves of Candidate Biomarkers |
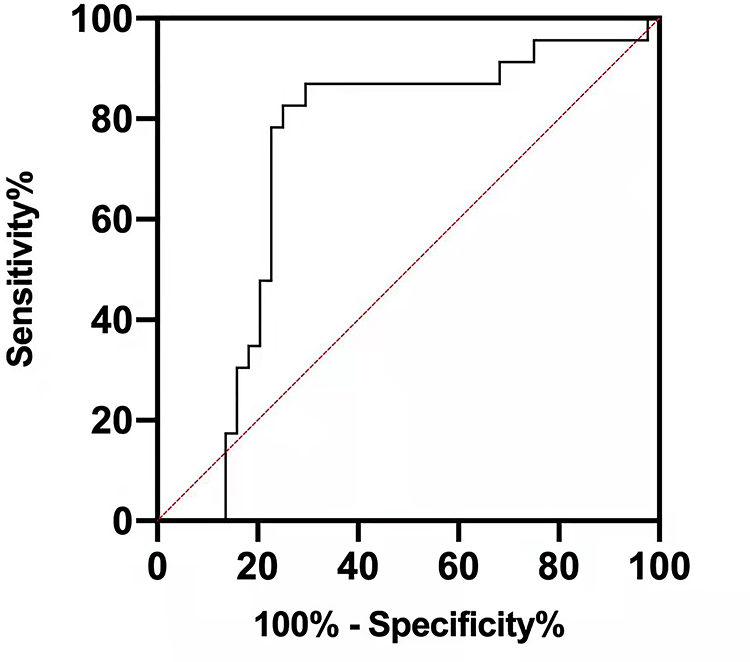 |
Figure 4 ROC curves of ratio1 in the occipital regions during phasic REM sleep. |
Discussion
In this retro-prospective study, iRBD patients characterized by EEG slowing, especially in a more generalized, slowing manner during phasic REM sleep, were more likely to develop neurodegenerative diseases. This study provided evidence that generalized EEG slowing during phasic REM sleep, instead of RBD severity assessed with RBD-HK, in iRBD patients may potentially be the early marker of neurodegeneration in iRBD.
Consistent with results from previous longitudinal studies, EEG slowing was found in iRBD patients with later development of cognitive declines41 and in PD patients with progression into PD with dementia.42 This was further supported by a recent study showing that parameters of transcranial magnetic stimulation were positively correlated with cognitive functions in patients with parkinsonian syndrome.43 Additionally, waking EEG slowing was also proved as the biomarker of neurodegeneration in iRBD.13 In this study, generalized EEG slowing also was observed in iRBD phenoconverters. However, our study also indicated that EEG slowing was demonstrated in a more generalized way during the phasic period. The plausible reasons for this phenomenon are twofold. Firstly, the widely distributed slow oscillations during phasic periods may assist in the disconnection from the external environment.44 A second factor is that this pattern of slow oscillations may reflect Ponto-Geniculo-Occipital waves,45 which are closely related to the dreaming experience in the phasic state.46 Further studies to delve into the microarchitecture of REM sleep may provide novel insight into the underlying mechanisms of neurodegeneration in iRBD.
In alignment with previous studies,13,41,42,47–49 the EEG slowing pattern demonstrated increased delta power and decreased alpha and beta power. Further research49 showed that decreased beta power during phasic periods indicated abnormal motor-cortex activation. Therefore, it is conceivable that iRBD patients with abnormal motor-cortex activation are more likely to develop neurodegeneration, which is supported by the study demonstrated that iRBD patients exhibited changes of motor evoked potential markers of inhibition and facilitation.50 Moreover, our results showed that the iRBD-C group exhibited a decrement in frontal, central, and occipital alpha power during the phasic period, resembling the information processing during wakefulness.51 Of note, occipital alpha power decreased during phasic periods was interpreted as visual-cortex activation associated with mental imagery processing.52,53 Thus, iRBD patients with more pronounced visual-cortex activation are more susceptible to conversion into neurodegenerative diseases. Furthermore, the iRBD-C group showed an increment in delta power during phasic REM periods in this study. In fact, the low-frequency oscillations, including delta-power oscillations, represent EEG slowing. Notably, delta power increased in phasic states, denoted a deep sleep.20 Additionally, our results demonstrated that iRBD phenoconverters displayed a decrease in sigma power during both the phasic and tonic states. In line with our results, a reduction of sleep-spindle activities was observed during NREM sleep state in AD, PD, iRBD, and PD patients who later developed dementia.54–56 Researchers also proposed that decreased sleep-spindle activities in iRBD may involve impaired thalamocortical networks, reflecting early neurodegenerative changes.57 However, to the best of our knowledge, few researchers have investigated the role of sleep-spindle activity during the REM state, especially during the phasic and tonic periods, respectively, in iRBD phenoconversion in a longitudinal context. Further studies with a larger sample size on this topic are warranted. Taken together, iRBD patients who were susceptible to converting to neurodegenerative diseases exhibited prominent motor- and visual-cortex activation and impaired thalamocortical networks at the baseline.
The specific pathogenesis of iRBD has not yet been fully understood. Briefly, converging evidence has shown that a complex but integrative neuronal system has been responsible for the pathophysiology of iRBD,58 involving the sublaterodorsal tegmental nucleus,59 γ-aminobutyric acid and glycine-containing neurons of the ventral medulla,60,61 the cortical limbic system,62 and the supplementary motor area bypassing the basal ganglia.63 Our findings echo several studies, supporting the notion that cortical abnormalities are involved in iRBD. In particular, imaging studies demonstrated the motor pathway and generator responsible for dream-enacting behaviors.63,64 Moreover, structural MRI measures showed that iRBD patients exhibited diffuse decreased cortical thickness in the frontal, parietal, and occipital cortex and lingual gyrus and fusiform gyrus.65–67 Collectively, this study provided additional electrophysiological evidence for the involvement of cortical networks, including the motor- and visual-cortex and thalamocortical networks as mentioned above, in the pathophysiology of iRBD.
The results showed that iRBD phenoconverters tend to have less TST, stage 2 sleep, more PLMArI, and PLM-NREM than those who remained disease-free. In fact, previous longitudinal studies revealed a reduction in REM-sleep percentage in iRBD phenoconverters13 and a decrease in stage 2 duration in PD patients who later developed dementia.42 However, our findings concur with prior studies that found similar sleep macrostructure changes in PD patients compared to controls,68 indicating early neurodegeneration in iRBD.
In addition, our study revealed that iRBD patients who have later developed neurodegenerative diseases exhibited significantly increased %tonic EMG activity and REMD in the third REM episode compared to those who remained disease-free. As for RWA, our results were consistent with previous findings, which indicated that increased tonic EMG activity could serve as a stable marker of neurodegeneration in iRBD.10–12 The significant increase in REMD only during the third REM episode may indicate that this unique pattern becomes obvious during the late stage of REM sleep since the REM-sleep duration becomes longer as the night goes on.
We proposed that RBD severity, as assessed with RBD-HK, was not the predictor of the conversion to neurodegenerative diseases in iRBD patients, which has not been reported in previous literature. Notably, our study suggests that the optimal time for neuroprotective interventions would be when EEG slowing is observed instead of simply based on RBD severity. Therefore, performing PSG several times when RBD symptoms are noted is highly recommended.
The strengths of this study lie in the relatively comprehensive analyses of REM-sleep-related features derived from PSG data in iRBD patients. Moreover, the iRBD patients included in this study underwent a relatively lengthy follow-up duration, contributing to the accurate outcome prediction. Furthermore, our study provided evidence for the choice of timing of neuroprotective treatment.
There are several limitations of this present study. First, for a small proportion of the patients, their disease status was defined based on cognitive tests or a telephone interview with the physician. Nevertheless, an agreement between neurological specialists was obtained if necessary to minimize diagnostic errors. Second, diagnosis of the disease lacked the evidence from postmortem studies. Third, the sample size is relatively small, and thus subgroup analyses were precluded. Also, selection bias should be considered since the patients were from one sleep center, and thus were not representative of all iRBD patients in the population. Moreover, the possibility of recall bias cannot be totally excluded. Finally, high-density EEG data are not available due to the shortage of the equipment at that time.
Conclusion
In summation, this study indicated that the presence of EEG slowing, especially the more generalized EEG slowing during phasic REM sleep, could serve as the stable biomarker of neurodegeneration in iRBD. It is noteworthy that iRBD patients susceptible to converting to neurodegenerative diseases exhibited prominent motor- and visual-cortex activation and impaired thalamocortical networks at the baseline. Additionally, our results suggest that RBD severity was not the predictor of phenoconversion in iRBD. Therefore, we propose that undertaking PSG several times after the onset of RBD symptoms is essential for choosing the time point to conduct neuroprotective therapies. Nonetheless, further studies with a larger sample size exploring the probability of RBD severity as the biomarker in predicting neurodegeneration in iRBD are warranted.
Acknowledgments
We would like to thank the technicians in the Sleep Center of The Second Affiliated Hospital of Soochow University for the assistance of data collection.
Funding
This work was supported by grants from the National Key R&D Program of China (No. 2017YFC0909100), Jiangsu Provincial Key R&D Program (No. BE2018658), Discipline Construction Program of the Second Affiliated Hospital Soochow University (XKTJ-XK202001) and the Priority Academic Program Development of Jiangsu Higher Education Institutions (PAPD), Suzhou Medical and Health Technology Innovation Project (SKJY2021090), and Postgraduate Research & Practice Innovation Program of Jiangsu Province (SJCX21_1348).
Disclosure
The authors report no conflicts of interest for this work.
References
1. Schenck CH, Bundlie SR, Ettinger MG, Mahowald MW. Chronic behavioral disorders of human REM sleep: a new category of parasomnia. Sleep. 1986;9(2):293–308. doi:10.1093/sleep/9.2.293
2. Iranzo A, Santamaria J, Tolosa E. Idiopathic rapid eye movement sleep behaviour disorder: diagnosis, management, and the need for neuroprotective interventions. Lancet Neurol. 2016;15(4):405–419. doi:10.1016/S1474-4422(16)00057-0
3. Iranzo A, Molinuevo JL, Santamaria J, et al. Rapid-eye-movement sleep behaviour disorder as an early marker for a neurodegenerative disorder: a descriptive study. Lancet Neurol. 2006;5(7):572–577. doi:10.1016/S1474-4422(06)70476-8
4. Postuma RB, Gagnon JF, Vendette M, Fantini ML, Massicotte-Marquez J, Montplaisir J. Quantifying the risk of neurodegenerative disease in idiopathic REM sleep behavior disorder. Neurology. 2009;72(15):1296–1300. doi:10.1212/01.wnl.0000340980.19702.6e
5. Schenck CH, Boeve BF, Mahowald MW. Delayed emergence of a parkinsonian disorder or dementia in 81% of older men initially diagnosed with idiopathic rapid eye movement sleep behavior disorder: a 16-year update on a previously reported series. Sleep Med. 2013;14(8):744–748. doi:10.1016/j.sleep.2012.10.009
6. Mollenhauer B, Trautmann E, Sixel-Doring F, et al. Nonmotor and diagnostic findings in subjects with de novo Parkinson disease of the DeNoPa cohort. Neurology. 2013;81(14):1226–1234. doi:10.1212/WNL.0b013e3182a6cbd5
7. Iranzo A, Fernandez-Arcos A, Tolosa E, et al. Neurodegenerative disorder risk in idiopathic REM sleep behavior disorder: study in 174 patients. PLoS One. 2014;9(2):e89741. doi:10.1371/journal.pone.0089741
8. Postuma RB, Iranzo A, Hu M, et al. Risk and predictors of dementia and parkinsonism in idiopathic REM sleep behaviour disorder: a multicentre study. Brain. 2019;142(3):744–759. doi:10.1093/brain/awz030
9. Rusz J, Hlavnicka J, Novotny M, et al. Speech biomarkers in rapid eye movement sleep behavior disorder and Parkinson disease. Ann Neurol. 2021;90(1):62–75. doi:10.1002/ana.26085
10. Postuma RB, Gagnon JF, Rompre S, Montplaisir JY. Severity of REM atonia loss in idiopathic REM sleep behavior disorder predicts Parkinson disease. Neurology. 2010;74(3):239–244. doi:10.1212/WNL.0b013e3181ca0166
11. Liu Y, Zhang J, Lam SP, et al. Electromyography activity level in rapid eye movement sleep predicts neurodegenerative diseases in idiopathic rapid eye movement sleep behavior disorder: a 5-year longitudinal study. Sleep Med. 2019;56:128–134. doi:10.1016/j.sleep.2019.01.018
12. Nepozitek J, Dostalova S, Dusek P, et al. Simultaneous tonic and phasic REM sleep without atonia best predicts early phenoconversion to neurodegenerative disease in idiopathic REM sleep behavior disorder. Sleep. 2019;42(9). doi:10.1093/sleep/zsz132.
13. Rodrigues Brazete J, Gagnon JF, Postuma RB, Bertrand JA, Petit D, Montplaisir J. Electroencephalogram slowing predicts neurodegeneration in rapid eye movement sleep behavior disorder. Neurobiol Aging. 2016;37:74–81. doi:10.1016/j.neurobiolaging.2015.10.007
14. Ferini-Strambi L, Fasiello E, Sforza M, Salsone M, Galbiati A. Neuropsychological, electrophysiological, and neuroimaging biomarkers for REM behavior disorder. Expert Rev Neurother. 2019;19(11):1069–1087. doi:10.1080/14737175.2019.1640603
15. Figorilli M, Lanza G, Congiu P, et al. Neurophysiological aspects of REM Sleep Behavior Disorder (RBD): a narrative review. Brain Sci. 2021;11(12):1588. doi:10.3390/brainsci11121588
16. Ermis U, Krakow K, Voss U. Arousal thresholds during human tonic and phasic REM sleep. J Sleep Res. 2010;19(3):400–406. doi:10.1111/j.1365-2869.2010.00831.x
17. Andrillon T, Pressnitzer D, Leger D, Kouider S. Formation and suppression of acoustic memories during human sleep. Nat Commun. 2017;8(1):179. doi:10.1038/s41467-017-00071-z
18. Simor P, Gombos F, Blaskovich B, Bodizs R. Long-range alpha and beta and short-range gamma EEG synchronization distinguishes phasic and tonic REM periods. Sleep. 2018;41(3). doi:10.1093/sleep/zsx210
19. Manni R, Terzaghi M, Glorioso M. Motor-behavioral episodes in REM sleep behavior disorder and phasic events during REM sleep. Sleep. 2009;32(2):241–245. doi:10.1093/sleep/32.2.241
20. Simor P, van Der Wijk G, Gombos F, Kovacs I. The paradox of rapid eye movement sleep in the light of oscillatory activity and cortical synchronization during phasic and tonic microstates. Neuroimage. 2019;202:116066. doi:10.1016/j.neuroimage.2019.116066
21. Simor P, van der Wijk G, Nobili L, Peigneux P. The microstructure of REM sleep: why phasic and tonic? Sleep Med Rev. 2020;52:101305. doi:10.1016/j.smrv.2020.101305
22. Valomon A, Riedner BA, Jones SG, et al. A high-density electroencephalography study reveals abnormal sleep homeostasis in patients with rapid eye movement sleep behavior disorder. Sci Rep. 2021;11(1):4758. doi:10.1038/s41598-021-83980-w
23. Westchester IT, Hauri PJC. The International Classification of Sleep Disorders: Diagnostic and Coding Manual. 2nd ed. American Academy of Sleep Medicine; 2005.
24. Ferri R, Rundo F, Silvani A, et al. REM sleep EEG instability in REM sleep behavior disorder and clonazepam effects. Sleep. 2017;40(8). doi:10.1093/sleep/zsx080.
25. McCarter SJ, St Louis EK, Sandness DJ, et al. Antidepressants increase REM sleep muscle tone in patients with and without REM sleep behavior disorder. Sleep. 2015;38(6):907–917. doi:10.5665/sleep.4738
26. McGrane IR, Leung JG, St Louis EK, Boeve BF. Melatonin therapy for REM sleep behavior disorder: a critical review of evidence. Sleep Med. 2015;16(1):19–26. doi:10.1016/j.sleep.2014.09.011
27. Folstein MF, Folstein SE, McHugh PR. “Mini-mental state”. A practical method for grading the cognitive state of patients for the clinician. J Psychiatr Res. 1975;12(3):189–198. doi:10.1016/0022-3956(75)90026-6
28. Yu J, Li J, Huang X. The Beijing version of the Montreal cognitive assessment as a brief screening tool for mild cognitive impairment: a community-based study. BMC Psychiatry. 2012;12(1):156. doi:10.1186/1471-244X-12-156
29. Chen NH, Johns MW, Li HY, et al. Validation of a Chinese version of the Epworth sleepiness scale. Qual Life Res. 2002;11(8):817–821. doi:10.1023/A:1020818417949
30. Lam SP, Li SX, Zhang J, Wing YK. Development of scales for assessment of rapid eye movement sleep behavior disorder (RBD). Sleep Med. 2013;14(8):734–738. doi:10.1016/j.sleep.2012.09.008
31. Shen SS, Shen Y, Xiong KP, et al. Validation study of REM sleep behavior disorder questionnaire-Hong Kong (RBDQ-HK) in east China. Sleep Med. 2014;15(8):952–958. doi:10.1016/j.sleep.2014.03.020
32. Li SX, Wing YK, Lam SP, et al. Validation of a new REM sleep behavior disorder questionnaire (RBDQ-HK). Sleep Med. 2010;11(1):43–48. doi:10.1016/j.sleep.2009.06.008
33. Gelb DJ, Oliver E, Gilman S. Diagnostic criteria for Parkinson disease. Arch Neurol. 1999;56(1):33–39. doi:10.1001/archneur.56.1.33
34. Postuma RB, Berg D, Stern M, et al. MDS clinical diagnostic criteria for Parkinson’s disease. Mov Disord. 2015;30(12):1591–1601. doi:10.1002/mds.26424
35. Gilman S, Wenning GK, Low PA, et al. Second consensus statement on the diagnosis of multiple system atrophy. Neurology. 2008;71(9):670–676. doi:10.1212/01.wnl.0000324625.00404.15
36. Dubois B, Feldman HH, Jacova C, et al. Research criteria for the diagnosis of Alzheimer’s disease: revising the NINCDS-ADRDA criteria. Lancet Neurol. 2007;6(8):734–746. doi:10.1016/S1474-4422(07)70178-3
37. McKhann GM, Knopman DS, Chertkow H, et al. The diagnosis of dementia due to Alzheimer’s disease: recommendations from the National Institute on Aging-Alzheimer’s Association workgroups on diagnostic guidelines for Alzheimer’s disease. Alzheimers Dement. 2011;7(3):263–269. doi:10.1016/j.jalz.2011.03.005
38. Gauthier S, Reisberg B, Zaudig M, et al. Mild cognitive impairment. Lancet. 2006;367(9518):1262–1270. doi:10.1016/S0140-6736(06)68542-5
39. Montplaisir J, Gagnon JF, Fantini ML, et al. Polysomnographic diagnosis of idiopathic REM sleep behavior disorder. Mov Disord. 2010;25(13):2044–2051. doi:10.1002/mds.23257
40. Lucidi F, Devoto A, Violani C, De Gennaro L, Mastracci P, Bertini M. Rapid eye movements density as a measure of sleep need: REM density decreases linearly with the reduction of prior sleep duration. Electroencephalogr Clin Neurophysiol. 1996;99(6):556–561. doi:10.1016/S0013-4694(96)95671-0
41. Iranzo A, Isetta V, Molinuevo JL, et al. Electroencephalographic slowing heralds mild cognitive impairment in idiopathic REM sleep behavior disorder. Sleep Med. 2010;11(6):534–539. doi:10.1016/j.sleep.2010.03.006
42. Latreille V, Carrier J, Gaudet-Fex B, et al. Electroencephalographic prodromal markers of dementia across conscious states in Parkinson’s disease. Brain. 2016;139(Pt 4):1189–1199. doi:10.1093/brain/aww018
43. Fisicaro F, Lanza G, Cantone M, et al. Clinical and electrophysiological hints to TMS in de novo patients with parkinson’s disease and progressive supranuclear palsy. J Pers Med. 2020;10(4):274. doi:10.3390/jpm10040274
44. Marzano C, Ferrara M, Curcio G, De Gennaro L. The effects of sleep deprivation in humans: topographical electroencephalogram changes in non-rapid eye movement (NREM) sleep versus REM sleep. J Sleep Res. 2010;19(2):260–268. doi:10.1111/j.1365-2869.2009.00776.x
45. Bernardi G, Betta M, Ricciardi E, Pietrini P, Tononi G, Siclari F. Regional delta waves in human rapid eye movement sleep. J Neurosci. 2019;39(14):2686–2697. doi:10.1523/JNEUROSCI.2298-18.2019
46. Gott JA, Liley DT, Hobson JA. Towards a functional understanding of PGO waves. Front Hum Neurosci. 2017;11:89. doi:10.3389/fnhum.2017.00089
47. Waterman D, Elton M, Hofman W, Woestenburg JC, Kok A. EEG spectral power analysis of phasic and tonic REM sleep in young and older male subjects. J Sleep Res. 1993;2(1):21–27. doi:10.1111/j.1365-2869.1993.tb00056.x
48. Fantini ML, Gagnon JF, Petit D, et al. Slowing of electroencephalogram in rapid eye movement sleep behavior disorder. Ann Neurol. 2003;53(6):774–780. doi:10.1002/ana.10547
49. Sunwoo JS, Cha KS, Byun JI, et al. Abnormal activation of motor cortical network during phasic REM sleep in idiopathic REM sleep behavior disorder. Sleep. 2019;42(2). doi:10.1093/sleep/zsy227.
50. Lanza G, Arico D, Lanuzza B, et al. Facilitatory/inhibitory intracortical imbalance in REM sleep behavior disorder: early electrophysiological marker of neurodegeneration? Sleep. 2020;43(3). doi:10.1093/sleep/zsz242.
51. Davidson RJ, Chapman JP, Chapman LJ, Henriques JB. Asymmetrical brain electrical activity discriminates between psychometrically-matched verbal and spatial cognitive tasks. Psychophysiology. 1990;27(5):528–543. doi:10.1111/j.1469-8986.1990.tb01970.x
52. Cantero JL, Atienza M, Salas RM, Gomez C. Alpha power modulation during periods with rapid oculomotor activity in human REM sleep. Neuroreport. 1999;10(9):1817–1820. doi:10.1097/00001756-199906230-00003
53. Jouny C, Chapotot F, Merica H. EEG spectral activity during paradoxical sleep: further evidence for cognitive processing. Neuroreport. 2000;11(17):3667–3671. doi:10.1097/00001756-200011270-00016
54. Christensen JA, Kempfner J, Zoetmulder M, et al. Decreased sleep spindle density in patients with idiopathic REM sleep behavior disorder and patients with Parkinson’s disease. Clin Neurophysiol. 2014;125(3):512–519. doi:10.1016/j.clinph.2013.08.013
55. Latreille V, Carrier J, Lafortune M, et al. Sleep spindles in Parkinson’s disease may predict the development of dementia. Neurobiol Aging. 2015;36(2):1083–1090. doi:10.1016/j.neurobiolaging.2014.09.009
56. Gorgoni M, Lauri G, Truglia I, et al. Parietal fast sleep spindle density decrease in Alzheimer’s disease and amnesic mild cognitive impairment. Neural Plast. 2016;2016:8376108. doi:10.1155/2016/8376108
57. Sunwoo JS, Cha KS, Byun JI, et al. Nonrapid eye movement sleep electroencephalographic oscillations in idiopathic rapid eye movement sleep behavior disorder: a study of sleep spindles and slow oscillations. Sleep. 2021;44(2). doi:10.1093/sleep/zsaa160.
58. Peever J, Luppi PH, Montplaisir J. Breakdown in REM sleep circuitry underlies REM sleep behavior disorder. Trends Neurosci. 2014;37(5):279–288. doi:10.1016/j.tins.2014.02.009
59. Ehrminger M, Latimier A, Pyatigorskaya N, et al. The coeruleus/subcoeruleus complex in idiopathic rapid eye movement sleep behaviour disorder. Brain. 2016;139(Pt 4):1180–1188. doi:10.1093/brain/aww006
60. Boissard R, Gervasoni D, Schmidt MH, Barbagli B, Fort P, Luppi PH. The rat ponto-medullary network responsible for paradoxical sleep onset and maintenance: a combined microinjection and functional neuroanatomical study. Eur J Neurosci. 2002;16(10):1959–1973. doi:10.1046/j.1460-9568.2002.02257.x
61. Valencia Garcia S, Libourel PA, Lazarus M, Grassi D, Luppi PH, Fort P. Genetic inactivation of glutamate neurons in the rat sublaterodorsal tegmental nucleus recapitulates REM sleep behaviour disorder. Brain. 2017;140(2):414–428. doi:10.1093/brain/aww310
62. Dauvilliers Y, Schenck CH, Postuma RB, et al. REM sleep behaviour disorder. Nat Rev Dis Primers. 2018;4(1):19. doi:10.1038/s41572-018-0016-5
63. Mayer G, Bitterlich M, Kuwert T, Ritt P, Stefan H. Ictal SPECT in patients with rapid eye movement sleep behaviour disorder. Brain. 2015;138(Pt 5):1263–1270. doi:10.1093/brain/awv042
64. Dauvilliers Y, Peigneux P. Ictal SPECT in patients with rapid eye movement sleep behaviour disorder. Brain. 2015;138(Pt 11):e390. doi:10.1093/brain/awv146
65. Vendette M, Gagnon JF, Soucy JP, et al. Brain perfusion and markers of neurodegeneration in rapid eye movement sleep behavior disorder. Mov Disord. 2011;26(9):1717–1724. doi:10.1002/mds.23721
66. Rahayel S, Montplaisir J, Monchi O, et al. Patterns of cortical thinning in idiopathic rapid eye movement sleep behavior disorder. Mov Disord. 2015;30(5):680–687. doi:10.1002/mds.25820
67. Pereira JB, Weintraub D, Chahine L, Aarsland D, Hansson O, Westman E. Cortical thinning in patients with REM sleep behavior disorder is associated with clinical progression. NPJ Parkinsons Dis. 2019;5(1):7. doi:10.1038/s41531-019-0079-3
68. Gonzalez-Naranjo JE, Alfonso-Alfonso M, Grass-Fernandez D, et al. Analysis of sleep macrostructure in patients diagnosed with Parkinson’s disease. Behav Sci. 2019;9(1):6.
 © 2022 The Author(s). This work is published and licensed by Dove Medical Press Limited. The
full terms of this license are available at https://www.dovepress.com/terms
and incorporate the Creative Commons Attribution
- Non Commercial (unported, 3.0) License.
By accessing the work you hereby accept the Terms. Non-commercial uses of the work are permitted
without any further permission from Dove Medical Press Limited, provided the work is properly
attributed. For permission for commercial use of this work, please see paragraphs 4.2 and 5 of our Terms.
© 2022 The Author(s). This work is published and licensed by Dove Medical Press Limited. The
full terms of this license are available at https://www.dovepress.com/terms
and incorporate the Creative Commons Attribution
- Non Commercial (unported, 3.0) License.
By accessing the work you hereby accept the Terms. Non-commercial uses of the work are permitted
without any further permission from Dove Medical Press Limited, provided the work is properly
attributed. For permission for commercial use of this work, please see paragraphs 4.2 and 5 of our Terms.