Back to Journals » Journal of Pain Research » Volume 14
Gate Mechanism and Parameter Analysis of Anodal-First Waveforms for Improving Selectivity of C-Fiber Nerves
Authors He S ![]() , Tripanpitak K, Yoshida Y, Takamatsu S, Huang SY, Yu W
, Tripanpitak K, Yoshida Y, Takamatsu S, Huang SY, Yu W
Received 17 March 2021
Accepted for publication 6 May 2021
Published 15 June 2021 Volume 2021:14 Pages 1785—1807
DOI https://doi.org/10.2147/JPR.S311559
Checked for plagiarism Yes
Review by Single anonymous peer review
Peer reviewer comments 2
Editor who approved publication: Professor E Alfonso Romero-Sandoval
Siyu He,1 Kornkanok Tripanpitak,2 Yu Yoshida,2 Shozo Takamatsu,3 Shao Ying Huang,4 Wenwei Yu2,5
1Graduate School of Engineering, Chiba University, Chiba, Japan; 2Graduate School of Science and Engineering, Chiba University, Chiba, Japan; 3Omron Healthcare Co., Ltd, Kyoto, Japan; 4Engineering Product Development, Singapore University of Technology and Design, Singapore; 5Center for Frontier Medical Engineering, Chiba University, Chiba, Japan
Correspondence: Wenwei Yu
Graduate School of Science and Technology, Building1-501, Yayoi-Cho, Inage-Ku, Chiba, 263-8522, Japan
Tel/Fax +81 043 290 3231
Email [email protected]
Purpose: Few investigations have been conducted on the selective stimulation of small-radius unmyelinated C nerves (C), which are critical to both the recovery of damaged nerves and pain suppression. The purpose of this study is to understand how an anodal pulse in an anodal-first stimulation could improve C-selectivity over myelinated nociceptive Aδ nerves (Aδ) and to further clarify the landscape of the solution space.
Materials and Methods: An adapted Hodgkin–Huxley (HH) model and the McIntyre–Richardson–Grill (MRG) model were used for modeling C and Aδ, respectively, to analyze the underlying ion dynamics and the influence of relevant stimulation waveforms, including monopolar, polarity-symmetric, and asymmetric pulses.
Results: The results showed that polarity asymmetric waveforms with preceding anodal stimulations benefit C-selectivity the most, underlain by the decrease in the potassium ion current of C.
Conclusion: The optimal parameters for C-selectivity have been identified in the low-frequency band, remarkably benefiting the design of selective stimulation waveforms for the recovery of damaged nerves and pain management.
Keywords: anodal-first stimulation, C-selectivity, ion dynamics, polarity-asymmetric waveforms
Introduction
Electrical stimulations have been shown to be effective in restoring the functions of sensory and motor nerves.1–3 Especially among them, electrical stimulation of unmyelinated C-fiber nerves (C) contributes to the recovery of damaged nerves and pain suppression. As reported in the research,4 tibial nerve stimulation (TNS) that activated C could cause statistically significant inhibiting effects on bladder overactivity, though selective stimulation of C has not been addressed since not only C but also Aδ-fiber nerves (Aδ) and Aβ-fiber nerves (Aβ) were activated. Stimulating unmyelinated nerves also helps to suppress chronic pain which is one of the main factors that lower patients’ quality of life (QOL). However, there are few effective treatments for chronic pain to date.5
For the selective stimulation of peripheral unmyelinated nerves, drug control,6 spot-oriented needle stimulation or electroacupuncture,7 lasers,8 heat simulations,9 and low-frequency electrical stimulation10 (0–20 Hz) have been studied, some of which have led to clinical or medical research use. For instance, drugs were used to inactivate certain ion channels, thus selecting specific nerve fibers.11 However, the influence and harm of drugs on the human body due to addiction are evident.12 For spot-oriented stimulation spatial selection, in clinical practice, needles or needle electrodes (ie, acupuncture electrodes) are inserted into specific spots that have a higher spatial distribution of C.13 Since using acupuncture electrodes for stimulation requires professional skills, it is difficult to promote its public use for chronic pain relief.14 Except for electrical stimulation, all other methods are either for clinical use only or require professional-level skills.
Generally, when being electrically stimulated, thick Aδ are more likely to be excited than thin C.15 Nevertheless, distinct properties of the ion channels of different nerve fibers maintain the possibility of selective stimulation of C. There have been two categories of approaches for selective stimulations of nociceptive nerve fibers. The first is nerve-specific frequency stimulation, which uses the distinctive response of nociceptive nerves to different frequency bands. An example is Neurometer® (Neurotron, USA).16 This demonstrates the possibility of selective stimulation by surface electrodes. However, as reported, low-frequency sine waves cannot selectively and securely stimulate C.17,18 The second category of approach is prepulsed stimulation which applies a preliminary stimulation to alter the states of the neuromembrane and ion channel gate variables and change the activation threshold of a specific nerve responding to subsequent stimulations. A method called QTRAC© (Institute of Neurology, London) shows that a preceding cathodal pulse before a main cathodal stimulation can promote a reduction in the stimulation intensity for excitation.19 In 1995, a preceding square stimulation was proposed to change the neural excitation threshold of myelinated nerves, showing that cathodal prestimulation can suppress nerve excitability, and anodal prestimulation can promote nerve excitability.20 However, the findings of the two studies on myelinated nerves are opposite. This contradiction might be caused by the different characteristics of their ion channel models. Along with this consideration, the unmyelinated fibers might show differences in response to a preceding stimulation. This has not been addressed so far in the literature and thus needs to be investigated systematically and compared with Aδ.
On the other hand, sensory nerve action potentials (SNAPs) can show two separate deflections, ie, double peak potentials, responding to nerve stimulation. Moreover, it has been discovered in animal experiments that only anodal stimulation can generate action potentials in tissues such as the myocardium, and this method is named anode break.21 It was further investigated with an axon-level theoretical framework, showing that an inward-rectifier potassium ion current is essential for an anode break.21 Both membrane potential and stimulation duration affect the development of an anode break. When the membrane potential is in a more depolarized position, the potassium ion current decreases, and a current flowing into the axon is generated only at the end of anodal stimulation to form an action potential.
Our hypothesis is that the mechanism of anode break might also work to further lower the threshold of C. In our previous study, we clarified that a low-frequency biphasic square waveform could improve C-selectivity.14 However, neither the mechanism of the preceding anodal stimulation for C-selectivity nor the important parameters of the biphasic square wave have been explored.
The purpose of this study was to investigate and understand the efficacy of preceding anodal stimulation on selectively stimulating C and the underlying ion channel mechanism. This study aimed to identify the waveform parameters that enable the selectivity of nociceptive C over myelinated nociceptive Aδ using computational models of the nerves, and to further clarify the landscape of the solution space. The behavior in the ion channel gate variable - membrane potential phase portrait (which associates nerve activation with the ion channel mechanism) and the ratio of the excitation threshold of C to Aδ (defined as Rth) of the relevant stimulation waveforms (including monopolar, polarity-symmetric preceding cathodal biphasic, polarity-symmetric preceding anodal biphasic waveforms, and their asymmetric correspondents) were investigated. An adapted Hodgkin–Huxley (HH) model and the McIntyre–Richardson–Grill (MRG) model were employed to represent C and Aδ, respectively.22,23
The HH model and its adapted versions was applied to and validated with experimental data on squid giant axons24 and mammalian axons25 and used to study the unmyelinated nerves of various organisms.26–28 Regarding the MRG model, many simulations and animal experiments have demonstrated its validity as a model of motor and myelinated sensory nerves.29–31
Materials and Methods
HH Model and MRG Model
The HH model, which was first published in 1952, has changed the understanding of neuronal function22 and provides a quantitative description of action potential generation and variation, as well as the structure and function of ion channels.32 It reproduces electrical nerve stimulation responses by using differential equations with appropriate coefficients obtained in animal experiments.22 A model of C was proposed based on the original HH model, which could express potential propagation between nodes, thus enabling model identification even with experimental data regarding nerve conduction velocity from earlier studies of patients and animals.33 In our study, the basic portion of the model of C was the same as that reported in Equations (1)-(4),33, and it was used to realize human C by tuning the model parameters, such as resistivity and fiber diameter with the experiment results.34,35 This adapted HH model was used as the C-fiber model in this study.
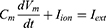
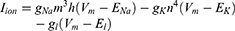
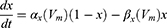
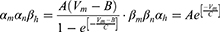
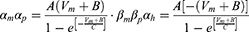
Equation (1) shows the change in transmembrane current by external stimulation. Cm is the membrane capacitance, Vm is the membrane potential, t is time, Iion is the ionic transmembrane current, and Iext is the externally applied stimulation current. The details of the ionic transmembrane current Iion are shown in Equation (2). The ion channel gate variables m, h and n define the open status of those ion channels. m and h define the opening and closing of sodium ion channels, respectively, and n defines the opening of potassium ion channels. gNa, gK and gl represent the maximal conductance of each ion channel. ENa, EK, and El represent the resting potential of each channel. Equation (3) shows the first-order derivative of each gate variable (x = [m, h, n]), defining the open probability of each ion channel. α and β are the rate constants dependent on the transmembrane voltage, which describe the transient rates of the channel gates opening and closing. The values of the parameters are shown in Table 1. The equivalent circuit of the HH model is shown in Figure 1A.
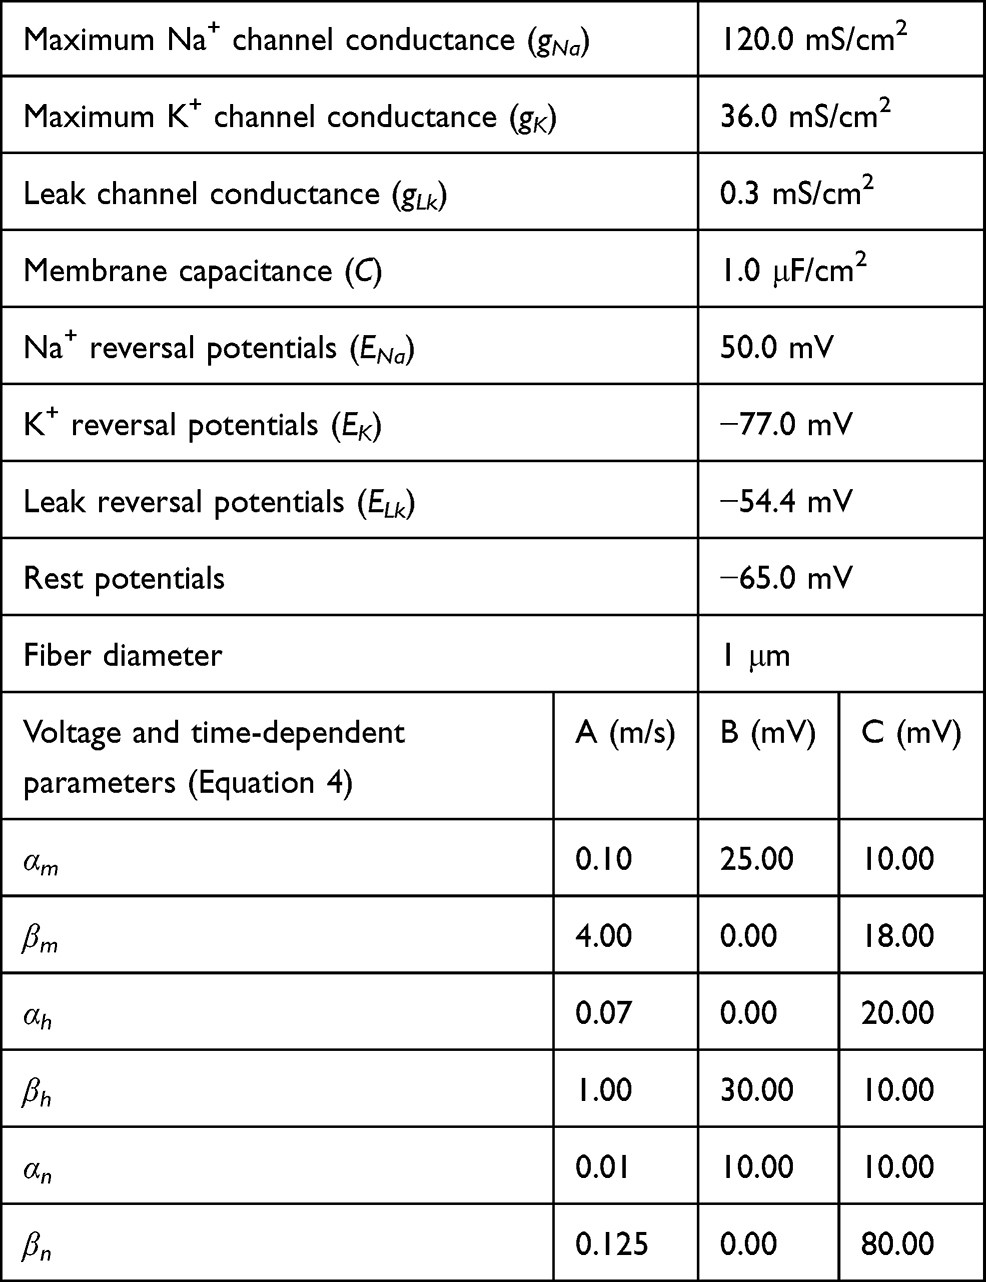 |
Table 1 C-Fiber Model Parameters |
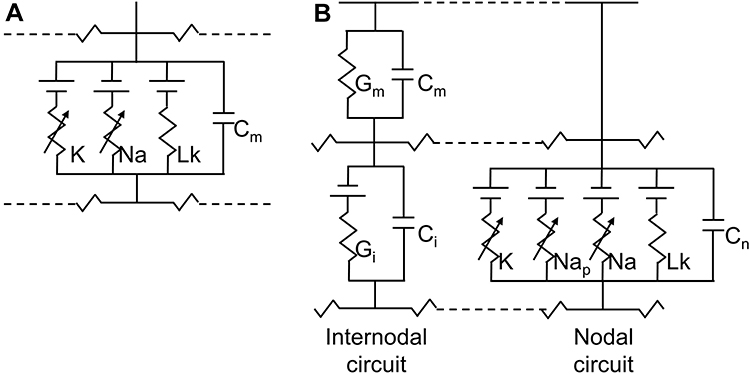 |
Figure 1 The HH (A) and MRG (B) double-cable axon model. Notes: (A) A segment of unmyelinated fibers contains sodium (Na) and potassium (K) channels as well as leakage resistance (Lk) with membrane capacitance (Cm). (B) A node of the Ranvier segment (ie, nodal circuit on the right) contains fast sodium (Na), persistent sodium (Nap), and slow potassium (K) channels as well as leakage resistance (Lk) with nodal capacitance (Cn). An internodal segment contains resistance and capacitance of the myelin sheath (Gm and Cm) and internodal double-cable structures (Gi and Ci).23 |
The FH (Frankenhaeuser, Huxley) model was first established to simulate the behavior of myelinated nerve fibers, as demonstrated by the experimental data on the myelinated nerve fibers of frogs.36 Since the structure and properties of ion channels at the nodes of Ranvier in mammals are distinctly different from those of amphibians, a neural model of mammals has been further developed.37 McIntyre et al developed geometrically and electrically accurate models of mammalian motor nerve fibers, MRG (McIntyre, Richardson, and Grill) models, to study the biophysical mechanisms of axonal excitability changes and recovery cycle regulation.23 The MRG model can reproduce the experimental data for the excitation properties of mammalian myelinated nerve fibers.
The MRG model, called the Aδ-fiber model in the following paragraphs, can also be expressed using Equation (1) since it stems from the classical HH model. However, for different ion channels, the ionic transmembrane current Iion was expressed by the following differential equations.
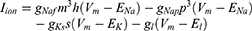
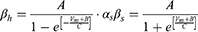
Unlike Equation (2), in Equation (5), Naf indicates the nodal membrane fast sodium channel, Nap is the persistent sodium channel, Ks is the slow potassium channel, and l is the linear leakage conductance. Variables m and h are the same as those of the C-fiber model. Variable p defines the opening of persistent sodium ion channels, and s defines the opening of slow potassium ion channels. The values of the parameters are shown in Table 2. The equivalent circuit of the MRG model is shown in Figure 1B. The C-fiber and Aδ-fiber models were first validated with the existing experimental data about strength-duration (S-D) curves and conduction velocity in one of our previous papers.14
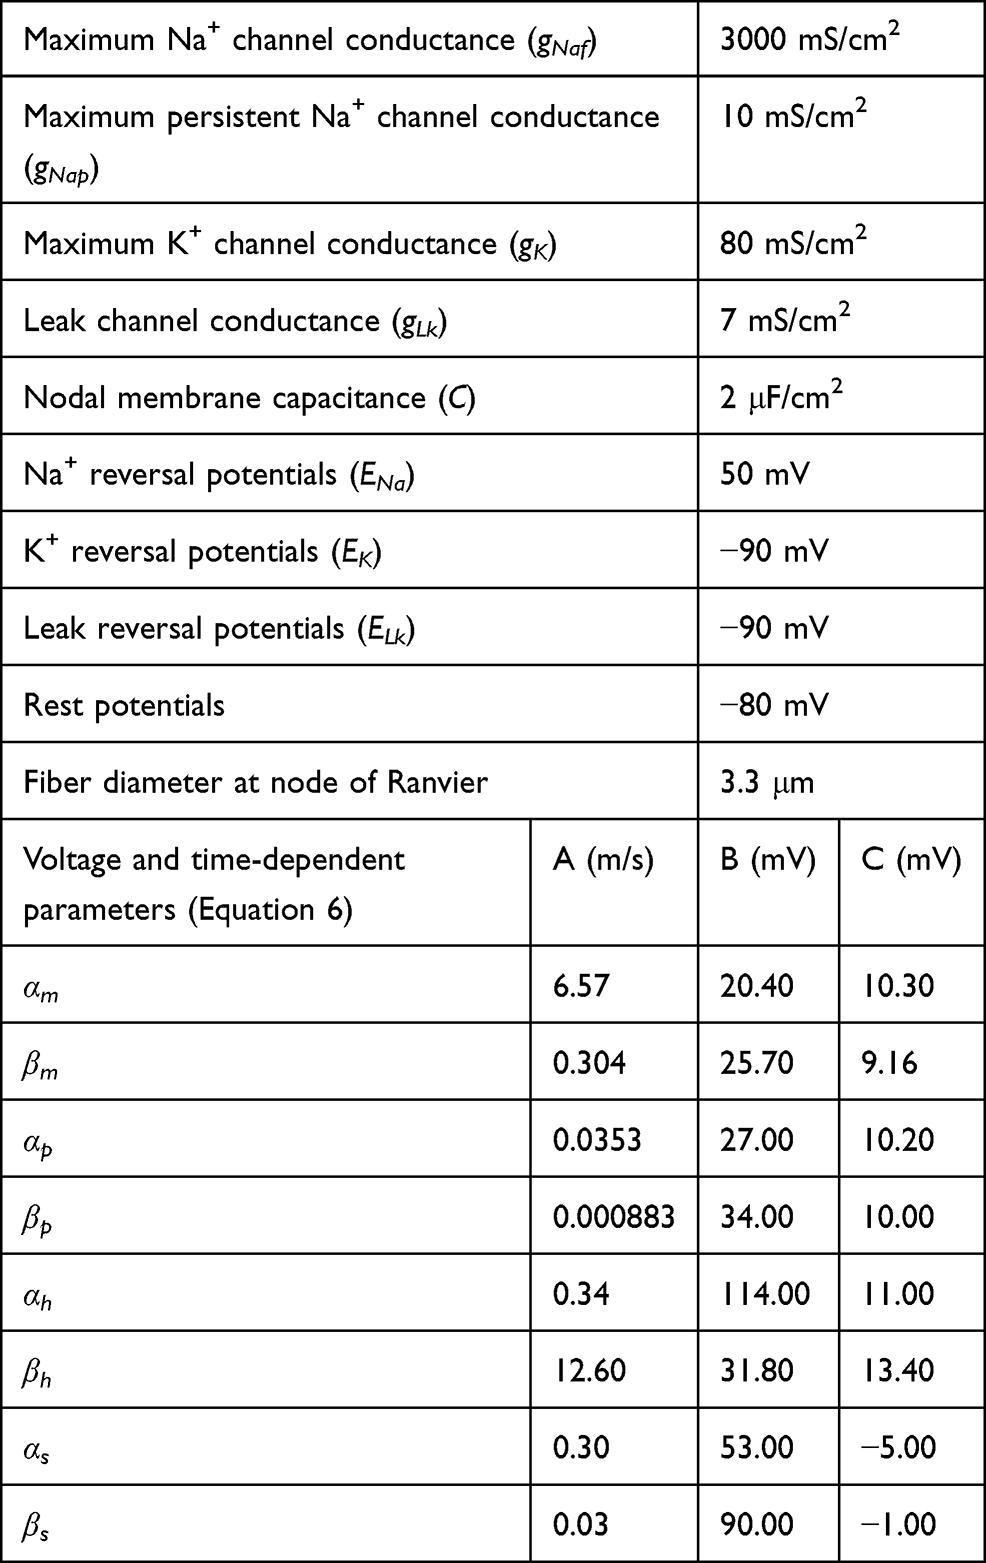 |
Table 2 Aδ-Fiber Model Parameters |
The key to improving C-selectivity over Aδ is the difference in their ion channels. One of the important properties is the time constant of the ion channels. Figure 2A and B show the change in the time constant of each variable as the membrane potential Vm increases in the C-fiber and Aδ-fiber models, respectively. For the C-fiber model, as shown in Figure 2A, the time constant of variable m is considerably small compared with h and n, which means that m exerts the greatest effect on system behavior. Thus, even if the sodium ion channel is ready to close, as suggested by the fast-reducing m, the opening variable of the sodium ion channel, as the membrane potential increases, if h, the closing variable, has not reached its maximum value, the sodium ion channel remains open. Prolonging this time lag means extending the opening time of the sodium ion channels, which has a tremendous promoting effect on nerve fiber excitation. This is also consistent with the description in Grill’s research.20 Unlike the C-fiber model, the sodium channel time constant of the Aδ-fiber model, especially h in Figure 2B, is smaller than that of the C-fiber model. Therefore, the fast-changing gate variable of the sodium channel of the Aδ-fiber model makes its effect time much shorter than that of the C-fiber model, leading to the improvement of the excitability of C, which may even exceed that of Aδ, providing the possibility to reverse their threshold.
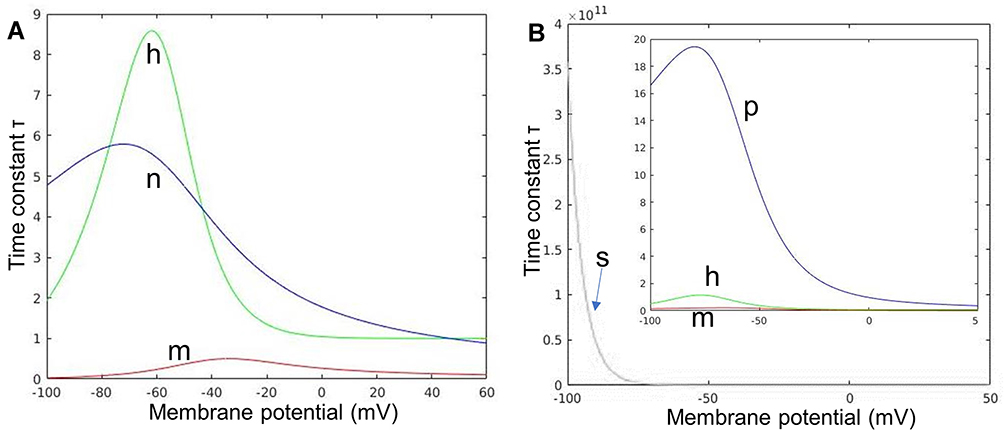 |
Figure 2 The time constants of each ion channel in the C(A) and Aδ(B) models. Notes: (A) Variables m and h define the opening and closing of sodium ion channels, respectively, and variable n defines the opening of potassium ion channels. (B) Variables m and h define the opening and closing of sodium ion channels, variable p defines the opening of persistent sodium ion channels, and s defines the opening of slow potassium ion channels. |
Phase Portrait Analysis
A phase portrait could visually reveal the dynamics of multivariate data series in a phase plane. Figure 3 shows an example of the C-fiber model phase portrait when no external stimulus was given. The red curve plots the isocline of dm/dt=0, and the blue curve plots the isocline of dVm/dt=0. The three intersections a, b and c (ie, the points meet both dm/dt=0 and dVm/dt=0, at which the status does not change over time) represent the rest state, activation threshold and peak action potential, respectively.38 The positional relationship of the three intersections in the phase plane directly affects the excitability of the nerve fibers. The dynamic changes in the phase portrait are subject to the time constants of each ion channel of the nerve model. In this study, the focus was placed on the phase of m and its membrane potential Vm while ignoring other variables. The reason is that the time constants of the rest are much greater than that of m, which means that they can be considered constants with respect to the time constant of m within an infinitesimal time.
 |
Figure 3 An example of the phase portrait of the C-fiber model. The figure shows the dynamic. Notes: Changes in the C-fiber model in the resting state. Red curve 1 plots the resting-state isocline of dm/dt=0, and blue curve 2 plots the resting-state isocline of dVm/dt=0. The three points, a, b and c, indicate the resting points. Points a, b and c represent the resting state, activation threshold and peak action potential, respectively. Arrows denote the trends in state transition. Since point b is a saddle point, the state point moves closer to point a before crossing saddle point b and moving to point c after crossing b. |
Evaluation and Analysis
To assess selective stimulation of C, the excitation threshold of C (ThC), that of Aδ fiber nerves (ThAδ), and their ratio, Rth (Equation (7)), were used.

Rth was used to analyze which nerve fiber model was more likely to be excited by a particular stimulation waveform. Rth < 1 and Rth > 1 imply that C is more favored than Aδ and that Aδ is more favored than C, respectively.
Stimulation Schemes
Figure 4 shows an example of the waveform under this study. The amplitudes of the anodal and cathodal stimuli are Va and Vc, respectively, whereas the durations of these two are denoted using ta and tc, respectively. In each period, there is an interstimulus interval (ISI) between an anodal stimulus and a cathodal stimulus. In this paper, the following effects of the stimulation waveforms on C-selectivity were explored: 1) the effect of total duration and polar precedence (ie, anodal-first or cathodal-first) of the waveform; 2) the influence of the interstimulus interval (ISI) between an anodal and a cathodal stimulus; and 3) the effect of the polarity asymmetry ratio (PAR, eg, PAR 1:9 means that the cathodal stimulus duration is 9 times that of the anodal stimulus, in the case of anodal-first stimulation). Only waveforms with charge-balanced anodal stimuli and cathodal stimuli were investigated in this study.
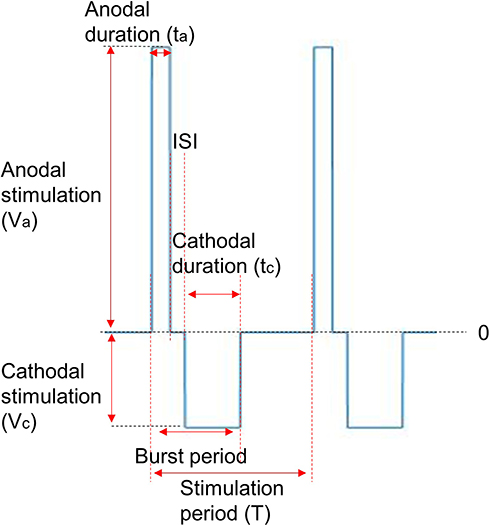 |
Figure 4 An example of the stimulation waveform. Abbreviations: ISI, interstimulus interval; PAR, polarity asymmetry ratio. Notes: Each period contains an anodal stimulus and a cathodal stimulus. The PAR is the quotient of the duration of the preceding stimulus and that of the following stimulus. ISI describes the no-stimulus duration between the preceding and following stimuli. |
Simulation Experiments
Two categories of experiments with the simulation models were conducted: a) experiments to explore the underlying ion mechanism of improving C-selectivity by anodal-first stimulation, in which focus was placed on not only the behavior of m and Vm but also the n, h and ion currents in the phase plane; and b) experiments to explore optimal stimulation parameters, in which the polar precedence, duration, ISI, PAR, and frequency were tested.
Both the C-fiber and Aδ-fiber models used in this study contain 21 nodes. The distance between each pair of nodes is 10 μm and 220 μm for the C-fiber and Aδ-fiber models, respectively. Stimuli were applied to a point located at the 10th node at the intensity of the current density. The ground was located at infinity (far away from the stimulus point). Both models were implemented in MATLAB 2013a, with 4th-order Runge–Kutta (RK4) as the numerical method to solve the differential equations of the C-fiber and Aδ-fiber models. The unmyelinated and myelinated nerve models were validated with experimental animal data.14
Results
Changes in Activation Threshold in Phase Portrait
Figure 5 shows the phase portrait of the C-fiber model for the sodium ion channel variable m and the membrane potential Vm, (A), in their rest state (h: 0.59790, n: 0.31708), and (B), (C), and (D), after anodal stimulation with durations of 2 ms, 6 ms and 10 ms, respectively, all at a stimulation strength of 11 μA/cm2. The excitability of nerves can also be identified in the phase plane. When a saddle point b exists, as shown in Figure 5B, a smaller distance between two intersections, Δd_int (a 2-dimensional vector (ΔVm, Δm) containing a difference in intracellular potential Vm and a difference in gate variable m) denotes easier excitation of the nerve. On the other hand, as shown in Figure 5C and D, there is no intersection between the two isocline curves. In this case, the shortest distance between the two separate isocline curves, Δd_sep, might reflect the excitation of the nerve. For the situations shown in Figure 5, (A) Δd_int = (2.7, 0.01402), (B) Δd_int = (2.0, 0.00924), (C) Δd_sep = (0.1, 0.00057), and (D) Δd_sep = (0.1, 0.00089).
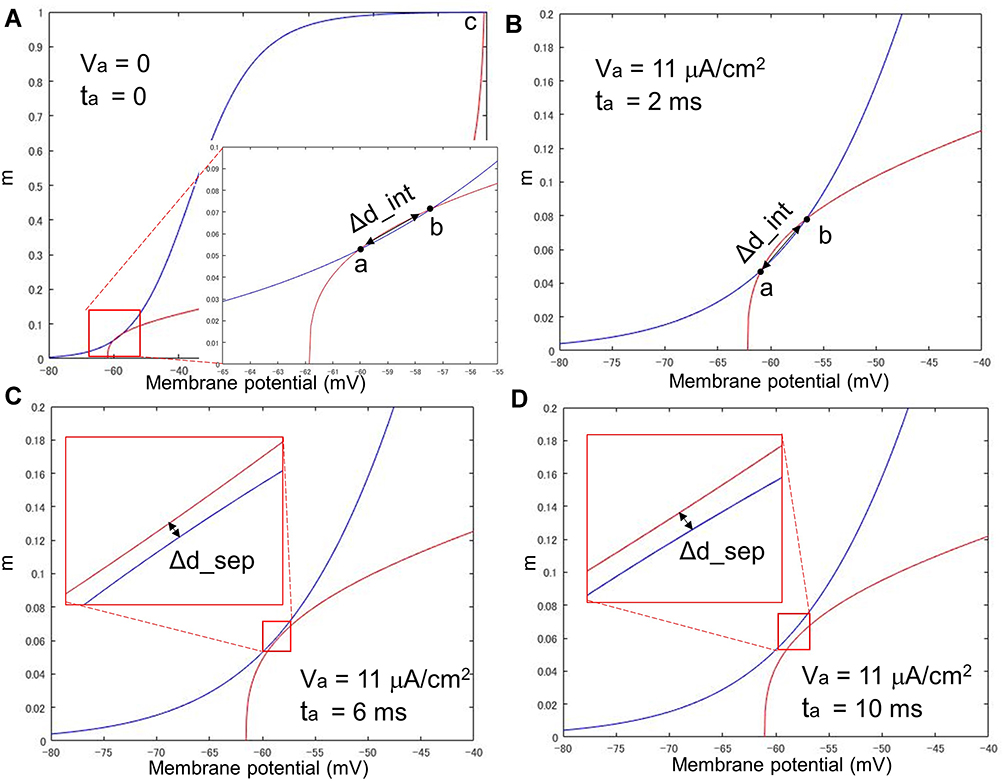 |
Figure 5 Phase portrait of the C-fiber model with anodal stimulations of different durations. If there is no intersection between the two isocline curves as (C) and (D), the shortest distance between the two separate isocline curves, ie, Δd_sep, might reflect the excitation of the nerve. Notes: Strength of anodal stimulations Va = 11 μA/cm. (A) Phase portrait of the resting status, (B) ta = 2 ms, (C) ta = 6 ms, and (D) ta = 10 ms. |
The Effect of Anodal-First Anodal Stimulation
Comparing the Effect of Anodal-First Stimulation on the C-Fiber and Aδ-Fiber Models in the Phase Plane
Figure 6 shows the phase portrait of the C-fiber and Aδ-fiber models with different stimulation waveforms, which are illustrated by A1-F1: (A1) no stimulus, (B1) a cathodal-only stimulus with strength 162 μA/cm2 and duration 10 ms, (C1) a stimulus with PAR 1:1, strength of cathodal stimulus 86 μA/cm2 and total duration (duration of anodal and cathodal stimulus) 20 ms, (D1) a stimulus with PAR 1:9, strength of cathodal stimulus 20 μA/cm2 and total duration 100 ms, (E1) a stimulus with PAR 9:1, strength of cathodal stimulus 148 μA/cm2 and total duration 100 ms, and (F1) a prepulse stimulus with strength 75 μA/cm2 and duration 90 ms, and a cathodal stimulus with strength 225 μA/cm2 and duration 10 ms. Note, for (F1), the intensity of preceding cathodal stimulus and following cathodal stimulus was set according to the experiment of Bostock.19 For the other waveforms, the intensity was set as their threshold strength, at which the node could reach its threshold. The phase portraits of the C-fiber model with the stimulation waveforms are shown in Figure 6–F2, and the Aδ-fiber model is shown in Figure 6A3-F3. Similar to Figure 5, while rest point a and saddle point b remain at the intersections of the two isocline curves of the Aδ-fiber model (Figure 6A3-F3), they disappear in the phase portraits of the C-fiber model (Figure 6C2-D2). Following the definition of distance in Changes in Activation Threshold in Phase Portrait, Δd_int and Δd_sep were used to analyze the responses of the C-fiber and Aδ-fiber models to different stimuli. Stronger anodal strength will cause Δd_sep and its gradual increase, meaning it causes a lower excitation threshold.
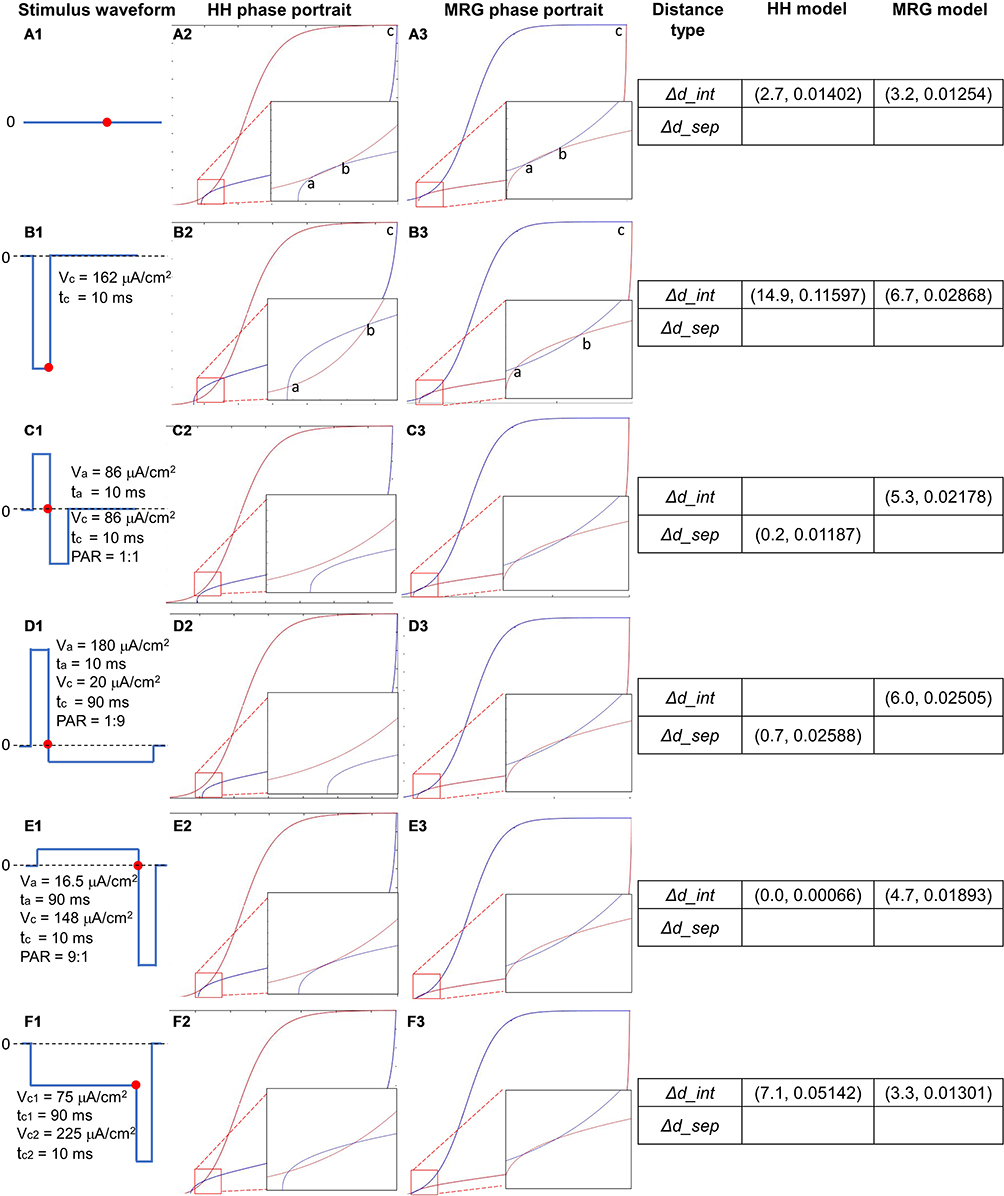 |
Figure 6 Phase portraits of the dynamic behavior of the C-fiber and Aδ-fiber models responding to different stimuli. Δd_int and Δd_sep were used to analyze the responses of the C-fiber and Aδ-fiber models to different stimuli. A stronger anodal strength causes the separation of two isocline curves and increases Δd_sep, which indicates a lower excitation threshold. Abbreviation: PAR, polarity asymmetry ratio. Notes: (A1—F1) Illustration of stimulation waves: (A1) no stimulus, (B1) a cathodal-only stimulus with strength 162 μA/cm2 and duration 10 ms. (C1) a stimulus with PAR 1:1, strength of cathodal stimulus 86 μA/cm2 and total duration 20 ms. (D1) a stimulus with PAR 1:9, strength of cathodal stimulus 20 μA/cm2 and total duration 100 ms. (E1) a stimulus with PAR 9:1, strength of cathodal stimulus 148 μA/cm2 and total duration 100 ms. (F1) a prepulse stimulus with strength 75 μA/cm2 and duration 90 ms, and a cathodal stimulus with strength 225 μA/cm2 and duration 10 ms. (A2–F2) the phase portraits of the C model. (A3–F3) the phase portraits of the Aδ model. The 4th column: Δd_int and Δd_sep as a result of different stimulations. |
Changes in Ion Channel Variables and Ion Current Caused by the Preceding Anodal Stimulation
The membrane potential and the current ion channels were further investigated to uncover the mechanism of anodal-first biphasic simulation. Figure 7 shows the changes in (A) total transmembrane ion current, (B) ion current in sodium (Na) channel, and (C) ion current in potassium (K) channel, with regard to membrane potential, and (D) membrane potential change with regard to stimulus time, responding to different strength preceding anodal stimulations but the same strength following the cathodal stimulus. The preceding anodal stimulation had the following parameters: (1) no stimulus, (2) PAR 1:1, anodal strength 86 μA/cm2 and anodal duration 10 ms, (3) PAR 1:9, anodal strength 180 μA/cm2 and anodal duration 10 ms, (4) PAR 2:1, anodal strength 58 μA/cm2 and anodal duration 20 ms, (5) PAR 7:1, anodal strength 21 μA/cm2 and anodal duration 70 ms and (6) PAR 9:1, anodal strength 16 μA/cm2 and anodal duration 90 ms, while the cathodal stimulus strength is identical to that described in Figure 6B1 (162 μA/cm2).
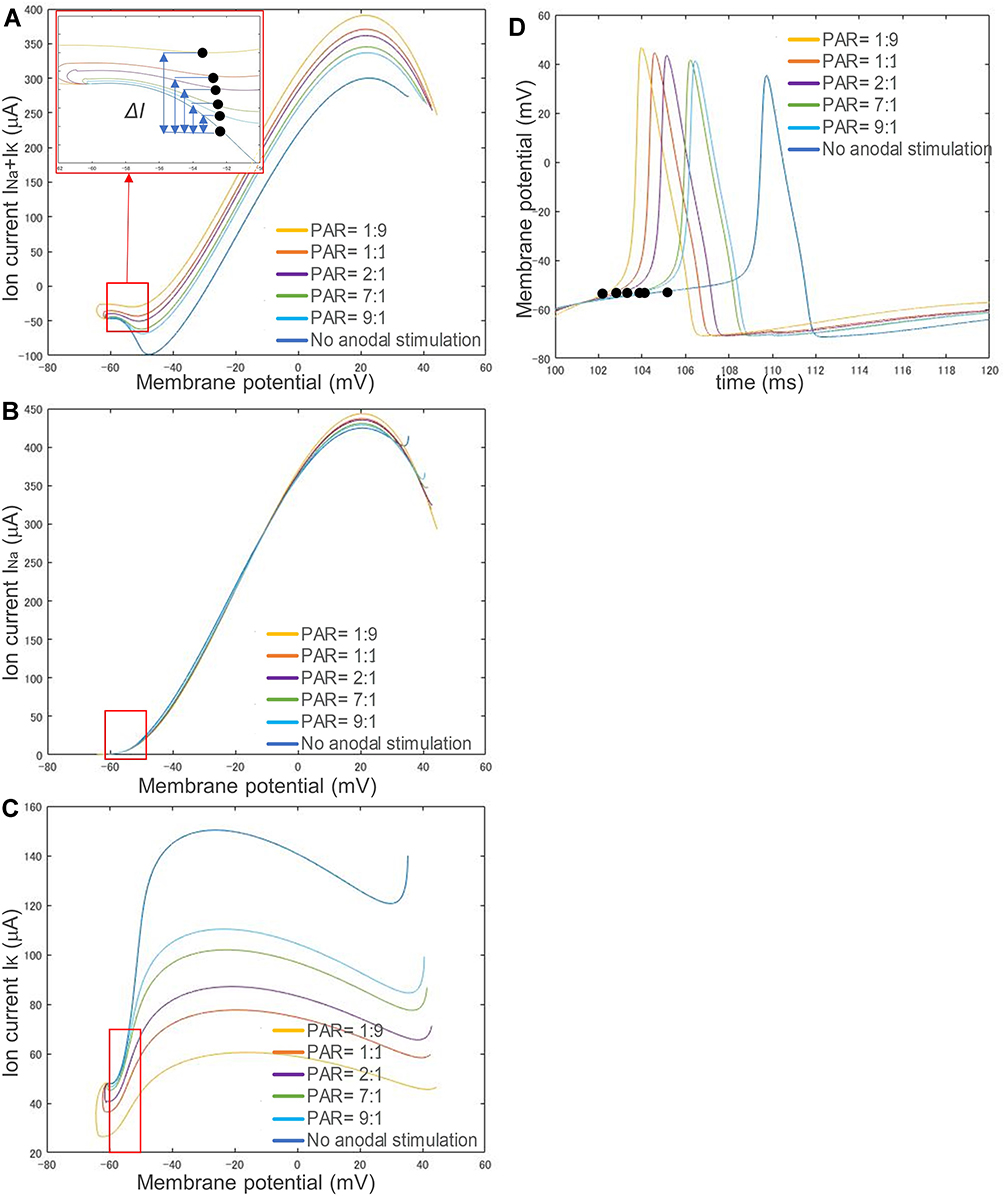 |
Figure 7 Changes in ion channel currents with respect to membrane potential responding to different preceding anodal stimuli and one identical preceding cathodal stimulus. (A) Transmembrane ion current: INa + IK. (B) Current of sodium ion channel: INa. (C) Current of potassium ion channel: IK. (D) The change in membrane potential over time. Since there is no difference between the sodium ion currents corresponding to different stimulation waveforms, the difference in transmembrane ion current is mainly due to the change in potassium ion current. Moreover, a stronger anodal stimulus accelerates the speed of activity potential generation. Abbreviation: PAR, polarity asymmetry ratio. Notes: The preceding anodal stimulation had the following parameters: (1) no stimulus, (2) PAR 1:1, anodal strength 86 μA/cm2 and anodal duration 10 ms, (3) PAR 1:9, anodal strength 180 μA/cm2 and anodal duration 10 ms, (4) PAR 2:1, anodal strength 58 μA/cm2 and anodal duration 20 ms, (5) PAR 7:1, anodal strength 21 μA/cm2 and anodal duration 70 ms and (6) PAR 9:1, anodal strength 16 μA/cm2 and anodal duration 90 ms. The cathodal stimulus strength was always 162 μA/cm2 in all stimulation waveforms. The red box in each graph shows the change in ion current before reaching the membrane potential threshold (prethreshold phase). |
The red box in each graph of Figure 7 shows the change in ion current before reaching its threshold (prethreshold phase). The black dots denote where the membrane potential exceeds the threshold, ΔI shows the difference between the ion current of each polarity asymmetric stimulation waveform and that of no anodal stimulation at its threshold strength. The results of each ΔI are 36.94 μA, 24.53 μA, 18.24 μA, 9.35 μA, and 5.18 μA, corresponding to simulation with PAR 1:9, 1:1, 2:1, 7:1, and 9:1, respectively. Because, as shown in Figure 7B, there is no difference between the sodium ion currents corresponding to different stimulation waveforms (maximal ΔINa: 4.50 μA at PAR=1:9, average ΔINa: 2.58 μA), it is clear that the difference in transmembrane ion current (maximal ΔI: 43.98 μA at PAR=1:9, average ΔI: 25.24 μA) is mainly due to the change in potassium ion current (maximal ΔIK: 48.48 μA at PAR=1:9, average ΔIK: 27.82 μA), as shown in Figure 7C. With the same strength of cathodal stimulus, a stronger anodal stimulus caused faster activity potential generation, as shown in Figure 7D.
Although the ion channel variables h and n were not the focus of most simulation studies, they play an important role in neural dynamics. Figure 8 shows the changes in the ion channel variables (A) m, (B) h and (C) n of the C-fiber model with respect to membrane potential, (D) membrane potential change with regard to stimulus time, responding to different stimulation waveforms: 1) a cathodal-only stimulus with strength 162 μA/cm2 and duration 10 ms, 2) a stimulus with PAR 1:1, strength of cathodal stimulus 86 μA/cm2 and total duration 20 ms, 3) a stimulus with PAR 1:3, strength of cathodal stimulus 46 μA/cm2 and total duration 40 ms, 4) a stimulus with PAR 1:6, strength of cathodal stimulus 27 μA/cm2 and total duration 70 ms, 5) a stimulus with PAR 1:9, strength of cathodal stimulus 20 μA/cm2 and total duration 100 ms, 6) a stimulus with PAR 2:1, strength of cathodal stimulus 115 μA/cm2 and total duration 30 ms. 7) a stimulus with PAR 7:1, strength of cathodal stimulus 145 μA/cm2 and total duration 80 ms, and 8) a stimulus with PAR 9:1, strength of cathodal stimulus 148 μA/cm2 and total duration 100 ms.
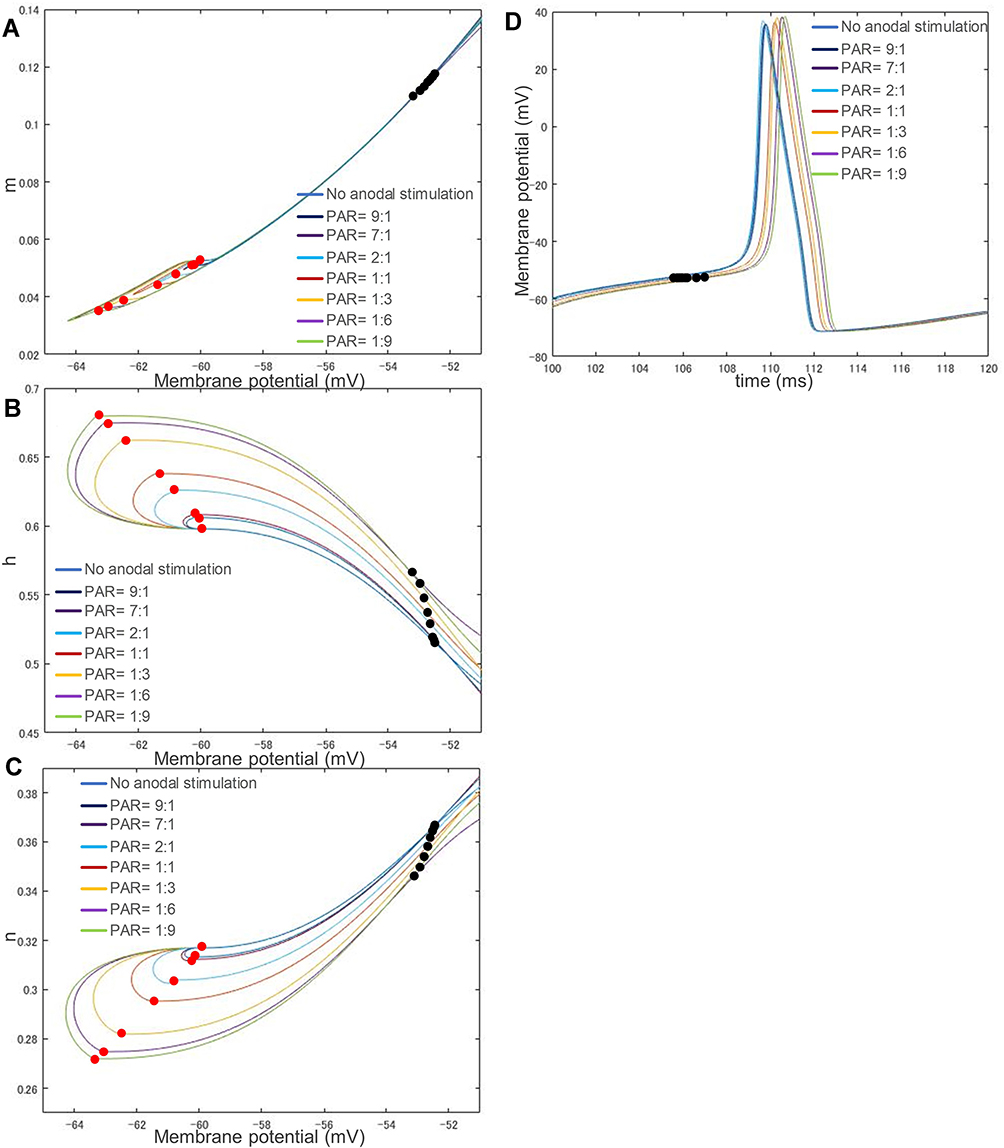 |
Figure 8 The related changes in each ion channel variable and membrane potential. (A) Opening of sodium ion channel: m. (B) Closing of sodium ion channel: h. (C) Opening of potassium ion channel: n. (D) The change in membrane potential over time. A more potent anodal stimulus causes a larger deviation from its original position in the phase portraits. Alternatively, the stimulation waveforms with different PAR values have almost the same speed of action potential generation. Abbreviation: PAR, polarity asymmetry ratio. Notes: The stimulation waveforms are: 1) cathodal-only stimulus, strength of cathodal stimulus 162 μA/cm2, duration 10 ms, 2) PAR 1:1, strength 86 μA/cm2, duration 20 ms, 3) PAR 1:3, strength 46 μA/cm2, duration 40 ms, 4) PAR 1:6, strength 27 μA/cm2, duration 70 ms, 5) PAR 1:9, strength 20 μA/cm2, duration 100 ms, 6) PAR 2:1, strength 115 μA/cm2, duration 30 ms. 7) PAR 7:1, strength 145 μA/cm2, duration 80 ms, 8) PAR 9:1, strength 148 μA/cm2, duration 100 ms. A red dot in each curve on each figure’s left side means the beginning of cathodal stimulation, and a black dot on the right side denotes where the membrane potential exceeds its threshold. |
Note that for each waveform, the stimulus intensity was determined at threshold strength. A red dot in each curve shows the beginning of its cathodal stimulus, and a black dot denotes where the membrane potential exceeds the threshold, namely, the onset of excitement. As PAR decreases, the threshold is reduced. A different preceding anodal stimulation gives its following cathodal stimulus a different initial state (denoted by a red dot). A stronger anodal stimulus (ie, a lower PAR, such as 1:9) causes a larger deviation from its original position (ie, the beginning position of the no anodal stimulus case) in the phase portraits. Different from Figure 7D, the speed of activity potential generation was almost the same as that in Figure 8D since the stimulus intensity was determined at threshold strength, in other words, with a smaller cathodal stimulus and a stronger anodal stimulus (the difference in black dots indicates the difference in membrane potential when starting the cathodal stimulus).
Figure 9 shows the changes in INa in (A) and IK in (B) with respect to the membrane potential calculated from the corresponding ion channel variables in Figure 8 in the prethreshold phase. The input stimulation waveforms are the same as those in Figure 8 at their corresponding threshold strength. This is different from the experiment shown in Figure 7, in which different preceding anodal stimuli and the same following cathodal stimulus were used to investigate the effect of preceding anodal stimulation on C-selectivity. Despite the difference in waveforms and threshold strength, there is no significant difference between the sodium (Na) ion currents (average: 10.22 μA, standard deviation: 1.15 μA), although there is a significant gap in IK (average: 72.56 μA, standard deviation: 9.25 μA), in which the membrane potential exceeds its threshold. A lower PAR of 1:9 results in a higher INa or a smaller IK. After the membrane potential exceeded the threshold potential, as shown in Figure 9C, the potassium (K) ion currents (IK) showed a different spatial relationship from those in the prethreshold phase, ie, the PAR (including no anodal stimulation) did not affect the spatial relationship of ion currents in the post-threshold phase.
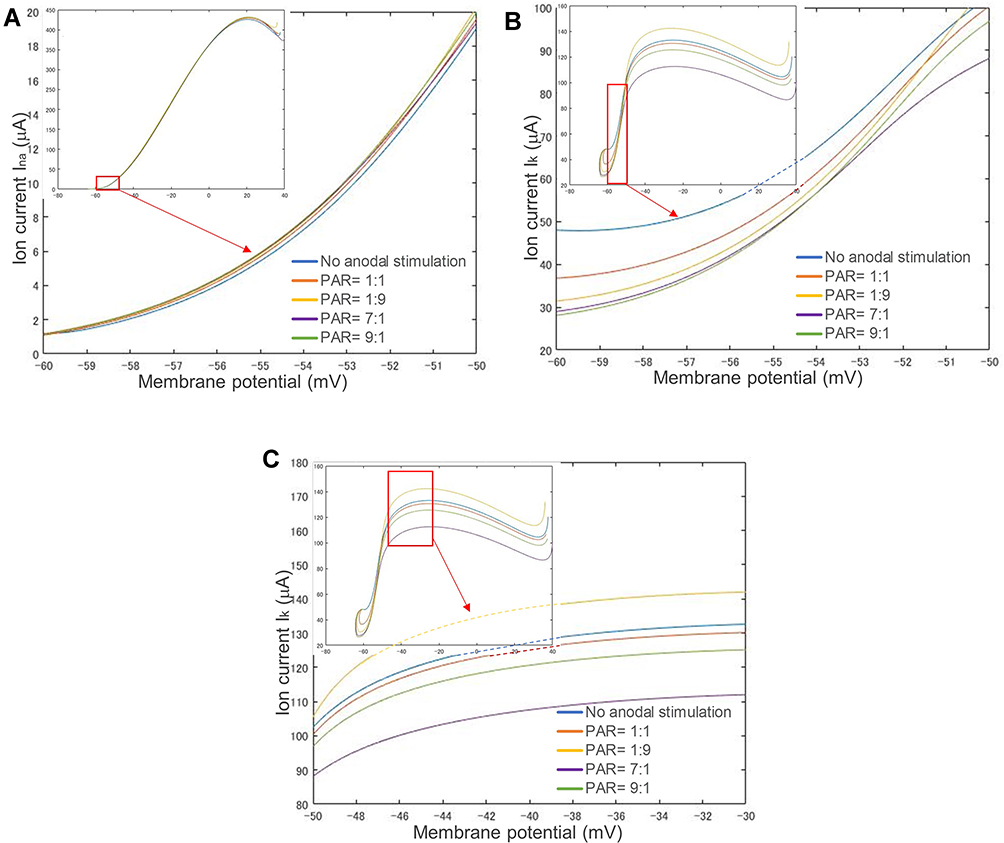 |
Figure 9 Changes in sodium (INa) and potassium (IK) ion channel currents and membrane potentials respond to different stimulation waveforms. (A) Sodium channel current. (B) Potassium channel current before firing. (C) Potassium channel after firing. A lower PAR such as 1:9 results in a smaller IK. Moreover, there is a significant gap in IK, but no significant difference in INa. Abbreviation: PAR, polarity asymmetry ratio. |
The Influence of Waveform Parameters on C-Selectivity
The parameter setups are shown in Table 3 to explore optimal stimulation parameters.
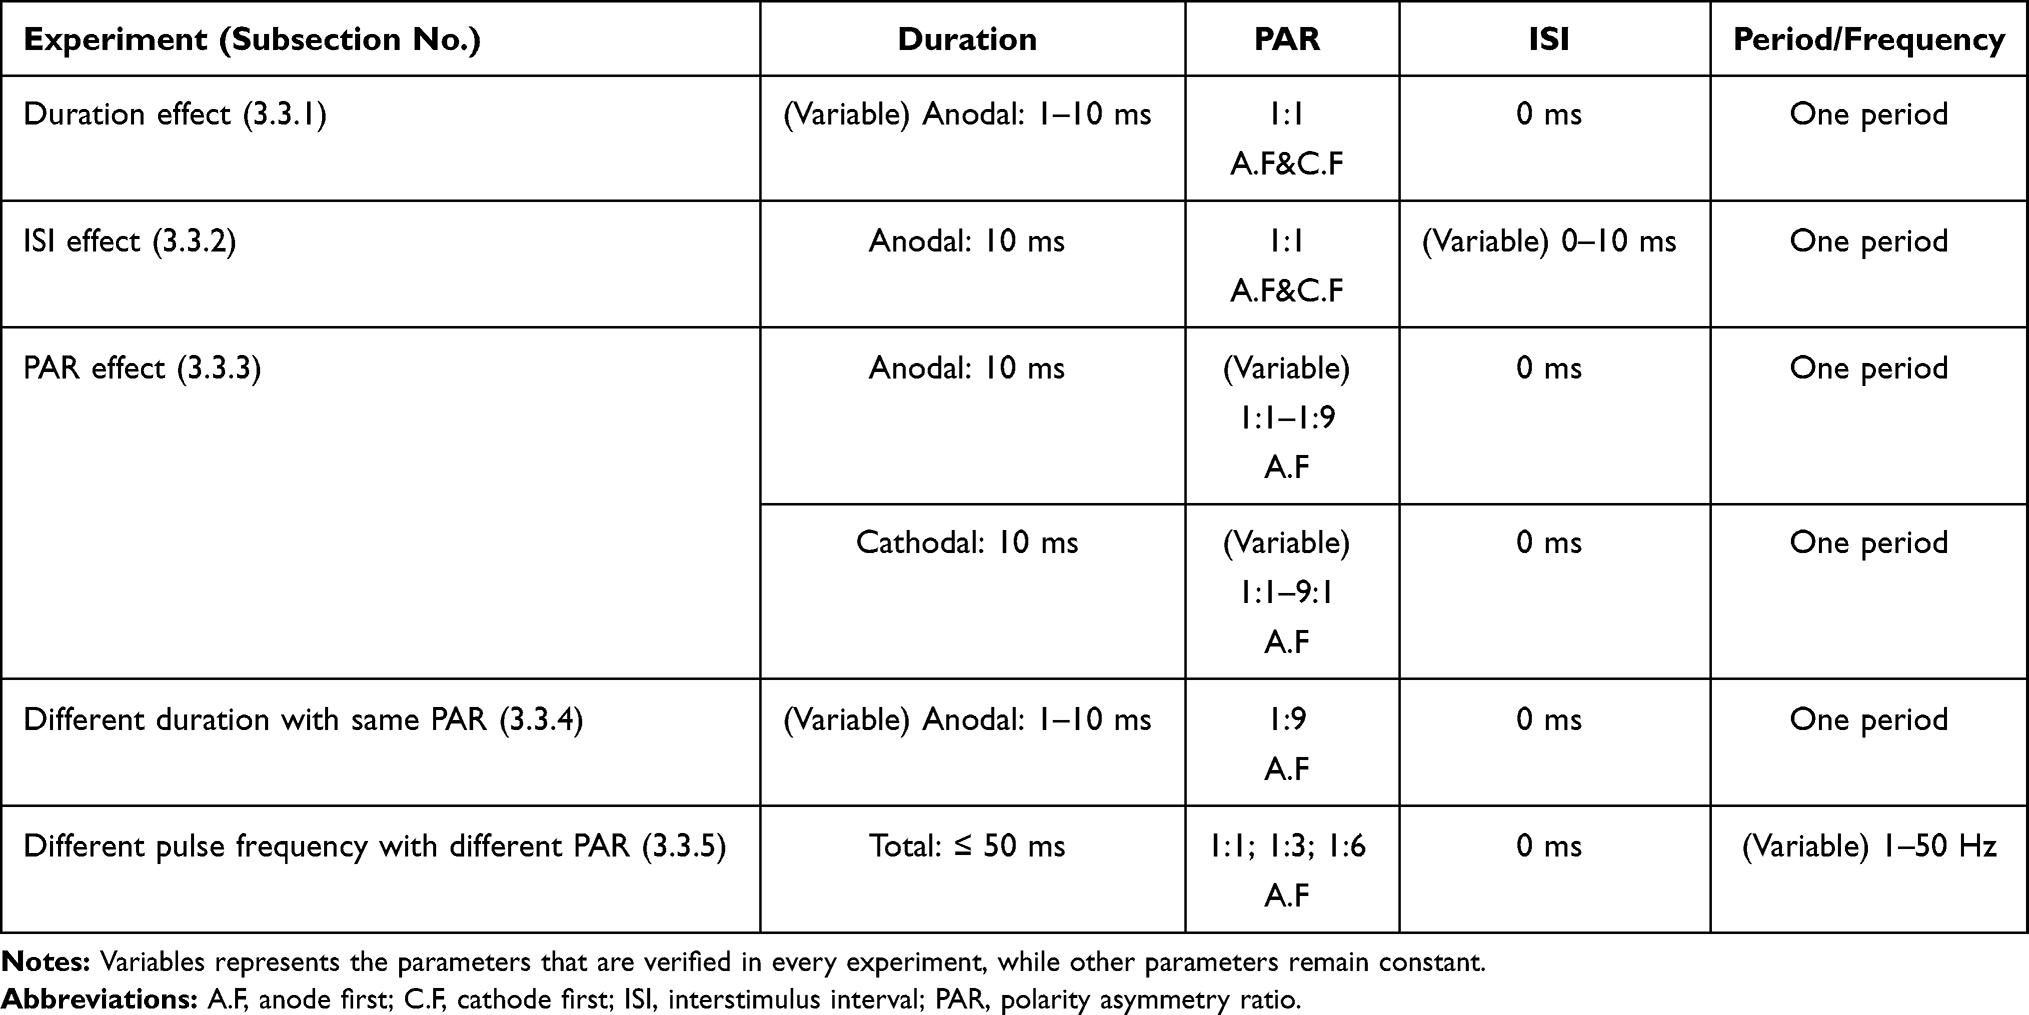 |
Table 3 Parameter Setups for C Selective Stimulation |
The Effect of Duration
Figure 10 shows the changes in the threshold strength of the C-fiber and Aδ-fiber models as the anodal stimulus duration changes from 1 ms to 10 ms. Biphasic symmetrical square waves were used. Polar precedence was investigated by comparing the cathodal-first (C.F) and anodal-first (A.F). The duration-threshold strength curve of the C-fiber model and that of the Aδ-fiber model had an intersection at an approximately 4 ms duration, as shown in Figure 10A (for the A.F case), ie, the threshold strength of the two models is reversed after 4 ms. However, there is no intersection in Figure 10B (for the C.F case), ie, the threshold of the two models remains constant with a long duration. In Figure 10C, the threshold ratio (Rth) decreases as duration increases. The Rth could be smaller than 1.0 only in the A.F stimulation case.
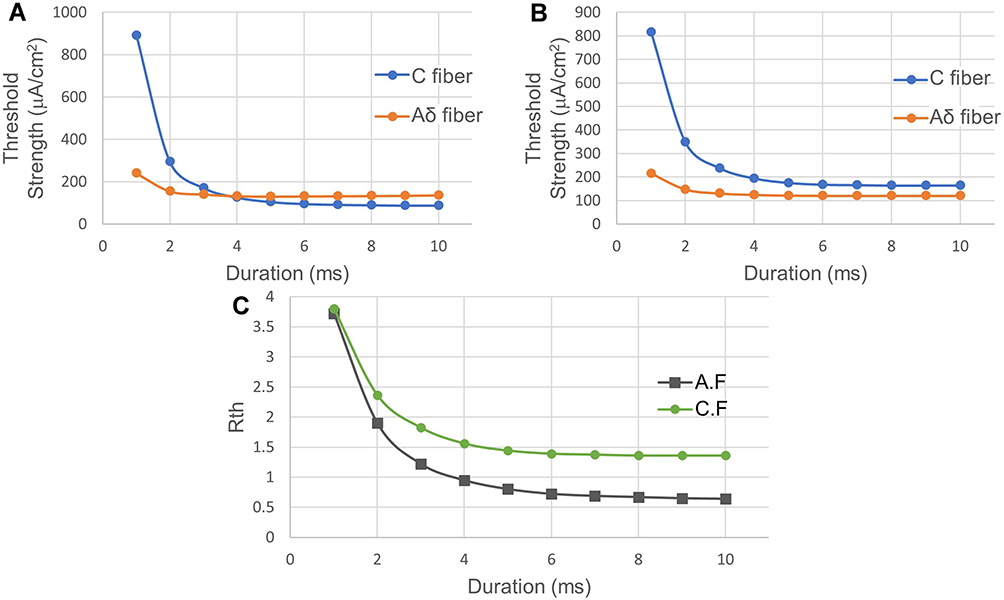 |
Figure 10 Stimulation with biphasic symmetrical waveforms with different durations. (A) Anodal stimulus before cathodal stimulus (A.F). (B) Cathodal stimulus before anodal stimulus (C.F). (C) The threshold ratio between the C-fiber model and Aδ-fiber model (Rth) with different duration values. In A.F stimulation case, the threshold strength of the C-fiber model turns lower than that of the Aδ-fiber model when the duration is longer than 4 ms, but this does not occur in C.F stimulation case. That is, the A.F stimulation gives positive feedback on C-selectivity. Abbreviations: A.F, anode first; C.F, cathode first; ISI, interstimulus interval. Notes: The horizontal axis shows anodal stimulus duration. The vertical axis represents the threshold strength. Fibers were stimulated with biphasic symmetrical square waves with no ISI. |
The Effect of ISI
Figure 11A and B shows the effect of the length of ISI between an anodal stimulus and its following cathodal stimulus on the threshold changes in the C-fiber and Aδ-fiber models. The threshold of the C-fiber model changed significantly with ISI when in the A.F stimulation. The threshold value starts to rise when the ISI is greater than 2 ms, and over 5 ms, it exceeds the threshold value of the Aδ-fiber model. In addition, the thresholds of the C-fiber model and the Aδ-fiber model did not change significantly with the C.F stimulation. Figure 11C shows the change in Rth with ISI. Note that the C-fiber model threshold when the anodal pulse is first is eventually even higher than the threshold when the cathode is first. Figure 11D shows the phase portrait when the ISI is 4 ms A.F. The distance between two different curves ΔdC_sep is (0.1, 0.00154).
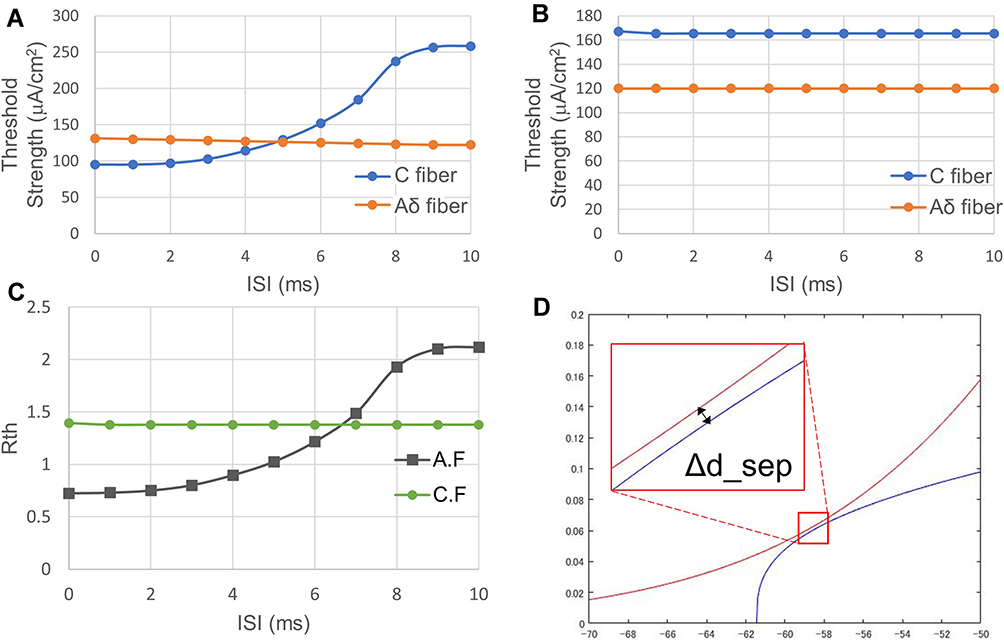 |
Figure 11 Relationship between ISI and threshold strength. (A) ISI-threshold strength relationship in A.F. stimulation case. (B) ISI-threshold strength relationship in C.F stimulation case. (C) ISI-threshold ratio Rth relationship of both A.F, and C.F stimulation cases. (D) The phase portrait when the ISI is 4 ms with A.F stimulation. The threshold of the C-fiber model changed significantly with ISI in A.F stimulation. When using the A.F stimulation, a smaller ISI is more beneficial to C-selectivity. Abbreviations: A.F, anode first; C.F, cathode first; ISI, interstimulus interval; Rth, ratio of the excitation threshold of C to that of Aδ. Notes: Fibers were stimulated with biphasic symmetrical square pulses with a 10 ms anodal duration. |
The Effect of PAR
The threshold ratio Rth changes significantly with the anodal and cathodal stimulus duration ratio when maintaining the charge balance of anodal and cathodal stimuli. For example, if the anodal duration is 10 ms and the cathodal duration is 90 ms, then to maintain charge balance, the anodal strength needs to be 9 times the cathodal strength. Figure 12 shows the changes in threshold strength in (A) and (B), ratio Rth in (C), and required charge in (D) with different PAR values. Figure 12A and B shows that the Aδ simulated by the Aδ-fiber model changed less than the C simulated by the C-fiber model. In contrast, the threshold strength of C changes significantly. As the duration of the cathodal stimulus increases, the anodal stimulation has higher strength than the cathodal stimulus, and the stimulation threshold of the C gradually decreases, which suggests the potential of polarity asymmetric stimulation for C-selectivity.
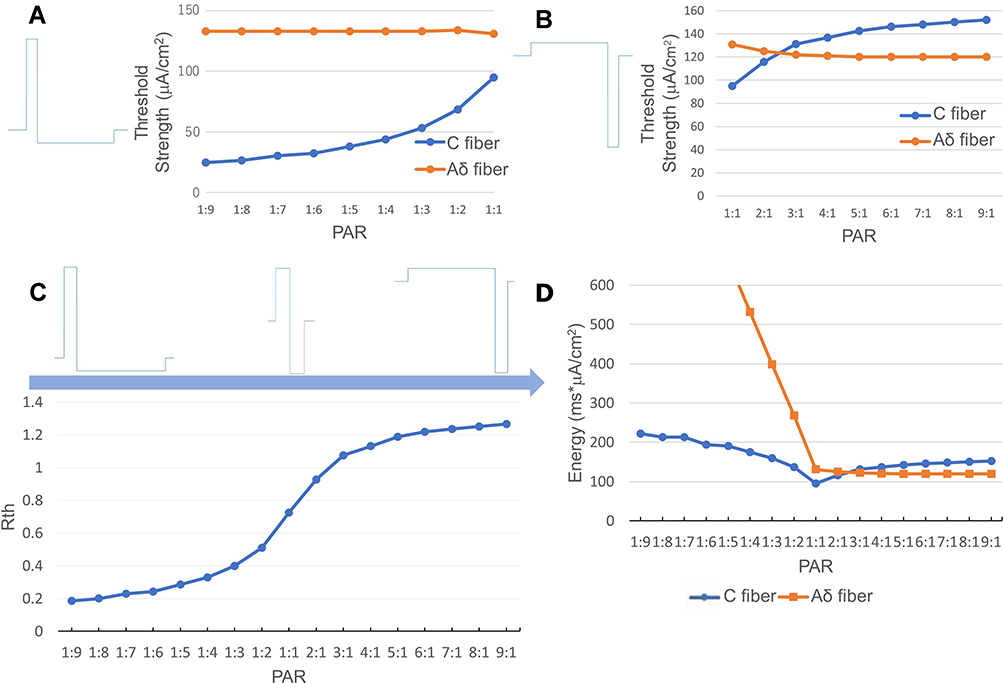 |
Figure 12 Relationship between PAR and threshold strength. (A) Different cathodal stimuli with the same anodal stimulus. (B) Different anodal stimuli with the same cathodal stimulus. (C) the change of Rth over different PAR. (D) the changes in different PAR. According to the results, the threshold strength of C changes significantly. As the cathodal stimulus duration increases, the stimulation threshold of C gradually decreases, which suggests the potential of polarity asymmetric stimulation for improving C-selectivity. Abbreviations: ISI, interstimulus interval; PAR, polarity asymmetry ratio; Rth, ratio of the excitation threshold of C to that of Aδ. Notes: (A) The strength of the simulated activation threshold of C and Aδ stimulated by the waveform in which the anodal stimulus is higher than the cathodal stimulus. (B) The strength of the simulated activation threshold of C and Aδ stimulated by the waveform in which the anodal stimulus is lower than the cathodal stimulus. (C) shows the Rth with different PAR in (A) and (B). (D) In this experiment, the ISI between anodal and cathodal stimuli is zero. |
Different Duration with Same PAR
Figure 13 shows the threshold strength and ratio of the C-fiber and Aδ-fiber models when stimulated with an anodal stimulus with different duration values at a PAR of 1:9. Note that the total duration of the stimulus was 10 times that of the anodal stimulus. Only A.F waveforms were tested since C.F waveforms unable to excite C before Aδ, as shown in Figure 10 in The Effect of Duration. In Figure 13A, the threshold strength of the Aδ-fiber model does not change significantly as the duration increases. In addition, the threshold strength of the C-fiber model decreases rapidly when the duration is smaller than 4 ms, then slowly decreases from 5 ms, and becomes constant from 8 ms. As shown in Figure 13B, the Rth changes from 0.62320 to 0.15833, favoring more C-selectivity, as the anodal duration increases from 1 ms to 10 ms.
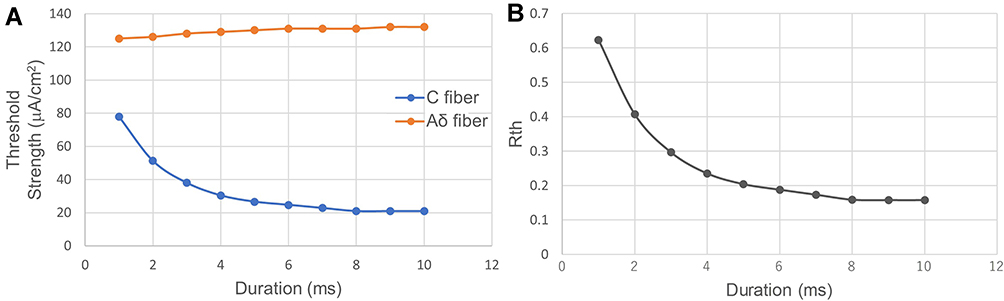 |
Figure 13 Relationship between threshold strength and anodal duration at the same PAR 1:9. (A) The threshold strength of the C-fiber and Aδ-fiber models. (B) the change of Rth. The threshold strength of the C-fiber model decreases when the duration is smaller than 8 ms. Anodal stimulation favors more C-selectivity as the duration increases from 1 ms to 10 ms. Abbreviations: ISI, interstimulus interval; PAR, polarity asymmetry ratio; Rth, ratio of the excitation threshold of C to that of Aδ. Notes: The horizontal axis shows anodal stimulus duration. Note that the total duration of the stimulus is 10 times the anodal stimulus duration. In this experiment, the ISI between anodal and cathodal stimuli was zero. |
Different Pulse Frequency with Different PAR
In addition to duration, we consider that frequency is also a possible factor affecting selectivity. Two cases are shown in Figure 14. Figure 14A1-C1 shows the changes in threshold strength and Rth as frequency increases from 1 Hz to 50 Hz, when there is no limitation to the total duration of stimulation, at PAR 1:6 1:3 and 1:1, respectively. Figure 14A2-C2 shows the changes in the same indexes, but with a limitation of 50 ms to the maximum total duration of each period (ie, when the frequency was less than 20 Hz, an ISI was inserted between each two stimuli periods). The stimulation duration was determined using the results shown in Different Duration with Same PAR, which indicated that the threshold strength of the C-fiber model became constant when the duration of anodal stimulation was longer than 8 ms. For all the PAR values, the threshold strength of the C-fiber model and the Aδ-fiber model did not change before reaching 20 Hz, while the threshold strength of the C-fiber model increased and that of the Aδ-fiber model decreased after reaching 20 Hz, as shown in Figure 14A1-C1. As shown in Figure 14A2-C2, the C-fiber model showed similar changes with those in Figure 14A1-C1 even with the limitation to maximal duration of each period, except that the threshold strength of the Aδ-fiber model rose above 15 Hz and decreased again above 20 Hz. According to the change in Rth over frequency, a lower frequency amplifies PAR’s effects.
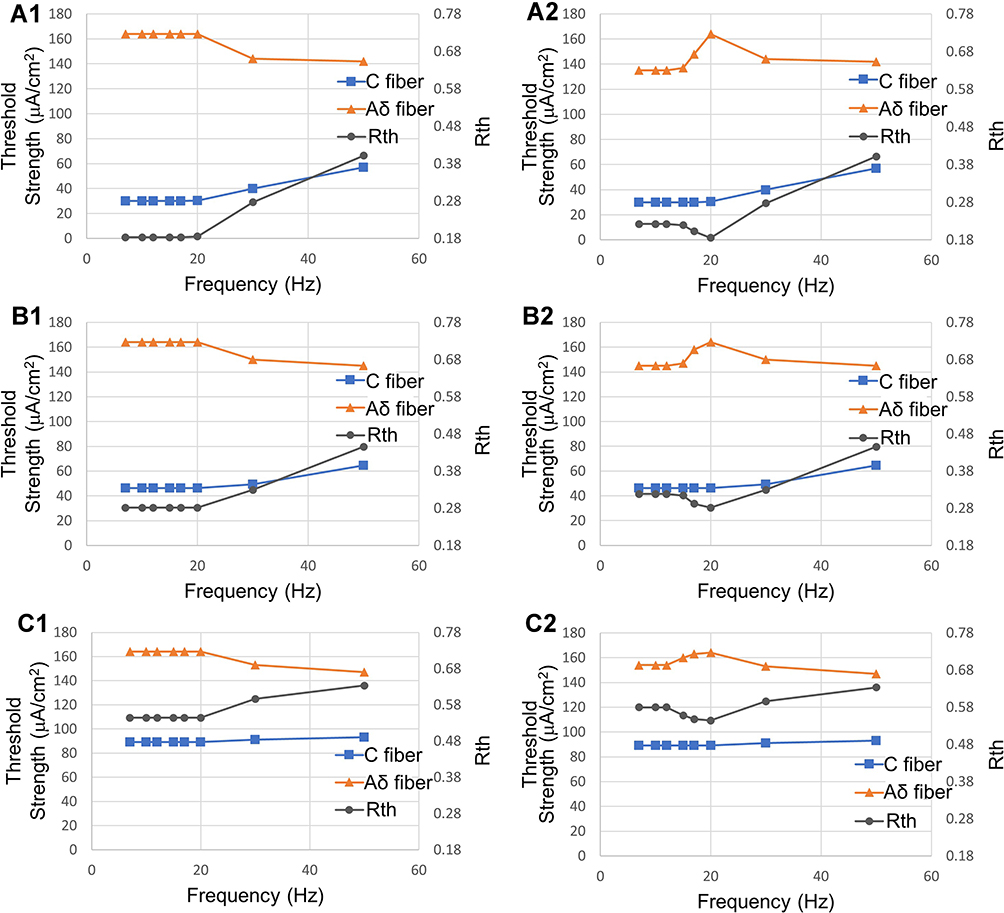 |
Figure 14 Relationship between pulse frequency, threshold strength, and Rth over PAR. (A1 and A2) PAR with 1:6, (B1 and B2) PAR with 1:3, (C1 and C2) PAR with 1:1. The threshold strength of the C-fiber model increases, and that of the Aδ-fiber model decreases after 20 Hz. According to the change in Rth over frequency, a lower frequency amplifies PAR’s effects. Abbreviations: PAR, polarity asymmetry ratio; Rth, ratio of the excitation threshold of C to that of Aδ. Notes: (A1–C1) without any limitation to the duration of each period, (A2–C2) with a limitation of 50 ms to the maximum duration of each period. |
Discussion
The Changes in the Phase Plane Caused by Preceding Anodal Stimulation
The threshold potential, changes, and relative position with respect to the resting point can be visualized clearly in the phase portrait, as illustrated in Figure 3. As seen in the phase portrait of the C-fiber model in Figure 5, when C is given anodal stimulation, the saddle point b of the C-fiber model moves downwards closer to rest point a until the two points disappear. During this process, the threshold of C gradually decreases and eventually goes below the threshold of Aδ. As the duration of anodal stimulation increases, Δd_int in Figure 5 decreases. When ta = 6 ms, the intersections disappear; instead, the distance between two isocline curves, ie, Δd_sep, starts to increase. The decrease in Δd_int or the increase in Δd_sep reduces the activation threshold of C, which can be justified by the results of Figure 10A and Figure 13A, showing the relationship between the threshold strength of both nerves and the duration of polarity symmetric and asymmetric stimulation, respectively.
The disappearance of the intersections in phase portraits could be confirmed by comparing different types of waveforms in terms of the preceding anodal stimulation. In all the resultant phase portraits shown in Figure 6, the waveforms with anodal stimulation include C1 (PAR 1:1), D1 (PAR 1:9), and E1 (PAR 9:1); however, only C1 (Figure 6C2: ΔdC_sep = (0.2, 0.01187)) and D1 (Figure 6D2: ΔdC_sep = (0.7, 0.02588)) caused the intersection to disappear, whereas the intersections remained after the beginning of the cathodal stimulus (denoted by a red dot) in the phase portrait of E1 ((Figure 6E2: ΔdC_int = (0.0, 0.00066)), as well as in those of the waveforms without anodal stimulus, ie, A1 (Figure 6A2: ΔdC_int = (2.7, 0.01402)), B1, F1. In fact, intersections remain until PAR decreases from 9:1 to 7:1.
The Δd_sep in Figure 6D (ta = 10 ms) is larger than that in Figure 6C (ta = 6 ms), and intersections occur in Figure 6B (ta = 2 ms), but its Δd_int is smaller than that in Figure 6A (no anodal stimulation case). Referring to the comparison results regarding the duration of preceding anodal stimulation (The Effect of Duration, Figure 10), ie, a longer duration causes a lower excitation threshold, it is reasonable to state that the stimulations resulting in the separation of the isocline curves in phase portraits benefit more excitability of C than those causing intersected isocline curves, and a larger Δd_sep indicates easier excitation of the nerve.
The phenomenon’s importance could be made clear through crosschecking the ion currents shown in Figure 7, in which the transmembrane ion current right before the excitation of the nerves corresponding to that in Figure 6E1 is almost the same as that in Figure 6A1. Although quite different from those in Figure 6C1-D1, the case in Figure 6E1 has a much longer anodal duration than that in Figure 6C1-D1 under the same charge constraint. The stimulation with PAR 7:1, which is the threshold value for causing the disappearance of intersections, has a comparatively greater difference than that of PAR 9:1 (a difference of ΔI: 5.99 μA, larger than the maximal ΔINa: 4.49 μA, caused by any other PAR values). Thus, it is reasonable to state that the disappearance of intersections a and b did play a role in reducing potassium ion current, hence reducing the activation threshold of C.
Moreover, a larger ΔdC_sep in D2 (0.7, 0.02588) compared with that in C2 (0.2, 0.01187) is caused by its stronger anodal stimulus in D1 (180 μA/cm2) compared with that in C1 (86 μA/cm2), as the duration of the anodal stimuli of C1 and D1 is the same (10 ms). This was further confirmed by the fact that E1 has a lower intensity than both C1 and D1 and thus could not cause the disappearance of intersections in the phase plane. In other words, as the intensity of the anodal stimulus increases, the distance ΔdC_sep between the two isocline curves becomes larger, indicating a stronger effect on reductions in the activation threshold.
Furthermore, the polarity asymmetric waveforms do not affect the activation threshold of Aδ as much as that of C, as reflected by the comparison between their behavior in the phase plane shown in Figure 6A3-F3 and Figure 6A2-F2.
Ion Channel Variable and Current Analysis
Specifically, the threshold strength, ie, the intensity of the external stimulus necessary for eliciting action potential, is affected by the state of each ion channel before the membrane potential exceeds its threshold. Equation (1) shows that a reduction in the external cathodal stimulation intensity means that a higher current from the ion channel is required to compensate for generating the action potential. Thus, the three ion channel gate variables are the focus of the analysis in Figure 8A, which shows the phase portrait of membrane potential v and sodium channel gate variable m. Regardless of where at the end of the anodal stimulation the initial value of m is located, the trajectories from the beginning of the cathodal stimulation (denoted by red dots) to the generation of the action potential (denoted by black dots) are all on nearly the same curve for different stimulation waveforms. Therefore, anodal stimulation does not fundamentally affect the behavior of the variable m because the short time constant of m of both the C-fiber and Aδ-fiber models leads to their fast-changing sodium channel, as shown in Figure 2. The difference caused by anodal stimulation makes it difficult to affect the increase in m during cathodal stimulation.
Compared with the variable m, the changes in the variables h and n are very significant. In the phase portraits of v-h and v-n, different stimulation waveforms (cathodal stimulation only, PAR 1:1–1:9) resulted in clearly different trajectories. Equation (2) shows that a higher h increases the current of the sodium (Na) ion channel, and a smaller n reduces the current of the potassium (K) ion channel, which increases the current flowing from the outside to the inside of the membrane and reduces the current flowing outward from the membrane, respectively, so that the action potential can be achieved with lower cathodal stimulation.
As the stimulus changes from cathodal stimulation only to biphasic PAR 1:1, 1:3, 1:6 and further to 1:9, the gap between the phase portraits of each pair of neighboring stimulation waveforms gradually decreases, which agrees with the decreasing trend in the threshold of the C-fiber model in Figure 12A. Although a smaller PAR results in a larger reduction in the cathodal stimulation threshold, further decreasing the PAR may cause saturation of the improvement in C-selectivity.
Figure 9 shows the changes in the sodium (Na) ion channel current and the potassium (K) ion channel current before the threshold potential. Compared with the significant gap of variable h in Figure 8B, the gaps between the Na ion currents at threshold potential corresponding to different stimulation waveforms in Figure 9A are not apparent (average: 10.21573 μA, standard deviation: 1.14962 μA). In contrast, the gaps between K ion currents in Figure 9B are very significant (average: 72.56375 μA, standard deviation: 9.25445 μA). Equation (2) shows that the Na ion current is positively correlated with the cubes of m and h. Moreover, because the value of the variable m is minimal before the threshold potential, the cube of m becomes an even smaller value, greatly reducing the gap between different variables h (Figure 8A). Alternatively, the K ion current is positively correlated with the fourth power of n, which further enlarges the gap caused by the difference in the variable n. Therefore, it is the K ion channel (regulated by the variable n) that plays a decisive role in reducing the activation threshold of C.
One issue to note is that the K ion currents (IK) of different waveforms show different behaviors after and before the membrane potential exceeds the threshold potential. As shown in Figure 9C, after its membrane potential reaches the threshold potential, IK corresponding to the waveform PAR 1:3 is much higher than that of the others, whereas all the K ion currents did not show a difference before the threshold potential. Since the time to reach the action potential from its resting state changed only slightly with threshold strength, IK does not affect the process after the model reaches the threshold potential, even though it does affect the speed from the threshold potential to the action potential.
In summary, the introduction of anodal stimulation can effectively lower the threshold of the unmyelinated nerve, while it does not greatly affect the threshold of Aδ. Although it has been suggested the anode break in peripheral sensory nerves may cause double peak potentials,39,40 previously thought to be elicited by depolarization of nerve terminal axons or skin receptors,41 the underlying ion mechanism has not yet been understood. Moreover, the double peak potentials were usually generated by low intensity, long duration stimulation, and the latency of the second peak was much longer than that of the first peak generated by cathodal stimulation.42 These stimulation conditions are consistent with the favorable stimulation conditions for C in our research. Our study showed that if the double peak potentials are caused by anode breakage, then anodal stimulation to C generates them.
A lower PAR can also widen the threshold strength gap. The use of asymmetric anodal polarity stimulation has a positive impact on the selective stimulation of nociceptive nerve fibers. However, as shown in Figures 7 and 12, as the PAR decreases, the effect of polarity asymmetric stimulation on reducing the threshold strength of the unmyelinated nerves becomes saturated. For charge-balanced stimulation, a lower PAR requires a higher intensity of anodal stimulation, which might excite surrounding tissues such as muscle and Aβ nerve fibers related to the sensation of touch, pressure, and vibration.
The Effect of Stimulation Waveform Parameters on C-Selectivity
Polar precedence, duration and ISI, and polarity asymmetry related to biphasic stimulation were investigated in detail. In the experiment on polar precedence, the cathodal-first stimulation results (Figure 10B) show that the threshold strength of the C is reduced and close to the threshold strength of Aδ but cannot be lower than it, which agrees with the results of other simulation studies and animal experiments,31,43 in which the anodal stimulus was given after the cathodal stimulus to balance the charge injection for safety consideration. The results here were consistent with the general understanding that thicker fibers are more likely than thinner fibers to be stimulated to produce action potentials.15 The threshold strength ratio of the responses to stimulation agrees well with the time constants of the ion channel variables of C and Aδ, which are shown in Figure 2. As shown in Figure 2, the time constants of m and h in the C-fiber model (the highest values are 0.5014 and 8.5820, respectively, in Figure 2A) are higher than those of m and h in the Aδ-fiber model (the highest values are 0.2167 and 1.1510, respectively, in Figure 2B), which means that the C-fiber model needs much more time to adapt to external stimuli.
In contrast, anodal-first stimulation favors C-selectivity and pushes the threshold of C to below that of Aδ. This phenomenon is similar to anode breakage,21 which showed the possibility of eliciting action potentials by only anodal stimulation. However, neither the role of charge balancing following cathodal stimulation nor the promotion of C excitation and C-selectivity over Aδ have been addressed. The phase portrait analysis shown in Figure 5 clearly shows that preceding anodal stimulation with a long enough duration, in conjunction with a following cathodal stimulation, can significantly promote C-selectivity.
Moreover, although the duration of anodal stimuli strongly affects the promotion effect of C, the threshold strength of C is not linearly dependent on the duration. Comparing the results shown in Figure 10A and Figure 13A, a low PAR can greatly reduce the threshold strength of the C-fiber model (PAR: 1:1–1:9, threshold strength: 87.4–20.9 μA/cm2), but they need the same duration (anodal duration: 8 ms) of stimulus to reach the minimum threshold strength. For the same total duration of stimulus such as 10 ms, the PAR 1:1 (anodal duration: 5 ms, threshold strength: 95.0 μA/cm2) and a much lower PAR, PAR 1:9 (anodal duration: 1 ms, threshold strength: 77.9 μA/cm2), did not show a large difference (17.1 μA/cm2) in threshold strength. However, as the total duration becomes longer, such as 30 ms, the case of PAR 1:1 (anodal duration: 15 ms, threshold strength: 87.4 μA/cm2, which is the same as all the cases with durations longer than 8 ms, according to the C threshold strength results shown in Figure 10A) and the case with a lower PAR, PAR 1:9 (anodal duration: 3 ms, threshold strength: 38.0 μA/cm2) showed a large difference (49.4 μA/cm2). Thus, only when the anodal stimulation duration is long enough can PAR significantly improve C-selectivity.
On the other hand, neither anodal-first nor cathodal-first stimulation significantly promoted Aδ. When the stimulation duration increases, the charge of the anodal stimulation also increases. That is, more cathodal stimulation charge is needed to counteract the anodal stimulation effect for Aδ; thus, the threshold strength of Aδ slightly increases. Although the effect of charge accumulation also affected C, it was offset by the promotion effect of anodal stimulation on C. In addition, the change in Rth shown in Figure 13B gradually decreased, implying that stimulation with an extremely long anodal duration (ie, >8 ms) hardly contributed to a further reduction in Rth. Note that for PAR 1:1 in Figure 10, the Rth also saturated at an 8 ms anodal duration, and it is reasonable to have a duration of anodal stimulation shorter than 8 ms.
The PAR of stimulation is related to the preceding anodal stimulation in terms of both intensity and duration; thus, its effect on the threshold strength of C is nonlinear. There have been studies reporting the effects of prepulses with different intensities and durations on neurodynamics.19 However, in the literature, PAR has not been studied as a comprehensive parameter of its effect on C-selectivity. In one relevant study,44 the effect of charge injection with asymmetrical waveforms was investigated through in vitro experiments. However, neither its effect on the excitability of C nor the underlying mechanism has been addressed. Thus, the role and underlying mechanism of PAR identified in this study can be a new dimension for designing effective selective stimulation.
Responding to stimulation with increasing anodal duration and decreasing intensity (a higher PAR value), the threshold strength of C gradually increases and exceeds that of Aδ, while the threshold strength of Aδ decreases slightly and remains unchanged after 5:1, as shown in Figure 12B. Figure 12C shows that Rth changes rapidly around PAR 1:1. This is also consistent with the change in ion current or potassium channel parameter n in Figure 7A and Figure 8C. Since the duration of the cathodal stimulus is constant in the experiments shown in Figure 12A, an increase in the threshold strength of C also indicates that the charge (or energy) accumulated by the cathodal stimulus is increased (Figure 12D). In contrast, the threshold strength of Aδ decreases as the pulse width of the anodal stimulus increases and its intensity decreases. As shown in Figure 12A, since the duration of the cathodal stimuli of all waveforms are the same, it was the anodal stimulus that made the difference. Furthermore, because the effect of duration saturated at a certain value, the intensity of the anodal stimulus played a major role, as shown in Figure 10. However, stronger anodal stimulation may have potential safety concerns. Regardless of anodal and cathodal stimuli, excessive stimulation intensity may affect other subcutaneous tissues or even cause damage to them.45 From the anodal duration-Rth graphs for the PAR 1:1 (Figure 10C) and PAR 1:9 cases (Figure 13B), the improvement of Rth might be saturated at an anodal duration of 8 ms. An anodal stimulus longer than 8 ms can have a better stimulation effect on C, and a lower asymmetric ratio can lead to better C-selectivity (Figure 12C). However, when the above two conditions are met simultaneously, the stimulation waveform may be too long, which might cause safety issues.46 Therefore, even though waveforms and parameters for achieving better C-selectivity were identified in this study, the range of the key parameters, such as the intensity and pulse width of the anodal stimulation, needs to be further investigated to ensure the safety and effectiveness of C-selectivity for surface stimulations.
As shown in Figure 14, the relationships between the threshold strength, Rth, and pulse frequency at three different PAR values are consistent with those shown in Figure 12. For the three PAR ratios of 1:6, 1:3, and 1:1, the value of Rth mostly depends on the threshold strength of the C-fiber model. In Figure 14A1-C1, since there is no restriction on the stimulation duration, the threshold of the Aδ-fiber model remains the same as that of the C-fiber model at less than 20 Hz. On the one hand, long-term stimulation causes Faradaic charge transfer, leading to safety hazards;46 on the other hand, a stimulation frequency less than 20 Hz does not further improve C-selectivity. We limited the stimulation duration to 50 ms in Figure 14A2-C2. The result shows that the C-fiber model threshold is unchanged, but the Aδ-fiber model threshold is reduced at low frequencies and returns its maximum at 20 Hz, regardless of the PAR value. For the Rth of each PAR, the main changes came from the increase in threshold strength of the Aδ-fiber model when stimulated at frequencies larger than 15 Hz, 15 Hz and 12 Hz for PAR 1:6, 1:3, and 1:1, respectively. A shorter interstimulus interval results from the frequency band having a stronger effect on increasing the threshold strength of the Aδ-fiber model. This may be due to the extremely large time constant of parameter s in the Aδ-fiber model.23 However, when the frequency is greater than 20 Hz, the threshold strength of the Aδ-fiber model begins to decrease, while the threshold strength of the C-fiber model increases. Especially at a low PAR (1:6), the magnitude of the change is the largest. As the frequency further increases, the Rth of Figure 14A2 (PAR 1:6) changes more than that in Figure 14B2-C2, leading to a smaller difference in their Rth. This reflects that when the frequency approaches the higher frequency band (>20 Hz), the influence of the frequency is larger; otherwise, it decreases. After comparing Figure 14A2-C2, a lower frequency amplifies PAR’s effects on Rth (the difference of Rth: 0.09616 between PAR 1:6 and 1:3 with 20 Hz, is larger than the difference of Rth: 0.04411 between PAR 1:6 and 1:3 with 50 Hz). Therefore, when using stimulation with a long total (anodal and cathodal stimulation) duration (50–100 ms from Figure 13A), selecting a low PAR and higher frequency (15 Hz-20 Hz) in the lower frequency band can improve C-selectivity. This is consistent with related experimental data,10 showing that stimulation at a frequency lower than 20 Hz is beneficial to the activation of unmyelinated nerves. Additionally, it is necessary to trade off the C selectivity effect and safety when performing stimulation below 15 Hz. However, as reported by other studies,14 in the higher frequency band (100–500 Hz), the frequency is an important factor to promote the excitation of Aδ while inhibiting C.
Unlike the interval between two biphasic stimuli, the ISI between an anodal pulse and a cathodal pulse impacts stimulation safety. It has been shown that this ISI needs to be less than 10 ms and greater than 6 ms to meet the safety requirements of biphasic stimulation.47 The aim of adding ISI into the cathodal-first stimulation waveform is to reduce the threshold strength of the following anodal stimulation.47 However, to guarantee the safety of stimulation, the interval between cathodal and anodal stimuli cannot be too large. Therefore, choosing an appropriate duration of ISI is vital to improve the effect of cathodal-first stimulation. On the other hand, according to our results shown in Figure 11, a shorter ISI or even no ISI can maximize the selective stimulation effect for the biphasic anodal-first stimulation. A shorter ISI can not only improve C-selectivity but also reduce the impact on organs. This can be understood from the perspective of safety as follows. The anodal stimulation and cathodal stimulation should be as close as possible to ensure that the charge can be neutralized within a short time.
In addition, the interval between each biphasic pulse effects the stimulation results (such as the effect of the refractory period reported by Dudel48). For pulses with a low frequency of 1 Hz, nerves stimulated by the current biphasic pulse are less subjected to the influence of its previous biphasic pulse since there is enough time for the neuron to recover (Figure 14A2-C2).
Contribution and Limitations
In this study, a prepulse-based approach and frequency-based approach were explored and integrated to realize high C-selectivity over Aδ. The contributions of this paper can be summarized as follows.
1) By investigating the simulation model responses of two types of nociceptive nerve fibers in a phase plane and their ion currents, the effectiveness of anodal-first stimulation for C-selectivity and its ion channel mechanism were clarified for the first time in this research area. Biphasic square waves are not just for charge balancing; with appropriate intensity and duration of anodal stimuli, they could significantly reduce the potassium current flowing out through the membrane and thus lower the threshold strength of C. Moreover, by using the index for C-selectivity, Rth, and index in the phase plane, ∆d_int and ∆d_sep, it was clear that, for the polarity asymmetric pulses, the intensity of the anodal stimulus is a more important factor than its duration, though a specific duration of the anodal stimulus is necessary to guarantee C-selectivity.
2) The effects of the critical parameters for continuous periodic biphasic stimulation on C-selectivity over Aδ were first investigated. The parameters include frequency, duration, ISI, and polarity asymmetry ratio (PAR). The landscape of the solution space of C selective stimulation was made clear. For symmetric polarity stimulation, 20 Hz is the best frequency for C-selectivity. Lower PARs are better for C-selectivity in terms of both Rth and potassium ion currents. However, considering the safety of stimulation, there might be a constraint on the intensity of the anodal stimuli.
In addition to contributions, limitations were noted. Since the ultimate goal is to realize selective surface stimulation, the influence of skin should be taken into consideration. This work is beyond the scope of this paper but needs to be clarified in the near future. Additionally, we did not consider the stimulation effect of C and Aδ near the ground. Moreover, the influence of polarity asymmetric biphasic stimulation on nerves and tissues other than C and Aδ was not apparent but must be considered and reflected in the simulation models. In another parallel study, a multilayer FEM (finite element method) transmission model was developed to study the effects of surface electrodes and various tissues on deep stimulation. In the near future, the transmission model will be combined with the nerve fiber models of this study to verify the safety and effects of surface stimulation with different parameters. Furthermore, the findings from the simulation study need to be carefully verified and further validated. Close cooperation with both subjective questionnaires and objective evaluations, such as studies on pain-related electrical stimulation-evoked electroencephalograms, is crucial.49
Conclusion
To clarify how a preceding anodal stimulation and a cathodal stimulation (named anodal-first stimulation) could lower the activation threshold of nociceptive C over myelinated nociceptive Aδ and to further clarify the landscape of the solution space, the C-fiber and Aδ-fiber models were employed to compare their responses to relevant waveforms in terms of both their behavior in the phase plane and C-selectivity. It was made clear that anodal-first polarity asymmetric stimulations are more likely to stimulate unmyelinated nerves because the preceding anodal stimulation could decrease their potassium ion current for the subsequent cathodal stimulation. The optimal parameters in terms of the activation threshold were identified in the low-frequency band, which showed an especially high possibility of C-selectivity. This is an important step towards long-term pain relief for chronic pain.
Acknowledgments
Siyu He was supported by the State Scholarship Fund awarded by the China Scholarship Council (CSC) (Grant number: 201708050123). We also gratefully acknowledge other members of our laboratory for their kind help.
Disclosure
We claim that this work is partially supported by a joint research project between Chiba University and Omron Healthcare Co., Ltd., and Shozo Takamatsu is an employee of Omron Healthcare Co., Ltd. Mr Siyu He reports grants from China Scholarship Council, during the conduct of the study. The authors report no other conflicts of interest in this work.
References
1. Eisenberg LS, Maltan AA, Portillo F, Mobley JP, House WF. Electrical stimulation of the auditory brain stem structure in deafened adults. J Rehabil Res Dev. 1987;24(3):9–22. doi:10.1682/JRRD.1987.07.0009
2. Sisken BF, Walker J, Orgel M. Prospects on clinical applications of electrical stimulation for nerve regeneration. J Cell Biochem. 1993;51(4):404–409. doi:10.1002/jcb.2400510404
3. Ahlborn P, Schachner M, Irintchev A. One hour electrical stimulation accelerates functional recovery after femoral nerve repair. Exp Neurol. 2007;208(1):137–144. doi:10.1016/j.expneurol.2007.08.005
4. Paquette JP, Yoo PB. Recruitment of unmyelinated C fibers mediates the bladder-inhibitory effects of tibial nerve stimulation in a continuous-fill anesthetized rat model. Am J Physiol. 2019;317(1):F163–F171. doi:10.1152/ajprenal.00502.2018
5. Apkarian AV, Hashmi JA, Baliki MN. Pain and the brain: specificity and plasticity of the brain in clinical chronic pain. Pain. 2011;152(3 Suppl):S49. doi:10.1016/j.pain.2010.11.010
6. Breivik H, Collett B, Ventafridda V, Cohen R, Gallacher D. Survey of chronic pain in Europe: prevalence, impact on daily life, and treatment. Eur j Pain. 2006;10(4):287–333. doi:10.1016/j.ejpain.2005.06.009
7. Chen XH, Han JS. Analgesia induced by electroacupuncture of different frequencies is mediated by different types of opioid receptors: another cross-tolerance study. Behav Brain Res. 1992;47(2):143–149. doi:10.1016/S0166-4328(05)80120-2
8. Plaghki L, Mouraux A. How do we selectively activate skin nociceptors with a high power infrared laser? Physiology and biophysics of laser stimulation. Clin Neurophysiol. 2003;33(6):269–277. doi:10.1016/j.neucli.2003.10.003
9. Churyukanov M, Plaghki L, Legrain V, Mouraux A. Thermal detection thresholds of Aδ-and C-fibre afferents activated by brief CO 2 laser pulses applied onto the human hairy skin. PLoS One. 2012;7(4):e35817. doi:10.1371/journal.pone.0035817
10. Harris GW. Ovulation. Am J Obstet Gynecol. 1969;105(5):659–669. doi:10.1016/0002-9378(69)90002-7
11. Grill WM, Veraart C, Mortimer JT. Selective activation of peripheral nerve fascicles: use of field steering currents. Proce Ann Int Conference IEEE Eng Medi Biol Soc. 1991;13:904–905.
12. Martell BA, Connor PG, Kerns RD, et al. Systematic review: opioid treatment for chronic back pain: prevalence, efficacy, and association with addiction. Ann Intern Med. 2007;146(2):116–127. doi:10.7326/0003-4819-146-2-200701160-00006
13. Otsuru Koji Inui N, Yamashiro K, Miyazaki T, Ohsawa I, Takeshima Y, Kakigi R. Selective stimulation of C fibers by an intra-epidermal needle electrode in humans. Open Pain J. 2009;2(1):53–56. doi:10.2174/1876386300902010053
14. He SY, Yoshida Y, Tripanpitak K, Takamatsu S, Huang SY, Yu WW. A simulation study on selective stimulation of C-fiber nerves for chronic pain relief. IEEE Access. 2020.
15. Grill WM, Mortimer JT. Inversion of the current-distance relationship by transient depolarization. IEEE Trans Biomed Eng. 1997;44(1):1–9. doi:10.1109/10.553708
16. Pitei DL, Watkins PJ, Stevens MJ, Edmonds ME. The value of the Neurometer in assessing diabetic neuropathy by measurement of the current perception threshold. Diabetic Med. 1994;11(9):872–876. doi:10.1111/j.1464-5491.1994.tb00371.x
17. Koga K, Furue H, Rashid MH, Takaki A, Katafuchi T, Yoshimura M. Selective activation of primary afferent fibers evaluated by sine-wave electrical stimulation. Mol Pain. 2005;1(1):13. doi:10.1186/1744-8069-1-13
18. Dufour A, Guergova S, Pebayle T, Touzalin-Chretien P. On the selective activation of unmyelinated C-fibers using sinusoidal electrical stimulation: an ERP study. Clin Neurophysiol. 2011;122(5):1042–1047. doi:10.1016/j.clinph.2011.01.046
19. Bostock H, Cikurel K, Burke D. Threshold tracking techniques in the study of human peripheral nerve. Muscle Nerve. 1998;21(2):137–158. doi:10.1002/(SICI)1097-4598(199802)21:2<137::AID-MUS1>3.0.CO;2-C
20. Grill WM, Mortimer JT. Stimulus waveforms for selective neural stimulation. IEEE Eng Med Biol Mag. 1995;14(4):375–385. doi:10.1109/51.395310
21. Ranjan R, Chiamvimonvat N, Thakor NV, Tomaselli GF, Marban E. Mechanism of anode break stimulation in the heart. Biophys J. 1998;74(4):1850–1863. doi:10.1016/S0006-3495(98)77895-6
22. Hodgkin AL, Huxley AF. A quantitative description of membrane current and its application to conduction and excitation in nerve. J Physiol. 1952;117(4):500–544. doi:10.1113/jphysiol.1952.sp004764
23. McIntyre CC, Richardson AG, Grill WM. Modeling the excitability of mammalian nerve fibers: influence of afterpotentials on the recovery cycle. J Neurophysiol. 2002;87(2):995–1006. doi:10.1152/jn.00353.2001
24. Best EN. Null space in the Hodgkin-Huxley Equations. A critical test. Biophys J. 1979;27(1):87. doi:10.1016/S0006-3495(79)85204-2
25. Krouchev NI, Rattay F, Sawan M, Vinet A. From squid to mammals with the HH model through the Nav channels’ half-activation-voltage parameter. PLoS One. 2015;10(12):e0143570. doi:10.1371/journal.pone.0143570
26. Stein RB, Pearson KG. Predicted amplitude and form of action potentials recorded from unmyelinated nerve fibres. J Theor Biol. 1971;32(3):539–558. doi:10.1016/0022-5193(71)90155-X
27. Schoenbach KH, Peterkin FE, Alden RW, Beebe SJ. The effect of pulsed electric fields on biological cells: experiments and applications. IEEE Trans Plasma Sci. 1997;25(2):284–292. doi:10.1109/27.602501
28. Pinto RD, Varona P, Volkovskii AR, Szücs A, Abarbanel HD, Rabinovich MI. Synchronous behavior of two coupled electronic neurons. Phys Rev E. 2000;62(2):2644. doi:10.1103/PhysRevE.62.2644
29. Bhadra N, Lahowetz EA, Foldes ST, Kilgore KL. Simulation of high-frequency sinusoidal electrical block of mammalian myelinated axons. J Comput Neurosci. 2007;22(3):313–326. doi:10.1007/s10827-006-0015-5
30. Bourbeau DJ, Hokanson JA, Rubin JE, Weber DJ. A computational model for estimating recruitment of primary afferent fibers by intraneural stimulation in the dorsal root ganglia. J Neural Eng. 2011;8(5):056009. doi:10.1088/1741-2560/8/5/056009
31. Gaines JL, Finn KE, Slopsema JP, Heyboer LA, Polasek KH. A model of motor and sensory axon activation in the median nerve using surface electrical stimulation. J Comput Neurosci. 2018;45(1):29–43. doi:10.1007/s10827-018-0689-5
32. Catterall WA, Raman IM, Robinson HP, Sejnowski TJ, Paulsen O. The Hodgkin-Huxley heritage: from channels to circuits. J Neurosci. 2012;32(41):14064–14073. doi:10.1523/JNEUROSCI.3403-12.2012
33. Bekkouche B. Functional implications from changes in volume and periaxonal space of C-fibers. School Technol Health Stockholm Sweden Tech Rep. 2012;26.
34. Tarotin I, Aristovich K, Holder D. Model of impedance changes in unmyelinated nerve fibers. IEEE Trans Biomed Eng. 2018;66(2):471–484. doi:10.1109/TBME.2018.2849220
35. Tai C, De Groat WC, Roppolo JR. Simulation analysis of conduction block in unmyelinated axons induced by high-frequency biphasic electrical currents. IEEE Trans Biomed Eng. 2005;52(7):1323–1332. doi:10.1109/TBME.2005.847561
36. Frankenhaeuser B, Huxley AF. The action potential in the myelinated nerve fibre of Xenopus laevis as computed on the basis of voltage clamp data. J Physiol. 1964;171(2):302–315. doi:10.1113/jphysiol.1964.sp007378
37. Sweeney JD, Mortimer JT, Durand D Modeling of mammalian myelinated nerve for functional neuromuscular stimulation. IEEE Ann Conference Eng Med Biol Soc. 1987;3:1577–1578.
38. Dean D, Lawrence PD. Application of phase analysis of the Frankenhaeuser-Huxley equations to determine threshold stimulus amplitudes. IEEE Trans Biomed Eng. 1983;12:810–818. doi:10.1109/TBME.1983.325083
39. Pereira P, Leote J, Cabib C, Casanova-Molla J, Valls-Sole J. Stimulus waveform determines the characteristics of sensory nerve action potentials. Clin Neurophysiol. 2016;127(3):1879–1885. doi:10.1016/j.clinph.2015.12.012
40. Therimadasamy A, Chan YC, Wilder-Smith EP. Skin receptors and intradermal nerves do not generate the sensory double peak. Muscle Nerve. 2015;52(1):103–106. doi:10.1002/mus.24502
41. Aprile I, Tonali P, Stalberg E, et al. Double peak sensory responses: effects of capsaicin. Neurol Sci. 2007;28(5):264–269. doi:10.1007/s10072-007-0833-x
42. Aprile I, Tonali P, Stalberg E, et al. Double peak sensory responses at submaximal stimulation. Clin Neurophysiol. 2003;114(2):256–262. doi:10.1016/s1388-2457(02)00370-x
43. Boyd IA, Kalu KU. Scaling factor relating conduction velocity and diameter for myelinated afferent nerve fibres in the cat hind limb. J Physiol. 1979;289(1):277–297. doi:10.1113/jphysiol.1979.sp012737
44. Cogan SF, Troyk PR, Ehrlich J, Plante TD, Detlefsen DE. Potential-biased, asymmetric waveforms for charge-injection with activated iridium oxide (AIROF) neural stimulation electrodes. IEEE Trans Biomed Eng. 2006;53(2):327–332. doi:10.1109/TBME.2005.862572
45. Mallik A, Weir AI. Nerve conduction studies: essentials and pitfalls in practice. Neurosurg Psychiatry. 2005;76(suppl 2):ii23–ii31. doi:10.1136/jnnp.2005.069138
46. Merrill DR, Bikson M, Jefferys JG. Electrical stimulation of excitable tissue: design of efficacious and safe protocols. J Neurosci Methods. 2005;141(2):171–198. doi:10.1016/j.jneumeth.2004.10.020
47. Mohamed MA, Islas JF, Schwartz RJ, Birla RK. Electrical stimulation of artificial heart muscle: a look into the electrophysiological and genetic implications. ASAIO j. 2017;63(3):333. doi:10.1097/MAT.0000000000000486
48. Dudel J, Schmidt RF, Thews G. Further data about venous channels in South African Plio-Pleistocene hominids. Hum Physiol. 1983.
49. Tripanpitak K, Viriyavit W, Huang SY, Yu W. Classification of pain event related potential for evaluation of pain perception induced by electrical stimulation. Sensors. 2020;20(5):1491. doi:10.3390/s20051491
 © 2021 The Author(s). This work is published and licensed by Dove Medical Press Limited. The
full terms of this license are available at https://www.dovepress.com/terms
and incorporate the Creative Commons Attribution
- Non Commercial (unported, 3.0) License.
By accessing the work you hereby accept the Terms. Non-commercial uses of the work are permitted
without any further permission from Dove Medical Press Limited, provided the work is properly
attributed. For permission for commercial use of this work, please see paragraphs 4.2 and 5 of our Terms.
© 2021 The Author(s). This work is published and licensed by Dove Medical Press Limited. The
full terms of this license are available at https://www.dovepress.com/terms
and incorporate the Creative Commons Attribution
- Non Commercial (unported, 3.0) License.
By accessing the work you hereby accept the Terms. Non-commercial uses of the work are permitted
without any further permission from Dove Medical Press Limited, provided the work is properly
attributed. For permission for commercial use of this work, please see paragraphs 4.2 and 5 of our Terms.