Back to Journals » Eye and Brain » Volume 12
Ganglion Cell Complex Analysis in Glaucoma Patients: What Can It Tell Us?
Authors Scuderi G, Fragiotta S ![]() , Scuderi L, Iodice CM, Perdicchi A
, Scuderi L, Iodice CM, Perdicchi A
Received 8 August 2019
Accepted for publication 15 January 2020
Published 31 January 2020 Volume 2020:12 Pages 33—44
DOI https://doi.org/10.2147/EB.S226319
Checked for plagiarism Yes
Review by Single anonymous peer review
Peer reviewer comments 2
Editor who approved publication: Professor Margaret Wong-Riley
Gianluca Scuderi,1 Serena Fragiotta,1 Luca Scuderi,2 Clemente Maria Iodice,3 Andrea Perdicchi1
1NESMOS Department, Ophthalmology Unit, S. Andrea Hospital, University of Rome “La Sapienza”, Rome, Italy; 2Ophthalmology Unit, Department of Sense Organs, Azienda Policlinico Umberto I, University of Rome “La Sapienza”, Rome, Italy; 3Faculty of Medicine and Dentistry, University of Rome “La Sapienza”, Rome, Italy
Correspondence: Serena Fragiotta
NESMOS Department, S. Andrea Hospital, Via di Grottarossa 1035-1039, Rome 00189, Italy
Tel +39 3293276433
Fax +39 0633776628
Email [email protected]
Abstract: Glaucoma is a group of optic neuropathies characterized by a progressive degeneration of retina ganglion cells (RGCs) and their axons that precedes functional changes detected on the visual field. The macular ganglion cell complex (GCC), available in commercial Fourier-domain optical coherence tomography, allows the quantification of the innermost retinal layers that are potentially involved in the glaucomatous damage, including the retinal nerve fiber (RNFL), ganglion cell and inner plexiform layers. The average GCC thickness and its related parameters represent a reliable biomarker in detecting preperimetric glaucomatous damage. The most accurate GCC parameters are represented by average and inferior GCC thicknesses, and they can be associated with progressive visual field loss. Although the diagnostic accuracy increases with more severe glaucomatous damage and higher signal strength values, it is not affected by increasing axial length, resulting in a more accurate discrimination of glaucomatous damage in myopic eyes with respect to the traditional RNFL thickness. The analysis of the structure-function relationship revealed a good agreement between the loss in retinal sensitivity and GCC thickness. The use of a 10-2° visual field grid, adjusted for the anatomical RGCs displacement, describes more accurately the relationship between RGCs thickness and visual field sensitivity loss.
Keywords: retinal ganglion cells, spectral-domain optical coherence tomography, standard automated perimetry, retinal nerve fiber layer
Introduction
Glaucoma is a heterogenous group of progressive neurodegenerative optic neuropathies characterized by the degeneration of retinal ganglion cells (RGC) and their axons in addition to significant remodeling of the lamina cribrosa of the optic nerve head.1,2
Standard automated perimetry (SAP) has been widely used to assess visual function in glaucomatous eyes for staging and monitoring the disease progression.3–7 However, it has been estimated that at least 25% to 35% of RGCs must be lost before producing significant abnormalities on the visual field.8 Several clinical studies confirmed that the decline in RGCs precedes functional changes detected on SAP in glaucomatous eyes, confirming that a combination of structural and functional tests might offer an optimal assessment of the neural damage and its progression.9–13
Optical coherence tomography (OCT) allows for noninvasive imaging of glaucomatous structural damage involving the optic nerve, peripapillary retinal nerve fiber layer (RNFL) and the macular region. Of these, the quantification of circumpapillary RNFL represents the most commonly used OCT parameter because it has been considered a useful method in assessing the structural loss of RGCs in glaucoma.14–17 However, this method analyzes only the axonal portion of the RGCs without considering the cell bodies and dendrites, which are also affected in glaucoma and reside in the ganglion cell layer (GCL) and inner plexiform layer (IPL), respectively.18–20
In addition to the conventional peripapillary RNFL, macular thickness can be affected in glaucomatous eyes, suggesting that it may represent a surrogate indicator of RGCs damage, given the prominent distribution of these cells within the macular region.19,21–23 However, the indirect estimation of RGCs with macular thickness was inaccurate due to influence from the outer retinal layers, which constitute approximately 65% to 70% of the total retinal thickness and contribute to high variability and less discriminant power.18
With the development of newer OCT, the automatized segmentation of inner retinal layers has become possible. Macular ganglion cell complex (GCC) includes all three innermost retinal layers potentially involved in the glaucomatous damage (RNFL, GCL and IPL); in addition, the segmentation of the GCC thickness is traced from the inner limiting membrane and the outer IPL boundary.18,24 The GCC thickness was confirmed to be superior to macular thickness in detecting glaucomatous eyes.18
The purpose of the present review is to provide an excursus of the existing literature on the role of GCC in glaucomatous disease, reporting how to interpret the GCC parameters in the early diagnosis, progression and prognosis.
Macular Ganglion Cell Complex Imaging
Topographic Distribution of RGCs in Normal and Glaucomatous Retina
Ganglion cells peak density ranges between 31,600 and 37,800 cells/mm,2 and the highest cells density in a horizontally oriented elliptical ring of 0.4–2 mm from the foveal center, with approximately 50% of the RGCs overall, is located within 4.5 mm of the foveal center.25 A topographical analysis of RGC in cadaveric glaucomatous eyes also revealed that RGC density was 10 times higher in the foveal region with respect to more peripheral retina.8
The RGCs first appeared at 150–250 μm from the foveal center, and the total displacement declined to zero at the optic nerve head (approximately 3.4 mm nasal to the foveal center) but was still detectable up to 4.5 mm temporal to the foveal center. The Henle fiber layer length is the most important contributor to the receptoral and post-receptoral displacement and was found to be greater than the one previously estimated.25–28
Different animal models of experimental glaucoma have been developed to simulate glaucomatous optic neuropathy. It has been confirmed that sustained intraocular pressure elevation is accompanied by a progressive RGCs loss associated with visual acuity and contrast sensitivity decline.29–31 More importantly, as demonstrated in adult rhesus macaques, the RNFL birefringence declines prior to and more quickly than the RNFL thickness, suggesting that RGCs cytoskeleton damage precedes RNFL thinning.32
In experimentally induced glaucoma, a selective loss of large RGCs was demonstrated in the foveal region and the midperipheral retina.33 The foveal region demonstrated a loss of ganglion cells similar to other peripheral retinal areas in experimentally induced glaucoma in monkeys.34 The greater susceptibility of the large RGCs to glaucomatous damage was also confirmed in a similar experimental model, analyzing three different degrees of glaucomatous damage: mild (10–40% cell loss), moderate (40–60% cell loss) and severe (60–90% cell loss). In this model, the inferior retina appeared to be more affected than superior areas.35 In human retina, greater susceptibility of the large RGCs to glaucomatous damage was confirmed, but although the inferior retina presented smaller RGCs cells, no significant differences were found in the RGCs distribution between hemifields.13
The RGC damage in experimentally induced ocular hypertension in rodents was primarily sectorial in a “pie-shaped” or “triangular” configuration, with selective damage of the RGC cells and relative sparing of the non-RGC neurons as presumed displaced amacrine cells. These triangular sectors of RGC loss, localized preferentially on the dorsal retina, were oriented with their base toward the peripheral retina and their apex toward the optic disc.36,37
Quantification of GCC Using Optical Coherence Tomography
With the introduction of Fourier-domain OCT technology, several manufacturers proposed the evaluation of the ganglion cell layer using different protocols. Table 1 summarizes spectral-domain (SD) commercially available OCT protocols used to analyze macular ganglion cells.18,38–44
 |
Table 1 Overview of the Ganglion Cell Layer Imaging Performed by Different Spectral-Domain OCT Devices |
The RTVue-100 software (Optovue, Inc., Fremont, CA) acquires 26,000 A-scans per second with an axial resolution of 5 μm in the tissue.18,38 The GCC is defined as the sum of RNFL, GCL and IPL thickness measured from the inner limiting membrane to the IPL boundaries (Figure 1). The GCC scan pattern is centered 0.75 mm temporal to the fovea, covering a square grid of 7 × 7 mm on the central macula and consisting of 15 B-scans spaced 0.5 mm from one another.18
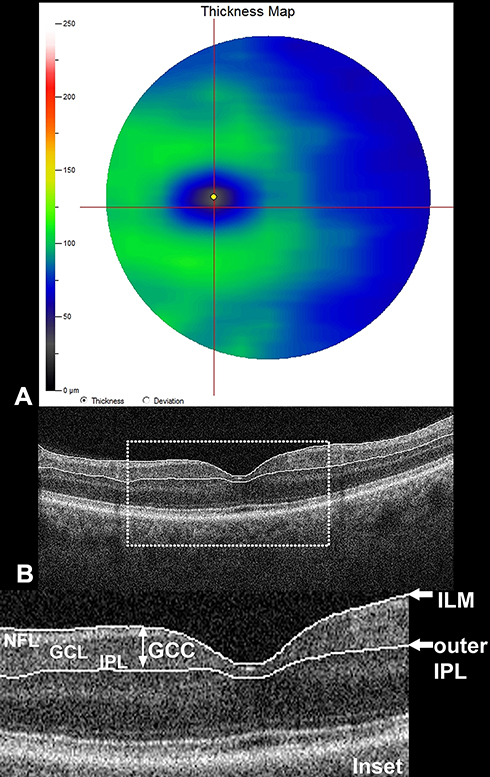 |
Figure 1 Ganglion cell complex (GCC) analysis and segmentation. (A) Thickness map, automatically calculated using RTVue Fourier-domain optical coherence tomography (FD-OCT); (B) Cross-sectional FD-OCT B-scan with segmentation of the GCC. The inset (dotted square) depicts the three anatomical layers included in the GCC analysis: nerve fiber layer (NFL), ganglion cell layer (GCL) and inner plexiform layer (IPL). The traced boundaries for the GCC scan (white arrows) pass from the inner limiting membrane and outer IPL. |
After the acquisition, the software automatically computes three color-coded maps: a) a thickness map, color-coded with cooler colors (blue and black), indicating more severe GCC loss; b) a deviation map, which displays the percentage of thickness loss with respect to the normative database; and c) a significance map, which displays statistically significant thickness changes from the normal.
Two pattern-based diagnostic indexes are also calculated by the analysis software. The focal loss volume (FLV) indicates the average amount of focal GCC loss divided by the map area. The global loss volume (GLV) provides the sum of the negative fractional deviation.18,45 (Figure 2)
 |
Figure 2 Quantification of ganglion cell complex (GCC) using Fourier-domain optical coherence tomography (FD-OCT) in the case of severe glaucomatous ganglion cell loss. Three different colorimetric maps were automatically computed by the FD-OCT software (RTVue-100 software; Optovue, Inc., Fremont, CA). (A) Thickness map, displaying diffuse blue and black colors indicating severe and diffuse loss of GCC thickness. The central black spot indicates the fovea where the ganglion cells are missing. (B) Deviation map, illustrating the percentage of thickness loss with respect to the normative database. Black coloring indicates a GCC loss of 50% or greater. (C) Significance map, displaying the significant thickness change variation from normal, where green represents values within the normal range (p-value 5–95%), yellow indicates borderline results (< 5%) and red represents results outside the normal limits (< 1%); (D) Quantitative indexes calculated by the software, including average thickness, hemifield thicknesses (superior, inferior and intra-eye) and the two pattern-based diagnostic indexes (i.e., focal loss volume [FLV] and global loss volume [GLV]); (E) Cross-sectional B-scan displays the segmentation used for GCC analysis. |
The pattern-based parameters (i.e., FLV and GLV) are considered to have better diagnostic values than the mean GCC loss, likely because a focal GCC loss can be overlooked in eyes with above-average GCC thickness.18,45
Cirrus HD-OCT (Carl Zeiss Meditec, Inc., Dublin, CA) achieves 27,000 A-scans per second with an axial image resolution of 5 μm.46 The ganglion cell analysis algorithm automatically delineates the outer boundary of the macular RNFL and the IPL, obtaining the ganglion cell-inner plexiform layer (GCIPL).41
The Cirrus HD-OCT software calculates the average, minimum and sectoral GCIPL thickness (superotemporal, superior, superonasal, inferonasal, inferior, inferotemporal);47 for further details, see Table 1. The minimum GCIPL thickness represents the lowest thickness over a single meridian crossing the anulus. The software also provides a thickness map, a color-coded topographic map matching a normative database and a deviation map. Values within the normal range (P = 5–95%) are depicted in green, borderline values (1% < P < 5%) in yellow and values outside normal limits (P < 1%) in red.41,47
The 3D OCT-2000 (Topcon, Inc., Tokyo, Japan) device uses a scan speed of 50,000 A-scans per second with a depth resolution of 6 μm. The macular inner retinal layers analyzed by the software include GCC, GCL+IPL (mGCL+) and macular RNFL; for further details, see Table 1.48,49 The macular inner retinal layer analysis software divides the macular square into a 6 x 6 grid containing 100 cells (0.6 x 0.6 mm each). The thickness calculated in each cell is compared with a normative database. Similar to the other color-coded maps, values within the normal range are represented as green, borderline as yellow and outside normal limits as red.48
Spectralis (Heidelberg Engineering, Inc., Heidelberg, Germany) posterior pole asymmetry protocol (Table 1) calculates the total retinal thickness in a central 8 x 8 grid, which displays the asymmetry between the eyes and between the superior and inferior hemispheres of each eye, using darker cells to represent regions of greater asymmetry.43,44
Diagnostic Accuracy, Reproducibility and Clinical Validation of Macular Ganglion Cell Complex Analysis
The diagnostic accuracy of GCC is significantly influenced by disease severity—with increasing accuracy in more severe glaucomatous damage—whereas the optic disc size does not influence the GCC parameters.50 Furthermore, scan quality (i.e., signal strength index) was considered an additional factor that influences the diagnostic performance of GCC parameters in glaucoma.51
The RTVue-100 device is widely used in clinical practice, demonstrating diagnostic performance similar to other SD-OCT devices in identifying glaucomatous disease by using average peripapillary RNFL and GCC thickness.38 The reproducibility of GCC measurements with the RTVue-100 OCT has been demonstrated to be superior to the previous Stratus OCT devices and is satisfactory on both healthy and glaucomatous eyes with moderate to severe damage.52
The GCIPL thickness parameters are also less influenced by axial length or refractive errors, representing a potential advantage in the Asian population, known to exhibit a high prevalence of myopia.53 The inner retinal layers measured by 3D-OCT demonstrated significant variations with gender and age but had no significant relationship with axial length.54
The presence of SD-OCT artifacts caused by segmentation or acquisition errors can limit the diagnostic ability of GCC analysis, and the segmentation artifacts were considered the most frequent in both healthy and glaucoma patients.39
Other factors might influence the interpretation of GCC results; in particular, the epiretinal membrane can cause errors in segmentation, but also retinal disorders and optic neuropathies can alter the GCC thickness. However, these conditions typically do not exhibit specific patterns of GCC damage, but it is important to consider other potential confounding influencing factors when interpreting GCC maps in glaucomatous eyes.55
Commercially available OCT devices have an integrated normative database limited to individuals aged 18 years or older, thus limiting their application in the pediatric population.56–58 The evaluation of glaucomatous damage in monitoring childhood glaucoma can be challenging in the future,59,60 even though children with glaucoma demonstrated decreased RNFL thickness and inner retina macular layers.61,62 The GCL-IPL values were found to be thicker in the pediatric population with respect to adults, confirming the necessity of using a pediatric reference database to avoid false estimation with the adult normative database.63,64
The Utility of Ganglion Cell Complex in Early Diagnosis and Glaucomatous Disease Progression
Macular Ganglion Cell Complex in Preperimetric Glaucoma
In cadaveric eyes of glaucoma patients, it has been estimated that 20% of RGCs loss corresponded to a 5 dB decrease in sensitivity in the central 30 degrees, and likewise an RGCs loss of 40% was associated with a 10 dB decrease in sensitivity.13 Macular GCC parameters are theoretically superior over peripapillary RNFL parameters in early diagnosis because it has been experimentally demonstrated that the RGCs abnormalities precede the axonal loss.32,45
The GCC thickness was significantly affected in eyes with RNFL defects and normal SAP. In particular, the superior GCC thickness presented predictive value similar to that of peripapillary RNFL and optic nerve head (horizontal cup: disc ratio).11,12
The most informative OCT parameters in differentiating preperimetric glaucoma included GCC average thickness, inferior quadrant RNFL thickness, inferior GCC thickness and superior GCC thickness.11,65,66 Kim et al45 suggested that GCC thickness appeared to be a better diagnostic biomarker for early glaucoma than did RNFL thickness. Moreover, the OCT-derived macular GCC parameters exhibited high sensitivity in differentiating glaucomatous from normal eyes. In particular, the GLV predicted preperimetric glaucoma (odds ratio [OR]:1.74) and early glaucoma (OR = 1.22), and the FLV demonstrated greater predictive value in detecting advanced glaucoma (OR = 2.32).67 In addition, Naghizadeh et al68 hypothesized that pattern-derived GCC parameters (i.e., GLV and FLV) were better able to detect early structural glaucomatous changes with respect to other GCC parameters in addition to RNFL thickness and optic nerve head analysis.
Comparing the ability of GCC in detecting early glaucoma with respect to other OCT parameters, the area under the curve (AUC) was significantly higher in the GCC-related thicknesses than in the corresponding GCL/IPL or RNFL thicknesses.69,70 Other studies reported similar diagnostic ability of the GCC and GCL/IPL parameters in discriminating early glaucomatous changes, comparable with the peripapillary RNFL thickness.38,40
Sectorial GCC parameters with the highest AUCs for discriminating between healthy and glaucomatous eyes using Cirrus SD-OCT included infero-temporal, inferior and supero-temporal sectors in addition to the average GCC.40 Furthermore, both minimal and inferior GCIPL thicknesses demonstrated satisfactory AUC (> 0.80), supporting their potential role as biomarkers for glaucoma screening.71 Likewise, macular parameters (GCL+IPL and GCC) and peripapillary RNFL obtained by 3D-OCT exhibited similar diagnostic accuracy in detecting preperimetric glaucoma.72
Regarding the posterior pole asymmetrical analysis provided by the Spectralis software, a retinal thickness asymmetry between hemifields occupying the nasal macular area has been demonstrated, suggesting a possible role for diagnosing early glaucoma.44
By comparing different SD-OCT devices (RTVue, Cirrus and 3D-OCT), the diagnostic performance of the average GCC thickness in diagnosing early and all stages of glaucoma was similar among the SD-OCT devices. However, RTVue exhibited better AUC for the superior hemifield GCC thickness with respect to either Cirrus and 3D-OCT, likely due to differences in the scanning protocols.38
Recently, associations between localized functional defects and GCC thickness have been reported in eyes with ocular hypertension and glaucoma.73 Cluster-based trend analysis of computerized visual field, using a dedicated software (EyeSuite, Octopus perimetry, Haag-Streit, Switzerland), allows for testing specific sectors grouped along nerve fiber bundles.74 Eyes with a normal visual field (VF) but abnormal GCC thickness exhibited the best correspondence between cluster analysis VF and GCC defects (100%). Although the purpose of this study was to demonstrate the usefulness of VF cluster analysis in discriminating early focal glaucomatous defects, it also confirmed the ability of GCC to predict early-stage glaucoma before the VF global indexes (mean defect, MD and loss of variance, LV) are altered.73
Functional Correlates of GCC Loss in Perimetric Glaucoma
The diagnostic ability of GCC in advanced glaucoma may be inferior to RNFL parameters because only 50% of the RGCs occupy the macular region.45 However, both RNFL and GCC thickness demonstrated a similar ability to diagnose moderate and severe glaucoma, defined according to the modified Hodapp-Anderson-Parrish grading scale.45,75 The best GCC parameters for detecting perimetric glaucoma were average GCC thickness and inferior GCC thickness.18,76,77
The regional assessment of the macular inner retinal layer using 3D-OCT-2000 has been considered a better indicator of paracentral scotoma than peripapillary RNFL parameters.48
In glaucomatous eyes, either GCC or RNFL parameters significantly correlated with retinal mean sensitivity, offering a structure-functional relationship. The GCC thickness offered the best correlation with the retinal sensitivities within the central 10° of the macula, whereas the RNFL correlated with only the periphery of the central 10° after adjusting for RGCs displacement.78
The most common SAP test protocol in glaucomatous eyes included the 24-2 or 30-2 protocols of the Humphrey Field Analyzer (Zeiss, Inc), in which the test points are spaced 6° apart.79,80 However, given the RGCs bodies displacement from their receptive fields in the macular region, such VF test patterns failed to accurately demonstrate a direct relationship between VF defects and RGCs damage to the macula.79,81–83 In this regard, the use of a 10–2 test with a 2° grid and considering the RGCs displacement demonstrated a better agreement between RGCs thinning and VF damage.79,81–84
The RGCs damage most severely involved the inferior retina (superior visual field), which projected to the macular vulnerability zone located in the inferior quadrant of the optic disc.79,81,84 Furthermore, a small centrocecal region of the inferior macula and all the superior macula (inferior VF) projected to the temporal quadrant, which was found to be less vulnerable to glaucomatous damage.79,81 Beyond the deep and localized damage involving the macular vulnerability zone, a diffuse and shallow defect can be identified with a widespread loss of 10–2 sensitivity associated with thinning of macular RGCs and RNFL.85
The quantitative structure-function relationship between GCL/IPL thickness and visual sensitivity markedly decreased by approximately outside 6° of the VF (corresponding to ~7.2° on the retina), likely due to the physiological thinning of the GCL/IPL layer in the more peripheral regions of the macula.82
Predictive GCC Parameters of Visual Field Progression
Advanced imaging for glaucoma study (AIGS) demonstrated that the focal loss of GCC was the strongest single predictor for VF progression (hazard ratio: 3.1), followed by the focal loss of peripapillary RNFL. The combination of GCC focal loss with age and central corneal thickness, constituting a composite index called the “Glaucoma composite progression index,” increased the predictive value for disease progression. More interestingly, intraocular pressure and VF parameters were not found to be significant predictors in the multivariate model.10
In the most recent AIGS, the focal loss of RNFL and GCC were both considered the strongest OCT predictors for glaucoma progression, with superiority of the RNFL FLV index. However, the detection of RNFL-FLV is not available in current commercial devices, making the GCC-FLV the most important predictor for glaucomatous disease. The VF progression was estimated using the MD and VF index, considering VF rapid progression an MD slope > −0.5 dB/year or VF index >−1%/year.86 In addition, the inferior GCC thickness was found to be significantly thinner in the fast progression group with respect to slow progressors.87
Progressive structural changes in RNFL and GCC thicknesses should be interpreted also considering the age-related loss of RGCs, as previously reported.68,88–91 It has been estimated that the mean age-related rate of GCL+IPL loss was −0.318 μm/year, whereas the inner retina (i.e., from the inner RNFL boundary to the outer IPL boundary) decreased by −0.245 μm/year. After accounting for age-related changes, the rate of progression decreased from 50% to 14.7% for the GCL+IPL thickness and from 50% to 20% for the inner retinal thickness.90 Medeiros et al92 estimated rates of RGCs loss in progressive glaucoma by interpolating structural and functional parameters. The percent rate of RCG loss was −4.4%/year in eyes exhibiting faster RGC loss than the expected age-related decline. The percentage of eyes with faster RGC loss was higher (22.1%) than those progressing based on OCT average thickness (14.6%) or VF (8.5%).
Specific Patterns of Macular Ganglion Cell Complex Alterations
Macular GCC in Primary Open-Angle Glaucoma and Normal Tension Glaucoma
Most studies conducted on macular GCC alterations in glaucomatous eyes considered primary open-angle glaucoma (POAG).10,68,93–95 The GCC thickness gradually decreased, according to the severity of POAG, with widening preexisting defects.95,96
In addition, some reports aimed to identify GCC structural parameters potentially able to discriminate between normal tension glaucoma (NTG) and POAG.24,97,98 The hypothesis of a different pattern of macular GCC loss was initially supported by the evidence of deeper and closer-to-fixation scotomas in the NTG with respect to POAG.99
The peripapillary RNFL demonstrated strong correlation with mGCC thickness in both early-stage NTG and with a VF defect.98 Comparison of the NTG and POAG groups revealed that the POAG group presented lower parameters in both RFNL and macular GCC thickness with respect to the NTG subgroup.97,100 More interestingly, the GLV parameter was significantly higher in the POAG subgroup. Considering these evidences together identified that the GCC loss was more diffuse in the POAG, with a more prominent difference than peripapillary RNFL, and the mean GCC measurements and GLV represented the most important parameters in discriminating between POAG and NTG.97
Recently, Edlinger et al101 reported data on structural parameters in NTG and high-tension glaucoma with perimetric and preperimetric glaucoma. Eyes with high-tension glaucoma presented a more pronounced loss in thickness for all the parameters considered (peripapillary RNFL, and macular RNFL, GCL, IPL and GCC). Global RNFL, macular inner temporal GCL, outer temporal GCC, outer inferior RNFL and inner temporal IPL presented the highest sensitivities for discriminating perimetric glaucoma. Moreover, peripapillary RNFL and macular inner temporal GCL, outer inferior GCC, outer inferior RNFL and inner temporal IPL achieved the highest sensitivities for preperimetric glaucoma.
Diagnostic Ability of GCC to Detect Glaucoma in Highly Myopic Eyes
The diagnosis of glaucoma in highly myopic eyes can be challenging considering the optic disc and retina are deformed due to elongation of the eye.102 In addition, myopia is considered a risk factor for the development of glaucoma, but it remains controversial whether myopic eyes progress more quickly than emmetropic eyes.103–108
Macular GCC thickness was reported to be comparable or superior to the RNFL evaluation in the assessment of glaucoma in highly myopic patients.53,109–112
The diagnostic parameters with the largest AUC for the detection of glaucomatous eyes among myopic patients was GLV (AUC: 0.957), which performed significantly better than the cup/disc vertical (AUC = 0.844) and the RNFL vertical (AUC = 0.826), as reported by Shoji et al53. Furthermore, considering that the average GCC demonstrated 0.968 specificity at 80% sensitivity, it has been hypothesized that it could be considered one of the best parameters for glaucoma detection in highly myopic eyes.
The diagnostic performances of GCC and peripapillary RNFL in detecting glaucomatous damage in highly myopic eyes were similar among the various OCT devices (Cirrus, RTVue and 3D OCT).111
Other OCT parameters found to be effective in discriminating between normal and glaucomatous eyes were inferior GCC thickness among highly myopic patients and FLV in the non-myopic subgroup.110
Conclusion
Glaucoma is characterized by the progressive loss of RGCs and their axons constituting the RNFL. The macular region contains more than 50% of RGCs easily estimable via commercially available OCT devices.
Experimental animal models demonstrated a loss of RGCs occupying the foveal region, similar to other peripheral retinal areas, further suggesting the importance of studying this region in glaucomatous eyes. Such models demonstrated also that the RGCs loss is nonuniformly distributed across the retina, and thus, an understanding of the location and cellular types susceptible to glaucomatous damage may help in developing more accurate biomarkers in human eyes.
A significant reduction of RGCs can be appreciated before the VF defect becomes detectable. The GCC parameters (i.e., mean thickness, GLV, FLV, superior and inferior thickness) are superior in discriminating early glaucomatous changes compared with RNFL thickness, since it has been experimentally demonstrated that the RGC dysfunction occurs earlier than does RNFL thinning.
Macular GCC parameters can also be considered important prognostic indicators in cases of non-glaucomatous RNFL thinning characterizing, for instance, highly myopic eyes.
The diagnostic accuracy of GCC analysis increases with disease severity, but it is also directly related to an increase in signal strength values.
An additional point to consider when using GCC analysis is the relationship between GCC thinning and VF damage. Considering the anatomical RGCs displacement, the conventional SAP protocol has resulted in inaccurately mapping the macular glaucomatous damage. In this regard, the use of the 10–2 test appears to demonstrate greater structural-functional agreement. Despite this, the derived parameter of focal GCC loss (i.e., FLV) represents the strongest predictor of VF progression in glaucomatous eyes. In conclusion, the estimation of glaucoma-induced RGCs loss by using GCC parameters represents an ideal predictor in assessing early glaucoma and offers a more accurate tracking of glaucoma progression.
Disclosure
The authors report no conflicts of interest in this work.
References
1. Alqawlaq S, Flanagan JG, Sivak JM. All roads lead to glaucoma: induced retinal injury cascades contribute to a common neurodegenerative outcome. Exp Eye Res. 2019;183:88–97. doi:10.1016/j.exer.2018.11.005
2. Sivak JM. The aging eye: common degenerative mechanisms between the Alzheimer’s brain and retinal disease. Invest Ophthalmol Vis Sci. 2013;54(1):871–880. doi:10.1167/iovs.12-10827
3. Delgado MF, Nguyen NT, Cox TA, et al. Automated perimetry: a report by the American Academy of Ophthalmology. Ophthalmology. 2002;109(12):2362–2374. doi:10.1016/S0161-6420(02)01726-8
4. Iester M, Capris E, De Feo F, et al. Agreement to detect glaucomatous visual field progression by using three different methods: a multicentre study. Br J Ophthalmol. 2011;95(9):1276–1283. doi:10.1136/bjo.2010.189456
5. Rao HL, Kumar AU, Babu JG, Senthil S, Garudadri CS. Relationship between severity of visual field loss at presentation and rate of visual field progression in glaucoma. Ophthalmology. 2011;118(2):249–253. doi:10.1016/j.ophtha.2010.05.027
6. Scuderi GL, Cesareo M, Perdicchi A, Recupero SM. Standard automated perimetry and algorithms for monitoring glaucoma progression. Glaucoma. 2008;173:77–99.
7. Perdicchi A, Abdolrahimzadeh S, Cutini A, Ciarnella A, Scuderi GL. Evaluation of the progression of visual field damage in patients suffering from early manifest glaucoma. Clin Ophthalmol. 2016;10:1647–1651. doi:10.2147/OPTH.S113995
8. Kerrigan-Baumrind LA, Quigley HA, Pease ME, Kerrigan DF, Mitchell RS. Number of ganglion cells in glaucoma eyes compared with threshold visual field tests in the same persons. Invest Ophthalmol Vis Sci. 2000;41(3):741–748.
9. Medeiros FA, Lisboa R, Weinreb RN, Liebmann JM, Girkin C, Zangwill LM. Retinal ganglion cell count estimates associated with early development of visual field defects in glaucoma. Ophthalmology. 2013;120(4):736–744. doi:10.1016/j.ophtha.2012.09.039
10. Zhang X, Loewen N, Tan O, et al. Predicting development of glaucomatous visual field conversion using baseline fourier-domain optical coherence tomography. Am J Ophthalmol. 2016;163:29–37. doi:10.1016/j.ajo.2015.11.029
11. Na JH, Lee K, Lee JR, Baek S, Yoo SJ, Kook MS. Detection of macular ganglion cell loss in preperimetric glaucoma patients with localized retinal nerve fibre defects by spectral-domain optical coherence tomography. Clin Exp Ophthalmol. 2013;41(9):870–880. doi:10.1111/ceo.2013.41.issue-9
12. Takagi ST, Kita Y, Yagi F, Tomita G. Macular retinal ganglion cell complex damage in the apparently normal visual field of glaucomatous eyes with hemifield defects. J Glaucoma. 2012;21(5):318–325. doi:10.1097/IJG.0b013e31820d7e9d
13. Quigley HA, Dunkelberger GR, Green WR. Retinal ganglion cell atrophy correlated with automated perimetry in human eyes with glaucoma. Am J Ophthalmol. 1989;107(5):453–464. doi:10.1016/0002-9394(89)90488-1
14. Leung CK, Liu S, Weinreb RN, et al. Evaluation of retinal nerve fiber layer progression in glaucoma a prospective analysis with neuroretinal rim and visual field progression. Ophthalmology. 2011;118(8):1551–1557. doi:10.1016/j.ophtha.2010.12.035
15. Leung CK, Chan WM, Yung WH, et al. Comparison of macular and peripapillary measurements for the detection of glaucoma: an optical coherence tomography study. Ophthalmology. 2005;112(3):391–400. doi:10.1016/j.ophtha.2004.10.020
16. Medeiros FA, Zangwill LM, Bowd C, Vessani RM, Susanna R
17. Di Staso S, Agnifili L, Di Staso F, Climastone H, Ciancaglini M, Scuderi GL. Diagnostic capability of optic nerve head rim width and retinal nerve fiber thickness in open-angle glaucoma. Eur J Ophthalmol. 2018;28(4):459–464. doi:10.1177/1120672117750057
18. Tan O, Chopra V, Lu AT, et al. Detection of macular ganglion cell loss in glaucoma by Fourier-domain optical coherence tomography. Ophthalmology. 2009;116(12):
19. Ishikawa H, Stein DM, Wollstein G, Beaton S, Fujimoto JG, Schuman JS. Macular segmentation with optical coherence tomography. Invest Ophthalmol Vis Sci. 2005;46(6):2012–2017. doi:10.1167/iovs.04-0335
20. Tan O, Li G, Lu AT, Varma R, Huang D. Advanced imaging for glaucoma study G. Mapping of macular substructures with optical coherence tomography for glaucoma diagnosis. Ophthalmology. 2008;115(6):949–956. doi:10.1016/j.ophtha.2007.08.011
21. Greenfield DS, Bagga H, Knighton RW. Macular thickness changes in glaucomatous optic neuropathy detected using optical coherence tomography. Arch Ophthalmol. 2003;121(1):41–46. doi:10.1001/archopht.121.1.41
22. Zeimer R, Asrani S, Zou S, Quigley H, Jampel H. Quantitative detection of glaucomatous damage at the posterior pole by retinal thickness mapping. A pilot study. Ophthalmology. 1998;105(2):224–231. doi:10.1016/S0161-6420(98)92743-9
23. Ojima T, Tanabe T, Hangai M, Yu S, Morishita S, Yoshimura N. Measurement of retinal nerve fiber layer thickness and macular volume for glaucoma detection using optical coherence tomography. Jpn J Ophthalmol. 2007;51(3):197–203. doi:10.1007/s10384-006-0433-y
24. Khanal S, Davey PG, Racette L, Thapa M. Comparison of retinal nerve fiber layer and macular thickness for discriminating primary open-angle glaucoma and normal-tension glaucoma using optical coherence tomography. Clin Exp Optom. 2016;99(4):373–381. doi:10.1111/cxo.12366
25. Curcio CA, Allen KA. Topography of ganglion cells in human retina. J Comp Neurol. 1990;300(1):5–25. doi:10.1002/(ISSN)1096-9861
26. Conradi N, Sjostrand J. A morphometric and stereologic analysis of ganglion cells of the central human retina. Graefes Arch Clin Exp Ophthalmol. 1993;231(3):169–174. doi:10.1007/BF00920942
27. Drasdo N, Millican CL, Katholi CR, Curcio CA. The length of Henle fibers in the human retina and a model of ganglion receptive field density in the visual field. Vision Res. 2007;47(22):2901–2911. doi:10.1016/j.visres.2007.01.007
28. Marshall J, Hamilton AM, Bird AC. Histopathology of ruby and argon laser lesions in monkey and human retina. A comparative study. Br J Ophthalmol. 1975;59(11):610–630. doi:10.1136/bjo.59.11.610
29. Feng L, Zhao Y, Yoshida M, et al. Sustained ocular hypertension induces dendritic degeneration of mouse retinal ganglion cells that depends on cell type and location. Invest Ophthalmol Vis Sci. 2013;54(2):1106–1117. doi:10.1167/iovs.12-10791
30. McKinnon SJ, Schlamp CL, Nickells RW. Mouse models of retinal ganglion cell death and glaucoma. Exp Eye Res. 2009;88(4):816–824. doi:10.1016/j.exer.2008.12.002
31. Schlamp CL, Li Y, Dietz JA, Janssen KT, Nickells RW. Progressive ganglion cell loss and optic nerve degeneration in DBA/2J mice is variable and asymmetric. BMC Neurosci. 2006;7:66. doi:10.1186/1471-2202-7-66
32. Fortune B, Cull GA, Burgoyne CF. Relative course of retinal nerve fiber layer birefringence and thickness and retinal function changes after optic nerve transection. Invest Ophthalmol Vis Sci. 2008;49(10):4444–4452. doi:10.1167/iovs.08-2255
33. Glovinsky Y, Quigley HA, Pease ME. Foveal ganglion cell loss is size dependent in experimental glaucoma. Invest Ophthalmol Vis Sci. 1993;34(2):395–400.
34. Desatnik H, Quigley HA, Glovinsky Y. Study of central retinal ganglion cell loss in experimental glaucoma in monkey eyes. J Glaucoma. 1996;5(1):46–53. doi:10.1097/00061198-199602000-00008
35. Glovinsky Y, Quigley HA, Dunkelberger GR. Retinal ganglion cell loss is size dependent in experimental glaucoma. Invest Ophthalmol Vis Sci. 1991;32(3):484–491.
36. Vidal-Sanz M, Salinas-Navarro M, Nadal-Nicolas FM, et al. Understanding glaucomatous damage: anatomical and functional data from ocular hypertensive rodent retinas. Prog Retin Eye Res. 2012;31(1):1–27. doi:10.1016/j.preteyeres.2011.08.001
37. Agudo-Barriuso M, Villegas-Perez MP, de Imperial JM, Vidal-Sanz M. Anatomical and functional damage in experimental glaucoma. Curr Opin Pharmacol. 2013;13(1):5–11. doi:10.1016/j.coph.2012.09.006
38. Akashi A, Kanamori A, Nakamura M, Fujihara M, Yamada Y, Negi A. Comparative assessment for the ability of Cirrus, RTVue, and 3D-OCT to diagnose glaucoma. Invest Ophthalmol Vis Sci. 2013;54(7):4478–4484. doi:10.1167/iovs.12-11268
39. Verticchio Vercellin AC, Jassim F, Poon LY, et al. Diagnostic capability of three-dimensional macular parameters for glaucoma using optical coherence tomography volume scans. Invest Ophthalmol Vis Sci. 2018;59(12):4998–5010. doi:10.1167/iovs.18-23813
40. Kotowski J, Folio LS, Wollstein G, et al. Glaucoma discrimination of segmented cirrus spectral domain optical coherence tomography (SD-OCT) macular scans. Br J Ophthalmol. 2012;96(11):1420–1425. doi:10.1136/bjophthalmol-2011-301021
41. Hwang YH, Jeong YC, Kim HK, Sohn YH. Macular ganglion cell analysis for early detection of glaucoma. Ophthalmology. 2014;121(8):1508–1515. doi:10.1016/j.ophtha.2014.02.019
42. Nakanishi H, Akagi T, Hangai M, et al. Sensitivity and specificity for detecting early glaucoma in eyes with high myopia from normative database of macular ganglion cell complex thickness obtained from normal non-myopic or highly myopic Asian eyes. Graefes Arch Clin Exp Ophthalmol. 2015;253(7):1143–1152. doi:10.1007/s00417-015-3026-y
43. Asrani S, Rosdahl JA, Allingham RR. Novel software strategy for glaucoma diagnosis: asymmetry analysis of retinal thickness. Arch Ophthalmol. 2011;129(9):1205–1211. doi:10.1001/archophthalmol.2011.242
44. Yamashita T, Sakamoto T, Kakiuchi N, Tanaka M, Kii Y, Nakao K. Posterior pole asymmetry analyses of retinal thickness of upper and lower sectors and their association with peak retinal nerve fiber layer thickness in healthy young eyes. Invest Ophthalmol Vis Sci. 2014;55(9):5673–5678. doi:10.1167/iovs.13-13828
45. Kim NR, Lee ES, Seong GJ, Kim JH, An HG, Kim CY. Structure-function relationship and diagnostic value of macular ganglion cell complex measurement using Fourier-domain OCT in glaucoma. Invest Ophthalmol Vis Sci. 2010;51(9):4646–4651. doi:10.1167/iovs.09-5053
46. Sull AC, Vuong LN, Price LL, et al. Comparison of spectral/Fourier domain optical coherence tomography instruments for assessment of normal macular thickness. Retina. 2010;30(2):235–245. doi:10.1097/IAE.0b013e3181bd2c3b
47. Mwanza JC, Oakley JD, Budenz DL, Chang RT, Knight OJ, Feuer WJ. Macular ganglion cell-inner plexiform layer: automated detection and thickness reproducibility with spectral domain-optical coherence tomography in glaucoma. Invest Ophthalmol Vis Sci. 2011;52(11):8323–8329. doi:10.1167/iovs.11-7962
48. Lee J, Hangai M, Kimura Y, Takayama K, Kee C, Yoshimura N. Measurement of macular ganglion cell layer and circumpapillary retinal nerve fiber layer to detect paracentral scotoma in early glaucoma. Graefes Arch Clin Exp Ophthalmol. 2013;251(8):2003–2012. doi:10.1007/s00417-013-2344-1
49. Ooto S, Hangai M, Takayama K, et al. High-resolution imaging of the photoreceptor layer in epiretinal membrane using adaptive optics scanning laser ophthalmoscopy. Ophthalmology. 2011;118(5):873–881. doi:10.1016/j.ophtha.2010.08.032
50. Rao HL, Leite MT, Weinreb RN, et al. Effect of disease severity and optic disc size on diagnostic accuracy of RTVue spectral domain optical coherence tomograph in glaucoma. Invest Ophthalmol Vis Sci. 2011;52(3):1290–1296. doi:10.1167/iovs.10-5546
51. Rao HL, Addepalli UK, Yadav RK, Senthil S, Choudhari NS, Garudadri CS. Effect of scan quality on diagnostic accuracy of spectral-domain optical coherence tomography in glaucoma. Am J Ophthalmol. 2014;157(3):719–727 e711. doi:10.1016/j.ajo.2013.12.012
52. Garas A, Vargha P, Hollo G. Reproducibility of retinal nerve fiber layer and macular thickness measurement with the RTVue-100 optical coherence tomograph. Ophthalmology. 2010;117(4):738–746. doi:10.1016/j.ophtha.2009.08.039
53. Shoji T, Sato H, Ishida M, Takeuchi M, Chihara E. Assessment of glaucomatous changes in subjects with high myopia using spectral domain optical coherence tomography. Invest Ophthalmol Vis Sci. 2011;52(2):1098–1102. doi:10.1167/iovs.10-5922
54. Ooto S, Hangai M, Tomidokoro A, et al. Effects of age, sex, and axial length on the three-dimensional profile of normal macular layer structures. Invest Ophthalmol Vis Sci. 2011;52(12):8769–8779. doi:10.1167/iovs.11-8388
55. Hwang YH. Patterns of macular ganglion cell abnormalities in various ocular conditions. Invest Ophthalmol Vis Sci. 2014;55(6):3995–3996. doi:10.1167/iovs.14-14438
56. Altemir I, Pueyo V, Elia N, Polo V, Larrosa JM, Oros D. Reproducibility of optical coherence tomography measurements in children. Am J Ophthalmol. 2013;155(1):171–176 e171. doi:10.1016/j.ajo.2012.06.012
57. Yanni SE, Wang J, Cheng CS, et al. Normative reference ranges for the retinal nerve fiber layer, macula, and retinal layer thicknesses in children. Am J Ophthalmol. 2013;155(2):354–360 e351. doi:10.1016/j.ajo.2012.08.010
58. Barrio-Barrio J, Noval S, Galdos M, et al. Multicenter Spanish study of spectral-domain optical coherence tomography in normal children. Acta Ophthalmol. 2013;91(1):e56–63. doi:10.1111/j.1755-3768.2012.02562.x
59. Scuderi G, Iacovello D, Pranno F, Plateroti P, Scuderi L. Pediatric glaucoma: a literature’s review and analysis of surgical results. Biomed Res Int. 2015;2015:393670. doi:10.1155/2015/393670
60. El-Dairi M. Optical coherence tomography in the management of congenital glaucoma. Br J Ophthalmol. 2014;98(2):149–150. doi:10.1136/bjophthalmol-2013-303723
61. Morales-Fernandez L, Jimenez-Santos M, Martinez-de-la-Casa JM, et al. Diagnostic capacity of SD-OCT segmented ganglion cell complex versus retinal nerve fiber layer analysis for congenital glaucoma. Eye (Lond). 2018;32(8):1338–1344. doi:10.1038/s41433-018-0077-4
62. Silverstein E, Freedman S, Zehil GP, Jiramongkolchai K, El-Dairi M. The macula in pediatric glaucoma: quantifying the inner and outer layers via optical coherence tomography automatic segmentation. J AAPOS. 2016;20(4):332–336. doi:10.1016/j.jaapos.2016.05.013
63. Munoz-Gallego A, De la Cruz J, Rodriguez-Salgado M, et al. Assessment of macular ganglion cell complex using optical coherence tomography: impact of a paediatric reference database in clinical practice. Clin Exp Ophthalmol. 2019;47(4):490–497. doi:10.1111/ceo.13418
64. Totan Y, Guragac FB, Guler E. Evaluation of the retinal ganglion cell layer thickness in healthy Turkish children. J Glaucoma. 2015;24(5):e103–e108. doi:10.1097/IJG.0000000000000168
65. Lisboa R, Paranhos A
66. Rao HL, Addepalli UK, Chaudhary S, et al. Ability of different scanning protocols of spectral domain optical coherence tomography to diagnose preperimetric glaucoma. Invest Ophthalmol Vis Sci. 2013;54(12):7252–7257. doi:10.1167/iovs.13-12731
67. Arintawati P, Sone T, Akita T, Tanaka J, Kiuchi Y. The applicability of ganglion cell complex parameters determined from SD-OCT images to detect glaucomatous eyes. J Glaucoma. 2013;22(9):713–718. doi:10.1097/IJG.0b013e318259b2e1
68. Naghizadeh F, Garas A, Vargha P, Hollo G. Detection of early glaucomatous progression with different parameters of the RTVue optical coherence tomograph. J Glaucoma. 2014;23(4):195–198. doi:10.1097/IJG.0b013e31826a9707
69. Nakatani Y, Higashide T, Ohkubo S, Sugiyama K. Influences of the inner retinal sublayers and analytical areas in macular scans by spectral-domain OCT on the diagnostic ability of early glaucoma. Invest Ophthalmol Vis Sci. 2014;55(11):7479–7485. doi:10.1167/iovs.14-15530
70. Cennamo G, Montorio D, Romano MR, et al. Structure-functional parameters in differentiating between patients with different degrees of glaucoma. J Glaucoma. 2016;25(10):e884–e888. doi:10.1097/IJG.0000000000000491
71. Koh V, Tham YC, Cheung CY, et al. Diagnostic accuracy of macular ganglion cell-inner plexiform layer thickness for glaucoma detection in a population-based study: comparison with optic nerve head imaging parameters. PLoS One. 2018;13(6):e0199134. doi:10.1371/journal.pone.0199134
72. Kim YJ, Kang MH, Cho HY, Lim HW, Seong M. Comparative study of macular ganglion cell complex thickness measured by spectral-domain optical coherence tomography in healthy eyes, eyes with preperimetric glaucoma, and eyes with early glaucoma. Jpn J Ophthalmol. 2014;58(3):244–251. doi:10.1007/s10384-014-0315-7
73. Perdicchi A, de Paula A, Sordi E, Scuderi G. Cluster analysis of computerized visual field and optical coherence tomography-ganglion cell complex defects in high intraocular pressure patients or early stage glaucoma. Eur J Ophthalmol. 2019;1120672119841774.
74. Aoki S, Murata H, Fujino Y, et al. Investigating the usefulness of a cluster-based trend analysis to detect visual field progression in patients with open-angle glaucoma. Br J Ophthalmol. 2017;101(12):1658–1665. doi:10.1136/bjophthalmol-2016-310069
75. Budenz DL, Rhee P, Feuer WJ, McSoley J, Johnson CA, Anderson DR. Comparison of glaucomatous visual field defects using standard full threshold and Swedish interactive threshold algorithms. Arch Ophthalmol. 2002;120(9):1136–1141. doi:10.1001/archopht.120.9.1136
76. Rao HL, Zangwill LM, Weinreb RN, Sample PA, Alencar LM, Medeiros FA. Comparison of different spectral domain optical coherence tomography scanning areas for glaucoma diagnosis. Ophthalmology. 2010;117(9):1692–1699, 1699 e1691. doi:10.1016/j.ophtha.2010.01.031
77. Huang JY, Pekmezci M, Mesiwala N, Kao A, Lin S. Diagnostic power of optic disc morphology, peripapillary retinal nerve fiber layer thickness, and macular inner retinal layer thickness in glaucoma diagnosis with fourier-domain optical coherence tomography. J Glaucoma. 2011;20(2):87–94. doi:10.1097/IJG.0b013e3181d787b6
78. Ohkubo S, Higashide T, Udagawa S, et al. Focal relationship between structure and function within the central 10 degrees in glaucoma. Invest Ophthalmol Vis Sci. 2014;55(8):5269–5277. doi:10.1167/iovs.14-14153
79. Hood DC, Raza AS, de Moraes CG, Liebmann JM, Ritch R. Glaucomatous damage of the macula. Prog Retin Eye Res. 2013;32:1–21. doi:10.1016/j.preteyeres.2012.08.003
80. Scuderi GL, Cesareo M, Perdicchi A, Recupero SM. Standard automated perimetry and algorithms for monitoring glaucoma progression. Prog Brain Res. 2008;173:77–99.
81. Hood DC, Raza AS, de Moraes CG, Johnson CA, Liebmann JM, Ritch R. The nature of macular damage in glaucoma as revealed by averaging optical coherence tomography data. Transl Vis Sci Technol. 2012;1(1):3. doi:10.1167/tvst.1.1.3
82. Raza AS, Cho J, de Moraes CG, et al. Retinal ganglion cell layer thickness and local visual field sensitivity in glaucoma. Arch Ophthalmol. 2011;129(12):1529–1536. doi:10.1001/archophthalmol.2011.352
83. Turpin A, Chen S, Sepulveda JA, McKendrick AM. Customizing structure-function displacements in the macula for individual differences. Invest Ophthalmol Vis Sci. 2015;56(10):5984–5989. doi:10.1167/iovs.15-17384
84. Hood DC, Raza AS, de Moraes CG, et al. Initial arcuate defects within the central 10 degrees in glaucoma. Invest Ophthalmol Vis Sci. 2011;52(2):940–946. doi:10.1167/iovs.10-5803
85. Hood DC, Slobodnick A, Raza AS, de Moraes CG, Teng CC, Ritch R. Early glaucoma involves both deep local, and shallow widespread, retinal nerve fiber damage of the macular region. Invest Ophthalmol Vis Sci. 2014;55(2):632–649. doi:10.1167/iovs.13-13130
86. Zhang X, Parrish RK
87. Anraku A, Enomoto N, Takeyama A, Ito H, Tomita G. Baseline thickness of macular ganglion cell complex predicts progression of visual field loss. Graefes Arch Clin Exp Ophthalmol. 2014;252(1):109–115. doi:10.1007/s00417-013-2527-9
88. Sung KR, Wollstein G, Bilonick RA, et al. Effects of age on optical coherence tomography measurements of healthy retinal nerve fiber layer, macula, and optic nerve head. Ophthalmology. 2009;116(6):1119–1124. doi:10.1016/j.ophtha.2009.01.004
89. Vianna JR, Danthurebandara VM, Sharpe GP, et al. Importance of normal aging in estimating the rate of glaucomatous neuroretinal rim and retinal nerve fiber layer loss. Ophthalmology. 2015;122(12):2392–2398. doi:10.1016/j.ophtha.2015.08.020
90. Leung CKS, Ye C, Weinreb RN, Yu M, Lai G, Lam DS. Impact of age-related change of retinal nerve fiber layer and macular thicknesses on evaluation of glaucoma progression. Ophthalmology. 2013;120(12):2485–2492. doi:10.1016/j.ophtha.2013.07.021
91. Harwerth RS, Wheat JL, Rangaswamy NV. Age-related losses of retinal ganglion cells and axons. Invest Ophthalmol Vis Sci. 2008;49(10):4437–4443. doi:10.1167/iovs.08-1753
92. Medeiros FA, Zangwill LM, Anderson DR, et al. Estimating the rate of retinal ganglion cell loss in glaucoma. Am J Ophthalmol. 2012;154(5):814–824 e811. doi:10.1016/j.ajo.2012.04.022
93. Cho JW, Sung KR, Lee S, et al. Relationship between visual field sensitivity and macular ganglion cell complex thickness as measured by spectral-domain optical coherence tomography. Invest Ophthalmol Vis Sci. 2010;51(12):6401–6407. doi:10.1167/iovs.09-5035
94. Zhang X, Dastiridou A, Francis BA, et al. Baseline fourier-domain optical coherence tomography structural risk factors for visual field progression in the advanced imaging for glaucoma study. Am J Ophthalmol. 2016;172:94–103. doi:10.1016/j.ajo.2016.09.015
95. Shin HY, Park HY, Jung KI, Park CK. Comparative study of macular ganglion cell-inner plexiform layer and peripapillary retinal nerve fiber layer measurement: structure-function analysis. Invest Ophthalmol Vis Sci. 2013;54(12):7344–7353. doi:10.1167/iovs.13-12667
96. Nakamura H, Hangai M, Mori S, Hirose F, Yoshimura N. Hemispherical focal macular photopic negative response and macular inner retinal thickness in open-angle glaucoma. Am J Ophthalmol. 2011;151(3):494–506 e491. doi:10.1016/j.ajo.2010.09.018
97. Kim NR, Hong S, Kim JH, Rho SS, Seong GJ, Kim CY. Comparison of macular ganglion cell complex thickness by Fourier-domain OCT in normal tension glaucoma and primary open-angle glaucoma. J Glaucoma. 2013;22(2):133–139. doi:10.1097/IJG.0b013e3182254cde
98. Seong M, Sung KR, Choi EH, et al. Macular and peripapillary retinal nerve fiber layer measurements by spectral domain optical coherence tomography in normal-tension glaucoma. Invest Ophthalmol Vis Sci. 2010;51(3):1446–1452. doi:10.1167/iovs.09-4258
99. Caprioli J, Spaeth GL. Comparison of visual field defects in the low-tension glaucomas with those in the high-tension glaucomas. Am J Ophthalmol. 1984;97(6):730–737. doi:10.1016/0002-9394(84)90505-1
100. Firat PG, Doganay S, Demirel EE, Colak C. Comparison of ganglion cell and retinal nerve fiber layer thickness in primary open-angle glaucoma and normal tension glaucoma with spectral-domain OCT. Graefes Arch Clin Exp Ophthalmol. 2013;251(3):831–838. doi:10.1007/s00417-012-2114-5
101. Edlinger FSM, Schrems-Hoesl LM, Mardin CY, Laemmer R, Kruse FE, Schrems WA. Structural changes of macular inner retinal layers in early normal-tension and high-tension glaucoma by spectral-domain optical coherence tomography. Graefes Arch Clin Exp Ophthalmol. 2018;256(7):1245–1256. doi:10.1007/s00417-018-3944-6
102. Samarawickrama C, Mitchell P, Tong L, et al. Myopia-related optic disc and retinal changes in adolescent children from singapore. Ophthalmology. 2011;118(10):2050–2057. doi:10.1016/j.ophtha.2011.02.040
103. Chihara E, Liu X, Dong J, et al. Severe myopia as a risk factor for progressive visual field loss in primary open-angle glaucoma. Ophthalmologica. 1997;211(2):66–71. doi:10.1159/000310760
104. Kim EK, Park HL, Park CK. Posterior scleral deformations around optic disc are associated with visual field damage in open-angle glaucoma patients with myopia. PLoS One. 2019;14(3):e0213714. doi:10.1371/journal.pone.0213714
105. Mitchell P, Hourihan F, Sandbach J, Wang JJ. The relationship between glaucoma and myopia: the blue mountains eye study. Ophthalmology. 1999;106(10):2010–2015. doi:10.1016/S0161-6420(99)90416-5
106. Perdicchi A, Iester M, Scuderi G, Amodeo S, Medori EM, Recupero SM. Visual field damage and progression in glaucomatous myopic eyes. Eur J Ophthalmol. 2007;17(4):534–537. doi:10.1177/112067210701700409
107. Xu L, Wang Y, Wang S, Wang Y, Jonas JB. High myopia and glaucoma susceptibility the Beijing eye study. Ophthalmology. 2007;114(2):216–220. doi:10.1016/j.ophtha.2006.06.050
108. Yanagisawa M, Yamashita T, Matsuura M, Fujino Y, Murata H, Asaoka R. Changes in axial length and progression of visual field damage in glaucoma. Invest Ophthalmol Vis Sci. 2018;59(1):407–417. doi:10.1167/iovs.17-22949
109. Wang WW, Wang HZ, Liu JR, et al. Diagnostic ability of ganglion cell complex thickness to detect glaucoma in high myopia eyes by Fourier domain optical coherence tomography. Int J Ophthalmol. 2018;11(5):791–796. doi:10.18240/ijo.2018.05.12
110. Kim NR, Lee ES, Seong GJ, et al. Comparing the ganglion cell complex and retinal nerve fibre layer measurements by Fourier domain OCT to detect glaucoma in high myopia. Br J Ophthalmol. 2011;95(8):1115–1121. doi:10.1136/bjo.2010.182493
111. Akashi A, Kanamori A, Ueda K, Inoue Y, Yamada Y, Nakamura M. The ability of SD-OCT to differentiate early glaucoma with high myopia from highly myopic controls and nonhighly myopic controls. Invest Ophthalmol Vis Sci. 2015;56(11):6573–6580. doi:10.1167/iovs.15-17635
112. Sezgin Akcay BI, Gunay BO, Kardes E, Unlu C, Ergin A. Evaluation of the ganglion cell complex and retinal nerve fiber layer in low, moderate, and high myopia: a study by RTVue spectral domain optical coherence tomography. Semin Ophthalmol. 2017;32(6):682–688. doi:10.3109/08820538.2016.1170157
 © 2020 The Author(s). This work is published and licensed by Dove Medical Press Limited. The
full terms of this license are available at https://www.dovepress.com/terms
and incorporate the Creative Commons Attribution
- Non Commercial (unported, 3.0) License.
By accessing the work you hereby accept the Terms. Non-commercial uses of the work are permitted
without any further permission from Dove Medical Press Limited, provided the work is properly
attributed. For permission for commercial use of this work, please see paragraphs 4.2 and 5 of our Terms.
© 2020 The Author(s). This work is published and licensed by Dove Medical Press Limited. The
full terms of this license are available at https://www.dovepress.com/terms
and incorporate the Creative Commons Attribution
- Non Commercial (unported, 3.0) License.
By accessing the work you hereby accept the Terms. Non-commercial uses of the work are permitted
without any further permission from Dove Medical Press Limited, provided the work is properly
attributed. For permission for commercial use of this work, please see paragraphs 4.2 and 5 of our Terms.