Back to Journals » Journal of Pain Research » Volume 11
Functional magnetic resonance imaging: cerebral function alterations in subthreshold and suprathreshold spinal cord stimulation
Authors De Groote S, De Jaeger M, Van Schuerbeek P, Sunaert S ![]() , Peeters R, Loeckx D, Goudman L
, Peeters R, Loeckx D, Goudman L ![]() , Forget P, De Smedt A, Moens M
, Forget P, De Smedt A, Moens M ![]()
Received 26 December 2017
Accepted for publication 2 July 2018
Published 24 October 2018 Volume 2018:11 Pages 2517—2526
DOI https://doi.org/10.2147/JPR.S160890
Checked for plagiarism Yes
Review by Single anonymous peer review
Peer reviewer comments 2
Editor who approved publication: Dr Erica Wegrzyn
Sander De Groote,1 Mats De Jaeger,1 Peter Van Schuerbeek,2 Stefan Sunaert,3 Ronald Peeters,3 Dirk Loeckx,4 Lisa Goudman,1,5 Patrice Forget,6 Ann De Smedt,7 Maarten Moens1,2,8
1Department of Neurosurgery, Universitair Ziekenhuis Brussel, Brussels, Belgium; 2Department of Radiology, Universitair Ziekenhuis Brussel, Brussels, Belgium; 3Department of Radiology, Universitair Ziekenhuis Leuven, Leuven, Belgium; 4COMETRIX, Leuven, Belgium; 5Pain in Motion International Research Group, Department of Physiotherapy, Human Physiology and Anatomy, Faculty of Physical Education and Physiotherapy, Vrije Universiteit Brussel, Brussel, Belgium; 6Department Anesthesiology, Universitair Ziekenhuis Brussel, Brussels, Belgium; 7Department of Neurology, Universitair Ziekenhuis Brussel, Brussels, Belgium; 8Center for Neurosciences (C4N), Vrije Universiteit Brussel (VUB), Brussels, Belgium
Background and purpose: Failed back surgery syndrome (FBSS) is a common and devastating chronic neuropathic pain disorder. Conventional spinal cord stimulation (SCS) applies electrical suprathreshold pulses to the spinal cord at a frequency of 40–60 Hz and relieves pain in FBSS patients. During the last decade, two major changes have emerged in the techniques of stimulating the spinal cord: paresthesia-free or subthreshold stimulation and administration of higher frequency or higher amounts of energy to the spinal cord. Despite the positive clinical results, the mechanism of action remains unclear. A functional MRI (fMRI) study was conducted to investigate the brain alterations during subthreshold and suprathreshold stimulation at different frequencies.
Methods: Ten subjects with FBSS, treated with externalized SCS, received randomly four different stimulation frequencies (4 Hz, 60 Hz, 500 Hz, and 1 kHz) during four consecutive days. At every frequency, the patient underwent sub- and suprathreshold stimulation. Cerebral activity was monitored and assessed using fMRI.
Results: Suprathreshold stimulation is generally accompanied with more activity than subthreshold SCS. Suprathreshold SCS resulted in increased bilateral activation of the frontal cortex, thalamus, pre- and postcentral gyri, basal ganglia, cingulate gyrus, insula, thalamus, and claustrum. We observed deactivation of the bilateral parahippocampus, amygdala, precuneus, posterior cingulate gyrus, postcentral gyrus, and unilateral superior temporal gyrus.
Conclusion: Suprathreshold stimulation resulted in greater activity (both activation and deactivation) of the frontal brain regions; the sensory, limbic, and motor cortices; and the diencephalon in comparison with subthreshold stimulation. Each type of frequency at suprathreshold stimulation was characterized by an individual activation pattern.
Keywords: spinal cord stimulation, fMRI, subthreshold, suprathreshold, frequency
Introduction
Failed back surgery syndrome (FBSS) is a clinical condition defined as an unsatisfying outcome of a patient who underwent spinal surgery, irrespective of type or intervention area, with persistent pain in the lumbosacral region with or without radiation to the leg.1 Despite the severe pain and paucity of treatment options, spinal cord stimulation (SCS) is an effective treatment option for FBSS.2,3
During the last decade, with the emergence of different stimulation paradigms, clinicians and researchers have proposed a variety of hypotheses about the mechanisms of action of SCS.4,5 From a clinical perspective, two different approaches entered daily practice: implanting the electrode base on 1) the anatomy (midline, with hotspot T9–T10) and 2) intraoperative stimulation covering the painful area with paresthesia.6–9 The thread that links both treatment strategies is the great interest in paresthesia-free stimulation10 –defined as subthreshold stimulation: the patient does not feel any directly linked sensory input from the stimulator (paresthesia), but the initial pain is reduced. Aside from high-frequency stimulation (HF10), both burst and high-density (HD) stimulation paradigms are based on intraoperative stimulation wherein pulse intensity is kept just below the sensory threshold. The overall idea is that a substantial current can be delivered to an axon without necessarily producing an action potential if the other parameters such as pulse width and frequency are optimized according to the strength duration curve.11
Several studies have been conducted to unravel the supraspinal effects of SCS in humans using hemodynamic (magnetic resonance spectroscopy, single-photon-emission computerized tomography, positron emission tomography and functional magnetic resonance imaging [fMRI]) and neuroelectrical imaging techniques (electroencephalography, transcranial magnetic stimulation, intracranial processing, and magnetoencephalography).12–18 In these hemodynamic studies, a range of activity across several regions of the “pain matrix”, closely associated with cognitive and emotional aspects of pain processing, has been found. However, there is currently a lack of consensus and comprehension with regard to the effect caused by SCS on the cortex.17
Clinical studies based on the conventional paradigm of paresthesia covering the painful area and basic research on rodent models showed the potential benefit of subthreshold SCS.19,20 However, in conventional SCS, the specific supraspinal effects between supra- and subthreshold SCS have not been thoroughly investigated in relation to different frequencies. The goals of this fMRI study are twofold:
- to identify the functional cerebral regions involved in short-term sub- and suprathreshold SCS in patients with FBSS.
- to report the results when using four frequency types (4 Hz, 60 Hz, 500 Hz, and 1 kHz) at supra- and subthreshold SCS.
Patients, methods, and material
All procedures performed in the studies involving human participants were in accordance with the ethical standards of the Ethics Committee of UZ Brussels (B.U.N. 143201733658). and with the 1964 Helsinki Declaration and its later amendments or comparable ethical standards.
Study population
Ten consecutive patients diagnosed with FBSS and eligible for SCS were included in this study. Patients were recruited, diagnosed, and selected at UZ Brussels. Inclusion criteria consisted of 1) FBSS with neuropathic pain in the back and/or legs, 2) age above 18 years, and 3) history of unsuccessful spinal surgery (Table 1). Patients were excluded from the study if they suffered from claustrophobia or had ferromagnetic implants. The study complied with the World Medical Association Declaration of Helsinki on ethics in medical research. The study protocol was approved by the Ethics Committee of UZ Brussels (B.U.N. 143201733658).
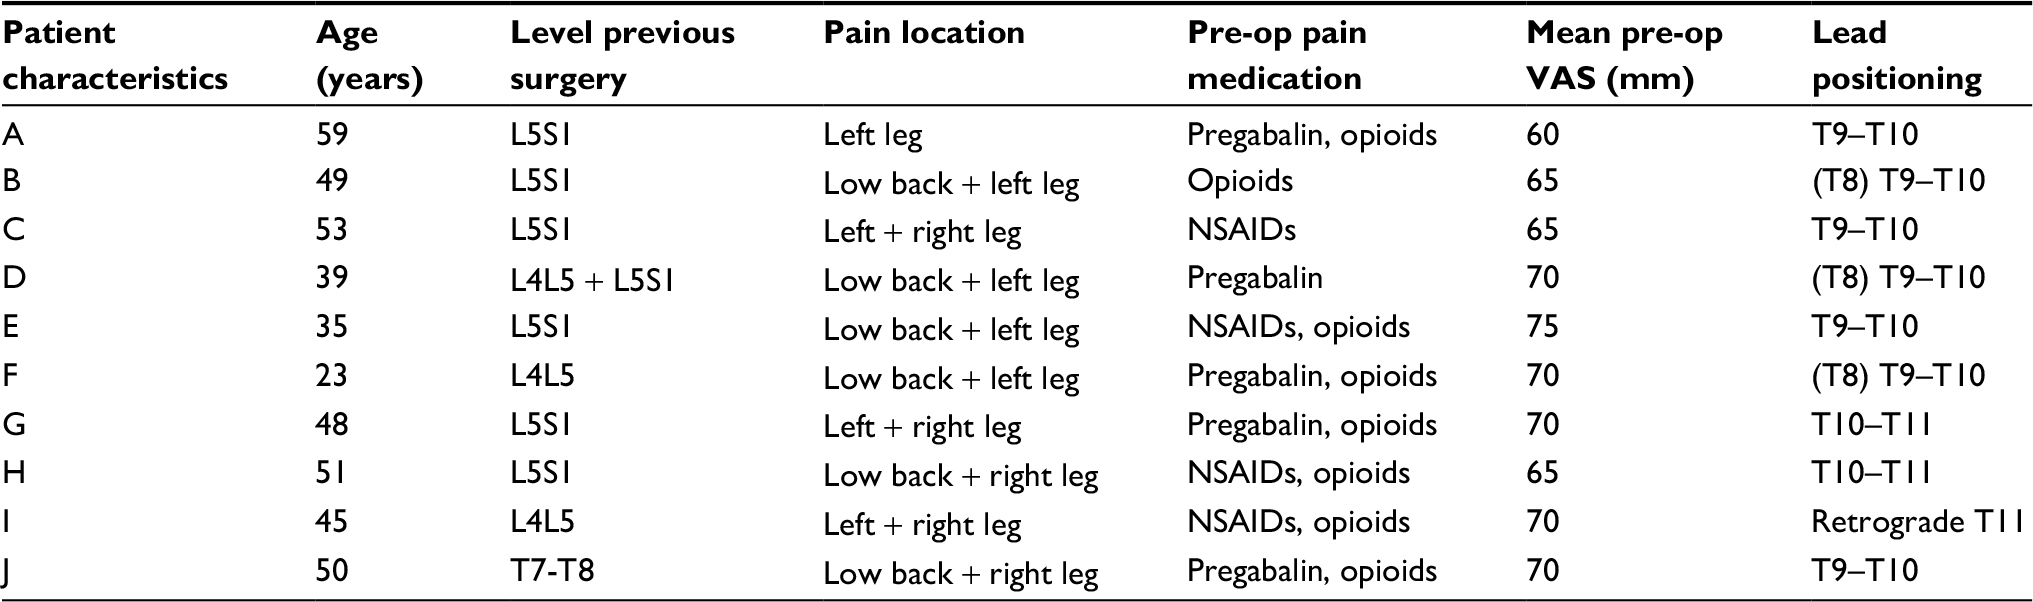 | Table 1 |
Prior to enrollment, written informed consent was obtained from all individual participants included in the study.
Surgical procedure and intraoperative stimulation assessment
A Specify 565 electrode (Medtronic Inc., Minneapolis, MN, USA) was surgically implanted. The procedure was conducted according to a structured protocol under epidural anesthesia using an epidural catheter inserted at level L2–L3. Ropivacaine 0.5% (10 mL, with top-up of 5 mL) was titrated to obtain a suspended anesthesia up to the T10 level.13,14 Via a midline flavectomy at level T10–11, an electrode was mostly inserted at level T9–T10 (dependent on the painful area), which was then confirmed by fluoroscopy. Intraoperative stimulation was used to identify the exact stimulation coverage of the painful area. The temporary extensions were attached to the skin and connected to a portable battery-powered stimulator (model 37,022ENS; Medtronic Inc., Minneapolis, MN, USA). The day after the implantation of the electrode, the position of the lead was confirmed by X-ray and no displacement was shown, compared to the intraoperative positioning. The fMRI assessments were conducted within a timeframe of 7–10 days after implantation of the electrode, avoiding possible interference of postoperative wound pain.13,14
Experimental protocol
To check the influence of SCS on magnetic resonance signals, the fMRI protocol was tested on a human-shaped, 60-kg-weighted phantom, composed of aqueous gel with thermal and electrical properties similar to human tissue. A Specify 565 electrode was attached dorsally, at the mid-thoracic level, in close contact with an MRI-compatible temperature sensor. This experimental setup was extensively tested on a 1.5 T (Intera, software level 11; Philips, Best, the Netherlands) and a 3 T (Achieva, software level 2.5; Philips) MRI scanner. No alterations were found with regard to radio-frequency heating or hardware failure during MR recordings.12
Before scanning, optimal stimulation parameters with maximal comfortable pain relief were determined in the supine position, mimicking the patient’s position in the scanner. Four different frequencies (4 Hz, 60 Hz, 500 Hz, and 1 kHz) were tested in a randomized order. Randomization was conducted previously by a third party, off site, using a random number generator (RANDOM.ORG; Randomness and Integrity Services Ltd., Dublin, Ireland) and applied over four consecutive days.
For each frequency, all patients underwent two randomized fMRI protocols: one with subthreshold and another with suprathreshold amplitudes. Subthreshold amplitude was defined as 10% below the sensory threshold of stimulation (paresthesia), whereas suprathreshold stimulation was defined as the intensity of current in which the patients comfortably felt the induced paresthesia. Respecting the possibility of a washout effect, an arbitrary time delay of 15 minutes between the supra- and subthreshold protocols was used (Figure 1).
 | Figure 1 Randomized fMRI study protocol. Notes: Overview of the fMRI study protocol; each threshold stimulation fMRI scan comprises five cycles of 30-second stimulation (SCS on) and rest phases (SCS off). Information = summary of the investigation protocol to the patients; fMRI = functional magnetic resonance imaging; SCS = spinal cord stimulation. Abbreviations: 3D, 3D T1-TFE scan; sub, subthreshold SCS; supra, suprathreshold SCS. |
The protocol described not only the maximal possible pulse density, but also the pulse width that was programmed as a function of the stimulated region. Moreover, each patient was instructed to switch off the SCS 24 hours before the fMRI scan was done, while also abstaining from caffeine, smoking, and other stimulating substances. All patients fulfilled these conditions and were questioned about it before commencing the protocol. The stimulation paradigm for each frequency was implemented as a block design, with stimulation and rest phases of 30 seconds each (Figure 1). This was repeated five times in a row to avoid interference. Patients were instructed to stay awake and inform the investigators immediately in case of any unusual sensation at the implantation site.
MRI data acquisition
Imaging was done on a Philips 3 T Intera MRI scanner, using a transmit–receive head coil. Anatomical images were acquired using a T1-weighted gradient-echo pulse sequence (3D T1-turbo field echo scan, magnetization prepared with a 180° IR pulse), consisting of 100 axial slices with slice thickness = 2 mm, TR = 12 ms, TE = 3,76 ms, and a 0.9375 mm × 0.9375 mm in-plane resolution. Flip angle = 10°, scan matrix = 256 × 256 × 100 voxels, FOV = 240 mm × 240 mm × 200 mm, and NSA = 1. Functional imaging data were constructed with a whole-brain multi-slice fast-field echo-planar imaging (FFE-EPI) consisting of 100 acquisitions of 30 axial slices covering the whole brain, with a slice thickness = 3 mm, gap = 0.5 mm, TR = 3 seconds, TE = 35 ms, 2.00 mm × 2.00 mm in-plane resolution, flip angle = 90°; matrix size = 116 × 115 × 30, oriented parallel to the AC–PC line, and FOV = 230 mm × 230 mm × 104.5 mm.
MRI data analysis
Preprocessing and statistical analysis of the fMRI data was done with the SPM12 program (Welcome Department of Imaging Neuroscience, University College London, London, UK), running in MATLAB R2016b (The MathWorks, Natick, MA, USA). Functional images were realigned to the mean functional image.
The mean image for every subject was transformed to the EPI template in Montreal Neurological Institute space. This transformation included an affine warping, followed by a non-affine normalization, based on b-splines. Using the normalization parameters determined for the mean functional image, all functional volumes were normalized. The normalized images were smoothed with an isotropic 8-mm Gaussian smoothing filter. Using the general linear modeling approach (GLM), a model was fitted to the measured time series per voxel. The model consisted of the timing parameters of the stimulation convolved with the hemodynamic response function (HRF), six motion parameters, and a constant to model the signal offset. Based on the fitting results, the contrasts “subthreshold > baseline” and “suprathreshold > baseline” were calculated for the respective scan sessions per subject.
These results were used as the input in the second-level group analysis. As second-level group analyses, one-sample t-tests were done per contrast for all subjects. These calculations were done by pooling all stimulation frequencies as well as for each stimulation frequency separately. To control for multiple comparisons, a peak-voxel threshold was set at P<0.01 uncorrected and a cluster level of P<0.05 uncorrected was selected. Anatomical regions were identified by inspection of group activation maps overlaid on the average high-resolution image of ten patients. Coordinates are given in Talairach space. Due to the exploratory design of this study, a choice was made to include ten patients in each group. This is in line with previous studies which demonstrated that, even with small sample sizes, a good power of ≥80% can be achieved.21,22
Results
Clinical data and pulse density
During fMRI scanning, none of the ten patients included in the study reported unusual or unpleasant sensations at the site of the implantation or the extensions. Changes in stimulation patterns, such as increased stimulation intensity by magnetic field activation, were not reported. Telemetry of the stimulator and impedance measurements after each fMRI session did not show any altered settings.
As a result, from the different stimulation frequencies, patients indicated that suprathreshold stimulation at 500 Hz – and especially at 1,000 Hz – could be categorized as unpleasant, but not painful. Suprathreshold stimulation at 4 Hz felt more like an intense massage. During the fMRI scans, the amplitude varied between 0.2 and 7 V for suprathreshold stimulation and 0.2 and 6.5 V for subthreshold stimulation.
Table 2 presents the characteristics of electrical pulses in mean charge per second, which can be considered as the charge per pulse over a period of time, and mean pulse density, which gives a percentage of time during which the signal is delivering energy. The highest charge/second was obtained in suprathreshold stimulation at 1 kHz. During subthreshold stimulating, the charge/second was significantly higher between 500 Hz/1 kHz and the lower frequencies. For pulse density, the highest density (11.3%) was reached at 500 Hz.
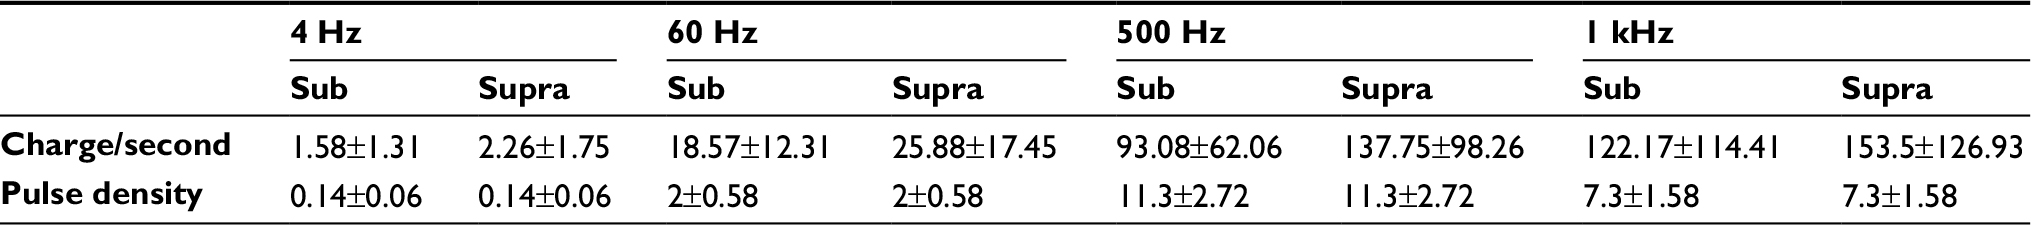 | Table 2 Overview of the characteristics of electrical pulses in mean charge per second and mean pulse density at four different frequencies (4 Hz, 60 Hz, 500 Hz, and 1 kHz). Note: Second (µCoulomb/second). Pulse density = pulse width × frequency (%). Abbreviations: Sub, subthreshold SCS; Supra, suprathreshold SCS. |
Suprathreshold versus subthreshold stimulation
Figure 2 represents blood oxygen-level-dependent (BOLD) changes during stimulation as compared between subthreshold and suprathreshold stimulation, independent of any frequency. Each type of stimulation was compared with baseline values.
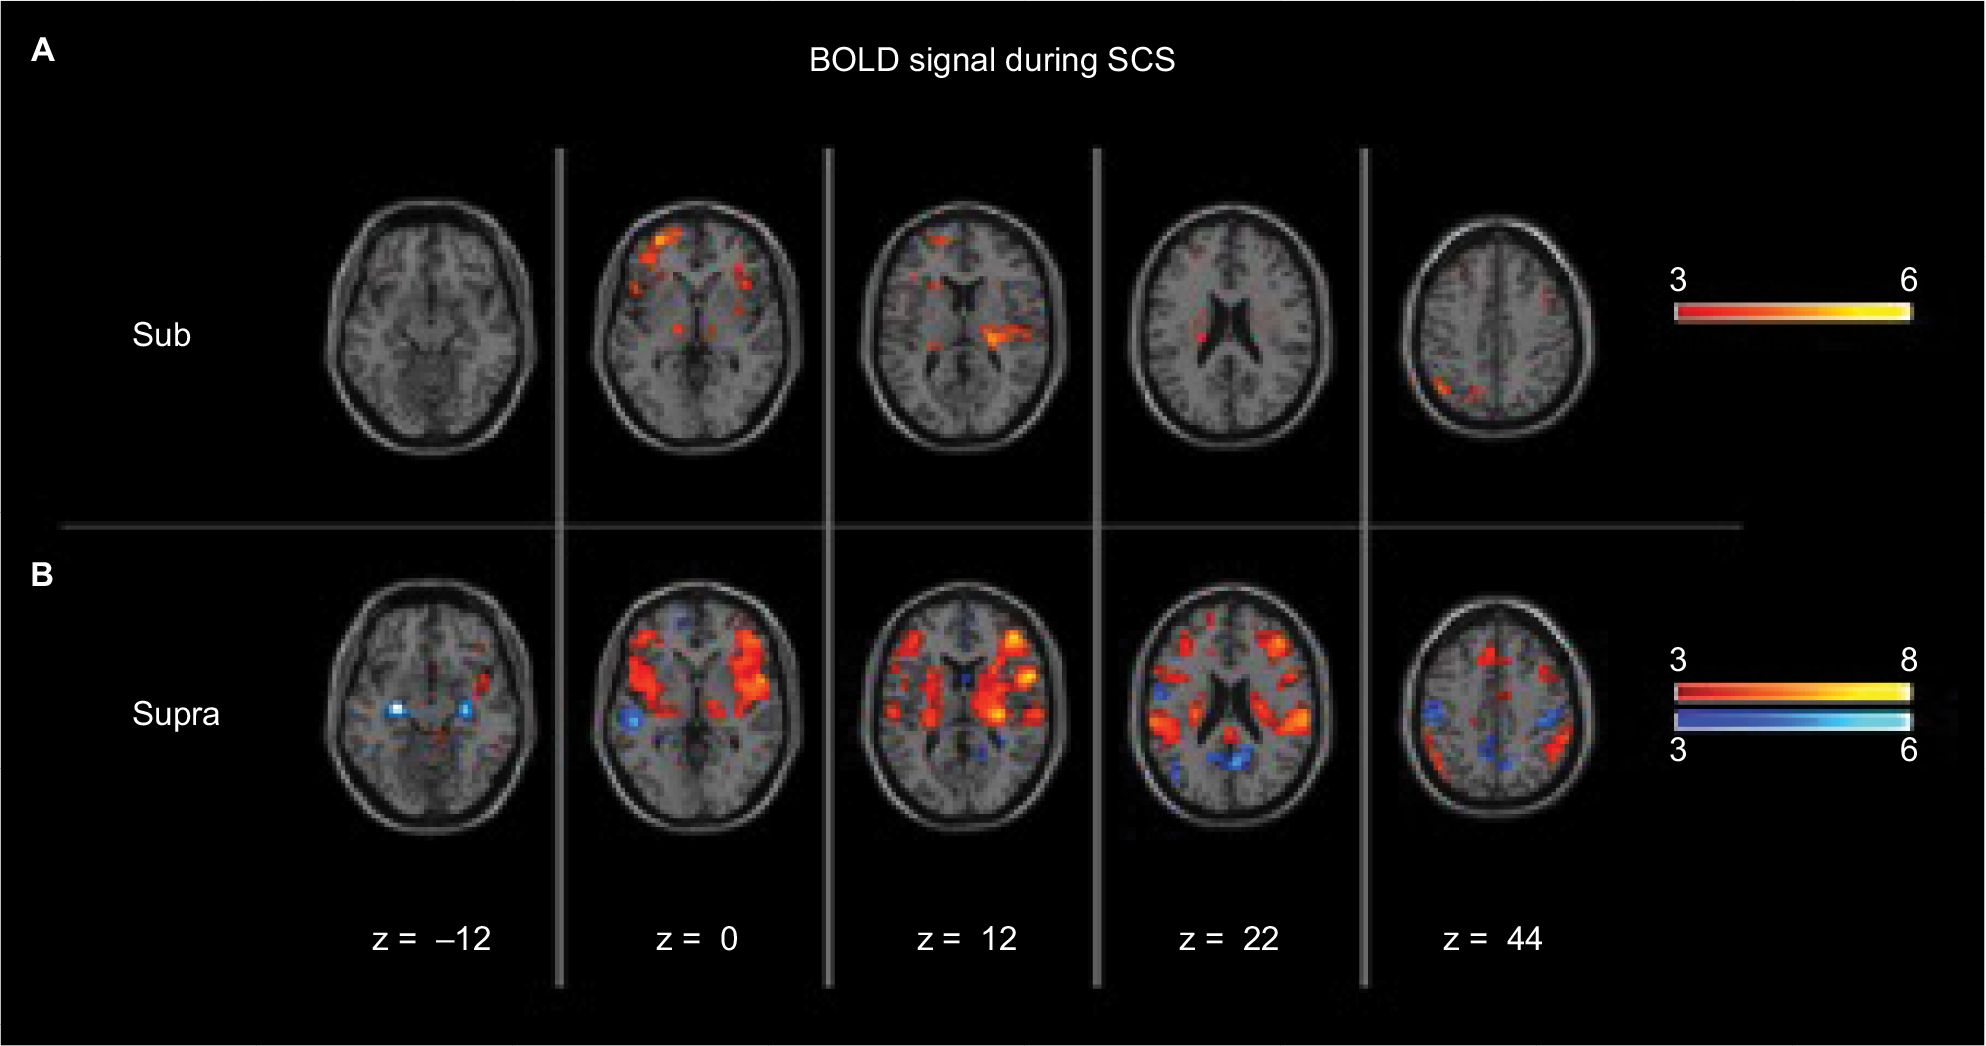 | Figure 2 Group average activation maps of functional BOLD alterations during short-term sub- and suprathreshold SCS independently of any type of frequency. Notes: (A) subthreshold SCS; (B) suprathreshold SCS peak-voxel threshold = P<0.01, uncorrected; cluster level = P<0.05 uncorrected. Colors represent BOLD alterations: red = activation, blue = deactivation; z = dorsal–ventral location according to MNI coordinates. Abbreviations: BOLD, blood oxygen-level-dependent; SCS, spinal cord stimulation; Sub, subthreshold SCS; Supra, suprathreshold SCS. |
Short-term subthreshold SCS stimulation
Short-term subthreshold stimulation activated the bilateral thalamus; medial, inferior, and superior frontal gyri; putamen; left claustrum; insula; and middle frontal gyrus. No statistically significant deactivation was observed.
Short-term suprathreshold SCS stimulation
Short-term suprathreshold stimulation resulted in increased bilateral activation of the superior, middle, and inferior frontal gyri as well as the inferior parietal gyrus. In addition, bilateral activation of the pre- and postcentral gyri (z = 14–34) was found. Activation of the bilateral basal ganglia (putamen and globus pallidus) and cingulate gyrus was found as well. A similar activation pattern was seen bilaterally in the claustrum, lateral thalamus, and insula. Moreover, deactivation of the bilateral parahippocampus, amygdala, precuneus, posterior cingulate gyrus (PCG), postcentral gyrus (z = 38–60), and unilateral superior temporal gyrus was observed.
Frequency-dependent brain alterations
BOLD changes during short-term sub- and suprathreshold SCS at 4 Hz, 60 Hz, 500 Hz, and 1 kHz frequency are shown in Figures 3 and 4. The results were compared with baseline values.
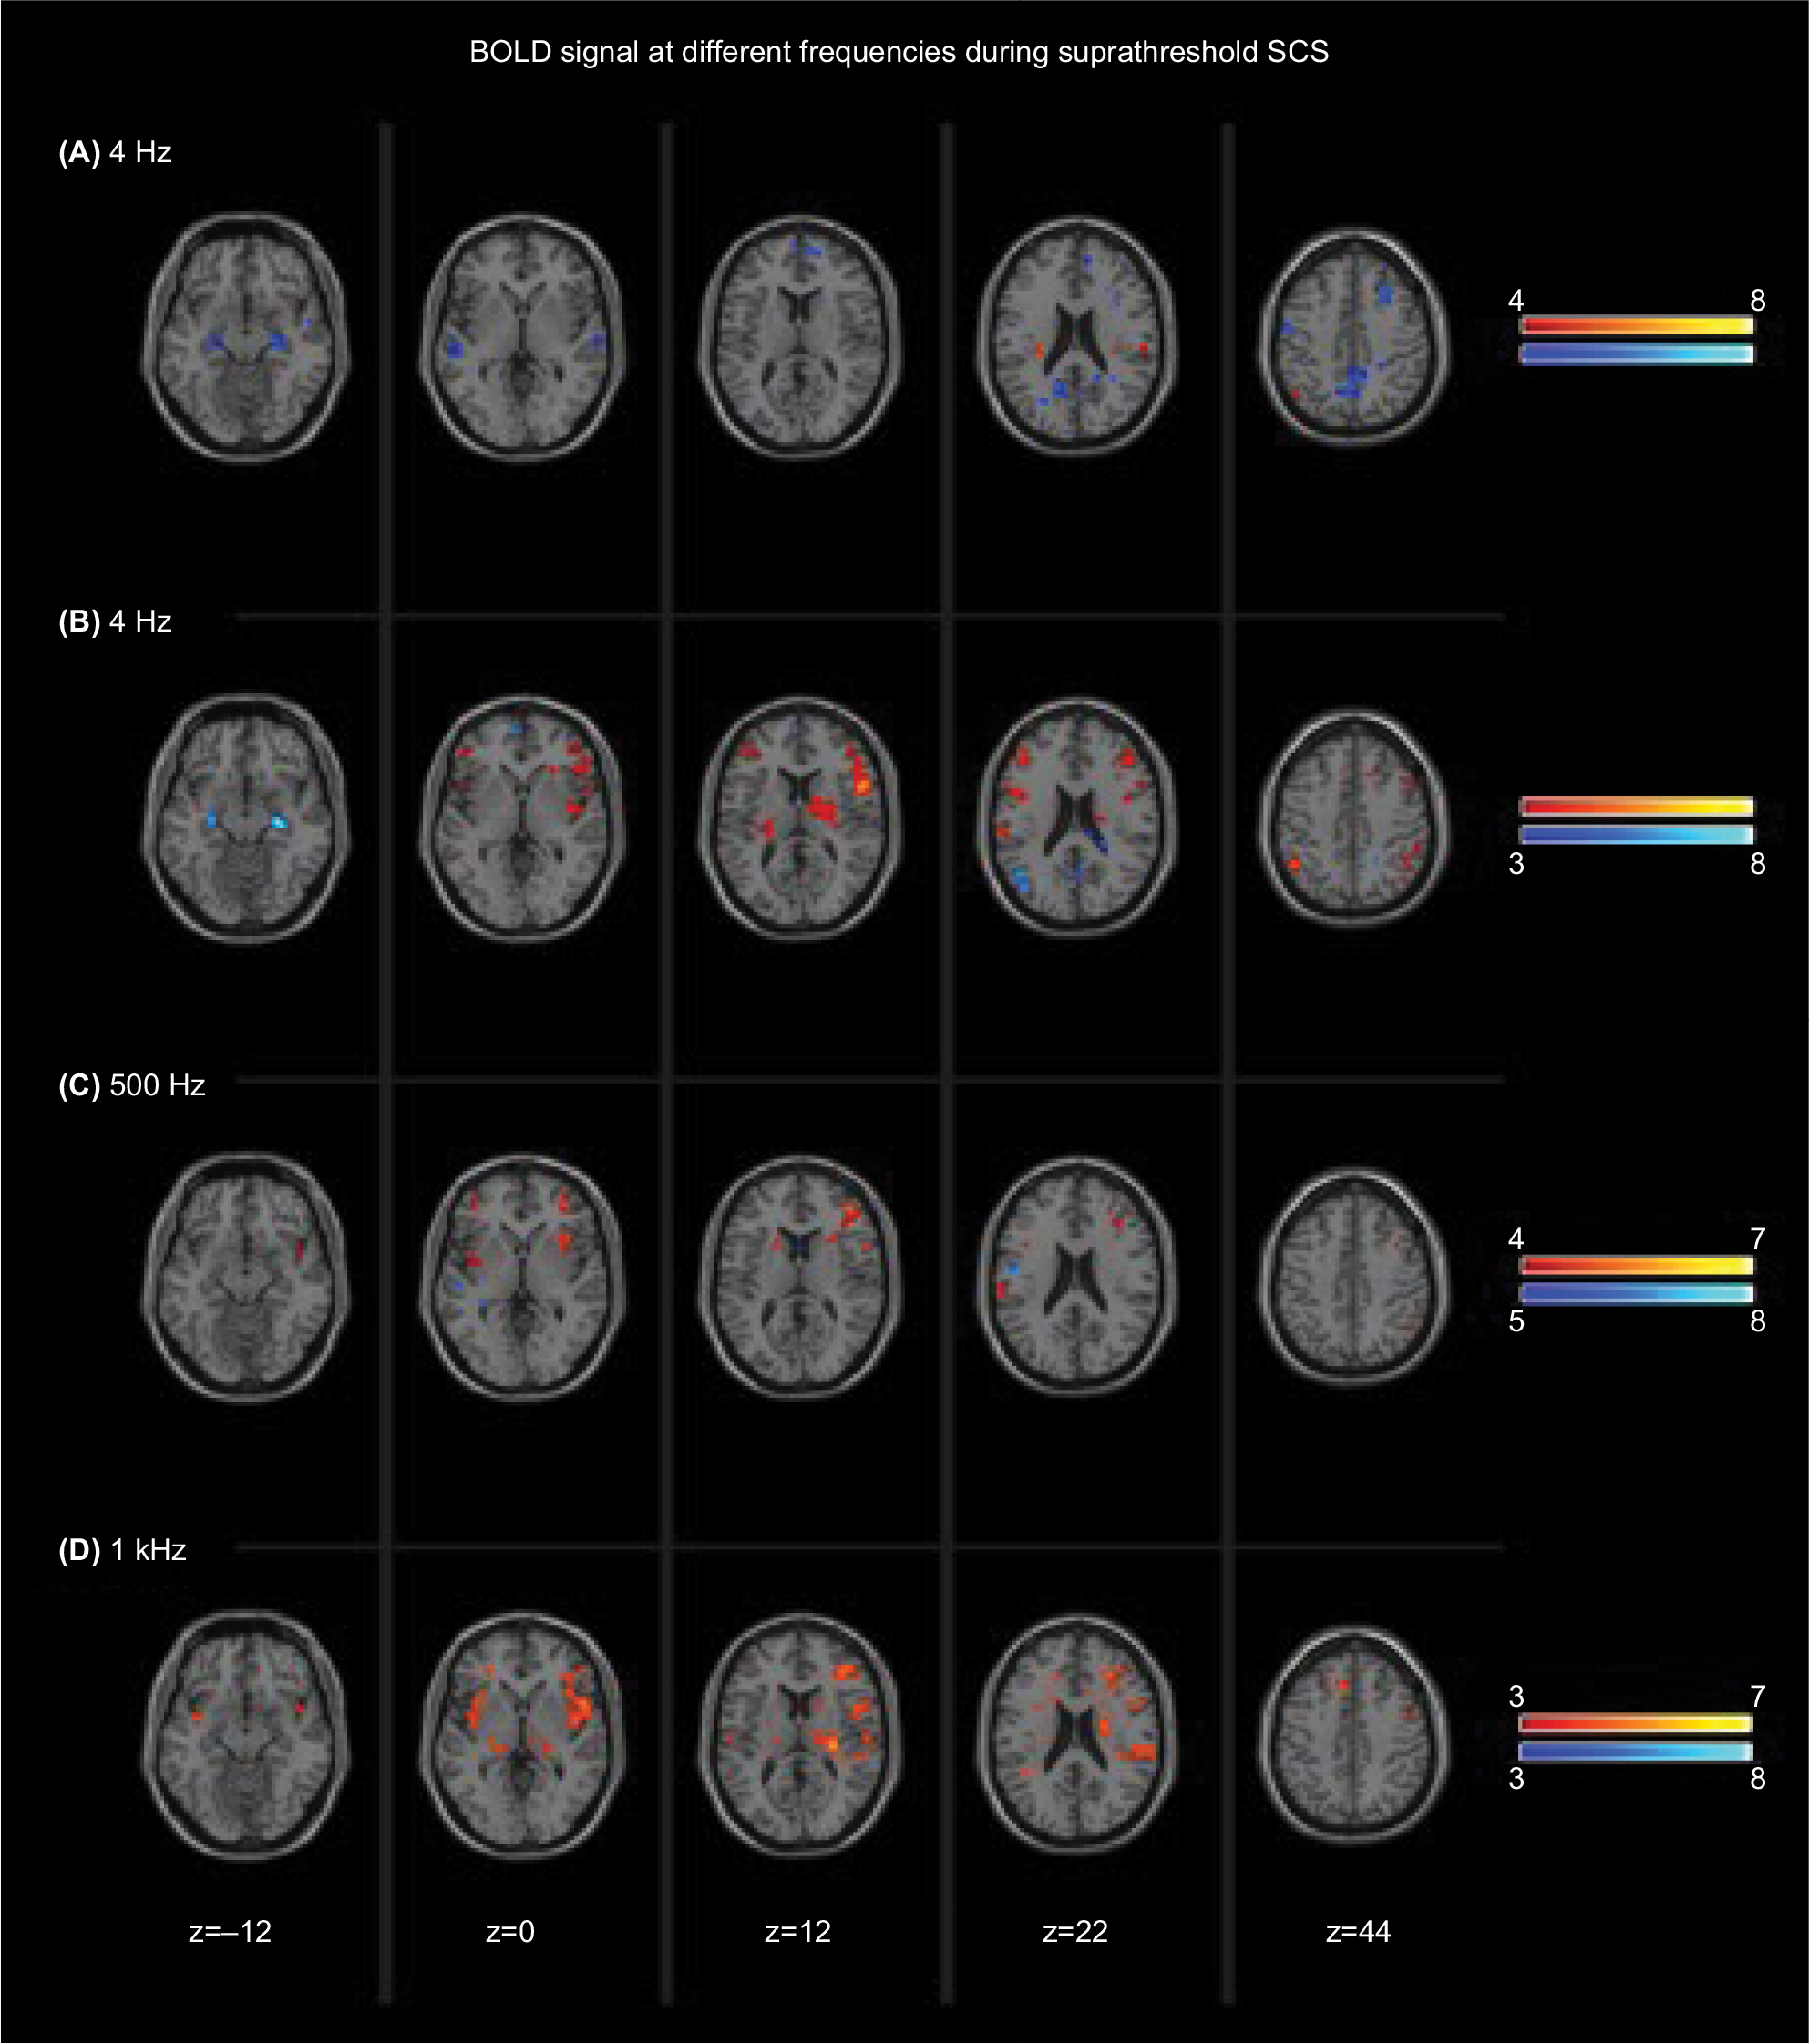 | Figure 3 Group average activation maps of functional BOLD alterations during short-term suprathreshold SCS at four different frequencies; (A) 4 Hz, (B) 60 Hz, (C) 500 Hz, and (D) 1 kHz). Notes: Peak-voxel threshold = P<0.01 uncorrected; cluster level = P<0.05 uncorrected. Red = activation, blue = deactivation; z = dorsal–ventral location according to MNI coordinates; 1 kHz = 1,000 Hz. Abbreviations: BOLD, blood oxygen-level-dependent; SCS, spinal cord stimulation. |
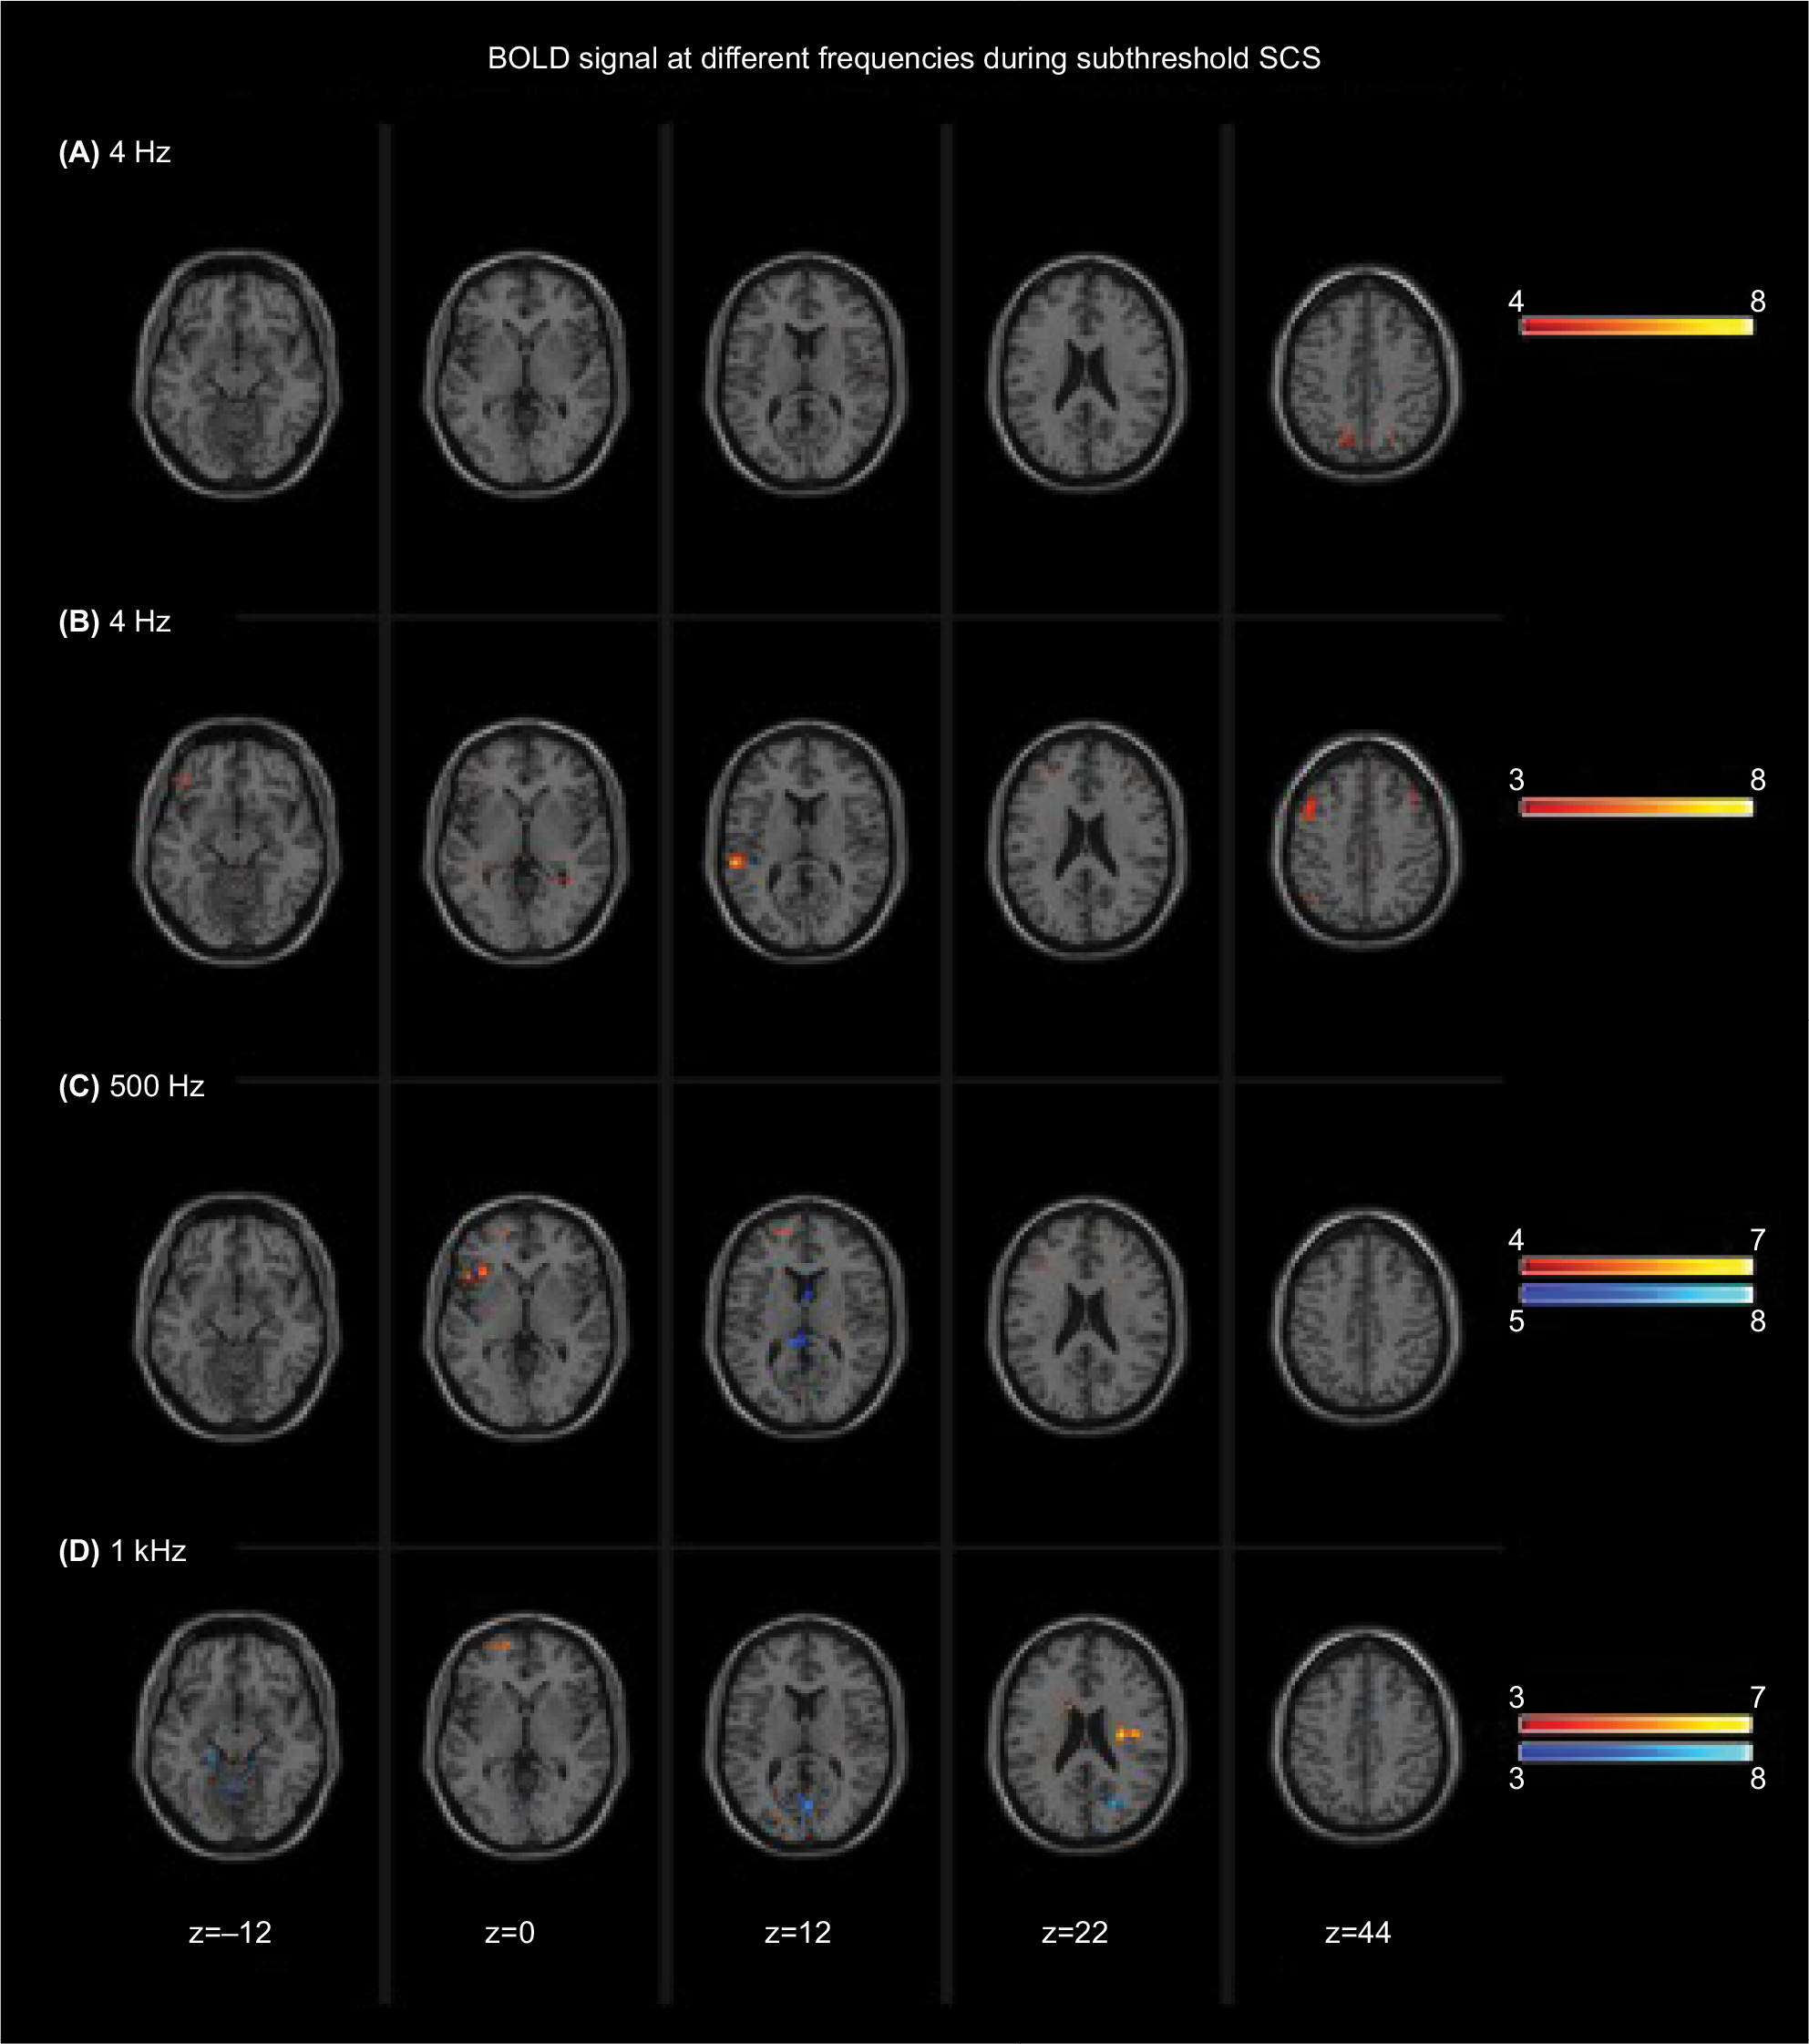 | Figure 4 Group average activation maps of functional BOLD alterations during short term subthreshold SCS at four different frequencies; (A) 4 Hz, (B) 60 Hz, (C) 500 Hz, and (D) 1 kHz) Notes: Peak-voxel threshold= P<0.01 uncorrected; cluster level= P<0.05 uncorrected. Red = activation, blue = deactivation; z = dorsal-ventral location according to MNI coordinates; 1kHz = 1000 Hz. Abbreviations: BOLD, blood oxygen-level-dependent; SCS, spinal cord stimulation. |
Suprathreshold SCS
4 Hz
Suprathreshold stimulation at a frequency of 4 Hz activated the unilateral postcentral gyrus, and caused bilateral deactivation of the precuneus, parahippocampal gyrus, amygdala, PCG, and superior temporal gyrus. Unilateral deactivation was found in the pre- and postcentral gyri as well as the middle and medial frontal gyri.
60 Hz
Suprathreshold stimulation at 60 Hz was associated with bilateral activation of the inferior frontal gyrus, parietal gyrus, and claustrum. Unilateral activation was found in the putamen and the thalamus. In addition, activation of the left medial frontal gyrus was found. Bilateral deactivation was found in the parahippocampus, whereas unilateral deactivation was found in the middle temporal gyrus (left-sided), superior frontal gyrus (left), and the right precuneus.
500 Hz
Suprathreshold stimulation at 500 Hz resulted in bilateral activation of the insula. Unilateral activation was found in the inferior and middle frontal gyri, nucleus caudatus, claustrum, postcentral gyrus, and precentral gyrus (z = 2–14). Deactivation was observed in the left superior parietal lobe and the right precentral gyrus (z = 46–56).
1 kHz
Suprathreshold stimulation at a frequency of 1 kHz showed activation of the bilateral middle, medial, and inferior frontal gyri; lateral thalamus; and insula. Activation was found in aspects of the basal ganglia (putamen, nucleus caudatus, and globus pallidus), left mid-cingulate gyrus, superior temporal gyrus, pre- and postcentral gyri, and claustrum. Unilateral deactivation was observed in the precuneus (z = 30–36).
Subthreshold SCS
4 Hz
Subthreshold stimulation at 4 Hz resulted in unilateral activation of the precuneus and precentral gyrus. No deactivation was observed.
60 Hz
Subthreshold stimulation at 60 Hz was associated with a bilateral activation of the middle frontal gyrus. In addition, unilateral activation of the superior and middle temporal gyri was found. No significant deactivation was observed.
500 Hz
For subthreshold stimulation at a frequency of 500 Hz, activation in the unilateral superior and inferior frontal gyri was investigated. The only significant deactivation was found in the corpus callosum and interhemispheric fissure/PCG.
1 kHz
Subthreshold stimulation at 1 kHz resulted in unilateral activation of the insula and superior frontal gyrus. Deactivation was observed in the anterior lobe of the cerebellum and the unilateral (pre)cuneus.
Discussion
To the best of our knowledge, no fMRI study has described the cortical and subcortical processes involving short-term sub- and suprathreshold SCS in patients suffering from FBSS.
Across all frequencies, suprathreshold stimulation generates more cortical activity than subthreshold SCS. Furthermore, our results suggest that increasing the amplitude above the individual sensory threshold modulates more cerebral regions than only “the sensory complex”, provoking increased bilateral activity of the claustrum and the thalamus.17 The tracts originating from the claustrum are bidirectional and their connections with the sensorimotor, temporal, frontal, and limbic cortices are well known.23
The thalamus is involved in the transmission of pain signals (sensory discriminative and affective motivational components) to the cortical areas, such as the middle frontal gyrus, which could explain the bilateral activation of this region seen during suprathreshold SCS.24 The middle frontal gyrus is part of the prefrontal cortex (PFC) – a brain region which is a key structure in different brain networks and often shows abnormal increased function in patients with chronic pain. The PFC belongs to the top-down pain inhibitory system controlling sensory and affective stimuli, resulting in sensory perception and affective behaviors.25 At higher frequencies (500 and 1,000 Hz), suprathreshold stimulation causes activation of the insula, thalamus, nucleus caudatus, and different cortical regions (cingulate gyrus and middle frontal gyrus). Those cortical regions are active in different cognitive, emotional, and reward functions. A possible explanation for their increased activity is that patients reported an unpleasant sensation during stimulation. Although patients described it as non-painful, activation of those cortical pain regions might be a reaction to this unpleasant feeling.26 Such high frequencies in combination with the suprathreshold stimulation generate a high amount of electrical charge and may overstimulate the central nervous system (CNS), thereby causing more pain.
Subthreshold stimulation at 500 and 1,000 Hz, on the other hand, resulted in deactivation of two important structures related to pain processing: the precuneus and PCG. This might explain why subthreshold stimulation at higher frequencies clinically results in greater pain relief.27,28 The deactivation pattern caused by suprathreshold SCS involved more different regions than subthreshold SCS, resulting in bilateral deactivation of the parahippocampus, amygdala, PCG, precuneus, and superior temporal gyrus. Remarkably, this bilateral deactivation pattern only occurred at suprathreshold SCS at lower frequencies of 4 and 60 Hz. The most prominent structures showing deactivation are the precuneus, similarly to subthreshold stimulation at higher frequencies, and the parahippocampus. The precuneus plays a key role in the “self-consciousness” system, and several studies have shown its increased activity in patients with chronic low back pain.29,30 The parahippocampus, however, has an important impact on the “descending nociceptive inhibitory system”.31,32 Both structures have reciprocal connections with the adjacent area of the PCG, inferior parietal lobe, and dorsal part of the thalamus, which are all target regions of the default mode network (DMN).33 A reduced functional connectivity of regions typically considered to be part of the DMN has already been demonstrated in chronic pain conditions.34,35 Likewise, these alterations in functional connectivity have been described in patients with FBSS.36,37
This study has some limitations that need clarification. First, no correlations were made between clinical relevant outcomes (eg, pain reduction, functional improvement, or psychological recovery) and neuroimaging. Second, this study did not investigate the amount of energy delivered to the CNS and the degree of cerebral involvement. This association should be further clarified by future research.
Conclusion
Suprathreshold stimulation seems to result in greater activity of the frontal brain regions, cortices, (limbic, sensory, and motor), and the diencephalon when compared to subthreshold stimulation.
Across the different frequencies, suprathreshold stimulation shows a different activation pattern. Activation of the frontal regions was visible at 60 Hz, 500 Hz, and 1 kHz via the dorsal thalamus and the bilateral caudal brain region of the precuneus, PCG, and parietal lobule. Deactivation of the parahippocampus was seen at 4 Hz and, partially, at 60 Hz.
These findings contribute to a better understanding of the cerebral regions implicated in short-term sub- and suprathreshold SCS.
Acknowledgments
The authors thank Pater Mariën for his contribution to this paper; unfortunately, he passed away in November 2017. The authors thank all UZ Brussel personnel from the Department of Radiology (MRI) for their help in various aspects of the study and insightful discussion. The authors also acknowledge the editorial assistance of Anke Lauwers, Elissa De Groote, and Danièle Van Os. In addition, the authors thank all patients who participated in the study.
Authors contributions
SDG, MDJ, PVS, ADS, SS, RP, DL, LG, PF, and MM provided substantial contributions to conception and design, data acquisition, or data analysis and interpretation. SDG, MDJ, PVS, ADS, SS, RP, DL LG, PF, and MM contributed to drafting the article or critically revising it for important intellectual content. SDG, MDJ, PVS, ADS, SS, RP, DL LG, PF, and MM provided final approval of the version to be published. SDG, MDJ, PVS, ADS, SS, RP, DL LG, PF, and MM agree to be accountable for all aspects of the work in ensuring that questions related to the accuracy or integrity of the work are appropriately investigated and resolved.
Disclosure
MM received research grants from Medtronic and Nevro. The authors report no conflicts of interest in this work.
References
Bordoni B, Marelli F. Failed back surgery syndrome: review and new hypotheses. J Pain Res. 2016;9:17–22. | ||
Epstein LJ, Palmieri M. Managing chronic pain with spinal cord stimulation. Mt Sinai J Med. 2012;79(1):123–132. | ||
Kapural L, Peterson E, Provenzano DA, Staats P. Clinical evidence for spinal cord stimulation for failed back surgery syndrome (FBSS): systematic review. Spine. 2017;42(Suppl 14):S61–S66. | ||
Linderoth B, Foreman RD. Conventional and novel spinal stimulation algorithms: hypothetical mechanisms of action and comments on outcomes. Neuromodulation. 2017;20(6):525–533. | ||
Vallejo R, Bradley K, Kapural L. Spinal cord stimulation in chronic pain: mode of action. Spine. 2017;42(Suppl 14):S53–S60. | ||
Kapural L. Letter: comparison of 10-khz high-frequency and traditional low-frequency spinal cord stimulation for the treatment of chronic back and leg pain: 24-month results from a multicenter randomized controlled pivotal trial. Neurosurgery. 2017;80(1):E176–E177. | ||
Kapural L, Yu C, Doust MW, et al. Comparison of 10-khz high-frequency and traditional low-frequency spinal cord stimulation for the treatment of chronic back and leg pain: 24-month results from a multicenter, randomized, controlled pivotal trial. Neurosurgery. 2016;79(5):667–677. | ||
de Ridder D, Perera S, Vanneste S. Are 10 khz stimulation and burst stimulation fundamentally the same? Neuromodulation. 2017;20(7):650–653. | ||
Wille F, Breel JS, Bakker EW, Hollmann MW. Altering conventional to high density spinal cord stimulation: an energy dose-response relationship in neuropathic pain therapy. Neuromodulation. 2017;20(1):71–80. | ||
de Ridder D, Vanneste S. Visions on the future of medical devices in spinal cord stimulation: what medical device is needed? Expert Rev Med Devices. 2016;13(3):233–242. | ||
Miller JP, Eldabe S, Buchser E, Johanek LM, Guan Y, Linderoth B. Parameters of spinal cord stimulation and their role in electrical charge delivery: a review. Neuromodulation. 2016;19(4):373–384. | ||
Moens M, Droogmans S, Spapen H, et al. Feasibility of cerebral magnetic resonance imaging in patients with externalised spinal cord stimulator. Clin Neurol Neurosurg. 2012;114(2):135–141. | ||
Moens M, Sunaert S, Mariën P, et al. Spinal cord stimulation modulates cerebral function: an fMRI study. Neuroradiology. 2012;54(12):1399–1407. | ||
Moens M, Mariën P, Brouns R, et al. Spinal cord stimulation modulates cerebral neurobiology: a proton magnetic resonance spectroscopy study. Neuroradiology. 2013;55(8):1039–1047. | ||
Kishima H, Saitoh Y, Oshino S, et al. Modulation of neuronal activity after spinal cord stimulation for neuropathic pain; H(2)15O PET study. Neuroimage. 2010;49(3):2564–2569. | ||
Nagamachi S, Fujita S, Nishii R, et al. Alteration of regional cerebral blood flow in patients with chronic pain – evaluation before and after epidural spinal cord stimulation. Ann Nucl Med. 2006;20(4):303–310. | ||
Bentley LD, Duarte RV, Furlong PL, Ashford RL, Raphael JH. Brain activity modifications following spinal cord stimulation for chronic neuropathic pain: a systematic review. Eur J Pain. 2016;20(4):499–511. | ||
de Ridder D, Vanneste S. Burst and tonic spinal cord stimulation: different and common brain mechanisms. Neuromodulation. 2016;19(1):47–59. | ||
Gad P, Choe J, Shah P, et al. Sub-threshold spinal cord stimulation facilitates spontaneous motor activity in spinal rats. J Neuroeng Rehabil. 2013;10:108. | ||
Wolter T, Kiemen A, Porzelius C, Kaube H. Effects of sub-perception threshold spinal cord stimulation in neuropathic pain: a randomized controlled double-blind crossover study. Eur J Pain. 2012;16(5):648–655. | ||
Bhaumik DK, Roy A, Lazar NA, et al. Hypothesis testing, power and sample size determination for between group comparisons in fMRI experiments. Stat Methodol. 2009;6(2):133–146. | ||
Desmond JE, Glover GH. Estimating sample size in functional MRI (fMRI) neuroimaging studies: statistical power analyses. J Neurosci Methods. 2002;118(2):115–128. | ||
Azqueta-Gavaldon M, Schulte-Göcking H, Storz C, et al. Basal ganglia dysfunction in complex regional pain syndrome – A valid hypothesis? Eur J Pain. 2017;21(3):415–424. | ||
Peyron R. Functional brain imaging: what has it brought to our understanding of neuropathic pain? A special focus on allodynic pain mechanisms. Pain. 2016;157(Suppl 1):S67–71. | ||
Arnsten AF, Wang MJ, Paspalas CD. Neuromodulation of thought: flexibilities and vulnerabilities in prefrontal cortical network synapses. Neuron. 2012;76(1):223–239. | ||
de Felice M, Ossipov MH. Cortical and subcortical modulation of pain. Pain Manag. 2016;6(2):111–120. | ||
Song Z, Viisanen H, Meyerson BA, Pertovaara A, Linderoth B. Efficacy of kilohertz-frequency and conventional spinal cord stimulation in rat models of different pain conditions. Neuromodulation. 2014;17(3):226234–235225discussion. | ||
van Havenbergh T, Vancamp T, van Looy P, Vanneste S, de Ridder D. Spinal cord stimulation for the treatment of chronic back pain patients: 500-Hz vs. 1000-Hz burst stimulation. Neuromodulation. 2015;18(1):9–12. | ||
Cavanna AE. The precuneus and consciousness. CNS Spectr. 2007;12(7):545–552. | ||
Matsuo Y, Kurata J, Sekiguchi M, Yoshida K, Nikaido T, Konno SI. Attenuation of cortical activity triggering descending pain inhibition in chronic low back pain patients: a functional magnetic resonance imaging study. J Anesth. 2017;31(4):523–530. | ||
Vachon-Presseau E, Roy M, Martel MO, et al. The stress model of chronic pain: evidence from basal cortisol and hippocampal structure and function in humans. Brain. 2013;136(Pt 3):815–827. | ||
Desantana JM, Walsh DM, Vance C, Rakel BA, Sluka KA. Effectiveness of transcutaneous electrical nerve stimulation for treatment of hyperalgesia and pain. Curr Rheumatol Rep. 2008;10(6):492–499. | ||
Zhang S, Li CS, Cs L. Functional connectivity mapping of the human precuneus by resting state fMRI. Neuroimage. 2012;59(4):3548–3562. | ||
Baliki MN, Geha PY, Apkarian AV, Chialvo DR. Beyond feeling: chronic pain hurts the brain, disrupting the default-mode network dynamics. J Neurosci. 2008;28(6):1398–1403. | ||
Bolwerk A, Seifert F, Maihöfner C. Altered resting-state functional connectivity in complex regional pain syndrome. J Pain. 2013;14(10):1107–1115. | ||
Letzen JE, Robinson ME. Negative mood influences default mode network functional connectivity in patients with chronic low back pain: implications for functional neuroimaging biomarkers. Pain. 2017;158(1):48–57. | ||
Kornelsen J, Sboto-Frankenstein U, Mciver T, et al. Default mode network functional connectivity altered in failed back surgery syndrome. J Pain. 2013;14(5):483–491. |
 © 2018 The Author(s). This work is published and licensed by Dove Medical Press Limited. The
full terms of this license are available at https://www.dovepress.com/terms
and incorporate the Creative Commons Attribution
- Non Commercial (unported, 3.0) License.
By accessing the work you hereby accept the Terms. Non-commercial uses of the work are permitted
without any further permission from Dove Medical Press Limited, provided the work is properly
attributed. For permission for commercial use of this work, please see paragraphs 4.2 and 5 of our Terms.
© 2018 The Author(s). This work is published and licensed by Dove Medical Press Limited. The
full terms of this license are available at https://www.dovepress.com/terms
and incorporate the Creative Commons Attribution
- Non Commercial (unported, 3.0) License.
By accessing the work you hereby accept the Terms. Non-commercial uses of the work are permitted
without any further permission from Dove Medical Press Limited, provided the work is properly
attributed. For permission for commercial use of this work, please see paragraphs 4.2 and 5 of our Terms.