Back to Journals » Neuropsychiatric Disease and Treatment » Volume 12
Functional cortical changes in relapsing-remitting multiple sclerosis at amplitude configuration: a resting-state fMRI study
Authors Liu H ![]() , Chen H, Wu B, Zhang TJ, Wang J, Huang KX, Song GJ, Zhan J
, Chen H, Wu B, Zhang TJ, Wang J, Huang KX, Song GJ, Zhan J
Received 29 August 2016
Accepted for publication 31 October 2016
Published 25 November 2016 Volume 2016:12 Pages 3031—3039
DOI https://doi.org/10.2147/NDT.S120909
Checked for plagiarism Yes
Review by Single anonymous peer review
Peer reviewer comments 2
Editor who approved publication: Professor Wai Kwong Tang
Heng Liu,1,* Hua Chen,1,* Bo Wu,1 Tijiang Zhang,1 Jinhui Wang,2,3 Kexin Huang,1 Ganjun Song,1 Jian Zhan4
1Department of Radiology, Affiliated Hospital of Zunyi Medical University, Medical Imaging Center of Guizhou Province, Zunyi, Guizhou, 2Department of Psychology, Hangzhou Normal University, 3Zhejiang Key Laboratory for Research in Assessment of Cognitive Impairments, Hangzhou, 4Department of Neurology, Affiliated Hospital of Zunyi Medical University, Zunyi, Guizhou, People’s Republic of China
*These authors contributed equally to this work
Objective: The aim of this study was to explore the amplitude of spontaneous brain activity fluctuations in patients with relapsing–remitting multiple sclerosis (RRMS) using the amplitude of low-frequency fluctuation (ALFF) method.
Methods: ALFF and SPM8 were utilized to assess alterations in regional spontaneous brain activities in patients with RRMS in comparison with healthy controls (HCs). The beta values of altered brain regions between patients with RRMS and HCs were extracted, and a receiver operating characteristic (ROC) curve was generated to calculate the sensitivities and specificities of these different brain areas for distinguishing patients with RRMS from HCs. Pearson correlation analyses were applied to assess the relationships between the beta values of altered brain regions and disease duration and Expanded Disability Status Scale (EDSS) score.
Patients and participants: A total of 18 patients with RRMS (13 females; five males) and 18 sex-, age-, and education-matched HCs (14 females; four males) were recruited for this study.
Measurements and results: Compared with HCs, patients with RRMS showed higher ALFF responses in the right fusiform gyrus (Brodmann area [BA] 37) and lower ALFF responses in the bilateral anterior cingulate cortices (BA 24 and 32), bilateral heads of the caudate nuclei, and bilateral brainstem. The ROC analysis revealed that the beta values of these abnormal brain areas showed high degrees of sensitivity and specificity for distinguishing patients with RRMS from HCs. The EDSS score showed a significant negative Pearson correlation with the beta value of the caudate head (r=-0.474, P=0.047).
Conclusion: RRMS is associated with disturbances in spontaneous regional brain activity in specific areas, and these specific abnormalities may provide important information about the neural mechanisms underlying behavioral impairment in RRMS.
Keywords: multiple sclerosis, amplitude of low-frequency fluctuation, receiver operating characteristic, functional magnetic resonance imaging, blood oxygen level dependent, resting state
Introduction
Multiple sclerosis (MS) is a neurodegenerative disorder that is characterized by motor dysfunction and disseminated axonal degeneration as well as inflammatory demyelination in the central nervous system. MS is an autoimmune demyelinating disease of the central nervous system. While demyelination is the hallmark of relapsing–remitting subtype, neurodegeneration is believed to be the hallmark of progressive forms. In addition, there is a growing consensus on a partly independent occurrence of demyelination and neurodegeneration even at early stages of MS, the link between both processes being synaptotoxicity. Typically, the extent of motor dysfunction is relative to the extent of white matter (WM) and gray matter (GM) damage.1,2 The extensive involvement of disease-related cortical GM organization may delay and perturb syntonic intrinsic signals across cortico–cortical and cortico–subcortical circuits and underlie several nonmotor clinical manifestations of MS such as fatigue, sensorimotor deficits, and cognitive dysfunction.2 However, the neurological basis of the role of WM and GM damage in these manifestations of MS remains unclear.
Brain imaging has facilitated the noninvasive exploration of MS-related pathology.3–5 However, previous functional magnetic resonance imaging (fMRI) studies have traditionally focused on task-evoked neuronal activity. Because different performance and task patterns make it difficult to interpret biological mechanisms of disease and hinder between-study comparisons, it has been difficult to achieve a consensus regarding the nature of MS-related abnormalities in brain regions, including the anterior cingulate cortex, inferior parietal lobule, basal ganglia, thalamus, and cerebellum.6–9
It has been reported that synchronous neuronal activity is conducive to information coordination and integration processing;10 in one study, the interruption of synchronous activity was proposed to mediate cognitive dysfunction by inducing deterioration of the efficiency and speed of information processing.11 Resting-state fMRI (RS-fMRI) is a useful tool for the mechanistic investigation of brain diseases; RS-fMRI can accurately localize neural activities, does not require the use of a radioactive tracer, and has been applied to detect alterations in regional brain activity.12 In contrast to magnetoencephalography and conventional electrophysiological methods, RS-fMRI has the capacity to map neuronal activity with high spatial resolution. Beyond detecting regional changes in brain activity, RS-fMRI also provides important information on the architecture and interconnectivity of distributed brain networks, notably by measuring patterns of spontaneous fluctuations.
Previous applications of fMRI in MS have limited analyses to specific regions of interest and were not designed to detect activation changes across the entire brain.13 Functional connectivity analyses using RS-fMRI permit the investigation of intrinsic brain activity across the whole brain and allow the identification of network connectivity between distant brain regions,14 especially in the default mode network (DMN).15 However, the results of abnormal functional connectivity between two remote areas do not allow for the determination of which brain area has abnormal spontaneous activity.16
The amplitude of low-frequency fluctuation (ALFF), an important component of RS-fMRI, is integrated in a low-frequency range and has been used to identify brain areas showing disturbances in blood-oxygen-level-dependent (BOLD) signal.17,18 Previously, it was shown that ALFF index measurements were highly reproducible with scan intervals up to 1 year in chronic and stable schizophrenia patients as well as healthy controls (HCs).19 Zuo et al20 also indicated a high degree of test–retest reliability for spontaneous low-frequency fluctuations within a low-frequency range and within four defined sections of narrow low-frequency bands. Indications of high test–retest reliability for the ALFF method makes this method a convenient and reliable index for RS-fMRI data analysis, with utility for the exploration of regional spontaneous brain activity abnormalities in various brain diseases.16 Recently, ALFF indices have been successfully employed for the study of sleep deprivation,12,21 primary insomnia,16 and obstructive sleep apnea.22 However, no study to date has evaluated disturbances in spontaneous regional brain activity in patients with relapsing–remitting MS (RRMS). In the current study, we used the ALFF method as an index to explore local functional alterations of regional brain activity in patients with RRMS relative to HCs. Moreover, we examined correlations between these findings and disability scores to evaluate the relevance of ALFF indices to the clinical manifestation of RRMS.
Patients and methods
Subjects
A total of 18 patients with RRMS (five males and 13 females; mean age, 35±10.68 years; mean education, 9.22±4.21 years) diagnosed according to the McDonald’s diagnostic criteria were recruited for this study. Prior to magnetic resonance imaging (MRI) examination, all subjects underwent a thorough physical examination using the Expanded Disability Status Scale (EDSS)23 conducted by an experienced neurologist. EDSS scores ranged from 0 to 10, where 0 indicated normal status and higher scores indicated more severe degrees of disability.
All subjects were right handed as measured by the Edinburgh inventory. The inclusion criteria for patients with RRMS were as follows: 1) mild-to-moderate disability (EDSS ≤5) to prevent the inclusion of confounding factors; 2) the absence of corticosteroid therapy or clinical relapse for at least 1 month prior to the study and during the study; 3) the absence of any sleep disorders or other psychiatric disorders according to the DSM-IV; and 4) the absence of evidence for any brain tumor, brain injury, or intracerebral hemorrhage on conventional MRI. Disease duration was recorded as the number of months from initial symptom onset date until the study MRI scan date. The mean disease duration in this study was 28.52±38.83 months. Demographic and clinical characteristics of the included patients with RRMS are presented in Table 1.
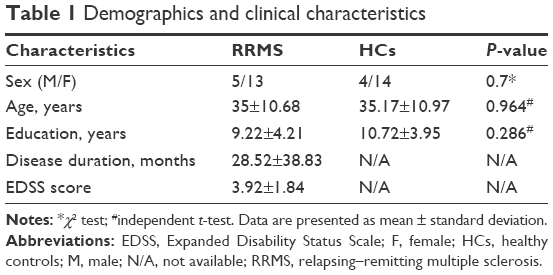 | Table 1 Demographics and clinical characteristics |
A total of 18 age-, sex-, and education-matched HCs (four males and 14 females; mean age, 35.17±10.97 years; mean education, 10.72±3.95 years) were recruited for this study. HCs had no history of neurological or psychiatric disorders, alcohol or drug abuse, sleep disorders, systemic illness, brain tumor, brain injury, or intracerebral hemorrhage. The study was approved by the Human Research Ethics Committee of the Affiliated Hospital of Zunyi Medical University. The purpose, potential risks, and methods of this study were explained to all subjects, and all subjects voluntarily provided informed consent form prior to study participation.
Parameters
MRI examinations were conducted using a 3 T magnetic resonance scanner (GE, USA) with the subject in a supine position. Three-dimensional T1-weighted images were collected with a gradient-recalled echo (GRE) sequence in a sagittal position. The parameters were as follows: repetition time =3,000 ms, thickness =1.0 mm, echo time =7.8 ms, gap =0 mm, field of view =256×256 mm, acquisition matrix =256×256, and flip angle =15°. Finally, 210 functional images with 33 axial slices that covered the whole brain were collected for each subject using a GRE planar imaging pulse sequence. The parameters of the functional session were as follows: repetition time =2,000 ms, thickness =4.0 mm, echo time =30 ms, gap =0 mm, field of view =240×240 mm, and acquisition matrix =64×64, and flip angle =90°.
fMRI data analysis
To exclude defective data, all MRI data were checked using MRIcro software (www.MRIcro.com).24 All MRI data were subjected to a Digital Imaging and Communications in Medicine (DICOM) form transformation. The first ten volumes of RS-fMRI images were discarded for each subject to allow for subject adaptation and account for the instability of initial MRI scanner signal. Using MATLAB2010a (Mathworks, Natick, MA, USA) and SPM8 (http://www.fil.ion.ucl.ac.uk/spm), the remaining 200 volumes were corrected for differences in slice times and were analyzed using Data Processing Assistant for RS-fMRI (DPARSFA; http://rfmri.org/DPARSF) toolbox. The time courses of head motion were collected by calculating the values of rotation (degrees) and translation (millimeter) for each volunteer. Subjects who showed >1.5 mm maximum translation in the x, y, or z planes or >1.5° of angular motion around the x, y, or z axes for any of the 200 volumes were excluded.
Three-dimensional T1-weighted images for each subject were co-registered to the mean of the realigned echo-planar imaging template and then segmented into GM, WM, and cerebrospinal fluid (CSF) using the Diffeomorphic Anatomical Registration Through Exponentiated Lie Algebra (DARTEL) segmentation. All the images were automatically transformed from the individual space into the Montreal Neurological Institute (MNI) space. Because MRI data are sensitive to micro-head motions in rotation (degrees) and translation (millimeter) in any direction (x, y, or z), the Friston 24-Parameter Model was applied to regress out head motion effects from the realigned data.25,26 We further characterized mean frame-wise displacement (FD), which considers voxel-wise differences in motion in its derivation, as a measure of micro-head motion for each subject.
fMRI images were resampled at a resolution of 3×3×3 mm. A linear regression was performed to remove signal from the WM, GM, CSF, mean time series of all voxels across the whole brain, and head motion parameters to minimize confounding factors.27 Of note, global signal was not regressed out as in previous studies16,28–30 due to the controversial nature of this omission.27,31 The time series for each voxel was temporally band-pass filtered (0.01–0.08 Hz) and linearly detrended to reduce low-frequency drift, cardiac noise, and physiological high-frequency respiratory artifacts. For each subject, we calculated ALFF values at each voxel. The details of the ALFF calculation are described in previous studies.16,22
Receiver operating characteristic (ROC) curve analyses
The ROC curve method has been widely used for identifying and comparing physiological biomarkers. Sensitivity is excellent when the area under the curve (AUC) value ranges from 0.9 to 1, while sensitivity is good when the AUC value is 0.8–0.9, fair when the AUC value is 0.7–0.8, poor if the value is 0.6–0.7, and failed when the value is 0.5–0.6.32,33 In previous studies, the ALFF index showed high degrees of sensitivity and specificity for distinguishing patients from HCs and may be useful for detecting early biological indicators of regional brain activity changes.12,16,22
Since different brain areas may have different utility for distinguishing patients with RRMS from the HCs,22 we extracted the beta values of brain areas of interest and used them to explore whether changes in these specific areas have the ability to distinguish patients with RRMS from HCs.
Brain–behavior correlations
Based on ALFF findings, the beta values of specific brain areas in patients with RRMS were extracted, and Pearson correlation analyses were applied to assess relationships between disease duration and EDSS score.
Statistical analysis
χ2 tests were used for categorical data, and two-sample t-tests were used for continuous data. The P-value <0.05 was considered to indicate statistically significant differences with two-tailed tests. All statistical analyses of demographic and clinical variables were conducted with IBM SPSS 21.0 software.
For ALFF results, two-sample t-tests were applied to analyze regional brain differences between patients with RRMS and HCs with sex, age, and education as nuisance covariates using SPM8. A corrected individual voxel P<0.01 with cluster size ≥40 was applied to assess statistical differences using an AlphaSim-corrected cluster threshold of P<0.05.
Results
ALFF differences
Compared with HCs, patients with RRMS showed higher ALFF responses in the right fusiform gyrus (Brodmann area [BA] 37) and lower ALFF responses in the bilateral anterior cingulate gyrus (BA 24 and 32), bilateral caudate head, and the cluster of the bilateral brainstem. The details of this analysis are shown in Table 2 and Figure 1.
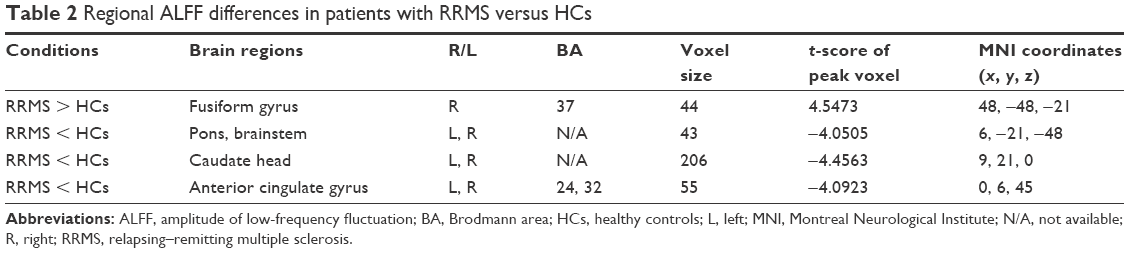 | Table 2 Regional ALFF differences in patients with RRMS versus HCs |
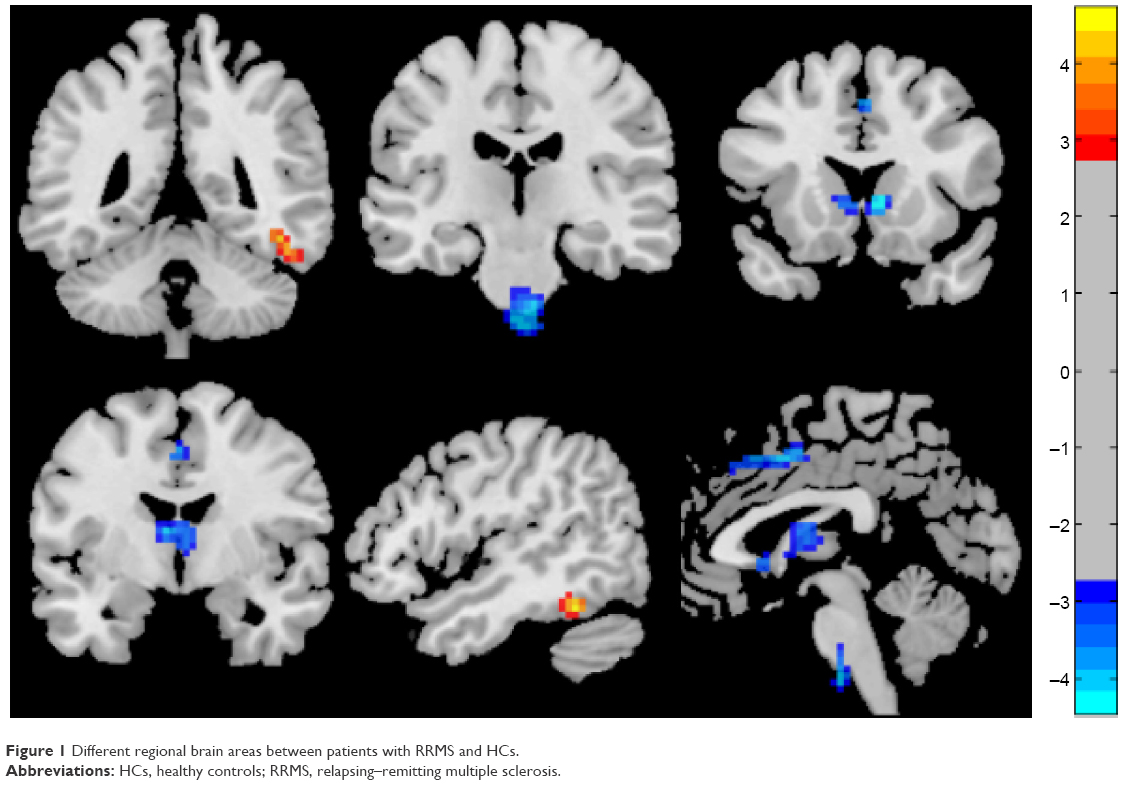 | Figure 1 Different regional brain areas between patients with RRMS and HCs. |
ROC findings
The mean beta values of specific clusters of interest were extracted and used for ROC curve analyses (Figure 2). ROC analyses revealed that, among ALFF areas of interest, one showed an excellent AUC value, two showed good AUC values, and one showed a fair AUC value. Further diagnostic analyses demonstrated that the mean beta values of these areas demonstrated high degrees of sensitivity and specificity. These findings indicate that regional ALFF indices could serve as good-to-excellent markers for distinguishing patients with RRMS from HCs. The details of these analyses are presented in Table 3 and Figure 3.
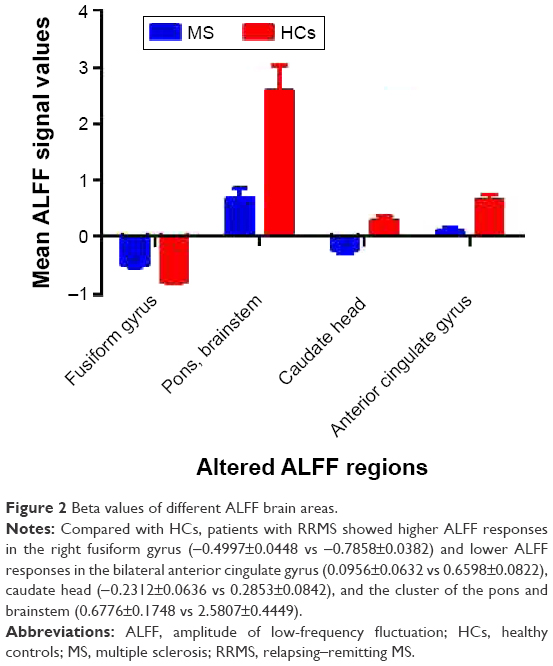 | Figure 2 Beta values of different ALFF brain areas. |
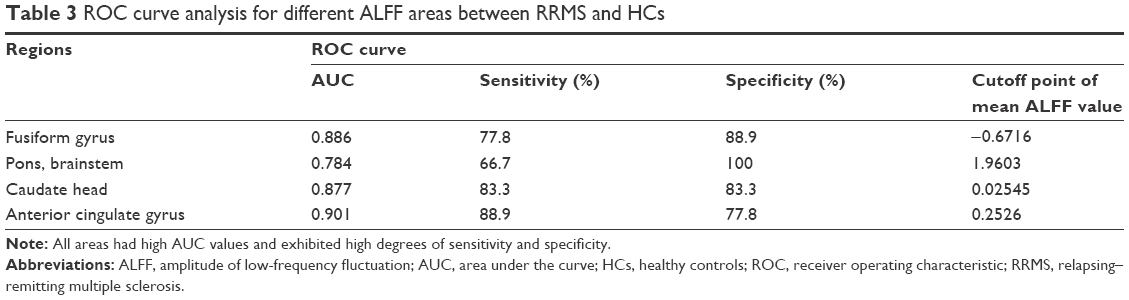 | Table 3 ROC curve analysis for different ALFF areas between RRMS and HCs |
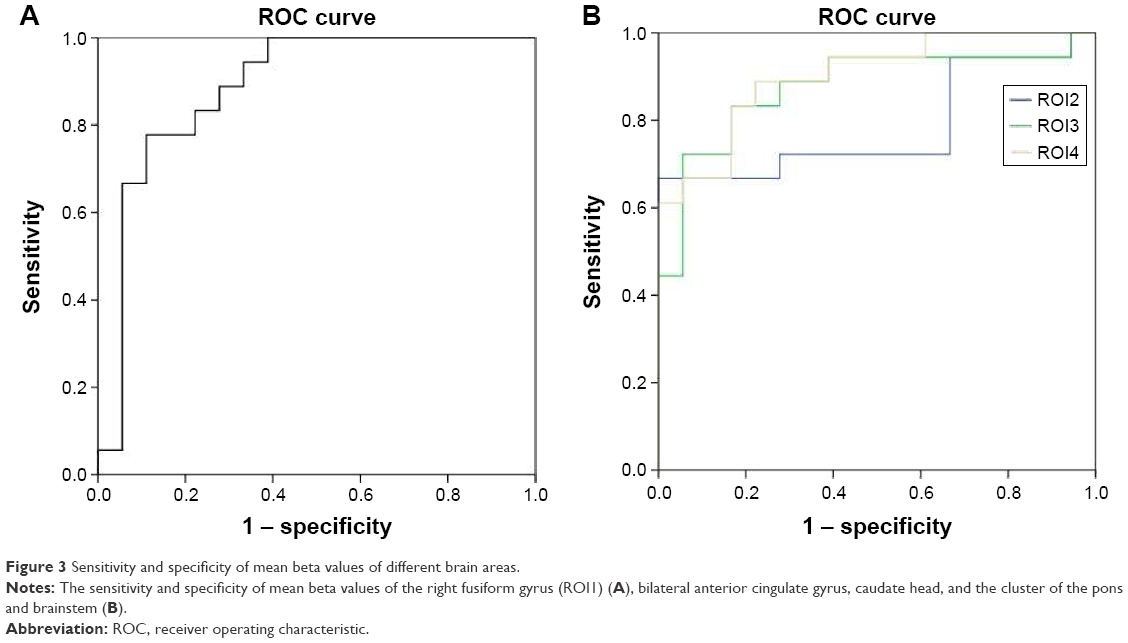 | Figure 3 Sensitivity and specificity of mean beta values of different brain areas. |
Pearson correlation analysis
In this study, EDSS score showed a significant negative Pearson correlation with the beta value of the caudate head (r=−0.474, P=0.047) as shown in Figure 4. There were no significant correlations between the beta values of different ALFF clusters and disease duration (P>0.05) or between EDSS score and any other ALFF cluster beta value (P>0.05).
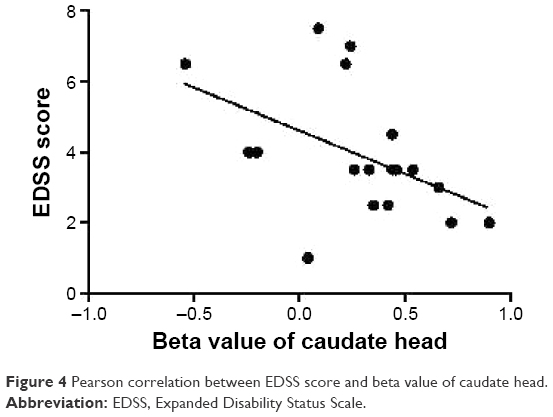 | Figure 4 Pearson correlation between EDSS score and beta value of caudate head. |
Discussion
In the current study, we used the RS ALFF method to investigate regional brain differences between patients with RRMS and HCs. We found that patients with RRMS showed higher ALFF responses in the right fusiform gyrus of temporal lobe and lower ALFF responses in the bilateral anterior cingulate gyrus, bilateral caudate head, and the cluster of the bilateral pons and brainstem; moreover, these observations preceded evidence of visible brain lesions on conventional MRI. Further, an ROC analysis indicated that ALFF areas of interest could effectively discriminate patients with RRMS from HCs with high degrees of sensitivity and specificity. Overall, these findings indicate that the ALFF method is useful for characterizing the neural mechanisms underlying RRMS and may be capable of detecting early biological indicators of RRMS, ie, alterations in the brain activity of relevant regions.
Previous studies have identified abnormal baseline brain activity prior to the appearance of brain lesions on T2-weighted imaging in RRMS.34 Other studies comparing patients with MS to HCs have shown, in addition to abnormal regional brain activity, alterations in fractional anisotropy values, mean diffusivity values, and functional connectivity in several brain areas, including the thalamus, visual system, motor system, and areas related to advanced cognitive function.35–42 In support of these findings, the current study identified the abovementioned differences in ALFF responses between patients with RRMS and HCs. Another previous study found smaller GM volumes in the left frontotemporal cortex, bilateral caudate nuclei, and bilateral anterior cingulate gyrus in patients with RRMS versus HCs and furthermore identified selective correlations between these brain areas and the lesion load of caudate atrophy.43 In the current study, we found that EDSS score was negatively correlated with the beta value of the caudate head (r=−0.474, P=0.047). These findings provide a novel insight into the pathogenic mechanism of RRMS which, in particular, highlights the role of the caudate nucleus.
The basal ganglia play a role in both motor and advanced cognitive function. Some evidence suggests that cardiorespiratory fitness is associated with the GM volume of the basal ganglia.44,45 In line with this hypothesis, patients with MS with higher levels of cardiorespiratory fitness were shown to have larger basal ganglia volumes, including in the caudate, putamen, and pallidum.46 The progressive decline of anterograde memory function has been increasingly recognized as a frequent symptom in chronic MS. Previous studies have demonstrated an association between MS and poor cognitive performances,42,47 and pediatric patients with MS were shown to have early maladaptive plasticity contributing to cognitive impairments.48 Accordingly, increasing evidence exists for the beneficial effects of aerobic exercise training on motor and cognitive outcomes in MS and on the volumes of basal ganglia components.49,50 In support of this concept, our study identified low ALFF responses in the bilateral caudate head in patients with RRMS, which is consistent with the previous finding that the normalized bicaudate volume was 19% lower in patients with RRMS relative to HCs.51 Overall, these findings suggest that caudate pathology underlies impairments in cognitive performance in RRMS and that cardiorespiratory fitness should be an important therapeutic goal to address these deficits.
Purely intracortical lesions represent up to 24% of the total lesion load in MS,52 with lesions also occurring in the cingulate gyrus53 associated with axonal transection, demyelination, apoptotic loss of neurons, and dendritic transection.54 Brainin et al55 showed extensive lesions in the WM of the anterior cingulate gyrus in patients with MS, whereas Terroni et al56 found that cingulate cortex dysfunction was an important factor related to working memory impairments in patients with stroke. Abnormal functional connectivity between the hippocampus and the thalamus, anterior cingulate gyrus, and prefrontal cortex has already been identified and related to impaired spatial memory function in patients with MS.57 Accordingly, dysfunction of the bilateral anterior cingulate gyrus may underlie the impairments in working memory in patients with MS.
Conclusion
Our study demonstrated that ALFF indices in key brain regions may serve as early biological indicators of abnormal regional spontaneous brain activity in RRMS, which is observed prior to visible brain lesions on conventional MRI. The current study provided important information in order to understand the underlying neural mechanisms of RRMS pathology, and also provided insights into the relationship between RRMS and abnormal baseline brain activity and can serve as a reference for task-related fMRI studies to enable a more comprehensive understanding of the pathophysiology of RRMS. However, we did not use fatigue or other measures in the assessment; future studies should perform more measures to assess the clinical characteristics of the RRMS.
Acknowledgment
This work was supported by grants from the Science and Technology Department of Guizhou Province (qiankehe J zi LKZ [2012] No 22).
Disclosure
The authors report no conflicts of interest in this work.
References
Vercellino M, Masera S, Lorenzatti M, et al. Demyelination, inflammation, and neurodegeneration in multiple sclerosis deep gray matter. J Neuropathol Exp Neurol. 2009;68(5):489–502. | ||
Minagar A, Barnett MH, Benedict RH, et al. The thalamus and multiple sclerosis modern views on pathologic, imaging, and clinical aspects. Neurology. 2913;80(2):210–219. | ||
Nelson F, Akhtar MA, Zúñiga E, et al. Novel fMRI working memory paradigm accurately detects cognitive impairment in multiple sclerosis. Mult Scler. Epub 2016 Sep 9. | ||
Khavari R, Karmonik C, Shy M, Fletcher S, Boone T. Functional magnetic resonance imaging with concurrent urodynamic testing identifies brain structures involved in micturition cycle in patients with multiple sclerosis. J Urol. Epub 2016 Sep 21. | ||
Filippi M, Rovaris M, Rocca MA. Imaging primary progressive multiple sclerosis: the contribution of structural, metabolic, and functional MRI techniques. Mult Scler. 2014;10(Suppl 1):S36–S44. | ||
Tintore M, Rovira A. MRI criteria distinguishing seropositive NMO spectrum disorder from MS. Neurology. 2013;80(14):1336. | ||
Bakshi R, Thompson AJ, Rocca MA, et al. MRI in multiple sclerosis: current status and future prospects. Lancet Neurol. 2008;7(7):615–625. | ||
Filippi M, Rocca MA. Functional MR imaging in multiple sclerosis. Neuroimaging Clin N Am. 2009;19(1):59–70. | ||
Filippi M, Riccitelli G, Mattioli F, et al. Multiple sclerosis: effects of cognitive rehabilitation on structural and functional MR imaging measures-an explorative study. Radiology. 2012;262(3):932–940. | ||
Buzsaki G, Draguhn A. Neuronal oscillations in cortical networks. Science. 2004;304(5679):1926–1929. | ||
Zhang Z, Liu Y, Jiang T, et al. Altered spontaneous activity in Alzheimer’s disease and mild cognitive impairment revealed by regional homogeneity. Neuroimage. 2012;59(2):1429–1440. | ||
Dai XJ, Liu CL, Gong HH, et al. Long-term sleep deprivation decreases the default spontaneous activity and connectivity pattern in healthy male subjects: a resting-state fMRI study. Neuropsychiatr Dis Treat. 2015;11:761–772. | ||
Wegner C, Filippi M, Korteweg T, et al. Relating functional changes during hand movement to clinical parameters in patients with multiple sclerosis in a multi-centre fMRI study. Eur J Neurol. 2008;15(2):113–122. | ||
Greicius MD, Supekar K, Menon V, Dougherty RF. Resting state functional connectivity reflects structural connectivity in the default mode network. Cereb Cortex. 2009;19(1):72–78. | ||
Buckner R, Andrews-Hanna J, Schacter D. The brain’s default network: anatomy, function, and relevance to disease. Ann N Y Acad Sci. 2008;1124:1–38. | ||
Dai XJ, Nie X, Liu X, et al. Gender differences in regional brain activity in patients with chronic primary insomnia: evidence from a resting-state fMRI study. J Clin Sleep Med. 2016;12(3):363–374. | ||
Zang YF, He Y, Zhu CZ, et al. Altered baseline brain activity in children with ADHD revealed by resting-state functional MRI. Brain Dev. 2007;29(2):83–91. | ||
Lu H, Zuo Y, Gu H, et al. Synchronized delta oscillations correlate with the resting-state functional MRI signal. Proc Natl Acad Sci U S A. 2007;104(46):18265–18269. | ||
Turner JA, Chen H, Mathalon DH, et al. Reliability of the amplitude of low-frequency fluctuations in resting state fMRI in chronic schizophrenia. Psychiatry Res. 2012;201(3):253–255. | ||
Zuo XN, Di Martino A, Kelly C, et al. The oscillating brain: complex and reliable. Neuroimage. 2010;49(2):1432–1445. | ||
Dai XJ, Min YJ, Gong HH, et al. Evaluation of the post-effect of acupuncture at Sanyinjiao (SP 6) under sleep deprivation by resting-state amplitude of low-frequency fluctuation: a fMRI study. Zhongguo Zhen Jiu. 2012;32(1):47–52. | ||
Li HJ, Dai XJ, Gong HH, Nie X, Zhang W, Peng DC. Aberrant spontaneous low-frequency brain activity in male patients with severe obstructive sleep apnea revealed by resting-state functional MRI. Neuropsychiatr Dis Treat. 2015;11:207–214. | ||
Kurtzke JF. Rating neurologic impairment in multiple sclerosis: an expanded disability status scale (EDSS). Neurology. 1983;33(11):1444–1452. | ||
Dai XJ, Gong HH, Wang YX, et al. Gender differences in brain regional homogeneity of healthy subjects after normal sleep and after sleep deprivation: a resting-state fMRI study. Sleep Med. 2012;13(6):720–727. | ||
Satterthwaite TD, Elliott MA, Gerraty RT, et al. An improved framework for confound regression and filtering for control of motion artifact in the preprocessing of resting-state functional connectivity data. Neuroimage. 2013;64:240–256. | ||
Yan CG, Cheung B, Kelly C, et al. A comprehensive assessment of regional variation in the impact of head micromovements on functional connectomics. Neuroimage. 2013;76:183–201. | ||
Fox MD, Snyder AZ, Vincent JL, Corbetta M, Van Essen DC, Raichle ME. The human brain is intrinsically organized into dynamic, anticorrelated functional networks. Proc Natl Acad Sci U S A. 2005;102(27):9673–9678. | ||
Nie X, Shao Y, Liu SY, et al. Functional connectivity of paired default mode network subregions in primary insomnia. Neuropsychiatr Dis Treat. 2015;11:3085–3093. | ||
Dai XJ, Peng DC, Gong HH, et al. Altered intrinsic regional brain spontaneous activity and subjective sleep quality in patients with chronic primary insomnia: a resting-state fMRI study. Neuropsychiatr Dis Treat. 2014;10:2163–2175. | ||
Peng DC, Dai XJ, Gong HH, Li HJ, Nie X, Zhang W. Altered intrinsic regional brain activity in male patients with severe obstructive sleep apnoea: a resting-state functional magnetic resonance imaging study. Neuropsychiatr Dis Treat. 2014;10:1819–1826. | ||
Saad ZS, Gotts SJ, Murphy K, et al. Trouble at rest: how correlation patterns and group differences become distorted after global signal regression. Brain Connect. 2012;2(1):25–32. | ||
Huang X, Zhong YL, Zeng XJ, et al. Disturbed spontaneous brain activity pattern in patients with primary angle-closure glaucoma using amplitude of low-frequency fluctuation: a fMRI study. Neuropsychiatr Dis Treat. 2015;11:1877–1883. | ||
El Khouli RH, Macura KJ, Barker PB, Habba MR, Jacobs MA, Bluemke DA. Relationship of temporal resolution to diagnostic performance for dynamic contrast enhanced MRI of the breast. J Magn Reson Imaging. 2009;30(5):999–1004. | ||
Liu Y, Meng B, Zeng C, et al. Abnormal baseline brain activity in patients with multiple sclerosis with simple spinal cord involvement detected by resting-state functional magnetic resonance imaging. J Comput Assist Tomogr. 2015;39(6):866–875. | ||
Zhou F, Zhuang Y, Wu L, et al. Increased thalamic intrinsic oscillation amplitude in relapsing-remitting. Clin Imaging. 2014;38(5):605–610. | ||
Liu Y, Duan Y, Huang J, et al. Multimodal quantitative MR imaging of the thalamus in multiple sclerosis and neuromyelitis optica. Radiology. 2015;277(3):784–792. | ||
Dogonowski AM, Andersen KW, Madsen KH, et al. Multiple sclerosis impairs regional functional connectivity in the cerebellum. Neuroimage Clin. 2013;4:130–138. | ||
Dogonowski AM, Siebner HR, Soelberg P, et al. Expanded functional coupling of subcortical nuclei with the motor resting-state network in multiple sclerosis. Mult Scler. 2012;19(5):559–566. | ||
Lowe MJ, Phillips MD, Lurito JT, Mattson D, Dzemidzic M, Matthews VP. Multiple sclerosis: low-frequency temporal blood oxygen level-dependent fluctuations indicate reduced functional connectivity initial results. Radiology. 2002;224(1):184–192. | ||
Roosendaal SD, Schoonheim MM, Hulst HE, et al. Resting state networks change in clinically isolated syndrome. Brain. 2010;133(Pt 6):1612–1621. | ||
Rocca MA, Valsasina P, Absinta M, et al. Default-mode network dysfunction and cognitive impairment in progressive MS. Neurology. 2010;74(16):1252–1259. | ||
Hawellek DJ, Hipp JF, Lewis CM, Corbetta M, Engel AK. Increased functional connectivity indicates the severity of cognitive impairment in multiple sclerosis. Proc Natl Acad Sci U S A. 2011;108(47):19066–19071. | ||
Prinster A, Quarantelli M, Orefice G, et al. Grey matter loss in relapsing-remitting multiple sclerosis: a voxel-based morphometry study. Neuroimage. 2006;29(3):859–867. | ||
Chaddock L, Erickson KI, Prakash RS, et al. Basal ganglia volume is associated with aerobic fitness in preadolescent children. Dev Neurosci. 2010;32(3):249–256. | ||
Verstynen TD, Lynch B, Miller DL, et al. Caudate nucleus volume mediates the link between cardiorespiratory fitness and cognitive flexibility in older adults. J Aging Res. 2012;2012:939285. | ||
Motl RW, Pilutti LA, Hubbard EA, Wetter NC, Sosnoff JJ, Sutton BP. Cardiorespiratory fitness and its association with thalamic, hippocampal, and basal ganglia volumes in multiple sclerosis. Neuroimage Clin. 2015;7:661–666. | ||
Schoonheim MM, Geurts JJ, Landi D, et al. Functional connectivity changes in multiple sclerosis patients: a graph analytical study of MEG resting state data. Hum Brain Mapp. 2013;34(1):52–61. | ||
Cirillo S, Rocca MA, Ghezzi A, et al. Abnormal cerebellar functional MRI connectivity in patients with paediatric multiple sclerosis. Mult Scler. 2016;22(3):292–301. | ||
Batista S, Zivadinov R, Hoogs M, et al. Basal ganglia, thalamus and neocortical atrophy predicting slowed cognitive processing in multiple sclerosis. J Neurol. 2012;259(1):139–146. | ||
Schoonheim MM, Popescu V, Rueda Lopes FC, et al. Subcortical atrophy and cognition: sex effects in multiple sclerosis. Neurology. 2012;79(17):1754–1761. | ||
Bermel RA, Innus MD, Tjoa CW, Bakshi R. Selective caudate atrophy in multiple sclerosis: a 3D MRI parcellation study. Neuroreport. 2003;14(3):335–339. | ||
Kidd D, Barkhof F, McConnell R, Algra PR, Allen IV, Revesz T. Cortical lesions in multiple sclerosis. Brain. 1999;122(Pt 1):17–26. | ||
Bo L, Vedeler CA, Nyland HI, Trapp BD, Mork SJ. Subpial demyelination in the cerebral cortex of multiple sclerosis patients. J Neuropathol Exp Neurol. 2003;62(7):723–732. | ||
Peterson JW, Bo L, Mork S, Chang A, Trapp BD. Transected neurites, apoptotic neurons, and reduced inflammation in cortical multiple sclerosis lesions. Ann Neurol. 2001;50(3):389–400. | ||
Brainin M, Goldenberg G, Ahlers C, Reisner T, Neuhold A, Deecke L. Structural brain correlates of anterograde memory deficits in multiple sclerosis. J Neurol. 1988;235(6):362–365. | ||
Terroni L, Amaro E, Iosifescu DV, et al. Stroke lesion in cortical neural circuits and post-stroke incidence of major depressive episode: a 4-month prospective study. World J Biol Psychiatry. 2011;12(7):539–548. | ||
Roosendaal SD, Hulst HE, Vrenken H, et al. Structural and functional hippocampal changes in multiple sclerosis patients with intact memory function. Radiology. 2010;255(2):595–604. |
 © 2016 The Author(s). This work is published and licensed by Dove Medical Press Limited. The
full terms of this license are available at https://www.dovepress.com/terms
and incorporate the Creative Commons Attribution
- Non Commercial (unported, 3.0) License.
By accessing the work you hereby accept the Terms. Non-commercial uses of the work are permitted
without any further permission from Dove Medical Press Limited, provided the work is properly
attributed. For permission for commercial use of this work, please see paragraphs 4.2 and 5 of our Terms.
© 2016 The Author(s). This work is published and licensed by Dove Medical Press Limited. The
full terms of this license are available at https://www.dovepress.com/terms
and incorporate the Creative Commons Attribution
- Non Commercial (unported, 3.0) License.
By accessing the work you hereby accept the Terms. Non-commercial uses of the work are permitted
without any further permission from Dove Medical Press Limited, provided the work is properly
attributed. For permission for commercial use of this work, please see paragraphs 4.2 and 5 of our Terms.