Back to Journals » Nature and Science of Sleep » Volume 12
Fruit and Vegetable Consumption is Protective from Short Sleep and Poor Sleep Quality Among University Students from 28 Countries
Received 21 May 2020
Accepted for publication 6 July 2020
Published 26 August 2020 Volume 2020:12 Pages 627—633
DOI https://doi.org/10.2147/NSS.S263922
Checked for plagiarism Yes
Review by Single anonymous peer review
Peer reviewer comments 2
Editor who approved publication: Dr Sutapa Mukherjee
Supa Pengpid,1,2 Karl Peltzer3
1ASEAN Institute for Health Development, Mahidol University, Salaya, Nakhon Pathom, Thailand; 2Department of Research Administration and Development, University of Limpopo, Turfloop, Mankweng, South Africa; 3Department of Psychology, University of the Free State, Bloemfontein, South Africa
Correspondence: Karl Peltzer
University of the Free State, Bloemfontein, South Africa
Email [email protected]
Introduction: The aim of the study was to investigate the association between fruit and vegetable (FV) consumption and sleep duration and sleep quality in university students.
Methods: Using a cross-sectional study design, 21,027 university students with a median age of 20 years from 28 countries replied to self-reported measures of FV consumption and sleep duration and quality.
Results: The prevalence of short and long sleep was 38.9% and 12.8%, respectively, and the prevalence of poor sleep quality was 9.6% and restless sleep 19.7%. There was a linear decrease in the prevalence of short sleep with increasing FV consumption beyond ≥ 2 FV servings/day (vs 0– 1 FV servings/day). Consuming 2 FV servings/day (vs 0– 1 FV servings/day) was associated with a 21% decreased (ARRR: 0.79, 95% CI: 0.70– 0.80) and 7 or more FV servings/day with a 33% decreased odds (ARRR: 0.67, 95% CI: 0.55– 0.81) for short sleep. Consuming 5 FV servings/day (vs 0– 1 FV servings/day) was associated with a 34% decreased (ARRR: 0.79, 95% CI: 0.51– 0.84) and 7 or more FV servings/day with a 34% decreased odds (ARRR: 0.66, 95% CI: 0.50– 0.88) for long sleep. In the final adjusted logistic regression model, consuming 3 FV servings/day (vs 0– 1 FV servings/day) was associated with a 49% decreased (AOR: 0.51, 95% CI: 0.42– 0.0.62) and 7 or more FV servings/day with a 30% decreased odds (AOR: 0.70, 95% CI: 0.53– 0.93) for poor sleep quality. Consuming 5 FV servings/day (vs 0– 1 FV servings/day) was associated with a 34% decreased odds (AOR: 0.66, 95% CI: 0.54– 0.81) for restless sleep.
Conclusion: The study extended previous findings of an association between inadequate FV consumption and short sleep and an inverse association between FV consumption and poor sleep quality and restless sleep.
Keywords: fruit and vegetable consumption, sleep duration, sleep quality, university students
Introduction
Sleep health includes sleep duration and sleep quality.1 “Both short sleepers (≤6 h) and long sleepers (≥9 h) are at increased risk of all-cause mortality.”2 University students appear to be prone to short sleep and poor sleep quality, eg, the prevalence of short (≤6 h) and long (≥9 h) sleep was 39.2% and 13.9%, respectively,3 and the prevalence of poor sleep quality was 10.4%.4
The health benefits of FV consumption “led to the recommended intake of at least 400 g of fruit and vegetables (or 5 servings) per day”5 and an increase up to 600 g per day could significantly reduce the burden of disease globally.6 In a multi-country study, “82.8% of the university students consumed less than the recommended five servings of fruits and/or vegetables (FV).”7 A recent review8 provided epidemiological evidence in adults that “sleep duration is non-linearly associated with FV consumption with short and long sleepers consuming less FV.” Fewer studies are found an association between FV intake and better sleep quality.9–12 Studies investigating the relationship between FV consumption and sleep duration and sleep quality have for the most part been done in high-income countries. Therefore, the study aimed to assess the association between FV consumption and sleep duration and sleep quality in university students, predominantly coming from low and middle-income countries.
Methods
Sample and Procedure
The cross-sectional study comprised 21,027 college or university students with a median age of 20 years (interquartile range =3 years) with complete FV consumption data from 28 countries (Asia: Bangladesh, China, India, Indonesia, Kyrgyzstan, Laos, Malaysia, Myanmar, Pakistan, Philippines, Russia, Singapore, Thailand, Turkey, and Vietnam; Africa: Cameroon, Egypt, Ivory Coast, Madagascar, Mauritius, Namibia, Nigeria, South Africa and Tunisia; Americas: Barbados, Columbia, Grenada, Jamaica and Venezuela). Sampling and study procedures have been described previously.13 “Briefly, in each study country, one or two universities were purposefully selected.”13 The study was initiated through personal, academic contacts of the principal investigators; thus “in each university, research assistants administered a questionnaire and anthropometric measurements to all students in classrooms selected in 2013–2015.”13
The participants were identified using a quasi-random selection process, which entailed randomly selecting one department from each University faculty, and a random selection was then made from an ordered list of all undergraduate courses offered within the selected department.13
Trained research assistants then described the study to students within the selected undergraduate class to recruit participants. The inclusion criterion was being present in class at the time of recruitment.13
The consent form included a written justification of the study and contact details of the local principal investigator were provided in order to respond to any questions or personal concerns. Trained research assistants administered the paper-based self-administered questionnaire and made sure that each student had privacy when filling in the questionnaire. Privacy was also maintained when taking anthropometric measurements. The consent forms and the questionnaires (without identifying information) were collected separately and placed in different boxes in the front of the rooms. Participation rates were in most countries over 90%, except for 73% in Myanmar and 69% in Indonesia.13
For the population survey, the expected frequency of 50% (maximum possible percentage of students with positive and negative health behaviors), design effect 1 (in calculation used given the ratio of the actual variance, under the sampling method, to the variance computed under the assumption of simple random sampling), confidence limited 5%, cluster 1, form this confidence limited 5% key in to calculating formula, will get outcome of sample size calculated for seven confidence levels, the researchers chose sample size for confidence of 99%, the minimum sample size is 663. To prevent incomplete data, the sample size was increased to 800. (400 male, 400 female)14
Measures
FV Consumption
1) “How many servings [80 grams] of fruit do you eat on a typical day?” and 2) “How many servings [80 grams] of vegetables do you eat on a typical day?”15
Sleep Duration
“On average, how many hours of sleep do you get in a 24 h period?” “Responses were divided into three categories: short sleep (≤6 h), reference category (7–8 h), and long sleep (≥9 h).”3
Sleep Quality
Overall in the last 30 days, how much of a problem did you have with sleeping, such as falling asleep, waking up frequently during the night, or waking up too early in the morning? Response options ranged from 1 (none) to 5. (extreme/cannot do)
Poor sleep quality included “severe or extreme/cannot do.”4
Restless Sleep
“Much of the time in the past week, your sleep was restless?” Response option ranged from “1=rarely (<1 day) to 4= most (5–7 days)”. Restless sleep was defined as “much (3–4 days) or most (5–7 days)”16
Socio-demographic information comprised gender, age, subjective wealth status and country income.
Self-Reported Health Status
“In general, would you say that your health is … excellent, very good, good, fair or poor?” “Poor health” was defined as “fair or poor health”.17
Overweight or obesity was determined based on measured (except for in Hong Kong, China, by self-report) body mass index (BMI) and defined as ≥23.0 kg/m2 in South and East Asian countries18 and ≥25.0 kg/m2 in the other countries.19
Physical activity was measured using the “International Physical Activity Questionnaire (IPAQ) short form,”20 and physical activity levels were defined following IPAQ guidelines.21
Tobacco use was defined as currently using “tobacco products (cigarettes, snuff, chewing tobacco, cigars, etc.).”22
Binge Drinking (Past-Month)
“How often do you have (for men) five or more and (for women) four or more drinks on one occasion?”23
Other Dietary Items Comprised
1) “avoiding foods containing fat and cholesterol (Yes, No)”, and 2) “frequency of eating red meat (daily, 2–3 times a week, once a week, less than once a week, never).”24
Data Analysis
“STATA software version 14.0 (Stata Corporation, College Station, TX, USA)” was used for data analysis. The sample was described by calculating frequencies, means, and standard deviations. Multinomial and ordinary logistic regression was utilized to identify the independent contribution of FV consumption with sleep duration (short and long, and normal as reference category), poor sleep quality and restless sleep, in Model 1: unadjusted, in Model 2 adjusted for background indicators (age, sex, subjective economic status, and country income) and in Model 3 adjusted for background indicators (age, sex, subjective economic status, and country income) and health-related variables (self-rated health status, general overweight or obesity, physical activity, tobacco use, binge drinking, and two dietary items). Multi-collinearity was checked and found not an issue. Due to the clustered nature of the data, country was entered in the survey command. Missing values were excluded from the analysis. P<0.05 was seen as significant.
Results
Sample Characteristics
The study sample comprised 21,027 university students, the mean age was 20.7% (SD=2.9), 59.2% were female and 40.8% male. Half of the students (50.5%) considered themselves to be coming from a wealthy background, 51.6% were living in low-income or in lower middle-income countries, 7.5% rated their health status as poor and 23.1% were overweight or obese. Almost two in five students (38.5%) reported low physical activity, 11.8% current tobacco use, 10.6% current binge drinking, 39.2% avoided eating fat and cholesterol and 48.1% had daily red meat.
The prevalence of short and long sleep was 38.9% and 12.8%, respectively, and the prevalence of poor sleep quality was 9.6% and restless sleep 19.7%. Sleep duration seem to increase from 6.99 hours a day with 0 servings of FV a day in a linear fashion from to 7.17 hours a day and 7.14 hours a day with 6 and 7 servings of FV per day. The prevalence of short sleep decreased with an increase of FV consumption, in a linear trend. The prevalence of long sleep duration seems to represent an inverse curvilinear relationship, with a higher prevalence with low (0–1) and high (5–7) servings of FV consumption, and a lower prevalence with two to four servings of FV consumption. Poor sleep quality and restless sleep decreased with increasing FV consumption (see Table 1).
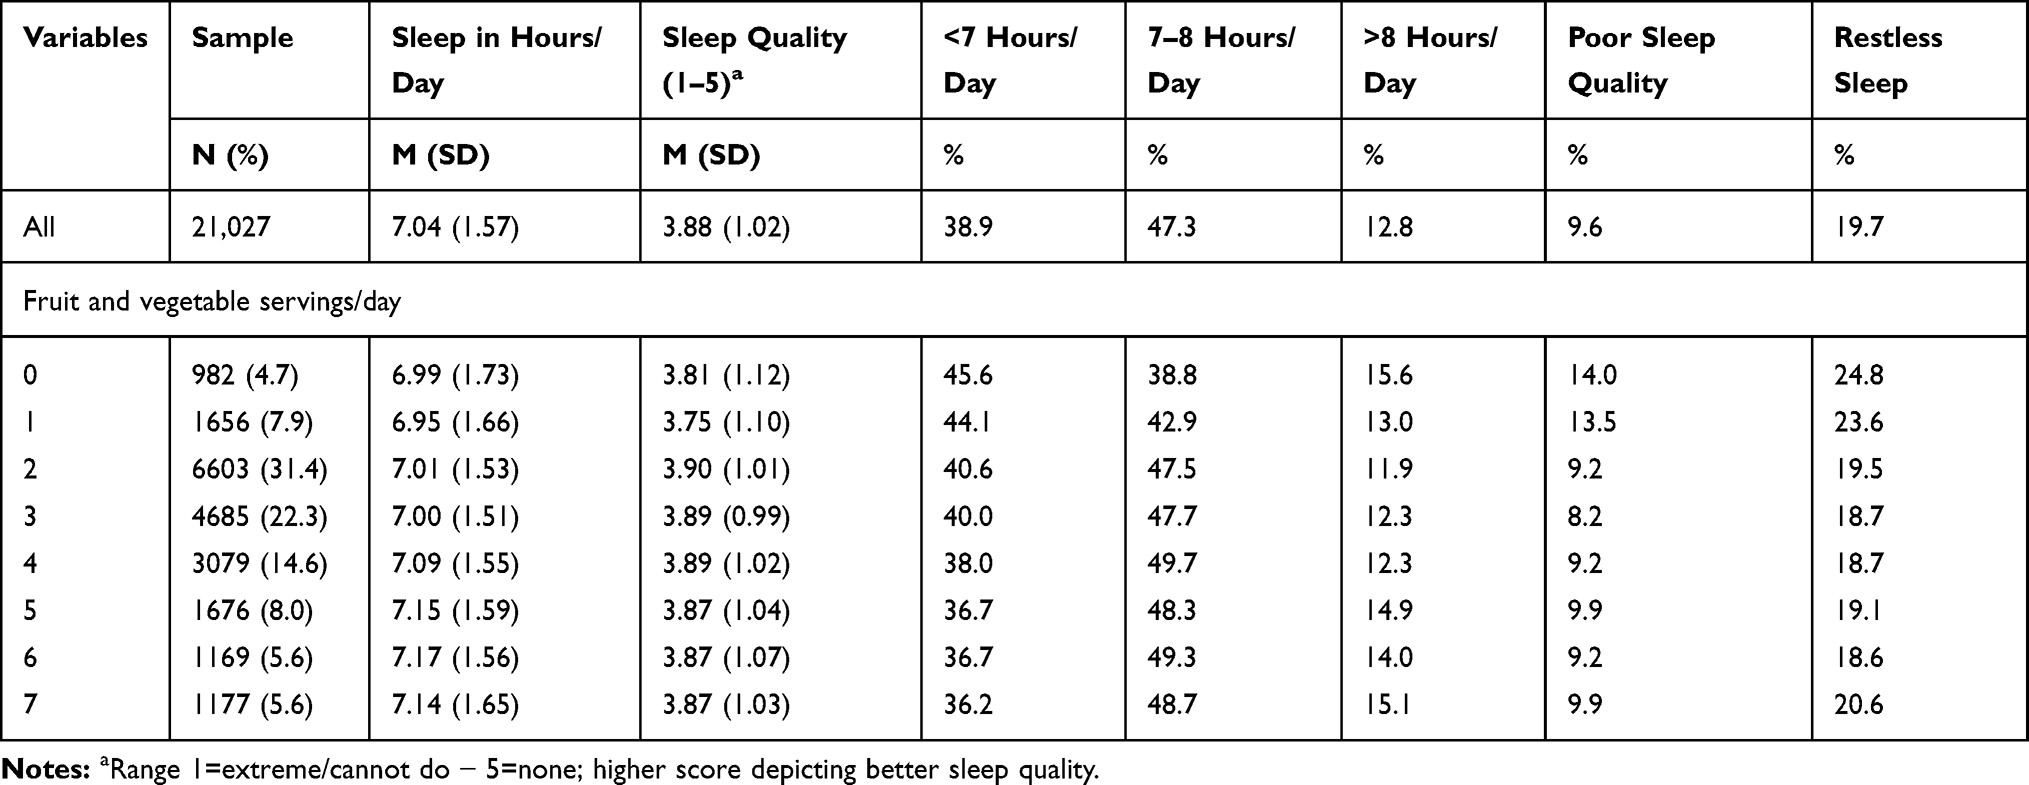 |
Table 1 Descriptive Statistics of Fruit and Vegetable Consumption in Relation to Sleep Indicators |
Associations Between FV Consumption with Short and Long Sleep Duration
In the final adjusted multinomial logistic regression model, there was a linear decrease in the prevalence of short sleep with increasing FV consumption beyond ≥2 FV servings/day (vs 0–1 FV servings/day). Consuming 2 FV servings/day (vs 0–1 FV servings/day) was associated with a 21% decreased (ARRR: 0.79, 95% CI: 0.70–0.80) and 7 or more FV servings/day with a 33% decreased odds (ARRR: 0.67, 95% CI: 0.55–0.81) for short sleep. Consuming 5 FV servings/day (vs 0–1 FV servings/day) was associated with a 34% decreased (ARRR: 0.79, 95% CI: 0.51–0.84) and 7 or more FV servings/day with a 34% decreased odds (ARRR: 0.66, 95% CI: 0.50–0.88) for long sleep (see Table 2).
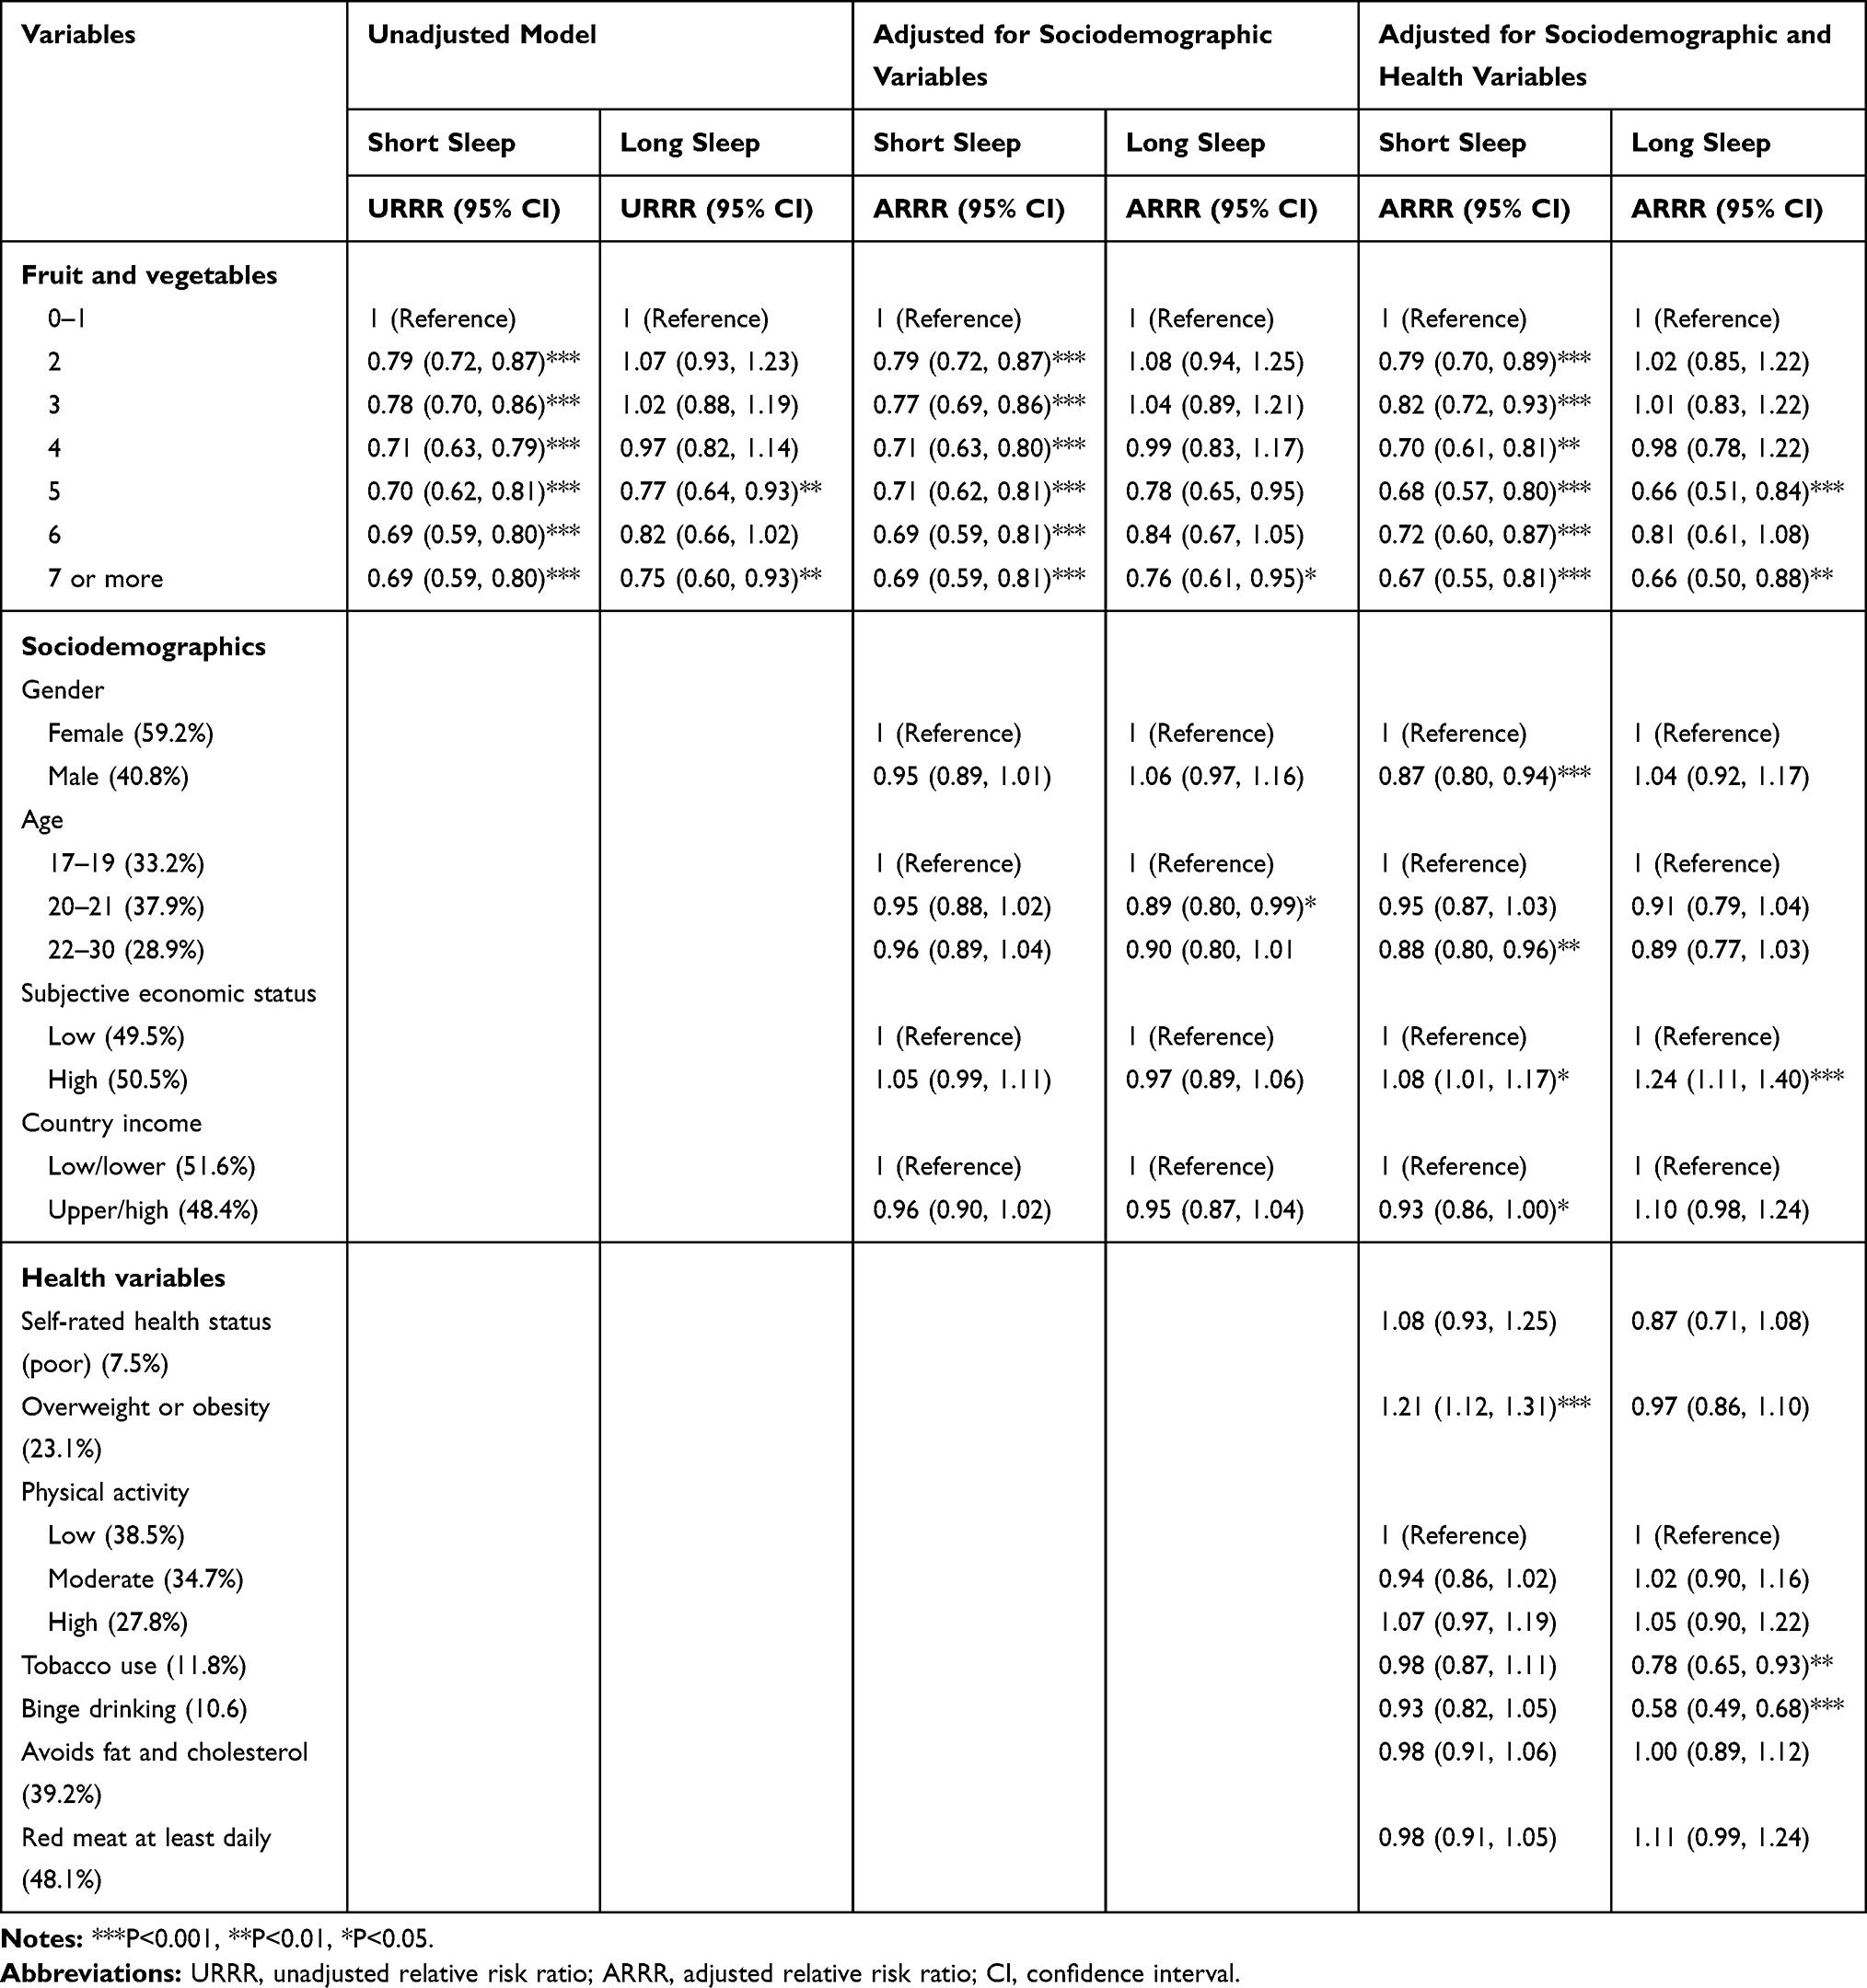 |
Table 2 Multinomial Logistic Regression with Short and Long Duration (with 7–8 Hours Sleep as Reference Category) |
Associations Between FV Consumption with Restless Sleep and Poor Sleep Quality
In the final adjusted logistic regression model, consuming 3 FV servings/day (vs 0–1 FV servings/day) was associated with a 49% decreased (AOR: 0.51, 95% CI: 0.42–0.0.62) and 7 or more FV servings/day with a 30% decreased odds (AOR: 0.70, 95% CI: 0.53–0.93) for poor sleep quality. Consuming 5 FV servings/day (vs 0–1 FV servings/day) was associated with a 34% decreased odds (AOR: 0.66, 95% CI: 0.54–0.81) for restless sleep (see Table 3).
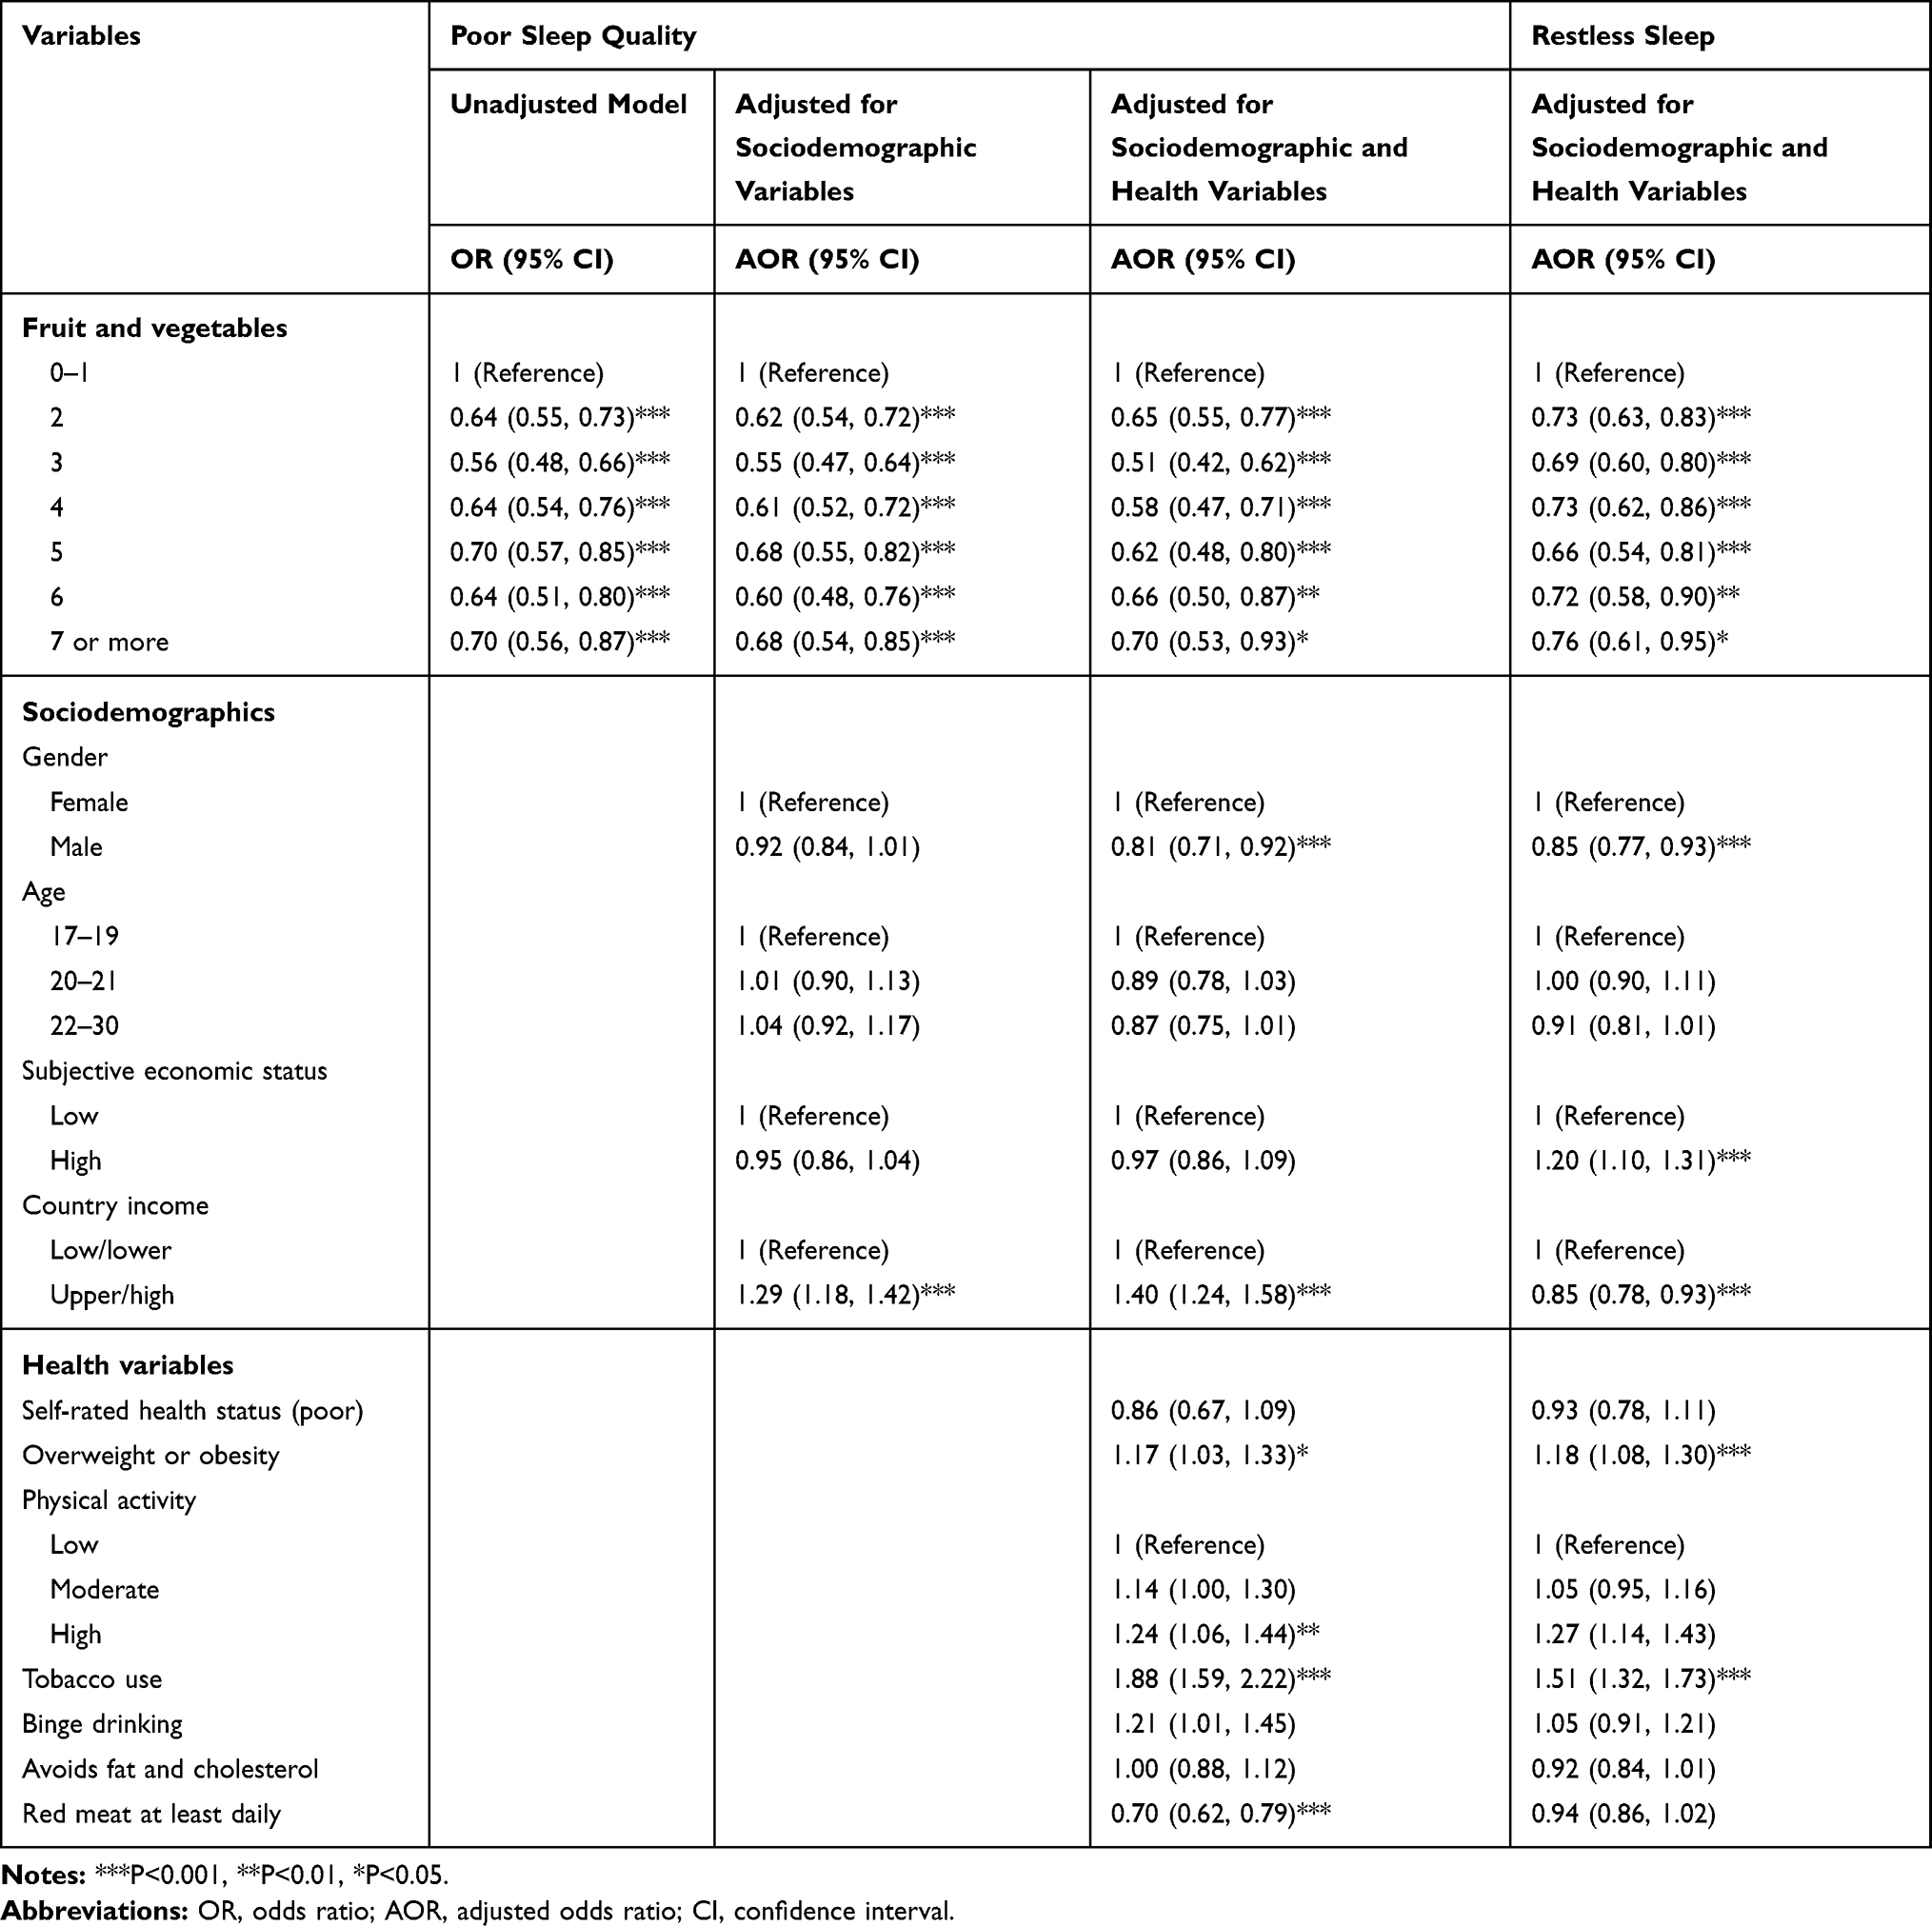 |
Table 3 Logistic Regression with Poor Sleep Quality and Restless Sleep |
Discussion
The study extended previous findings8 of an association between inadequate FV consumption and short sleep to an emerging adult population in predominantly low- and middle-income countries. However, contrary to previous results8 the association between FV consumption and sleep duration, short sleep, poor sleep quality and restless sleep was linear. Only a slight non-linear association was observed between FV consumption with long sleepers, which was found previously.8 Consistent with previous studies,9–12 this study found an inverse association between FV consumption and poor sleep quality and restless sleep.
Potential mechanisms for the “effects of FV consumption on sleep may be due to their high content of melatonin and serotine.”8,25 In addition, the antioxidant content of FV may reduce oxidative stress and thus improve sleep quality.8,26 On the other hand, short sleep and poor sleep quality can increase emotional distress leading to more consumption of energy-dense food and lower FV consumption, indicating a potentially bidirectional relationship between FV and sleep parameters.27 Laboratory studies found that sleep disruption changes appetite-related hormones ghrelin and leptin leading to increased intake of energy-dense foods and lower FV intake.8,28 Considering a possible bidirectional relationship between FV and sleep, public health interventions should address both healthy dietary intake, such as adequate FV consumption, and improving sleep hygiene through behavioural and environmental practices.8
Study Limitations
The study was cross-sectional, which hinders us to draw conclusions on the direction of the relationship between FV consumption and sleep parameters. Moreover, FV consumption and sleep parameters were assessed by self-report, which is limited to bias.
Conclusions
The study extended previous findings of an association between inadequate FV intake and short sleep in a large sample of an emerging adult population in predominantly developing countries. The relationship between FV consumption and sleep duration, short sleep, poor sleep quality and restless sleep was linear. This study found an inverse association between FV consumption and poor sleep quality and restless sleep.
Ethical Approval
The study was undertaken from 2013 to 2015. All procedures performed in studies involving human participants were in accordance with the ethical standards of the institutional and/or national research committee and with the 1964 Helsinki declaration and its later amendments or comparable ethical standards. Informed written consent was attained from all participating students, and ethics approvals were obtained from all participating universities: Bahria University Medical and Dental College, Cairo University, Chinese University of Hong Kong, Ethics Committee of the University of Yaoundé, National University of Singapore Institutional Review Board, Universidad de Pamplona Ethics Committee, St. George’s University Institutional Review Board, Ethics Committee of Institute of Technology and Institute of Sciences at GITAM (Gandhi Institute of Technology and Management) University, Félix Houphouët Boigny University Ethics Committee, University of the West Indies Ethics Committee, Kyrgyz State Medical Academy Ethics Committee, The Ethics Committee of the University of Health Sciences, Ethics Committee of the University of Antananarivo, University of Mauritius Research Ethics Committee, Research Ethics Committee of the University of Namibia, Ethics Review Committee Obafemi Awolowo University, Committee of theWestern Visayas Health Research, Ethics Committee of the Peoples’ Friendship University of Russia, Medunsa Research and Ethics Committee (MREC/H/275/2012), Committee for Research Ethics (Social Sciences) of Mahidol University (MU-SSIRB 2015/116) (B2), Ethics Committee Istanbul University, Ethics Committee of the Universidad Central de Venezuela, North South University research Ethics Committees, Research and Ethical Committee of University of Medicine 1, Committee of Research Ethics of Hanoi School of Public Health, Research Ethics Committee, Faculty of Medicine and Health Sciences, Universitas Muhammadiyah Yogyakarta, National Ethics Committee for Health Research at Institut National de la Santé Publique, and University of Malaya Medical Ethics committee (MECID 201,412–905).
Disclosure
The authors report no conflicts of interest for this work.
References
1. Institute of Medicine (US) Committee on Sleep Medicine and Research. Sleep Disorders and Sleep Deprivation: An Unmet Public Health Problem. Washington (DC): National Academies Press (US); 2006.
2. Gallicchio L, Kalesan B. Sleep duration and mortality: a systematic review and meta-analysis. J Sleep Res. 2009;18(2):148–158. doi:10.1111/j.1365-2869.2008.00732.x
3. Peltzer K, Pengpid S. Sleep duration and health correlates among university students in 26 countries. Psychol Health Med. 2016;21(2):208–220. doi:10.1080/13548506.2014.998687
4. Peltzer K, Pengpid S. Nocturnal sleep problems among university students from 26 countries. Sleep Breath. 2015;19(2):499–508. doi:10.1007/s11325-014-1036-3
5. World Health Organization (WHO). Diet, Nutrition and the Prevention of Chronic Diseases: Report of a Joint WHO/FAO Expert Consultation. Geneva: WHO; 2003.
6. Lock K, Pomerleau J, Causer L, Altmann DR, McKee M. The global burden of disease attributable to low consumption of fruit and vegetables: implications for the global strategy on diet. Bull World Health Organ. 2005;83(2):100–108. doi:/S0042-96862005000200010
7. Peltzer K, Pengpid S. Correlates of healthy fruit and vegetable diet in students in low, middle and high income countries. Int J Public Health. 2015;60(1):79–90. doi:10.1007/s00038-014-0631-1
8. Noorwali E, Hardie L, Cade J. Bridging the reciprocal gap between sleep and fruit and vegetable consumption: a review of the evidence, potential mechanisms, implications, and directions for future work. Nutrients. 2019;11(6):1382. doi:10.3390/nu11061382
9. Buxton OM, Quintiliani LM, Yang MH, et al. Association of sleep adequacy with more healthful food choices and positive workplace experiences among motor freight workers. Am J Public Health. 2009;99 Suppl 3(Suppl3):S636–S643. doi:10.2105/AJPH.2008.158501
10. Hoefelmann LP, Lopes Ada S, Silva KS, Silva SG, Cabral LG, Nahas MV. Lifestyle, self-reported morbidities, and poor sleep quality among Brazilian workers. Sleep Med. 2012;13(9):1198–1201. doi:10.1016/j.sleep.2012.05.009
11. Katagiri R, Asakura K, Kobayashi S, Suga H, Sasaki S. Low intake of vegetables, high intake of confectionary, and unhealthy eating habits are associated with poor sleep quality among middle-aged female Japanese workers. J Occup Health. 2014;56(5):359–368. doi:10.1539/joh.14-0051-oa
12. Tan SL, Storm V, Reinwand DA, Wienert J, de Vries H, Lippke S. Understanding the positive associations of sleep, physical activity, fruit and vegetable intake as predictors of quality of life and Subjective Health Across Age Groups: a theory based, Cross-Sectional Web-Based Study. Front Psychol. 2018;9:977. doi:10.3389/fpsyg.2018.00977
13. Pengpid S, Peltzer K. Correlates of sedentary behaviour among university students with depression from 22 low- and middle-income countries. J Hum Behav Soc Environ. 2019;29(7):833–839. doi:10.1080/10911359.2019.1610134
14. Peltzer K, Pengpid S, Yung TK, Aounallah-Skhiri H, Rehman R. Comparison of health risk behavior, awareness, and health benefit beliefs of health science and non-health science students: an international study. Nurs Health Sci. 2016;18(2):180–187. doi:10.1111/nhs.12242
15. Hall JN, Moore S, Harper SB, Lynch JW. Global variability in fruit and vegetable consumption. Am J Prev Med. 2009;36(5):402–409.e5. doi:10.1016/j.amepre.2009.01.029
16. Andresen EM, Malmgren JA, Carter WB, Patrick DL. Screening for depression in well older adults: evaluation of a short form of the CES-D (Center for Epidemiologic Studies Depression Scale). Am J Prev Med. 1994;10(2):77–84. doi:10.1016/S0749-3797(18)30622-6
17. Pengpid S, Peltzer K, Samuels TA, Gasparishvili A. Factors associated with self-rated health status among university students from 26 low, middle and high income countries. J Psychol Afr. 2015;25(5):448–453. doi:10.1080/14330237.2015.1101274
18. World Health Organization (WHO). WHO Expert Consultation. Appropriate body-mass index for Asian populations and its implications for policy and intervention strategies. Lancet. 2004;363:157–163. doi:10.1016/S0140-6736(03)15268-3
19. World Health Organization (WHO) The International classification of adult underweight, overweight and obesity according to BMI, 2018. Available from: http://apps.who.int/bmi/index.jsp?introPage=intro_3.html. (
20. Craig CL, Marshall AL, Sjöström M, et al. International physical activity questionnaire: 12-country reliability and validity. Med Sci Sports Exerc. 2003;35(8):1381–1395. doi:10.1249/01.MSS.0000078924.61453.FB
21. International Physical Activity Questionnaire (IPAQ) Research Committee. International Physical Activity Questionnaire. 2016. Available from: https://sites.google.com/site/theipaq/scoring-protocol. (
22. World Health Organization (WHO). Guidelines for Controlling and Monitoring the Tobacco Epidemic. Geneva, Switzerland: WHO; 1998.
23. Bush K, Kivlahan DR, McDonell MB, Fihn SD, Bradley KA. The AUDIT alcohol consumption questions (AUDIT-C): an effective brief screening test for problem drinking. Ambulatory Care Quality Improvement Project (ACQUIP). Alcohol use disorders identification test. Arch Intern Med. 1998;158(16):1789–1795. doi:10.1001/archinte.158.16.1789
24. Steptoe A, Wardle J. Cognitive predictors of health behaviour in contrasting regions of Europe. Br J Clin Psychol. 1992;31(4):485–502. doi:10.1111/j.2044-8260.1992.tb01021.x
25. Meng X, Li Y, Li S, et al. Dietary sources and bioactivities of melatonin. Nutrients. 2017;9(4):367. doi:10.3390/nu9040367
26. St-Onge MP, Mikic A, Pietrolungo CE. Effects of diet on sleep quality. Adv Nutr. 2016;7(5):938–949. doi:10.3945/an.116.012336
27. Noorwali EA, Cade JE, Burley VJ, Hardie LJ. The relationship between sleep duration and fruit/vegetable intakes in UK adults: a cross-sectional study from the National Diet and Nutrition Survey. BMJ Open. 2018;8(4):e020810. doi:10.1136/bmjopen-2017-020810
28. Al Khatib HK, Harding SV, Darzi J, Pot GK. The effects of partial sleep deprivation on energy balance: a systematic review and meta-analysis. Eur J Clin Nutr. 2017;71(5):614–624. doi:10.1038/ejcn.2016.201
 © 2020 The Author(s). This work is published and licensed by Dove Medical Press Limited. The
full terms of this license are available at https://www.dovepress.com/terms
and incorporate the Creative Commons Attribution
- Non Commercial (unported, 3.0) License.
By accessing the work you hereby accept the Terms. Non-commercial uses of the work are permitted
without any further permission from Dove Medical Press Limited, provided the work is properly
attributed. For permission for commercial use of this work, please see paragraphs 4.2 and 5 of our Terms.
© 2020 The Author(s). This work is published and licensed by Dove Medical Press Limited. The
full terms of this license are available at https://www.dovepress.com/terms
and incorporate the Creative Commons Attribution
- Non Commercial (unported, 3.0) License.
By accessing the work you hereby accept the Terms. Non-commercial uses of the work are permitted
without any further permission from Dove Medical Press Limited, provided the work is properly
attributed. For permission for commercial use of this work, please see paragraphs 4.2 and 5 of our Terms.