Back to Journals » Clinical Ophthalmology » Volume 16
Frequency Doubling Technology Visual Field Loss in Fabry Subjects Related to Retinal Ganglion Cell Function as Explored by ERG and OSOME
Authors Michaud L ![]() , Garon ML, Forcier P, Diaconu V
, Garon ML, Forcier P, Diaconu V
Received 8 January 2022
Accepted for publication 17 March 2022
Published 9 June 2022 Volume 2022:16 Pages 1893—1908
DOI https://doi.org/10.2147/OPTH.S356245
Checked for plagiarism Yes
Review by Single anonymous peer review
Peer reviewer comments 4
Editor who approved publication: Dr Scott Fraser
Langis Michaud, Marie-Lou Garon, Pierre Forcier, Vasile Diaconu
École d’optométrie de l’Université de Montréal, Montréal, Canada
Correspondence: Langis Michaud, École d’optométrie de l’Université de Montréal, 3744 Jean-Brillant, Suite 260-15, Montréal, H3T 1P1, Canada, Tel +1-514-343-6111 ext 8945 ; Tel +1-514-343-6111 ext 8945, Email [email protected]
Purpose: This study aims to evaluate potential causes of FDT visual field loss in a selected group of Fabry subjects.
Patients and Methods: This is a pilot observational study. Subjects were assessed during 2 visits. The following tests were performed: visual acuity, tonometry, optical coherence tomography (OCT) optic nerve scan, frequency doubling time (FDT) and threshold (SAP) VF, ERG, and Online Spectro-reflectometry Oxygenation Measurement in the Eye (OSOME). Results are compared across visits and, when indicated, interpreted against those collected on non-Fabry population matched for age and sex.
Results: The study population was composed of 3 males (34.3 ± 8.9 y.o.) and 5 females (46.4 ± 6.5 y.o). For all subjects, BCVA remained 6/6 OU throughout the study and OCT optic nerve scans were normal. FDT showed a defect in at least 1 quadrant for all participants, in contrast with SAP. FDT PSD value was found different vs SAP. For ERG, the i-wave (52.1 + 2.7 ms) and B-waves (31.6 ± 2.1 ms) peak times were significantly longer compared to a non-Fabry population (p < 0.05). Overall blood oxygenation varied from 61.3% ± 4% to 68.1% ± 4% at the second visit, suggesting a loss of capillary perfusion. Blood volume varied based on location (superior/inferior), eye tested (OD/OS) and time (visit 1/2). The range of values exceeds normal subjects findings (p < 0.05). Blood volume was correlated to FDT PSD value for the superior area of the optic nerve.
Conclusion: The results suggest that Fabry subjects present FDT deficits and abnormal ERG patterns that may be explained by a retinal dysfunction affecting retinal ganglion cells (RGCs), second to vascular alterations.
Keywords: Fabry disease, retinal ganglion cells, electroretinography, OSOME
Introduction
Fabry is an X-linked inherited condition, considered a rare disease,1 and characterized by the absence or deficient activity of α-galactosidase A. This leads to the accumulation of globotriaosylceramide in a variety of cells (renal, endothelial, cardiac, dorsal root ganglion).2 As the disorder evolves, cellular dysfunction triggers organ impairment and eventually systemic damages, leading to substantial morbidity and reduced life expectancy.3 This is especially true for individuals left untreated.4
Ocular manifestations are among the first observable signs of the disease,5 and are easily identified through a regular slit lamp examination. Ocular features include cornea verticillata and haze5 (Figure 1), blood vessel tortuosity6 affecting bulbar conjunctiva (Figure 2), external upper lid7 (Figure 3) and retina (Figure 4), lens opacities8 (Figure 5), and eye dryness symptoms.9 A previous study showed that 50% of the subjects were presenting abnormal visual fields (VFs) as assessed using frequency doubling technology (FDT).10 It is important to specify that such variability with FDT fields was previously reported in patients suffering from brain injury.11 Such changes in sensitivity may generate complaints of reduced vision at night, perception of glare, haloes or photophobia, as commonly reported by Fabry subjects.8
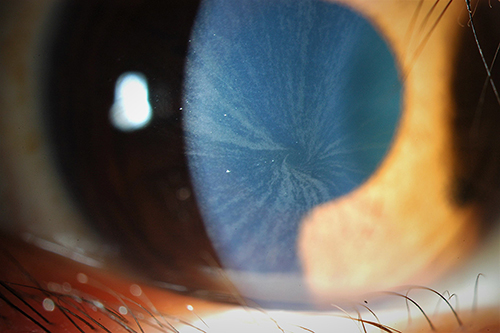 |
Figure 1 Typical corneal verticillata showing pigments and haze. |
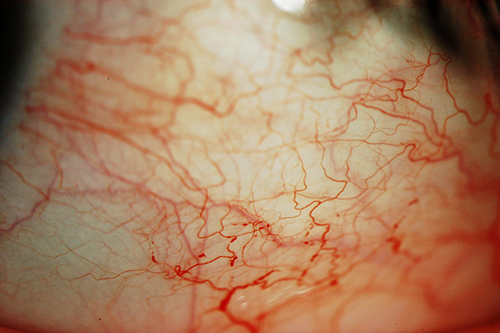 |
Figure 2 Bulbar conjunctival vessels tortuosities and micro-aneurysms. |
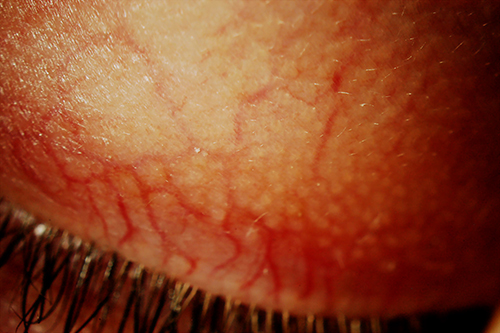 |
Figure 3 The same blood vessel tortuosities may be seen on the external upper lid. |
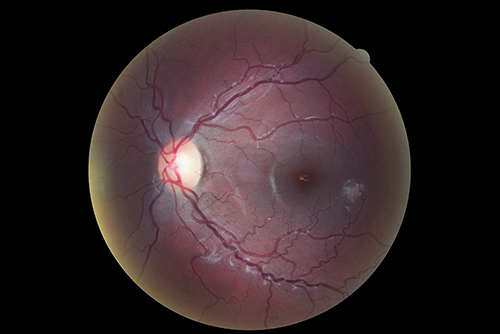 |
Figure 4 Arterioles and venules showing tortuosities. |
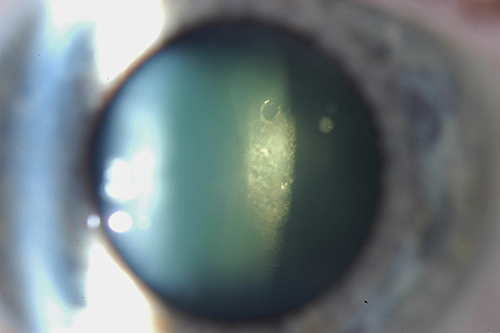 |
Figure 5 Typical Fabry posterior sub-capsular cataract. |
A review of the literature related to VF defects suggests a link with a possible subclinical optic neuropathy in Fabry disease12 in absence of any other possible explanation. In that study, 32% of the study participants revealed abnormal visual fields exhibiting relative central scotomas in automated 30° static perimetry. This was confirmed by other researchers, on a group of 32 hemizygous male subjects.8 At this time, 37% of the eyes tested by Goldman perimetry showed an enlargement of the blind spot. Another explanation may relate to glycosphingolipid deposits, observed ultrastructurally in the endothelial, perivascular and smooth-muscle cells of the ocular vessels of Fabry patients.13 Several authors have reported vessel occlusion leading to damage of the optic nerve, associated with severe loss of vision.14–16 Among these reports dating from 1978 to 1990, and consequently based on limited investigation technology, one suggested that focal deposition in a vessel caused local dilation and instability of its vascular lumen, culminating in vascular damage and frank occlusions.15 A second case description relates the findings surrounding an episode of a complete visual field loss (light perception) caused by an occlusion of the central retinal artery, in a young Fabry patient.16 The examination revealed stasis of blood in the temporal arcade and diffuse retinal and macular edema. Another one suggested that damage to radial peri-papillary capillaries can affect RGC function.17 It is then possible that glycosphingolipid deposits may represent a factor leading to field defects in Fabry patients.
The present study aims to identify possible causes of VF defects, first by evaluating blood oxygenation and blood volume optical density at two different optic nerve head zones and second, by assessing electroretinogram response, and consequently retinal ganglion cells, in a limited group of Fabry disease participants. Results can indicate that the main pathology affecting Fabry patient’s response to FDT may lie elsewhere than at the optic nerve level.
Materials and Methods
This is a pilot observational study conducted in adherence to the tenets of the Declaration of Helsinki. It was approved by the Université de Montréal Comité d’Éthique de la Recherche En Santé (Certificate 13–081-CERES-D(2)). Participants provided written informed consent prior to their enrollment in the study. The study population was composed of Fabry patients (Table 1), all recruited from a longitudinal study conducted at Université de Montreal10 and identified as showing FDT visual field defects.
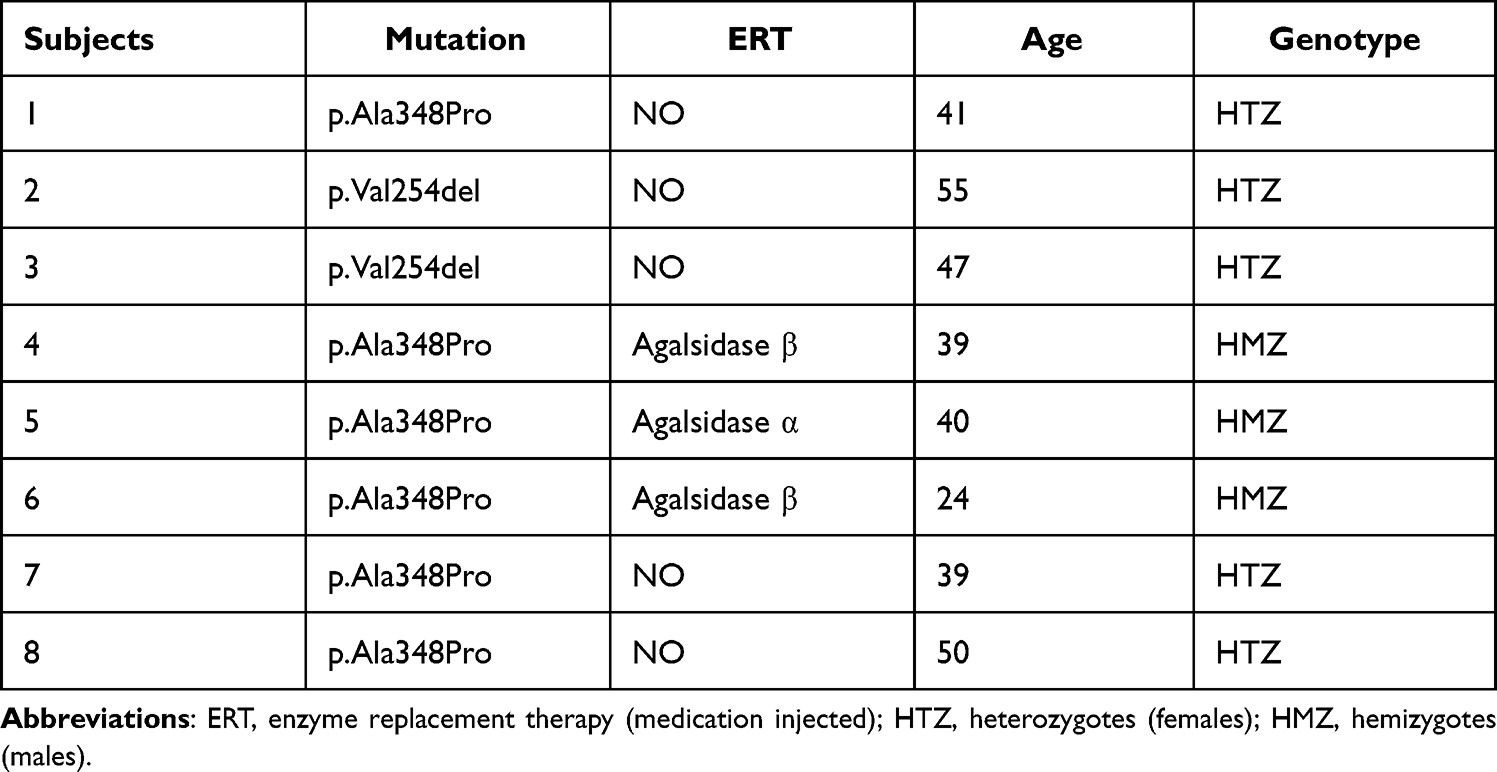 |
Table 1 Characteristics of the Study Population |
Fabry subjects were assessed during 2 consecutive visits, made 1 year apart. At each visit the following tests were performed: best corrected visual acuity at distance (using a Snellen chart, under photopic condition), anterior segment evaluation under slit lamp, intraocular pressure (using Goldmann tonometer). In addition, the following specific testing was conducted.
Scan of the Optic Nerve Head
To evaluate potential alterations of the optic nerve fiber layers, a scan of the optic nerve head was performed using Cirrus HD-OCT (Zeiss Medical, Germany). An optic disc cube 200×200 protocol was applied, which implies to scan over a 6 mm × 6 mm area, capturing 200 A-scans from 200 linear B-scans (40,000 points) in less than 2 seconds. Peripapillary retinal nerve fiber layer (RNFL) thickness and optic nerve head (ONH) parameters were evaluated under the same protocol. Only scans with strength signal over 6 were kept for analysis.
Visual Field Testing
Standard automated perimetry (SAP-threshold visual field) is considered the gold standard test to assess and manage potential optic neuropathies.18 Three important values can be extracted from the testing: Visual field Index (VFI), Mean Deviation (MD) and Pattern Standard Deviation (PSD).19 The visual field (VF) was assessed with an automated perimeter (Humphrey HFA750i, Texas) using a threshold strategy (24/2 SITA FAST, version 5.1.2). In order to measure immediate variability of the VF testing among Fabry subjects, this test was done at the beginning of the visit and repeated 1h00 later.
Frequency doubling technology (FDT) visual fields were also assessed. FDT is used as a screening method to detect early glaucomatous as well as visual field defects caused by other diseases. FDT measures spatial contrast sensitivity. This technology relates to the detection of a visual stimulus by the retinal ganglion cells with long axons, i.e. magno-cells (M cells). This is a VF strategy based on a flicker illusion that shows high sensitivity and specificity to detect ganglion cell's abnormalities. It differs from SAP threshold targeting nerve fiber layers and the exact threshold measured differs slightly between FDT and SAP.20 In fact, FDT may be more sensitive for detecting early visual field loss compared to SAP strategy.21 It has also a better reproducibility than SAP,22 most likely because FDT testing takes a shorter time to be completed. Participants in this study were trained to FDT procedure, having performed the same testing, annually, in the last 5 years, as part of their regular follow-up. FDT testing was considered valid if there was no fixation errors, no false positive, nor no false negative errors. The test was also repeated 1h00 later to confirm any defect that had been identified.
The following testing were performed under pupil dilation (tropicamide 1%), after slit lamp and IOP assessments confirming that individuals did not present any contra-indications to the procedures.
Electroretinography (ERG)
Clinically, ERG is a way to measure the electrical response of various cells of the retina.23 It is used to measure the normal conduction of electric potential along the retinal nerves and helps to diagnose or identify inherited retinal degenerations. Different strategies can be used to assess the retinal function. While the short-flash ERG assesses mostly the function of the photoreceptors and bipolar/Muller cells complex, the photopic negative response (PhNR) and pattern ERG (PERG), amongst other techniques, may be used to measure retinal ganglion cell function.24 More specifically, in this study, two different electrophysiological tests were conducted: the full-field photopic short-flash and the photopic negative response. Details of the clinical procedures can be found in Box 1.
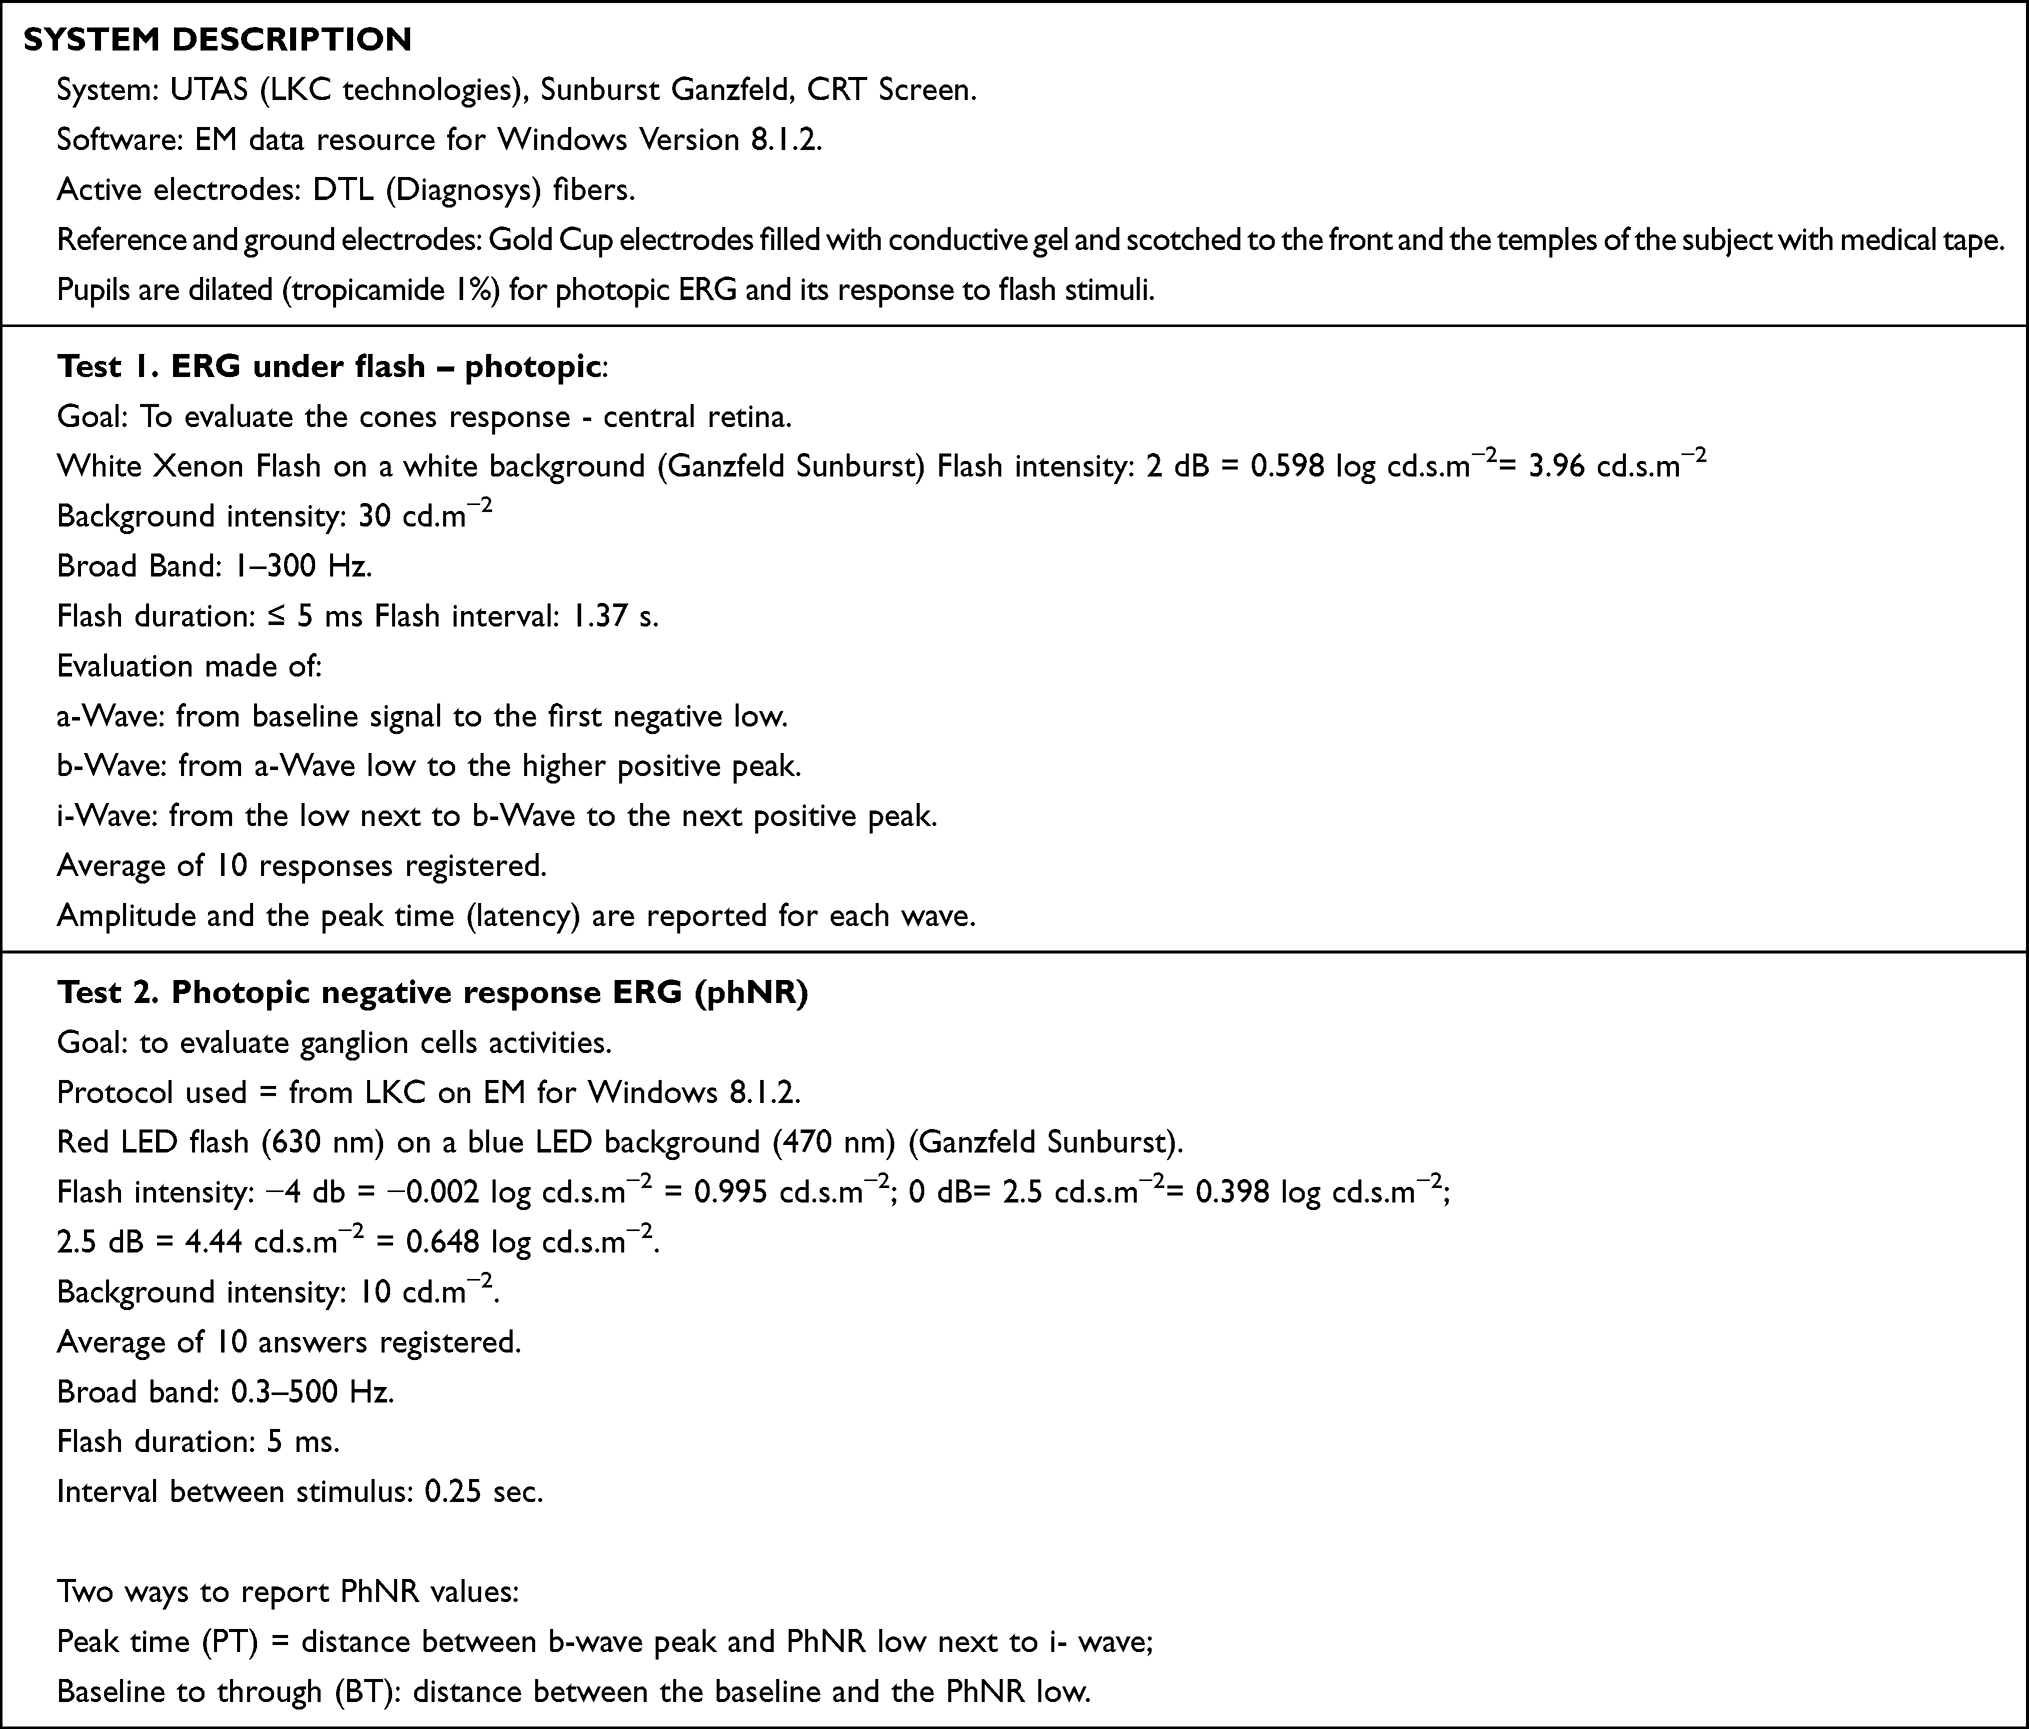 |
Box 1 Description of the ERG System and Strategy Used |
For the waveform analysis of the full-field photopic electroretinogram, the amplitude of the a-wave, which mainly reflects the function of cone photoreceptors, was measured from the baseline to the through of the a-wave. The amplitude of the b-wave, which reflects the activity of the inner nuclear layer (bipolar/Muller cells), was measured from the trough of the a-wave to the peak of the b-wave for all responses. The amplitude of the i-wave was measured from the trough following the b-wave to the peak of the i-wave. Peak times were measured from flash onset to the peak or through of each wave. The exact origin of the i-wave is still controversial, but it has been claimed to signal electrical activity taking place at or near the retinal ganglion cells.25,26
OSOME Assessment
The blood flow and blood oxygenation represent important parameters to characterize the retinal metabolism. For the present study, a non-invasive retinal oxymeter, with a multichannel spectroscopy technique had been used to measure the optic nerve’s blood oxygenation and blood volume within the capillaries. This technology was developed at Université de Montréal and known as “Online Spectro-reflectometry Oxygenation Measurement in the Eye” (OSOME). The OSOME performs online and real time capillaries blood oxygenation measurements in the eye.27 The optic nerve configuration from the majority of subjects, and the limitations of the machinery, allows to identify only two areas for the measurements. We then selected the superior and inferior areas, because, in glaucoma, they are the first to be altered when perfusion becomes deficient. An experimental session consisted of 20 consecutive measurements within an interval of 10 seconds, from specific zones of the optic nerve, representing a zone diameter of 0.5 mm.
The mathematical equation (Eq. 1) which derives the blood oxygenation from the spectral reflectometry measurement has been expressed as a linear combination of several terms of Si (λ), representing the spectral signature functions of haemoglobin and oxy-haemoglobin, as well as of several terms representing ocular media, and scattering.

The blood oxygenation was computed with the following formula:

where (m1+m2) represents the blood optical density in the optical pathway.
More details on the apparatus, the technique of measurement and its validity were previously presented in other studies.28,29
Statistical Analysis
Unless otherwise specified, results were compared from visit to visit and eye to eye. Statistic analysis was run with SPSS version 24 software (IBM). Sphericity test (Mauchly) indicates that our data does not respect normal distribution. Consequently, non-parametric ANOVA for repeated measures, controlling for the eye and for the visit, was conducted (Friedman). Because of the nature of the study and the low number of subjects, statistical comparison between groups (gender, treatment, phenotypes) was not run. VF results were compared for MD and PSD factors using t-test, and correlation between OSOME and FDT results were evaluated using a bi-variate analysis (Pearson), for each eye at each visit.
Results
Study Population
The study population was composed of 3 hemizygotes (males), 34.3 ± 8.9 years old, and 5 heterozygotes (females), 46.4 ± 6.5 y.o. (p = 0.026). After the first year, two heterozygote subjects (#2, #3 in Table 1) voluntarily withdrew from the study. Consequently, analysis of the results concerns the remaining 6 subjects; 3 of them being under enzyme replacement therapy. Fabry participants results will be put in perspective, whenever needed, with data from a group of non-Fabry ones examined at the university clinic (historical control group), and matched for age and gender. All of these non-Fabry subjects were free of any systemic disease and were not medicated at the time of their assessment.
Visual Acuity
The best corrected visual acuity was similar for all Fabry participants, at every visit: OD 6/6 OS 6/6 OU 6/6. Because of the absence of any variation, no statistical testing was performed for this data.
Slit Lamp Examination and IOP Measurement
A slit lamp examination was made at the beginning of each visit, for every participant. There were no significant lens opacities (Fabry’s cataract) reported, which may influence the clinical outcomes. For IOP, all measurements made on Fabry participants indicated normal intra-ocular pressure (<20 mmHg).
Optic Nerve Head OCT Imaging
In cases of abnormal visual fields, or when a perfusion issue is suspected at the optic nerve head level, the most important data to extract are: average retinal nerve fiber thickness, by quadrant, and symmetry. These values are reported in Table 2. There is no statistical difference between the left and right eyes (p > 0.05), the variations observed being minimal and largely under the resolution of the image system (5 um). Results measured during visit 1 are not statistically different from those evaluated at visit 2 (p > 0.05). All of the scans are considered normal in every quadrant. These results indicate that any visual field defects cannot be related to a physiological alteration of the optic nerve.
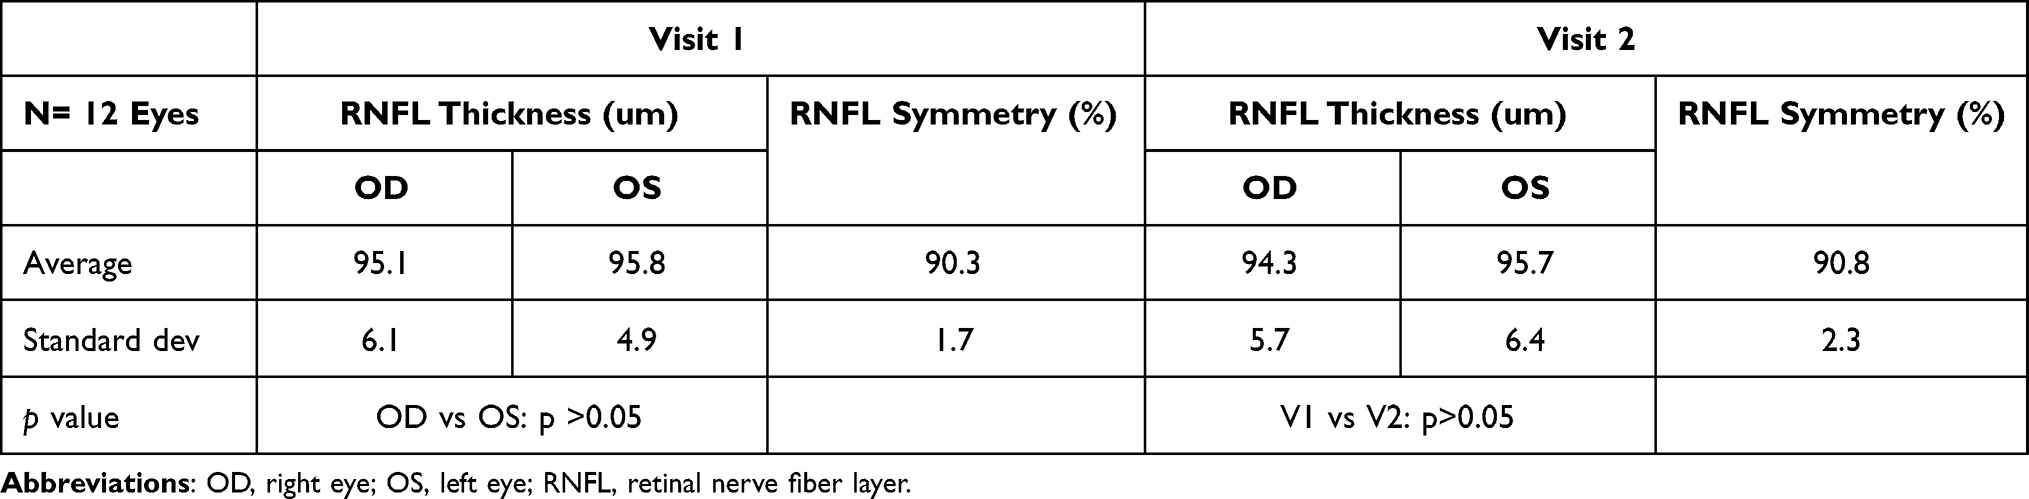 |
Table 2 Results from the Optic Nerve Head Scanning |
Visual Threshold Field Testing (SITA-24/2)
Two test sessions were conducted at each visit to enhance the validity of the results (see Table 3).
 |
Table 3 Visual Field Testing (SAP) Results |
VFI index is calculated as the percentage of normal visual field, after adjustment for age.30 The scores obtained in this cohort, for each eye at every visit, is 98% or over, which confirms the normality of the result for the tested population.
The mean deviation or mean defect (MD) gives an overall value of the total amount of visual field loss, with normal values typically within 0 dB to −2 dB. The MD value becomes more negative as the overall field worsens. The results obtained indicate that Fabry participants got MD negative results at visit 1 which degraded at the second testing session. This difference is not significant for the right eye (p > 0.05) but significant for the left eye (p < 0.05). However, results are similar to those of a normal population (between 0 and −2 dB). It is not possible, therefore, to categorize the Fabry cohort as different than a non-Fabry population.
Pattern deviation standard (PDS) is an indicator of the variability of the total deviation values, high PSD values being associated with localized damages.30 For this value, there is no statistical difference (p > 0.05) between visit 1 and visit 2, for both eyes. There is also no inter-ocular difference at visit 1 or at visit 2. All values are considered small (2 or lower). This means that the visual field of Fabry subjects is not significantly different from the shape of a normal hill of vision in the general population.31
Frequency Doubling Technology- Visual Field
All participants enrolled in this study showed defects in FDT visual field in at least 1 eye in a previous study,10 which was conducted to assess longitudinal ocular manifestations modifications in a larger group of Fabry patients. To confirm the presence of the field defect, a new FDT field testing (N-30 threshold strategy) was performed. A defect was considered present when a tested point (area) showed a threshold sensitivity (in decibels) reduced by 5% compared to a normal database. Visual field defects were confirmed (2 tests showing the same defect, at the same visit) for all participants in at least one eye.
There was a variation between visit 1 and 2, defect changing in location and sometimes in severity, for 4/6 participants. (see Figure 6A–D) PSD and MD values (averaged between 2 visits) were extracted from these results and compared with SAP similar values (Table 4).
 |
Table 4 FDT Results |
 |
Figure 6 (A–D) Evolution of the visual field defects. (A) Patient A OD year 1- no defect; (B) patient A OD year 2- defect in 3 quadrants; (C) patient B OS year 1 - defect in 4 quadrants; (D) patient B OS year 2 – defect in 3/4 quadrants but more severe. |
FDT vs SAP
All MD values are still negative for FDT testing. These results were found not significantly different vs SAP (OD 95% CI[−2.64, 2.06]; p > 0.05; OS 95% CI [−2.74, 3.88], p > 0.05). To the contrary, PSD values were found significantly higher on FDT vs SAP, for both eyes (OD 95% CI[−2.49, −0.95]; p < 0.05; OS 95% CI [−3.08, −1.10]; p < 0.05). This may suggest the identification of more localized damage in the visual field.
Electroretinography (ERG)
Table 5 shows the results for the first test assessing responses to a flash, under photopic conditions. Three waves are identified in amplitude and latency. The a-wave reflects the initial corneal-negative deflection, derived from the cones of the outer photoreceptor layers. The b-wave represents a corneal-positive deflection; derived from the inner retina, predominantly Muller and ON-bipolar cells. The i-wave is thought to be related to the response from the ganglion cells,25 at least from the inner retina. This wave is then of a particular interest.
 |
Table 5 Responses to a Flash, Under Photopic Conditions |
To put Fabry cohort results in perspective, database results from a non-Fabry group of subjects, examined with the same instrumentation at the University clinic, and matched for age and sex, were retrieved. The only statistically significant difference is found for the i-wave peak time, longer for Fabry subjects vs non-Fabry. This implies a longer time of reaction to a given stimulus, or more time needed to reach the peak of the signal, after stimulation. In both cases, this may represent early stages of the inner retinal dysfunction (ganglion cells).32 Using Hedge’s g (Cohen’s d for small size),33 it is possible to qualify the effect size as medium (0.52) and very large (1.24) for the amplitude and peak time respectively. This carries a good diagnostic power and confirms that ERG testing may help to discriminate Fabry vs non-Fabry patients.
The same reality is found with PhNR-PT-4, PhNR-BT-4, PhNR-PT-0, PhNR-BT0 and PhNR-BT2 peak times, where Fabry subjects are showing increased values to these stimuli (Table 6). This longer latency may be related to retinal ganglion cells malfunction; at least, it may be considered an early dysfunction of the inner retinal layer.34 Again here we can identify very large effect size (>1.2) for most of the peak time recorded (1.213 for PhNR-PT-4, 1.164 for PhNR-BT-4, 1.226 for PhNR-PT-0, 1.152 for PhNR-BT0 and 1.331 for PhNR-BT2). Expressed in terms of area under receiver operator characteristic plots (AUC) they range from 0.85 to 0.94.
 |
Table 6 Amplitude of pnHR Vs Stimulus Intensity |
OSOME Results
Blood Oxygenation
The OSOME methods indicate the oxygen saturation in percentage (O2SA%) at different locations of the optic nerve. For Fabry participants, the results are as following: 60.8 + 5.4 /59.9 + 3.7 (OD/OS, inferior quadrant) and 61.9 + 6.4 /62.6 + 5.5 (OD/OS superior quadrant) at visit one, and 67.1 + 6.7 /66.4 + 6.8 (OD/OS, inferior quadrant) and 70.0 + 6.9 /69.1 + 6.8 (OD/OS superior quadrant) at the second visit. Interestingly, one Fabry participant was showing a significant difference between inferior and superior areas of the optic nerve, and, to a lesser extent, between the 2 eyes. These results are also comparable to a normal population database, matched for age and sex, as established in another study:35 65.3 + 5.2 inferior quadrant and 67.8 + 4.8 superior quadrant.
If we compare these results obtained during the second session with those recorded during the first session, blood oxygenation varied significantly over a year, in the superior quadrant, in Fabry participants (OD 95% CI[−13.66, −2.64]; p < 0.05; OS 95% CI [−11.73, −0.70]; p < 0.05). Any increase in these numbers is likely related to a loss of capillary perfusion.36 This means that blood vessels deliver less oxygen to the surrounding tissue, which tries to compensate this lack of perfusion with higher oxygen consumption. It is also interesting to note that, in the second session, more subjects (4) are showing a significant difference, at least in one eye, between the inferior and the superior areas of the optic nerve. Consequently, we cannot consider Fabry’s optic nerve as homogenous for blood oxygenation, a sign that seems to evolve with time.
Blood Volume Optical Density
The results are 42.5 + 21.7 cm3/28.9 + 18.1 (OD inf/sup) and 46.7 + 7.8 cm3/34.7 + 28.7 (OS inf/sup) at visit 1, evolving to 34.8 + 28.7 cm3/28.1 + 11.4 (OD inf/sup) and 39.2 + 14.2 cm3/38.2 + 8.4 (OS inf/sup) at the last visit. The range of values exceeds what is found in a group of normal subjects.35 Comparing visit 1 and visit 2 does not bring any significant difference either (p > 0.05), both displaying high inter and intra-subject variability, and large differences based on the optic nerve zones analyzed.This means that some areas of the optic nerve of Fabry participants are populated with capillaries containing a high volume of blood while, in another adjacent area, the volume is dramatically reduced. We can make the hypothesis that restriction in one area may be compensated by dilation in another area, with respectively reduced and increased blood volume.
Correlation Between FDT and OSOME
There is no significant correlation between PSD results and OSOME blood oxygen values (inferior and superior), for each eye at every visit (see Figure 7). This is the same for MD values, considering all combinations possible (see Figure 8). To the contrary, there is a significant correlation between PSD results and blood volume in the superior quadrant for both eyes, at every visit. (OD V1 F = 10.152; p < 0.05; OS V1 F = 6.73; p < 0.05; OD V2 F = 6.456; p < 0.05; F = 3.478; p < 0.05). The same relationship was not confirmed for the inferior quadrant, nor when using MD as a reference.
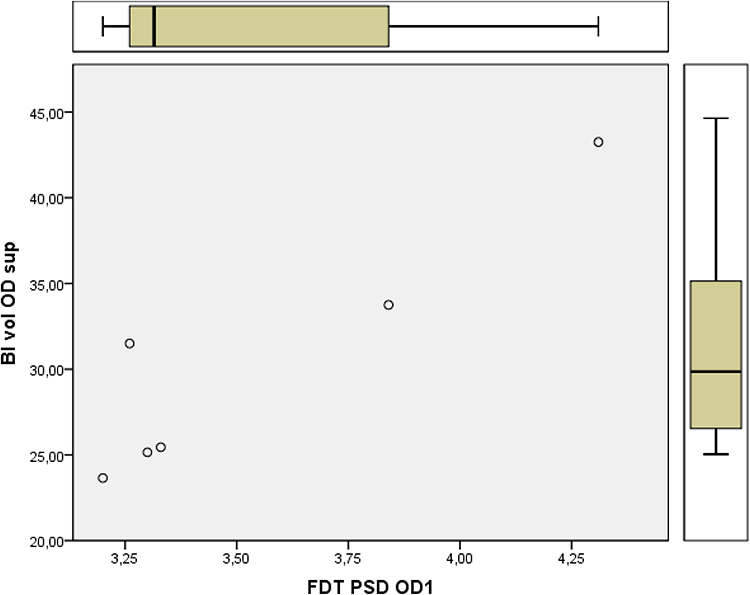 |
Figure 7 Example of a typical graph showing the relationship between PSD and blood volume. |
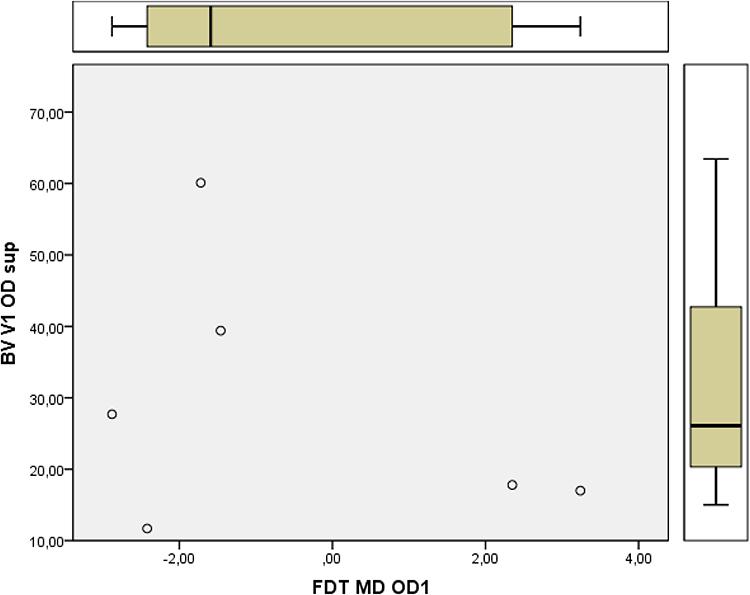 |
Figure 8 Example of a typical graph showing the relationship between MD and blood volume. |
Figure 7 - PSD vs Blood volume (OD V1 as an example).
Figure 8- MD vs Blood Volume (OD V1 as an example).
Discussion
This study was designed as a pilot, observational study, including a limited number of Fabry participants in order to explore causes which may explain FDT visual field deficits found previously in 50% of participants within a larger cohort. Based on the nature of the FDT testing, hypothesis was made that this defect may translate a retinal early dysfunction, most likely at the level of the retinal ganglion cells (RGCs).
A human eye counts between 1 to 4 million RGCs, their number varying tremendously among subjects.37 It is possible to differentiate two types of RGCs: small ones (parvo), transmitting acuity and color data (Becker-Shaffer)38 and larger ones (magno), responsible for conveying motion perception and scotopic information.
In this study, the number of RGCs was not determined. However, Fabry participants were diagnosed with normal posterior segments structures, as revealed through the optic nerve OCT scans. It echoes also Riegel,39 who found that ganglion cells in Fabry subjects do not accumulate substrate within their structure and can be considered similar in shape if compared to those found in non-Fabry subjects.
Fabry participants showed abnormal threshold visual field as tested with frequency doubling technology, using Quigley criteria.40 FDT is also showing PSD and MD values different from SAP visual field measurements. FDT type of visual field testing is regarded as being more specific for the M cells. More precisely, it measures spatial contrast sensitivity at different locations.
ERG identified RGC response to various light stimulation as abnormal. The i-wave may be considered related to the inner retinal response, in particular the one coming from ganglion cells, which is also the case for the phNR. At the same level of illumination, Fabry participants showed delayed phNR PT and BT peak times vs normal population. ERG findings raise a logical question: why ganglion cells, in Fabry participants, do not react normally if their structure is considered normal?
RGCs rely on retinal and choroidal vasculature to be nourished. However, RGCs of the central retina (those tested with visual fields) receive their nutrition from the superficial retinal capillary bed and the deep retinal capillary bed. The peripheral ganglion cells remain dependent for their nutrition on the choriocapillaris and the superficial capillary bed.41 A qualitative analysis made on Fabry patients showed a rarefication of both superficial and deep retinal capillary plexuses, leading to a reduction of the blood flow in the central retina (macular area).42 This may generate ischemia and consequently alter ganglion cells function. Moreover, recent findings coming from OCT-A analysis showed, in a Fabry cohort, a lower vascular density of the superficial capillary plexus, around the macular area, which tends to be partly compensated by an increased vessel density in the deep capillary plexus.43 Both modifications tend to confirm that Fabry patients are affected by an early retinal microvascular network alteration. As a consequence, blood flow is impaired. However the question remains about what comes first: the altered blood flow leading to vessels network alteration, or vice versa. More work is needed in this area to confirm the exact mechanism.
If RGCs function may be altered by ischemia or capillary network alteration, another mechanism can also be in play. The posterior ciliary artery via the peripapillary choroid and short posterior ciliary arteries or the circle of Zinn-Haller are providing the natural blood supply to the optic nerve and consequently provide oxygen to the fibers by perfusion. Blood supply may be altered or affected by several factors such as increased intra-ocular pressure, abnormal blood pressure, local vasospasm, autoregulation defects, or changes in the physiological characteristics of the blood vessels. Knowing that deposition of neutral glycosphingolipids happens in the endothelial, perithelial and smooth muscle cells of the cardiovascular system44 of Fabry subjects, it is logical to consider that substrate accumulation leads to impaired peripheral perfusion of affected tissues.45 Such a change alters physiological characteristic of the blood vessels and consequently related oxygen perfusion. According to Osborne,46 alteration in the quality of the blood supply to the optic nerve head can lead to fiber damage and clinically translate as a visual field defect as seen in Figure 6C and D.
This study result suggests that oxygen perfusion at the optic nerve head level is abnormal, and to a lesser extent, the blood volume as well. In fact, OSOME findings reveal that the microvascular structure of the optic nerve is altered; more specifically the diameter of the small vessels (capillaries) varies in diameter from one zone to another one, the superior quadrant showing reduced blood volume (thinner capillaries) and increased volume in the inferior quadrant vessels (dilated vessels). This study demonstrated this phenomenon by linking FDT PSD value and blood volume in the superior quadrant while the same relationship was not significant in the inferior quadrant. When this occurs, capillaries tend to enlarge to compensate. This is why optic nerve capillaries in Fabry participants are found relatively larger compared to the normal subjects.28 Finally, vasoconstriction and vasodilation of the peripheral circulation may be altered by the accumulation of substrate, through inhibition of the receptors involved in the activation of the endothelial nitric oxide synthase enzyme.47
The results tends to suggest also that the reduction of the oxygen transfer at the level of the capillary structures progresses quickly in some Fabry participants. The blood oxygenation values from the six subjects assessed in the two experimental sessions demonstrated a significant reduction of oxygen transfer in the 12 month interval.
We then suggest the presence of altered vascular function (macular area), and remotely (optic nerve) weaken the signal generated by ganglion cells and delay its transmission through the optic nerve. Combined with some preclinical data in a rat model of Fabry disease suggesting that substrate accumulates in retinal vessels,48 and in the conjunctival blood vessels,49 and taking into consideration the current technical limitations to report direct substrate accumulation at the level of retinal capillary circulation in Fabry patients, we believe that this hypothesis surrounding the mechanism of optic nerve oxygen saturation and blood volumes is a valid one.
The clinical consequences of our finding imply that FDT visual field and ERG testing may be considered as clinically relevant tools to identify ocular functional alterations in Fabry patients, assuming the absence of any pathological causes, such as lens opacities, which may impact on clinical results. Visual field remains the most accessible way to evaluate ganglion cells clinically, ERG or oximetry being not easily performed or accessible in a conventional practice.
This study may be affected by a few biases. The first obvious limitation is to rely on a limited number of subjects. Authors decided to conduct a pilot study which is defined as a way to examine the feasibility of an approach that is intended to be used in a larger scale study.50 In this case, because there was no valid explanation to FDT visual field defects in Fabry patients, in the literature, authors wanted to test a few hypothesis and clinical testing strategies before including a larger number of participants, knowing that it would be challenging for them (25% drop-out rate) and would request larger resources than those available.
Consequently, this analysis is limited to the overall cohort. Sub-analysis is limited due to the fact that all except two Fabry participants have the same classic mutation (p.Ala348Pro), and predictably, all the males are on ERT. None of the heterozygous subjects are on ERT. Results may vary considerably for disease-causing mutations in males vs females, and in those on ERT vs those untreated, consequently results analysis must be made with caution and can probably not be generalized to other Fabry’s cohorts. Future work will be needed to confirm our conclusions.
Testing was physically demanding for participants (especially ERG) and time consuming. Consequently 2/8 subjects dropped out after one year, considering that they were coming from a longitudinal (5 years) previous study. None of these 2 subjects were on enzyme replacement therapy. Because we were not able to perform statistical analysis based on the treatment, we do not know the impact of enzyme therapy on the outcomes presented here.
There was no standard ERG protocol established to test Fabry’s patients when the study was started, and we did not expect to find an inner retinal abnormal response. Consequently, the original testing strategy was broad-spectrum instead of oriented toward one particular component. In a recently published study,42 focal electroretinogram is considered a valid approach in the identification of subclinical forms of Fabry disease presenting no other systemic symptoms. Future work may be needed to define the optimal protocol to assess Fabry patients. An interesting approach would be to use the steady state pattern electroretinogram, more specifically the Paradigm Optimized for Glaucoma Detection (PERGLA), in a Fabry cohort. The PERGLA allows for detection of ganglion cells function loss years before structural loss in glaucoma suspect subjects.51
OSOME technology is reliable but it is quite impossible to confirm that the exact same location in the optic nerve was tested 2 years in a row. Any deviation may influence the comparison of the results over two different visits. We cannot exclude that differences found here may be due, in part, to different locations tested. Nonetheless, the fact that results indicate a difference between superior and inferior quadrants cannot be attributed to mislocation of the target. We are then quite confident about the conclusions related to OSOME analysis.
Finally, it would had been optimal to rely on Optical Coherence Tomography Angiography (OCTA) to provide information on retinal and choroidal circulations, without the need for dye injections. This type of imaging system was not available at the author’s institution at the moment of this study. However this technique will be included if any further work in this area is carried out.
Conclusion
Retinal ganglion cells function may be altered from the oxygen perfusion deficiency at the optic nerve level, and from impaired retinal supply, second to alteration of the capillary plexuses. Clinically, this is translated in abnormal visual field results, if tested with a frequency doubling technology. Future work, on a larger group of subjects, is needed to evaluate if other factors like enzyme replacement therapy, early vs late disease state, gender or classic vs late-onset forms can alter these findings.
Registration
This study was not registered considering the nature (pilot-observational) of the study.
Acknowledgment
Dr Daniel Bichet M.D. – UM professor – metabolic disorder clinic Hopital Sacre Cœur.
Disclosure
The authors report no conflicts of interest in this work.
References
1. Fuller M, Meikle PJ, Hopwood JJ. Epidemiology of lysosomal storage diseases: an overview. In: Mehta A, Beck M, Sunder-Plassmann G, editors. Fabry Disease: Perspectives from 5 Years of FOS. Oxford: Oxford PharmaGenesis; 2006.
2. Chan B, Adam DN. A review of Fabry disease. Skin Therapy Letter. 2018;23(2):4–6.
3. Vedder AC, Linthorst GE, van Breemen MJ, et al. The Dutch Fabry cohort: diversity of clinical manifestations and Gb3 levels. J Inherit Metab Dis. 2007;30:68–78. doi:10.1007/s10545-006-0484-8
4. MacDermot KD, Holmes A, Miners A. Anderson-Fabry disease: clinical manifestations and impact of disease in a cohort of 98 hemizygous males. J Med Genet. 2001;38:750–760. doi:10.1136/jmg.38.11.750
5. Sher NA, Letson RD, Desnick RJ. The ocular manifestations in Fabry’s disease. Arch Ophthalmol. 1979;97:671–676. doi:10.1001/archopht.1979.01020010327008
6. Sodi A, Ioannidis AS, Mehta A, et al. Ocular manifestations of Fabry’s disease: data from the Fabry outcome survey. Br J Ophthalmol. 2007;91:210–214. doi:10.1136/bjo.2006.100602
7. Michaud L. Vascular tortuosities of the upper eyelid: a new clinical finding in fabry patient screening. J Ophthalmol. 2013;2013:207573. doi:10.1155/2013/207573
8. Orssaud C, Dufier JL, Germain DP. Ocular manifestations in Fabry disease: a survey of 32 hemizygous male patients. Ophthalmic Genet. 2003;24:129–139. doi:10.1076/opge.24.3.129.15609
9. Sivley MD. Fabry disease: a review of ophthalmic and systemic manifestations. Optom Vis Sci. 2013;90:e63–78. doi:10.1097/OPX.0b013e31827ec7eb
10. Michaud L. Longitudinal study on ocular manifestations in a cohort of patients with Fabry disease. PLoS One. 2019;14:e0213329. doi:10.1371/journal.pone.0213329
11. Walsh DV, Capó-Aponte JE, Jorgensen-Wagers K, et al. Visual field dysfunctions in warfighters during different stages following blast and non blast mTBI. Mil Med. 2015;180:178–185. doi:10.7205/MILMED-D-14-00230
12. Pitz S, Grube-Einwald K, Renieri G, et al. Subclinical optic neuropathy in Fabry disease. Ophthalmic Genet. 2009;30:165–171. doi:10.3109/13816810903148004
13. Kumagai K, Mitamura Y, Mizunoya S, et al. A case of anterior ischemic optic neuropathy associated with Fabry’s disease. Jpn J Ophthalmol. 2008;52:421–423. doi:10.1007/s10384-008-0572-4
14. Weingeist TA, Blodi FC. Fabry’s disease: ocular findings in a female carrier. A light and electron microscopy study. Arch Ophthalmol. 1971;85:169–176. doi:10.1001/archopht.1971.00990050171010
15. Abe H, Sakai T, Sawaguchi S, et al. Ischemic optic neuropathy in a female carrier with Fabry’s disease. Ophthalmologica. 1992;205:83–88. doi:10.1159/000310318
16. Sher NA, Reiff W, Letson RD, et al. Central retinal artery occlusion complicating Fabry’s disease. Arch Ophthalmol. 1978;96:815–817. doi:10.1001/archopht.1978.03910050421003
17. Barbosa M, Maddess T, Ahn S, et al. Novel morphometric analysis of higher order structure of human radial peri-papillary capillaries: relevance to retinal perfusion efficiency and age. Sci Rep. 2019;9:13464. doi:10.1038/s41598-019-49443-z
18. Bogunovic H, Kwon YH, Rashid A, et al. Relationships of retinal structure and humphrey 24-2 visual field thresholds in patients with glaucoma. Invest Ophthalmol Vis Sci. 2014;56:259–271. doi:10.1167/iovs.14-15885
19. Sousa MC, Biteli LG, Dorairaj S, et al. Suitability of the visual field index according to glaucoma severity. J Curr Glaucoma Pract. 2015;9:65–68. doi:10.5005/jp-journals-10008-1186
20. Fredette MJ, Giguère A, Anderson DR, et al. Comparison of matrix with Humphrey field analyzer II with SITA. Optom Vis Sci. 2015;92:527–536. doi:10.1097/OPX.0000000000000583
21. Medeiros FA, Sample PA, Weinreb RN. Frequency doubling technology perimetry abnormalities as predictors of glaucomatous visual field loss. Am J Ophthalmol. 2004;137:863–871. doi:10.1016/j.ajo.2003.12.009
22. Spry PG, Johnson CA, McKendrick AM, et al. Variability components of standard automated perimetry and frequency-doubling technology perimetry. Invest Ophthalmol Vis Sci. 2001;42:1404–1410.
23. Gallemore RP, Baker M, Chou CK, et al. Electrophysiology comes to the clinic. Rev Ophthalmol. 2014;21:e008999.
24. Wilsey LJ, Fortune B. Electroretinography in glaucoma diagnosis. Curr Opin Ophthalmol. 2016;27:118–124. doi:10.1097/ICU.0000000000000241
25. Rousseau S, McKerral M, Lachapelle P. The I-wave: bridging flash and pattern electroretinography. Electroencephalogr Clin Neurophysiol Suppl. 1996;46:165–171.
26. Lachapelle P. A POSSIBLE CONTRIBUTION OF THE OPTIC-NERVE TO THE PHOTOPIC OSCILLATORY POTENTIALS. Clin Vis Sci. 1990;5:421–426.
27. Diaconu V. Multichannel spectroreflectometry: a noninvasive method for assessment of on-line hemoglobin derivatives. Appl Opt. 2009;48:D52–61. doi:10.1364/AO.48.000D52
28. Vucea V, Bernard PJ, Sauvageau P, et al. Blood oxygenation measurements by multichannel reflectometry on the venous and arterial structures of the retina. Appl Opt. 2011;50:5185–5191. doi:10.1364/AO.50.005185
29. Diaconu V, Michaud L, Forcier P, et al. Optic Nerve capillaries blood oxygen investigation in Fabry’s disease patients. Inv Opht Vis Sci. 2015;56:2674.
30. Giaconi JAA, Law SK, Coleman AL, et al. Pearls of Glaucoma Management. Springer Berlin Heidelberg; 2010.
31. Yaqub M. Visual fields interpretation in glaucoma: a focus on static automated perimetry. Community Eye Health. 2012;25:1–8.
32. Mizunoya S, Sugawara T, Uekhara J, et al. The Ganglion cell component of the I-wave in the photopic ERG. Invest Ophthalmol Vis Sci. 2007;48(13):4182.
33. Rice ME, Harris GT. Comparing effect sizes in follow-up studies: ROC Area, Cohen’s d, and r. Law Hum Behav. 2005;29(5):615–620. doi:10.1007/s10979-005-6832-7
34. Mahroo OA. Electroretinography can provide objective assessment of inner retinal function prior to atrophic change on OCT. Eye. 2015;29:1513. doi:10.1038/eye.2015.116
35. Diaconu V, Tran VL. Optic nerve capillaries blood oxygenation in normal and primary open-angle Glaucoma subjects. Invest Ophthalmol Vis Sci. 2013;54(15):4456.
36. Michelson G, Scibor M. Intravascular oxygen saturation in retinal vessels in normal subjects and open-angle glaucoma subjects. Acta Ophthalmol Scand. 2006;84:289–295. doi:10.1111/j.1600-0420.2005.00631.x
37. Watson AB. A formula for human retinal ganglion cell receptive field density as a function of visual field location. J Vis. 2014;14:15. doi:10.1167/14.7.15
38. Stampler RL, Lieberman MF, Drake MV. Becker-Scheffer’s Diagnosis and Therapy of the Glaucomas. Saint-Louis: Mosby; 2009:145–150.
39. Riegel EM, Pokorny KS, Friedman AH, et al. Ocular pathology of Fabry’s disease in a hemizygous male following renal transplantation. Surv Ophthalmol. 1982;26:247–252. doi:10.1016/0039-6257(82)90159-X
40. Quigley HA. Identification of glaucoma-related visual field abnormality with the screening protocol of frequency doubling technology. Am J Ophthalmol. 1998;125:819–829. doi:10.1016/S0002-9394(98)00046-4
41. Rutkowski P, May CA. Nutrition and vascular supply of retinal ganglion cells during human development. Front Neurol. 2016;7:49. doi:10.3389/fneur.2016.00049
42. Minnella AM, Barbano L, Verrecchia E, et al. Macular impairment in Fabry disease: a morpho-functional assessment by swept-source OCT angiography and focal electroretinography. Invest Ophthalmol Vis Sci. 2019;60:2667–2675. doi:10.1167/iovs.18-26052
43. Cennamo G, Di Maio LG, Montorio D, et al. Optical coherence tomography angiography findings in Fabry disease. J Clin Med. 2019;8:528. doi:10.3390/jcm8040528
44. Desnick RJ, Astrin KH, Bishop DF. Fabry disease: molecular genetics of the inherited nephropathy. Adv Nephrol Necker Hosp. 1989;18:113–127.
45. Tuttolomondo A, Pecoraro R, Simonetta I, et al. Anderson-Fabry disease: a multiorgan disease. Curr Pharm Des. 2013;19:5974–5996. doi:10.2174/13816128113199990352
46. Osborne NN, Melena J, Chidlow G, et al. A hypothesis to explain ganglion cell death caused by vascular insults at the optic nerve head: possible implication for the treatment of glaucoma. Br J Ophthalmol. 2001;85:1252–1259. doi:10.1136/bjo.85.10.1252
47. San Roman I, Rodriguez ME, Caporossi O, et al. Computer assisted retinal vessel tortuosity evaluation in novel mutation Fabry disease: towards new prognostic markers. Retina. 2017;37:592–603. doi:10.1097/IAE.0000000000001177
48. Miller JJ, Aoki K, Reid CA, et al. Rats deficient in α-galactosidase A develop ocular manifestations of Fabry disease. Sci Rep. 2019;9:9392. doi:10.1038/s41598-019-45837-1
49. Rozenfeld PA, Croxatto O, Ebner R, et al. Immunofluorescence detection of globotriaosylceramide deposits in conjunctival biopsies of Fabry disease patients. Clin Exp Ophthalmol. 2006;34:689–694. doi:10.1111/j.1442-9071.2006.01318.x
50. Leon AC, Davis LL, Kraemer HC. The role and interpretation of pilot studies in clinical research. J Psychiatr Res. 2011;45:626–629. doi:10.1016/j.jpsychires.2010.10.008
51. Banitt MR, Ventura LM, Feuer WJ, et al. Progressive loss of retinal ganglion cell function precedes structural loss by several years in glaucoma suspects. Invest Ophthalmol Vis Sci. 2013;54:2346–2352. doi:10.1167/iovs.12-11026
 © 2022 The Author(s). This work is published and licensed by Dove Medical Press Limited. The
full terms of this license are available at https://www.dovepress.com/terms
and incorporate the Creative Commons Attribution
- Non Commercial (unported, 3.0) License.
By accessing the work you hereby accept the Terms. Non-commercial uses of the work are permitted
without any further permission from Dove Medical Press Limited, provided the work is properly
attributed. For permission for commercial use of this work, please see paragraphs 4.2 and 5 of our Terms.
© 2022 The Author(s). This work is published and licensed by Dove Medical Press Limited. The
full terms of this license are available at https://www.dovepress.com/terms
and incorporate the Creative Commons Attribution
- Non Commercial (unported, 3.0) License.
By accessing the work you hereby accept the Terms. Non-commercial uses of the work are permitted
without any further permission from Dove Medical Press Limited, provided the work is properly
attributed. For permission for commercial use of this work, please see paragraphs 4.2 and 5 of our Terms.