Back to Journals » Neuropsychiatric Disease and Treatment » Volume 13
Frequencies of circulating B- and T-lymphocytes as indicators for stroke outcomes
Authors Wang Y ![]() , Liu J, Wang X, Liu Z, Li F, Chen F, Geng X, Ji Z, Du H, Hu X
, Liu J, Wang X, Liu Z, Li F, Chen F, Geng X, Ji Z, Du H, Hu X
Received 2 August 2017
Accepted for publication 4 September 2017
Published 3 October 2017 Volume 2017:13 Pages 2509—2518
DOI https://doi.org/10.2147/NDT.S148073
Checked for plagiarism Yes
Review by Single anonymous peer review
Peer reviewer comments 2
Editor who approved publication: Dr Roger Pinder
Yanling Wang,1 Jihong Liu,1 Xuemei Wang,1 Zongjian Liu,2 Fengwu Li,1 Fenghua Chen,3 Xiaokun Geng,1 Zhili Ji,2 Huishan Du,1 Xiaoming Hu1,3
1Department of Neurology, China-America Institute of Neuroscience, 2Central Laboratory, Beijing Luhe Hospital, Capital Medical University, Beijing, People’s Republic of China; 3Department of Neurology, Pittsburgh Institute of Brain Disorders and Recovery, University of Pittsburgh School of Medicine, Pittsburgh, PA, USA
Background: Stroke has high mortality and morbidity. Biomarkers are required for to predict stroke outcomes, which could help clinicians to provide rationale approaches for patient management. The dynamic changes in circulating immune cells have been reported in stroke patients and animal models of stroke.
Aim: The aim of this study was to explore biomarkers to predict stroke outcomes by investigating the relationship between the frequencies of circulating immune cells and stroke outcomes.
Methods: In all, 50 acute ischemic stroke (AIS) patients were enrolled. Their blood samples were collected upon hospital admission and on day 1 and day 7 after stroke, and the leukocyte subsets were analyzed by flow cytometry. The dynamic changes in some types of immune cells in the AIS course and their correlation with clinical parameters were analyzed. Blood samples from 123 age- and gender-matched healthy subjects were used as controls.
Results: The proportions of T-lymphocytes and NK cells in stroke patients were significantly lower than in healthy controls. The frequencies of B- and T-lymphocytes were negatively correlated with stroke severity at onset, including neurological deficits as assessed by National Institutes of Health Stroke Scale (NIHSS), and infarct volume as measured by the diffusion-weighted images (DWIs) of magnetic resonance (MR). Logistic regression analysis showed that modified Rankin scale (mRs) scores, a score system for the long-term neurological dysfunctions, were negatively correlated with the percentage of B-lymphocytes at stroke onset.
Conclusion: The proportions of B- and T-lymphocytes are associated with neurological outcomes of stroke patients and might be used as an indicator for severity and prognosis of ischemic stroke.
Keywords: lymphocytes, stroke, neurological deficits, infarct
Introduction
Stroke remains the second leading cause of death and a major cause of disability in adults worldwide. There is an increasing need for biomarkers or indicators to predict stroke outcomes, which could help clinicians to provide rationale approaches for patient management. Accumulating evidence suggests that poststroke immune responses are important for stroke outcomes. Prompt and long-lasting changes in the numbers and functions of circulating lymphocytes and mononuclear cells can be observed in both animal models of ischemic stroke and stroke patients.1–5 In particular, the frequencies of T- and B-lymphocytes decrease significantly after acute ischemic stroke (AIS). Such lymphopenia can last for months with a gradual recovery over time. Multiple mechanisms, including the activation of sympathetic nervous system,3 the dysregulation of hypothalamic–pituitary–adrenal axis,6,7 and the release of danger-associated molecular patterns from injured brain,8 have been suggested to contribute to these immune changes after stroke.
The quantity or function of peripheral blood leukocytes and other immune cells are indicators of cellular and humoral immune status under some pathological conditions.9,10 They may also serve as biomarkers for infectious complications, such as pneumonia and urinary tract infection after stroke.11,12 Interestingly, recent clinical studies suggested that the changes in immune cell composition may impact the long-term outcome after brain injuries. For example, the number of circulating regulatory T cells is correlated with clinical outcome after traumatic brain injury.13 Long-term functional impairments of NK cells have been reported in patients with spinal cord injury. Such impairments are associated with lesion severity and long-term neurological levels.14 However, the correlations between the numbers of peripheral lymphocytes and the outcomes of stroke patients are not well characterized.
In this study, we aim to characterize the changes in immune cell populations over time after stroke and evaluate their correlations with disease outcomes in patients. The result will be useful to predict stroke outcomes or the effectiveness of stroke treatment.
Methods
Subject recruitment
The clinical study was approved by the ethical review board of Beijing Luhe Hospital, Capital Medical University. In all, 50 AIS patients admitted to the Department of Neurology from May 2014 to April 2015 were enrolled in a consecutive manner. All participants gave written informed consent for this study. The inclusion criteria were: 1) age ≥18 years; 2) arrived to emergency room within 6 hours after AIS onset; 3) first onset of stroke; 4) diagnosis of AIS based on the diagnostic standard of cerebral infarction that was established at the Fourth National Cerebrovascular Disease Conference;15 and 5) brain infarct confirmed by computed tomography (CT) or magnetic resonance imaging (MRI). The exclusion criteria were: 1) parenchymal, subarachnoid, subdural hemorrhage, or extradural hemorrhage; 2) acute infection; 3) neurological deficits due to trauma or malignancy; 4) disorders in vital organs (lung, liver, and kidney); and 5) peripheral vascular diseases or blood system diseases. The demographic and clinical parameters of patients were collected. Medical histories were also obtained from control subjects.
Neurological functional deficit and recovery
National Institutes of Health Stroke Scale (NIHSS) ranging from 0 to 42 was used to evaluate the patients’ neurological deficits upon hospital administration.16 Modified Rankin scale (mRs) scores (range from 0 to 5) were acquired on day 14±3 after stroke to measure poststroke neurological disability. In general, patients with 0–1 mRs scores are considered to have good neurological function recovery and no significant disabilities.
Infarct volume
The infarct volume was measured based on the diffusion-weighted images (DWIs) of magnetic resonance (MR) imaging on first to third day after stroke. We calculated the infarct volume with Coniglobus formula,17 ie, V = 1/6 × π × a × b × c × n, in which “a” means the major axis of the largest infarct section, “b” the minor axis of the largest infarct section, “c” the slice thickness, and “n” the number of slices. The unit is centimeters.
Sample collection of flow cytometry analysis
Blood samples were drawn from AIS patients at stroke onset and the first day (D1) and seventh day (D7) after stroke. One blood sample was drawn from each healthy control. Blood cells were collected. The CD3−CD19+ B-lymphocytes, CD19−CD3+ T-lymphocytes, CD3+CD56+ NK cells, and CD14+ monocytes were identified and quantified by flow cytometry. The percentages of T-, B-lymphocytes and NK cells among total leukocytes were calculated.
Statistical analyses
All data were analyzed using SPSS 19.0 for Windows. Categorical variables were represented as frequencies. Continuous variables with normal distribution were expressed as mean ± SD. Continuous variables with non-normal distribution were expressed as interquartile range. Differences between groups were compared using chi-square test for categorical variables and using Student’s t-test or analysis of variance (ANOVA) for continuous variables with normal distribution. Mann–Whitney U rank sum test was used for continuous variables with non-normal distribution. The correlation analyses between continuous data were performed using Pearson’s correlation analysis. Spearman rank correlation analysis was used for correlation analysis between data with non-normal distribution. Logistic regression was used to identify predictor variables for long-term outcomes (mRs). Variable selection was performed by a combined stepwise forward/backward approach.18,19 In all analysis, P<0.05 was considered as statistically significant.
Results
Alterations in the composition of peripheral immune cells immediately after stroke
A total of 50 AIS patients (age: 63.36±13.01 years; male:female =2.13:1) and 123 healthy controls (age: 62.89±12.63 years; male:female =1.73:1) without any stroke history or other vascular diseases were enrolled. There was no significant difference in age (P=0.825, Student’s t-test) and gender (P=0.348, chi-square test) between the stroke and control groups.
The baseline clinical characteristics of stroke patients are listed in Table 1. These values were compared with the Chinese general prevalence or normal laboratory reference values. The percentage of diabetes mellitus (P=0.027, chi-square test) and hypertension (P<0.001, chi-square test) was significantly higher in stroke patients than that in the general population. However, the percentage of hyperlipidemia was similar between stroke patients and general population. In fact, stroke patients had significantly lower values than normal values of the total cholesterol, low-density lipoprotein cholesterol, and high-density lipoprotein cholesterol in peripheral blood (Table 1),20,21 due to the application of lipid-lowering agents. Further analysis demonstrated no significant correlation between lipid index and clinical outcomes (not shown). Twenty-one patients underwent intravenous thrombolytic therapy, and no one received mechanical disobliteration.
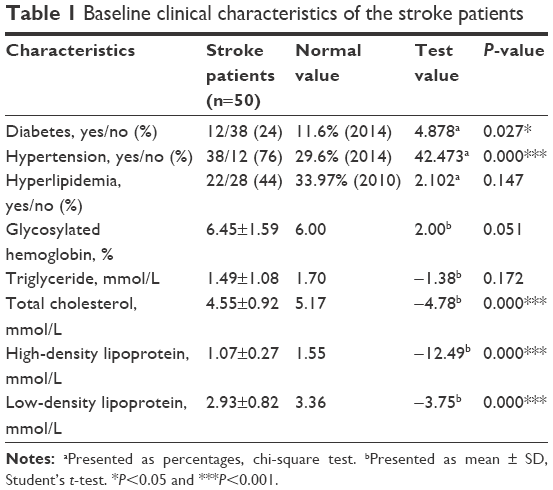 | Table 1 Baseline clinical characteristics of the stroke patients |
Using flow cytometry, the number of CD3−CD19+ B-lymphocytes, CD19−CD3+ T-lymphocytes, CD3+CD56+ NK cells, and CD14+ monocytes in blood was analyzed. The percentage of these four immune cells among total leukocytes showed a general downward trend at stroke onset compared with the control group (Figure 1). The decline in the percentages of T-lymphocytes (P<0.01, Mann–Whitney U test; Figure 1B) and NK cells (P<0.001, Mann–Whitney U test; Figure 1C) reached statistical significance. The percentages of B-lymphocytes and T-lymphocytes showed slight recovery over the next 7 days (Figure 1A and B). The percentages of NK cells and monocytes continued to decline over time (Figure 1C). Thrombolytic therapy showed no effect on the percentages of T- and B-lymphocytes or NK cells at D1 and D7 after stroke (Table 2). The patients with thrombolytic treatment have significantly higher percentage of monocytes at D7 after stroke.
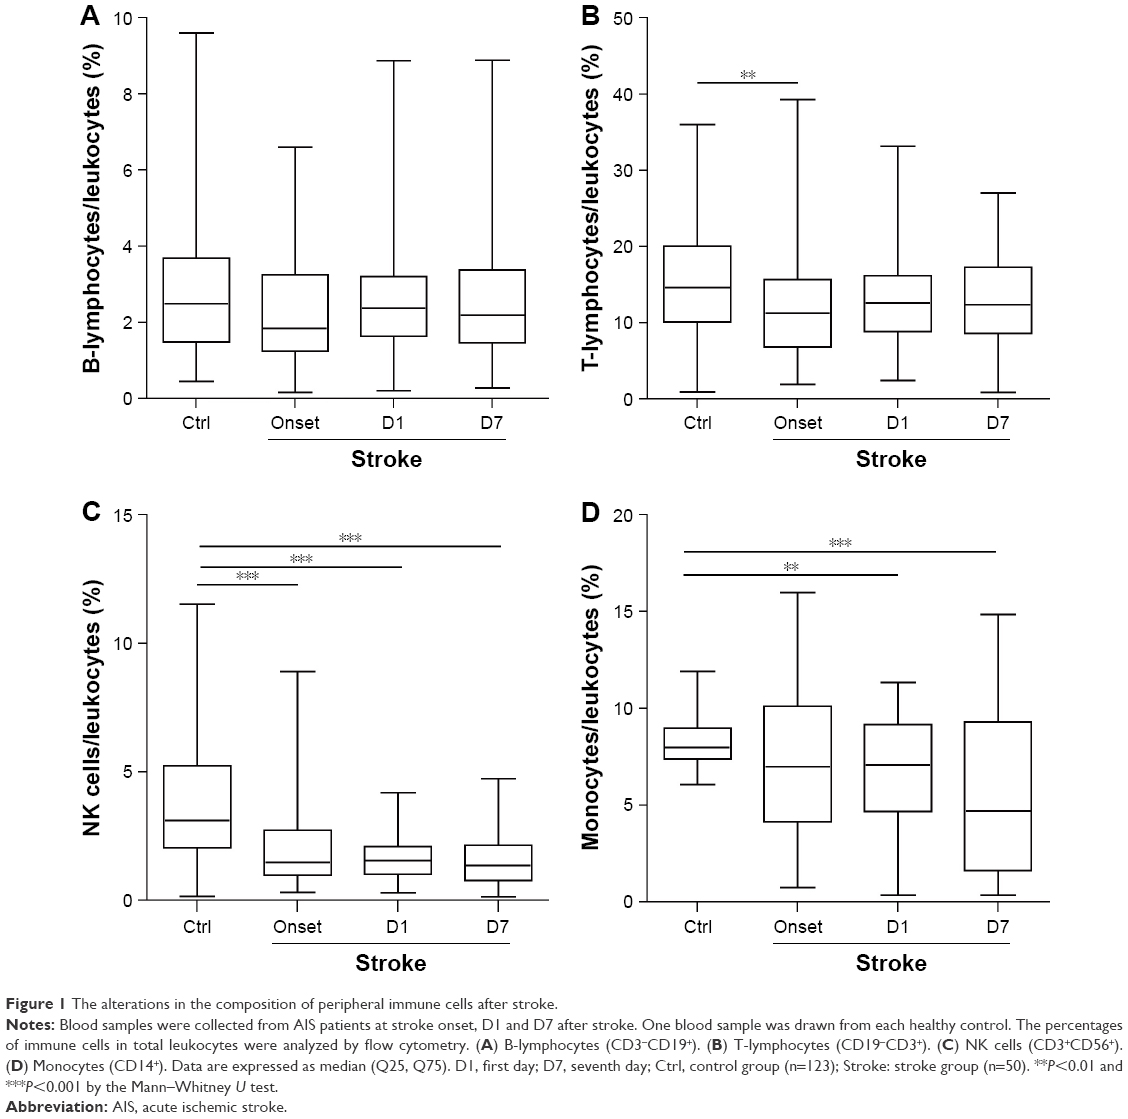 | Figure 1 The alterations in the composition of peripheral immune cells after stroke. |
 | Table 2 Effect of thrombolytic therapy on immune cell populations |
Association between the percentage of immune cell subsets and the severity of clinical outcomes at acute stage after stroke
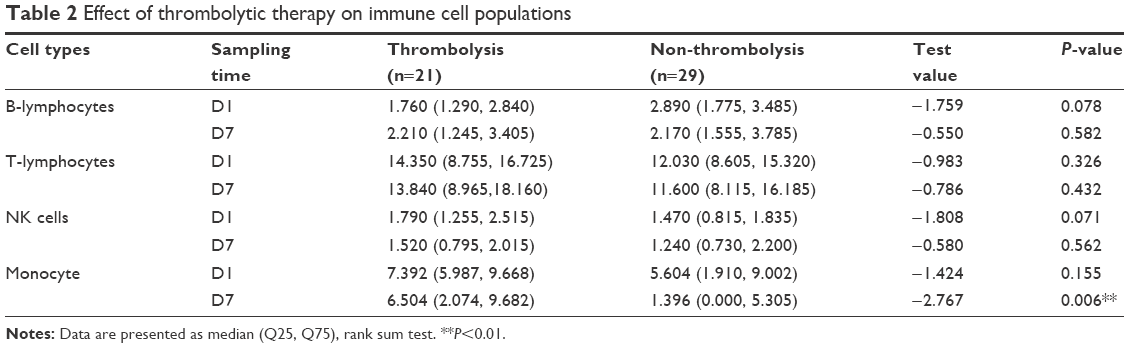
Infarct volumes were measured within 3 days after stroke based on the DWIs of MR (Figure 2A). Infarct volumes were negatively correlated with the proportions of B-lymphocytes at all time points tested and with the percentages of T-lymphocytes at D1 after stroke (Table 3). Similarly, the NIHSS scores were negatively correlated with the proportions of B-lymphocytes at D1 and D7 and with the percentages of T-lymphocytes at D1 after stroke (Table 3). The percentage of NK cells at D7 after stroke showed negative correlation with infarct volume (Table 3). The stroke outcomes were not correlated with the percentage of monocytes in circulation.
 | Figure 2 Associations between infarct volume or NIHSS with leukocyte subset percentages. |
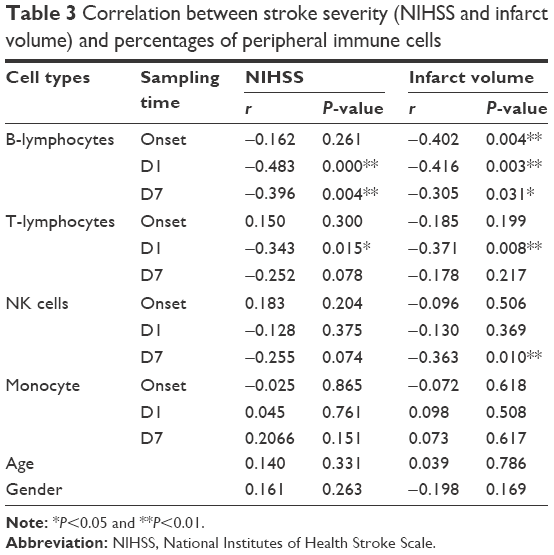 | Table 3 Correlation between stroke severity (NIHSS and infarct volume) and percentages of peripheral immune cells |
To further determine the relationship between the proportions of B-lymphocytes and the clinical outcomes at acute stage of stroke, we divided the patients into Bhigh and Blow groups, based on their B cell percentage at D1 after stroke vs the mean percentage of B-lymphocytes in the control group (Bctrl =2.979; Bhigh ≥ Bctrl, Blow < Bctrl). We found that the patients with higher B lymphocyte proportion had significantly smaller infarct volumes, M (Q25, Q75) Bhigh vs Blow: 19.811 (0.165, 29.130) vs 66.189 (2.675, 100.320), P=0.002, Mann–Whitney U test (Figure 2A and B), and lower NIHSS score, M (Q25, Q75) Bhigh vs Blow: 2.67 (1.00, 3.50) vs 8.14 (2.50, 12.00), P=0.001, Mann–Whitney U test (Figure 2C).
Similarly, we divided patients into Thigh and Tlow groups based on their T cell percentages at D1 after stroke compared to the mean percentage of T-lymphocytes in controls (Tctrl =15.664; Thigh ≥ Tctrl, Tlow < Tctrl). No significant difference in infarct volume, M (Q25, Q75) Thigh vs Tlow: 25.585 (0.750, 41.213) vs 54.925 (1.123, 91.378), P=0.177, Mann–Whitney U test, or NIHSS score, M (Q25, Q75) Thigh vs Tlow: 3.86 (1.50, 6.25) vs 6.61 (2.00, 11.75), P=0.373, Mann–Whitney U test, was observed between Thigh and Tlow groups (Figure 2D and E).
Correlation between the percentages of immune cell subsets and the long-term neurological recovery after stroke
The mRs is one of the widely used scales to evaluate the recoveries of neurological functions. Patients were divided into two groups based on mRs scores: mRs ≤1 group (well recovered) and mRs >1 group (poorly recovered).22 We first compared the dynamics of leukocyte subsets during the 7-day course after stroke between the mRs ≤1 group (well recovered) and mRs >1 group (poorly recovered; Figure 3). The percentages of B- and T-lymphocytes (onset, D1 and D7) in the mRs ≤1 group were higher than those in the mRs >1 group (for B cells: P=0.022; for T cells: P=0.085, two-way ANOVA; Figure 3A–C). The percentages of NK cells and monocytes showed no significant difference between the mRs ≤1 group and mRs >1 group (Figure 3D and E).
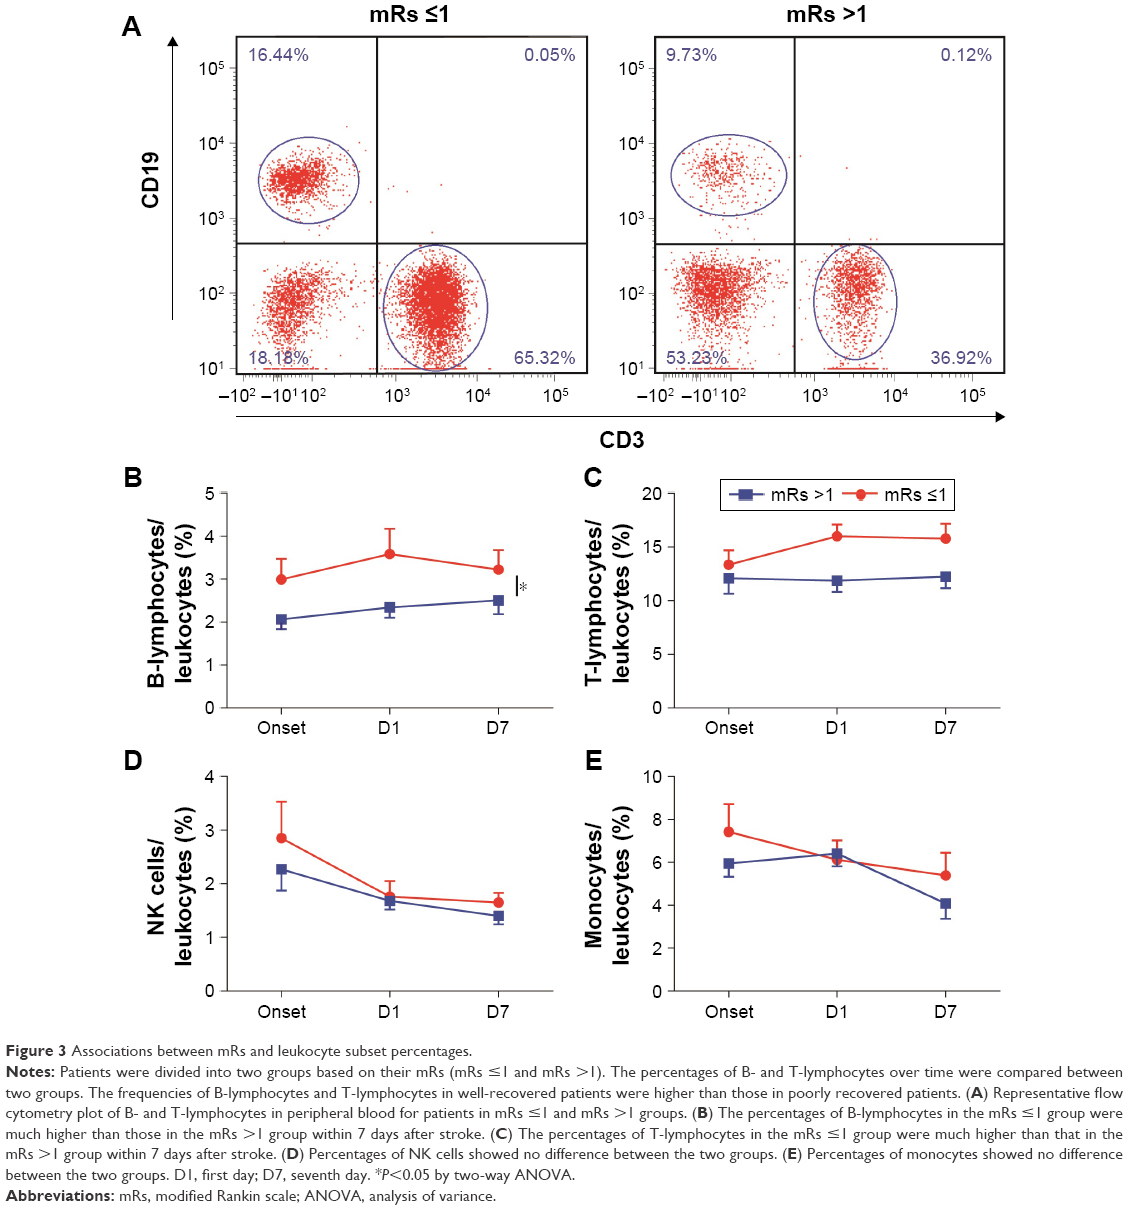 | Figure 3 Associations between mRs and leukocyte subset percentages. |
The mRs scores were then compared between Bhigh and Blow groups. Patients with a higher B lymphocyte proportion had significantly lower mRs scores, M (Q25, Q75) Bhigh vs Blow: 1.95 (1.00, 3.00) vs 2.93 (2.00, 5.00), P=0.039, Mann–Whitney U test (Figure 4A). Similarly, patients with a higher T-lymphocyte proportion also had significantly lower mRs scores, M (Q25, Q75) Thigh vs Tlow: 1.79 (1.00, 3.00) vs 2.81 (2.00, 4.00), P=0.049, Mann–Whitney U test (Figure 4B).
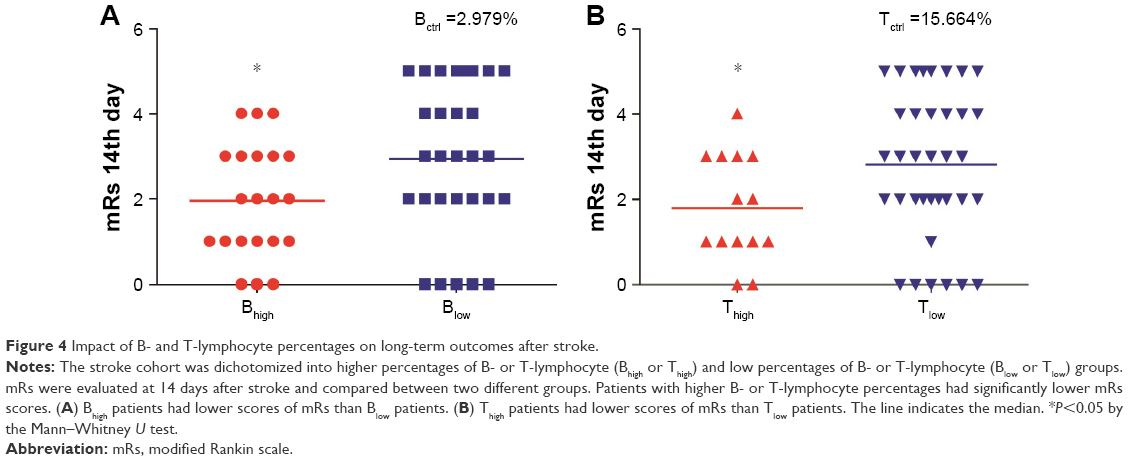 | Figure 4 Impact of B- and T-lymphocyte percentages on long-term outcomes after stroke. |
Logistic regression was then used to identify variables correlated with mRs scores. Covariates included in the analysis after selection were age, gender, onset B cell percentage, D1 B cell percentage, D1 T cell percentage, D7 T cell percentage, NIHSS, and infarct volume.28 The results demonstrated negative correlation between the mRs scores and the proportions of B-lymphocytes at the onset (95% CI 0.318–0.984, P=0.044; Table 4). More specifically, lower B cell percentage at the stroke onset was associated with poor recovery after stroke. The analysis also indicated that the NIHSS score is positively correlated to the mRs scores (95% CI 1.203–3.351; P=0.008; Table 4).
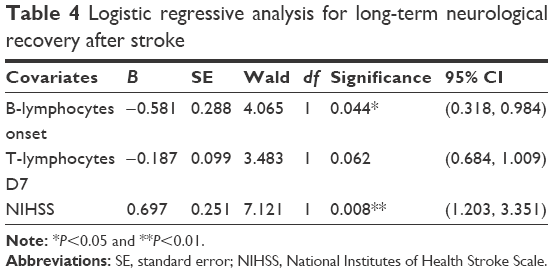 | Table 4 Logistic regressive analysis for long-term neurological recovery after stroke |
Discussion
Compelling evidence has suggested that immunosuppression, characterized by the reduction in number and functions of circulating lymphocytes, monocytes, and other immune cells, occurs after ischemic stroke.19,23 However, changes in the number of immune cells at very early stage after stroke remain controversial. Some evidence revealed a rapid decline in lymphocytes, monocytes, and NK cells in blood early after stroke,24 while other studies showed differential responses in different immune cell populations.19,30 In this study, we observed a rapid decrease in T-lymphocytes and NK cells soon after stroke and a relatively blunted response in the frequencies of B lymphocyte and monocytes. These results support the differences in immune cell responses toward acute ischemic challenge in the brain. Further correlation analysis demonstrated dissimilar relationships between the frequencies of immune cells and stroke outcomes.
Stroke severity, as indicated by the infarct volume and NIHSS, is a known precipitator of stroke-induced lymphocytopenia.19 We also found in this study a negative correlation between the infarct size or NIHSS and the percentage of lymphocytes. In particular, the frequency of T-lymphocytes on day 1 after stroke is negatively correlated with infarct volume and NIHSS. Interestingly, although the percentage of B-lymphocytes did not show significant difference as compared to healthy controls, a significantly negative correlation between B cell percentage and stroke outcomes was established. These results are in agreement with a previous study showing the lack of early reduction of B cell counts in stroke patients, but the infarct volume and B cell counts at baseline and day 4 after stroke were inversely correlated.19 Dichotomizing stroke cohort based on T or B lymphocyte percentage revealed that the patients with higher B cell percentage have significantly smaller infarct size. Therefore, the percentage of T- and B-lymphocytes might be an indicator for stroke severity at onset.
This study has also found that the lymphocyte subsets might be important for long-term stroke outcomes, because 1) the frequencies of B-lymphocytes and T-lymphocytes in well recovered (mRs ≤1) patients were significantly higher than those in poorly recovered (mRs >1) patients and 2) patients with higher B- or T-lymphocyte proportions had significantly lower mRs scores. Interestingly, although the percentage of B-lymphocytes at onset is similar to that in healthy controls, it is negatively correlated with long-term stroke outcomes as measured by mRs, suggesting that B cell percentage early after stroke might be used as an indicator for long-term stroke outcomes. These data suggest a potential value of B cell and T cell percentage to predict long-term recovery after stroke.
Consistent with a previous report,19 we observed prominent reduction in NK cells soon after stroke, which declined continuously for at least 7 days. Such decline in NK population has been shown to render mice vulnerable to bacterial infection and septicemia.3 In our study, the frequency of NK cells at D7 was negatively correlated with infarct volume and was not closely related to stroke outcomes. This result suggests that despite its potential function in bacterial defense, the number of NK cell population might not be a good indicator for stroke severity or functional deficits. Interestingly, a recent preclinical study suggested that brain ischemia could result in impaired NK cell-mediated immune defense through distinct mechanisms in the brain vs in the periphery and could therefore be differentially regulated to limit poststroke inflammation.6 In this case, the different effects of central and peripheral NK cells on stroke outcomes should be explored in future studies.
The poststroke changes in monocytes remain elusive due to conflicting results. Some studies reported reduction and deactivation of monocytes in stroke patients,24 while others observed unchanged or even elevated monocyte counts after stroke.19,23 The differences in the approach and marker used for monocyte counts in these studies could partially explain the diversity in the monocyte quantification. In line with a previous report,19 we showed here that the frequency of circulating monocyte had no correlation with stroke outcomes. However, many recent preclinical and clinical studies have reported the existence of different monocyte subsets and their distinct roles in stroke pathology.25,26 Further studies are warranted to elucidate phenotypic changes in monocytes after stroke.
In this study, we cannot confirm if there are causal relationships between the percentages of T or B cells and stroke outcomes. Nevertheless, it is known that the severity of stroke can influence the number of immune cells in the circulation, with larger infarct evoking a greater drop in immune cell numbers.19 Animal studies suggest that the immunosuppression characterized by lymphopenia may lead to poststroke infection and deterioration of stroke outcomes.1 It is likely that there are bidirectional interactions between the amount of circulating lymphocytes and the severity of stroke. Another limitation of this study is that the variable selection by a forward/backward approach can introduce bias.27 Combining stepwise selection procedures with other selection approach such as a prespecified change-in-estimate criterion has been tested and may offer better solutions in certain situations.28 These approaches take into consideration biological relevance and should be used for large-scale studies in the future.
In conclusion, the present study suggests that changes in circulating B- and T-lymphocytes are related to the severity of stroke and long-term recovery. The current study focuses on the correlation between immune cell percentages and the neurological scores at early phase of recovery, with an attempt to identify biomarkers to predict stroke recovery. Larger scale and long-term clinical studies confirming the correlation between the peripheral immune cell responses and the stroke outcomes are warranted and may possibly identify novel biomarkers to predict stroke patients’ prognosis. Furthermore, understanding the contributions of immune cells to stroke recovery may provide novel approaches or targets for stroke treatment.29
Conclusion
Changes in circulating immune cells, especially in B- and T-lymphocytes, are related to the severity of stroke at early stage. The reduction in B lymphocytes might be used as an indicator for neurological deficits at the delayed phase of stroke.
Acknowledgments
The authors thank Dr Fanhua Meng and Dr Peiying Li for their helpful discussions on data analyses. This work was supported by the Chinese Natural Science Foundation (NCSF) grants (81571152 to XH, 81671161 to ZL, 81501141 to XG), Beijing Committee of Science and Technology Program (Z151100003915134 to HD), and Tongzhou Committee of Science and Technology Program (KJ2016CX037-19 to YW).
Disclosure
The authors report no conflicts of interest in this work.
References
Gill D, Veltkamp R. Dynamics of T cell responses after stroke. Curr Opin Pharmacol. 2016;26:26–32. | ||
Stubbe T, Ebner F, Richter D, et al. Regulatory T cells accumulate and proliferate in the ischemic hemisphere for up to 30 days after MCAO. J Cereb Blood Flow Metab. 2013;33(1):37–47. | ||
Prass K, Meisel C, Hoflich C, et al. Stroke-induced immunodeficiency promotes spontaneous bacterial infections and is mediated by sympathetic activation reversal by poststroke T helper cell type 1-like immunostimulation. J Exp Med. 2003;198(5):725–736. | ||
Schulze J, Zierath D, Tanzi P, et al. Severe stroke induces long-lasting alterations of high-mobility group box 1. Stroke. 2013;44(1):246–248. | ||
Peterfalvi A, Molnar T, Banati M, et al. Impaired function of innate T lymphocytes and NK cells in the acute phase of ischemic stroke. Cerebrovasc Dis. 2009;28(5):490–498. | ||
Liu Q, Jin WN, Liu Y, et al. Brain ischemia suppresses immunity in the periphery and brain via different neurogenic innervations. Immunity. 2017;46(3):474–487. | ||
Barra de la Tremblaye P, Plamondon H. Alterations in the corticotropin-releasing hormone (CRH) neurocircuitry: insights into post stroke functional impairments. Front Neuroendocrinol. 2016;42:53–75. | ||
Liesz A, Dalpke A, Mracsko E, et al. DAMP signaling is a key pathway inducing immune modulation after brain injury. J Neurosci. 2015;35(2):583–598. | ||
Case DC, Hansen JA, Corrales E, et al. Comparison of multiple in vivo and in vitro parameters in untreated patients with Hodgkin’s disease. Cancer. 1976;38(4):1807–1815. | ||
Calder PC, Newsholme EA. Polyunsaturated fatty acids suppress human peripheral blood lymphocyte proliferation and interleukin-2 production. Clin Sci. 1992;82(6):695–700. | ||
Urra X, Laredo C, Zhao Y, et al. Neuroanatomical correlates of stroke-associated infection and stroke-induced immunodepression. Brain Behav Immun. 2017;60:142–150. | ||
Santos Samary C, Pelosi P, Leme Silva P, Rieken Macedo Rocco P. Immunomodulation after ischemic stroke: potential mechanisms and implications for therapy. Crit Care. 2016;20(1):391. | ||
Li M, Lin YP, Chen JL, Li H, Jiang RC, Zhang JN. Role of regulatory T cell in clinical outcome of traumatic brain injury. Chin Med J. 2015;128(8):1072–1078. | ||
Laginha I, Kopp MA, Druschel C, et al. Natural killer (NK) cell functionality after human spinal cord injury (SCI): protocol of a prospective, longitudinal study. BMC Neurol. 2016;16:170. | ||
Zhang Z, Mu J, Li J, Li W, Song J. Aberrant apolipoprotein E expression and cognitive dysfunction in patients with poststroke depression. Genet Test Mol Biomarkers. 2013;17(1):47–51. | ||
Lyden P, Brott T, Tilley B, et al. Improved reliability of the NIH Stroke Scale using video training. NINDS TPA Stroke Study Group. Stroke. 1994;25(11):2220–2226. | ||
Kothari RU, Brott T, Broderick JP, et al. The ABCs of measuring intracerebral hemorrhage volumes. Stroke. 1996;27(8):1304–1305. | ||
Krousel-Wood MA, Chambers RB, Muntner P. Clinicians’ guide to statistics for medical practice and research: part I. Ochsner J. 2006;6(2):68–83. | ||
Hug A, Dalpke A, Wieczorek N, et al. Infarct volume is a major determiner of post-stroke immune cell function and susceptibility to infection. Stroke. 2009;40(10):3226–3232. | ||
Tziomalos K, Athyros VG, Karagiannis A, Mikhailidis DP. Dyslipidemia as a risk factor for ischemic stroke. Curr Top Med Chem. 2009;9(14):1291–1297. | ||
Yan SK, Ke YN, Li SS, et al. [Usability of the laboratory report and knowledge of lipid-lowering in out-patients from dyslipidemia-related departments]. Beijing Da Xue Xue Bao. 2010;42(6):675–680. Chinese. | ||
Asuzu D, Nystrom K, Schindler J, et al. TURN score predicts 90-day outcome in acute ischemic stroke patients after IV thrombolysis. Neurocrit Care. 2015;23(2):172–178. | ||
Vogelgesang A, Grunwald U, Langner S, et al. Analysis of lymphocyte subsets in patients with stroke and their influence on infection after stroke. Stroke. 2008;39(1):237–241. | ||
Haeusler KG, Schmidt WU, Fohring F, et al. Cellular immunodepression preceding infectious complications after acute ischemic stroke in humans. Cerebrovasc Dis. 2008;25(1–2):50–58. | ||
Khan MA, Schultz S, Othman A, et al. Hyperglycemia in stroke impairs polarization of monocytes/macrophages to a protective noninflammatory cell type. J Neurosci. 2016;36(36):9313–9325. | ||
Urra X, Villamor N, Amaro S, et al. Monocyte subtypes predict clinical course and prognosis in human stroke. J Cereb Blood Flow Metab. 2009;29(5):994–1002. | ||
Morozova O, Levina O, Uuskula A, Heimer R. Comparison of subset selection methods in linear regression in the context of health-related quality of life and substance abuse in Russia. BMC Med Res Methodol. 2015;15:71. | ||
Walter S, Tiemeier H. Variable selection: current practice in epidemiological studies. Eur J Epidemiol. 2009;24(12):733–736. | ||
Veltkamp R, Gill D. Clinical trials of immunomodulation in ischemic stroke. Neurotherapeutics. 2016;13(4):791–800. | ||
Chamorro A, Amaro S, Vargas M, et al. Interleukin 10, monocytes and increased risk of early infection in ischaemic stroke. J Neurol Neurosurg Psychiatry. 2006;77(11):1279–1281. |
 © 2017 The Author(s). This work is published and licensed by Dove Medical Press Limited. The
full terms of this license are available at https://www.dovepress.com/terms
and incorporate the Creative Commons Attribution
- Non Commercial (unported, 3.0) License.
By accessing the work you hereby accept the Terms. Non-commercial uses of the work are permitted
without any further permission from Dove Medical Press Limited, provided the work is properly
attributed. For permission for commercial use of this work, please see paragraphs 4.2 and 5 of our Terms.
© 2017 The Author(s). This work is published and licensed by Dove Medical Press Limited. The
full terms of this license are available at https://www.dovepress.com/terms
and incorporate the Creative Commons Attribution
- Non Commercial (unported, 3.0) License.
By accessing the work you hereby accept the Terms. Non-commercial uses of the work are permitted
without any further permission from Dove Medical Press Limited, provided the work is properly
attributed. For permission for commercial use of this work, please see paragraphs 4.2 and 5 of our Terms.